

Market Outlook #55
October 13, 2025
-
12
min read


This blog references an opinion and is for entertainment and informational purposes only. It is not intended to be investment advice. Seek a duly licensed professional for investment advice.
In this 55th Market Outlook here at Ostium Research, we'll be taking a look at the week ahead in markets, focusing specifically on price-action, positioning and event risk for Bitcoin, Ethereum, DXY, SPX and altcoins via OTHERS.
Firstly, let's take a look at the calendar for another speech-heavy week ahead, though with some survey data throughout the week:
TUESDAY: VARIOUS FED SPEECHES
TUESDAY: FED CHAIR POWELL SPEECH
TUESDAY: BOE GOVERNOR BAILEY SPEECH
WEDNESDAY: NY EMPIRE STATE MANUFACTURING INDEX (OCT): (CONSENSUS -7% VS PREVIOUS -8.7)
WEDNESDAY: VARIOUS FED SPEECHES
THURSDAY: PHILADELPHIA FED MANUFACTURING SURVEY (OCT): (CONSENSUS 9.1 VS PREVIOUS 23.2)
THURSDAY: VARIOUS FED SPEECHES
THURSDAY: ECB PRESIDENT LAGARDE SPEECH
FRIDAY: US INDUSTRIAL PRODUCTION (MOM) (SEP): (CONSENSUS 0.1% VS PREVIOUS 0.1%)
Now, let's dig into asset-specific price-action for the week ahead, looking firstly at Bitcoin:
Price: $115,390
Weekly:
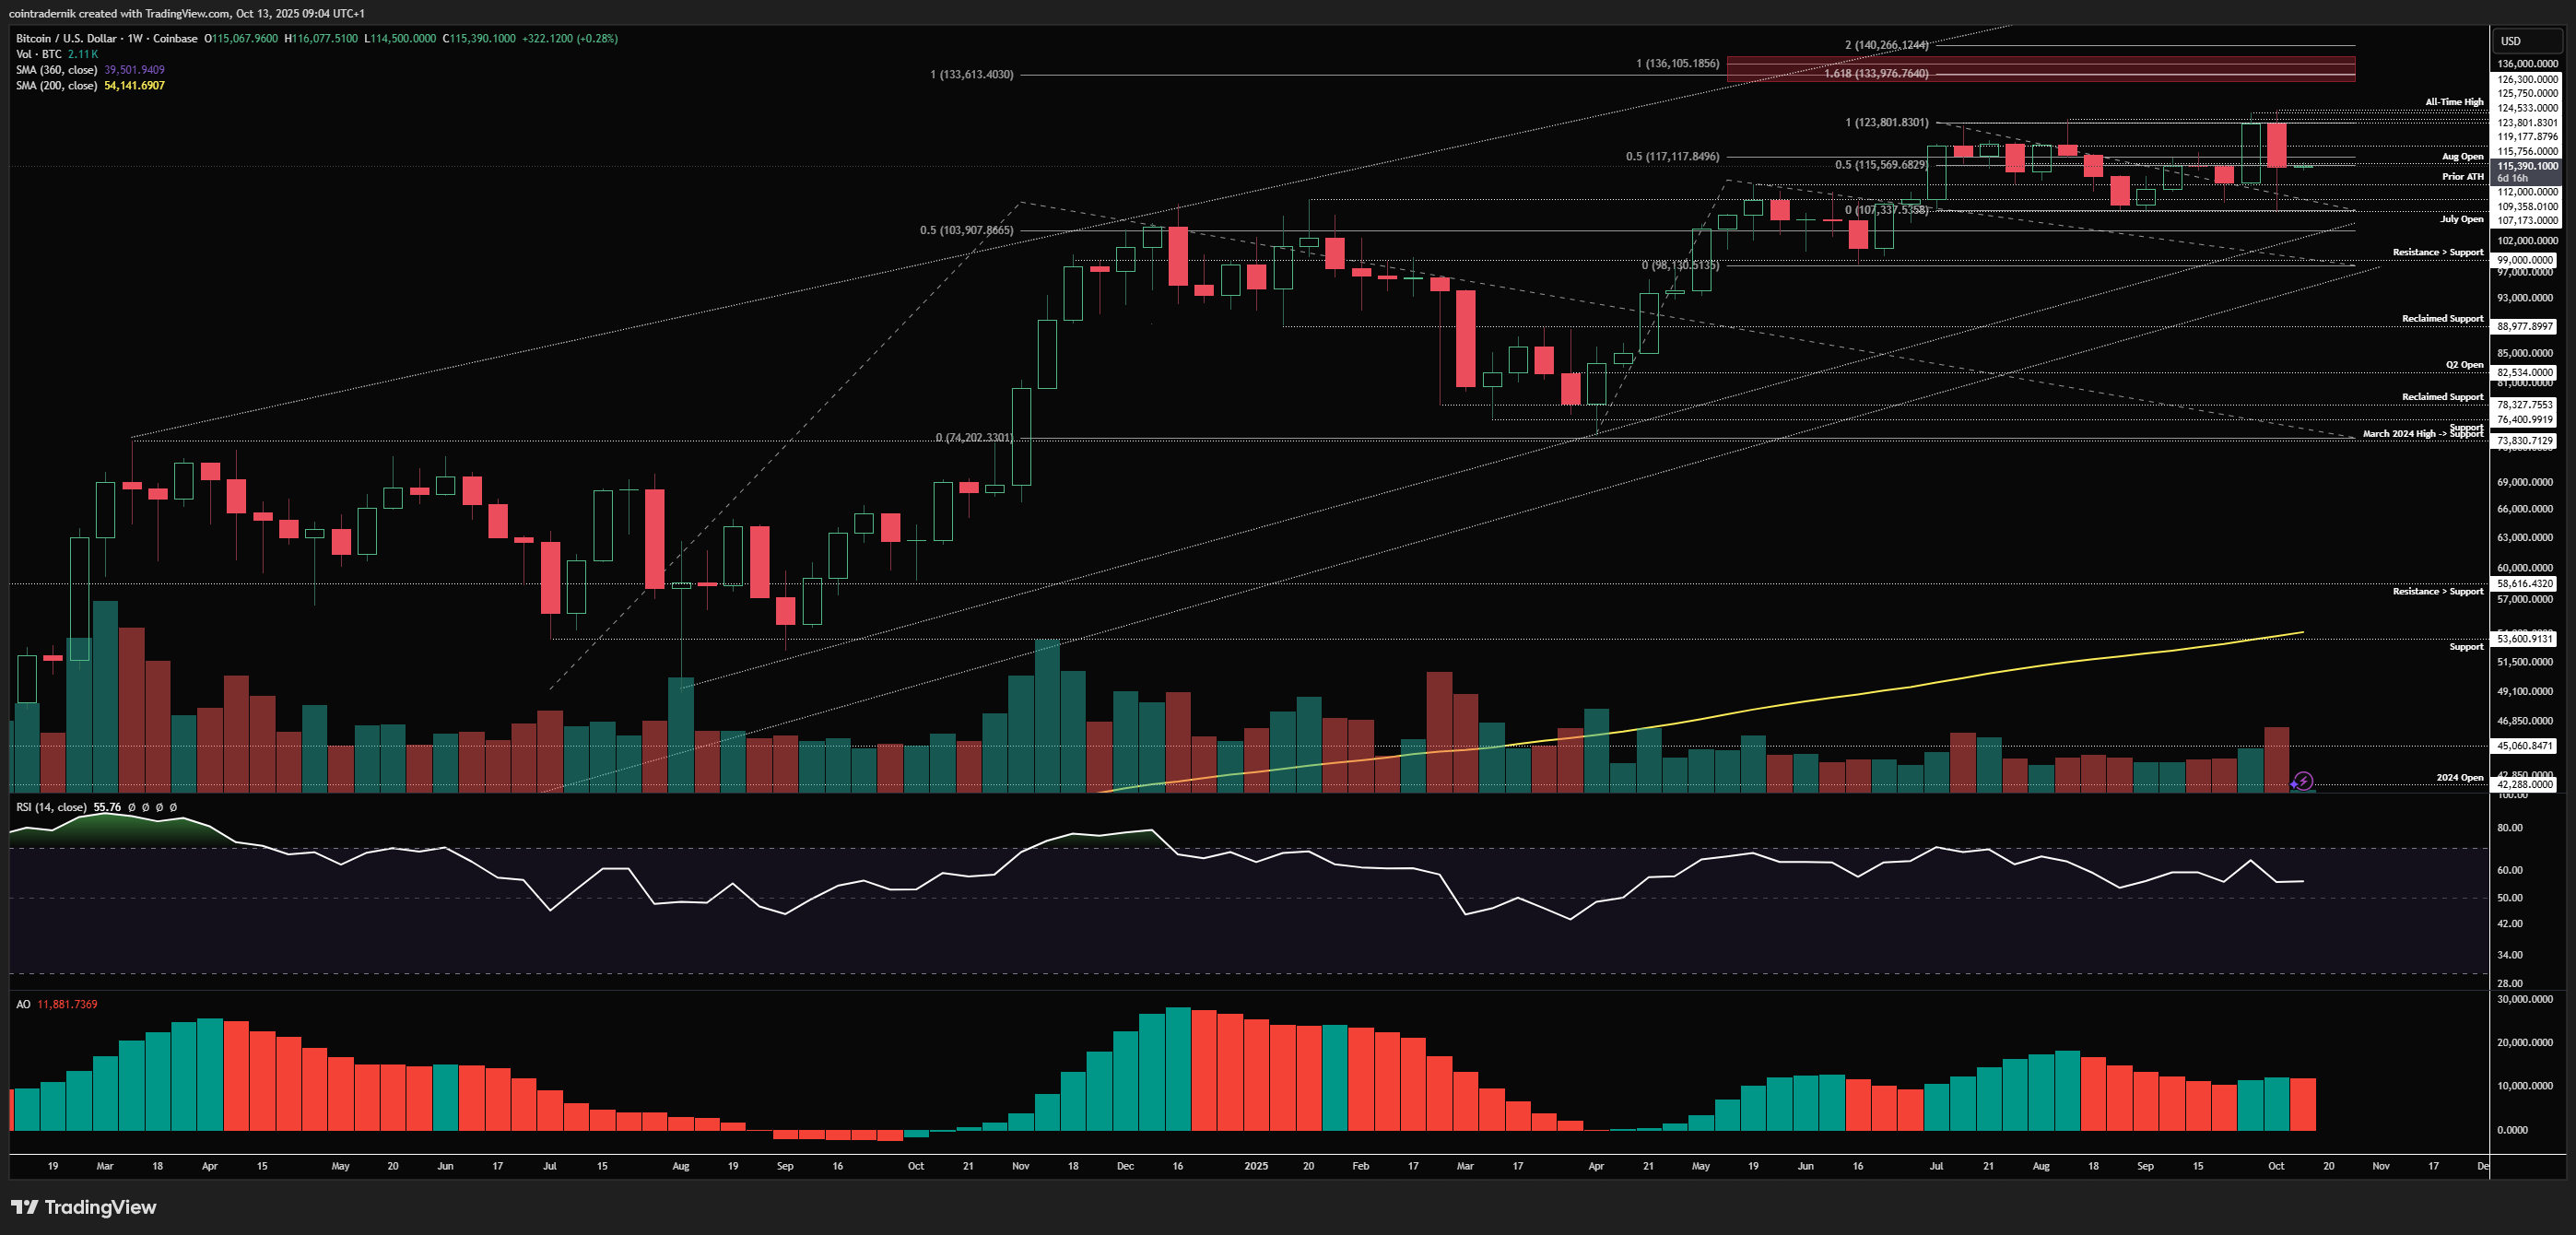
If we begin by looking at the weekly chart for BTC/USD, we can see that despite the carnage in the broader market late last week, Bitcoin held up extremely well. I think back to last week's Outlook where I wrote something akin to 'if we get a market-wide volatility event that sends price below last week's open towards the July open, that would be a bid and I do not expect that wick to be durable'... Well, whilst I obviously did not expect the degree of utter obliteration in alts particularly, that chaos did lead to a sweep of the prior weekly open on BTC, with price wicking below all those local lows into $107k and bouncing hard to close back at $115k. I missed that wick given that I was afk and therefore do not have a naked long BTC position (I am still long BTC / short Gold at an average of 29.7, which is a tad underwater here, for transparency...). But, given everything that has transpired and my broader view shared in early September that we would likely see some sort of weakness into early-mid Oct that proved to be the bear trap around a confluence of narratives (4-year cycle, altcoin ETFS, buyback blackout, VIX/VIX3M above 1 etc.), I think it is safe to say that after the largest liquidation event in crypto history we have had that 'great reset', with prices across the board very likely to be much higher into year-end. These sorts of events mark turning points: either you are now cemented in your belief that after a 3-year bull run the bear market has begun and we remain true to what many perceive as the 4-year cycle; or you are cemented in your belief that the leverage washout gives us the runway for higher for longer prices into Q1 next year, in line with the many tailwinds that exist. I am obviously of the latter belief and have pounded the table on that view for a long time now.
Looking specifically at price-action, the weekly chart looks absolutely fine for BTC. Momentum and structure are still bullish on the higher timeframes, no major support has been lost and we have rinsed a huge amount of positioning in the most painful fashion; if anything, Bitcoin looks more bullish today than it did at the beginning of last week. A weekly close below last week's low is now the obvious invalidation for this view: close through $107k despite all of the above and we have a more pressing concern, where we undoubtedly then trade into $99k. Whilst we trade above $107k, I think the next move is back to the highs, with $112k likely to act as local support and, in my view, Bitcoin still trading into that confluence of overhead resistance at $133k by month-end.
Daily:
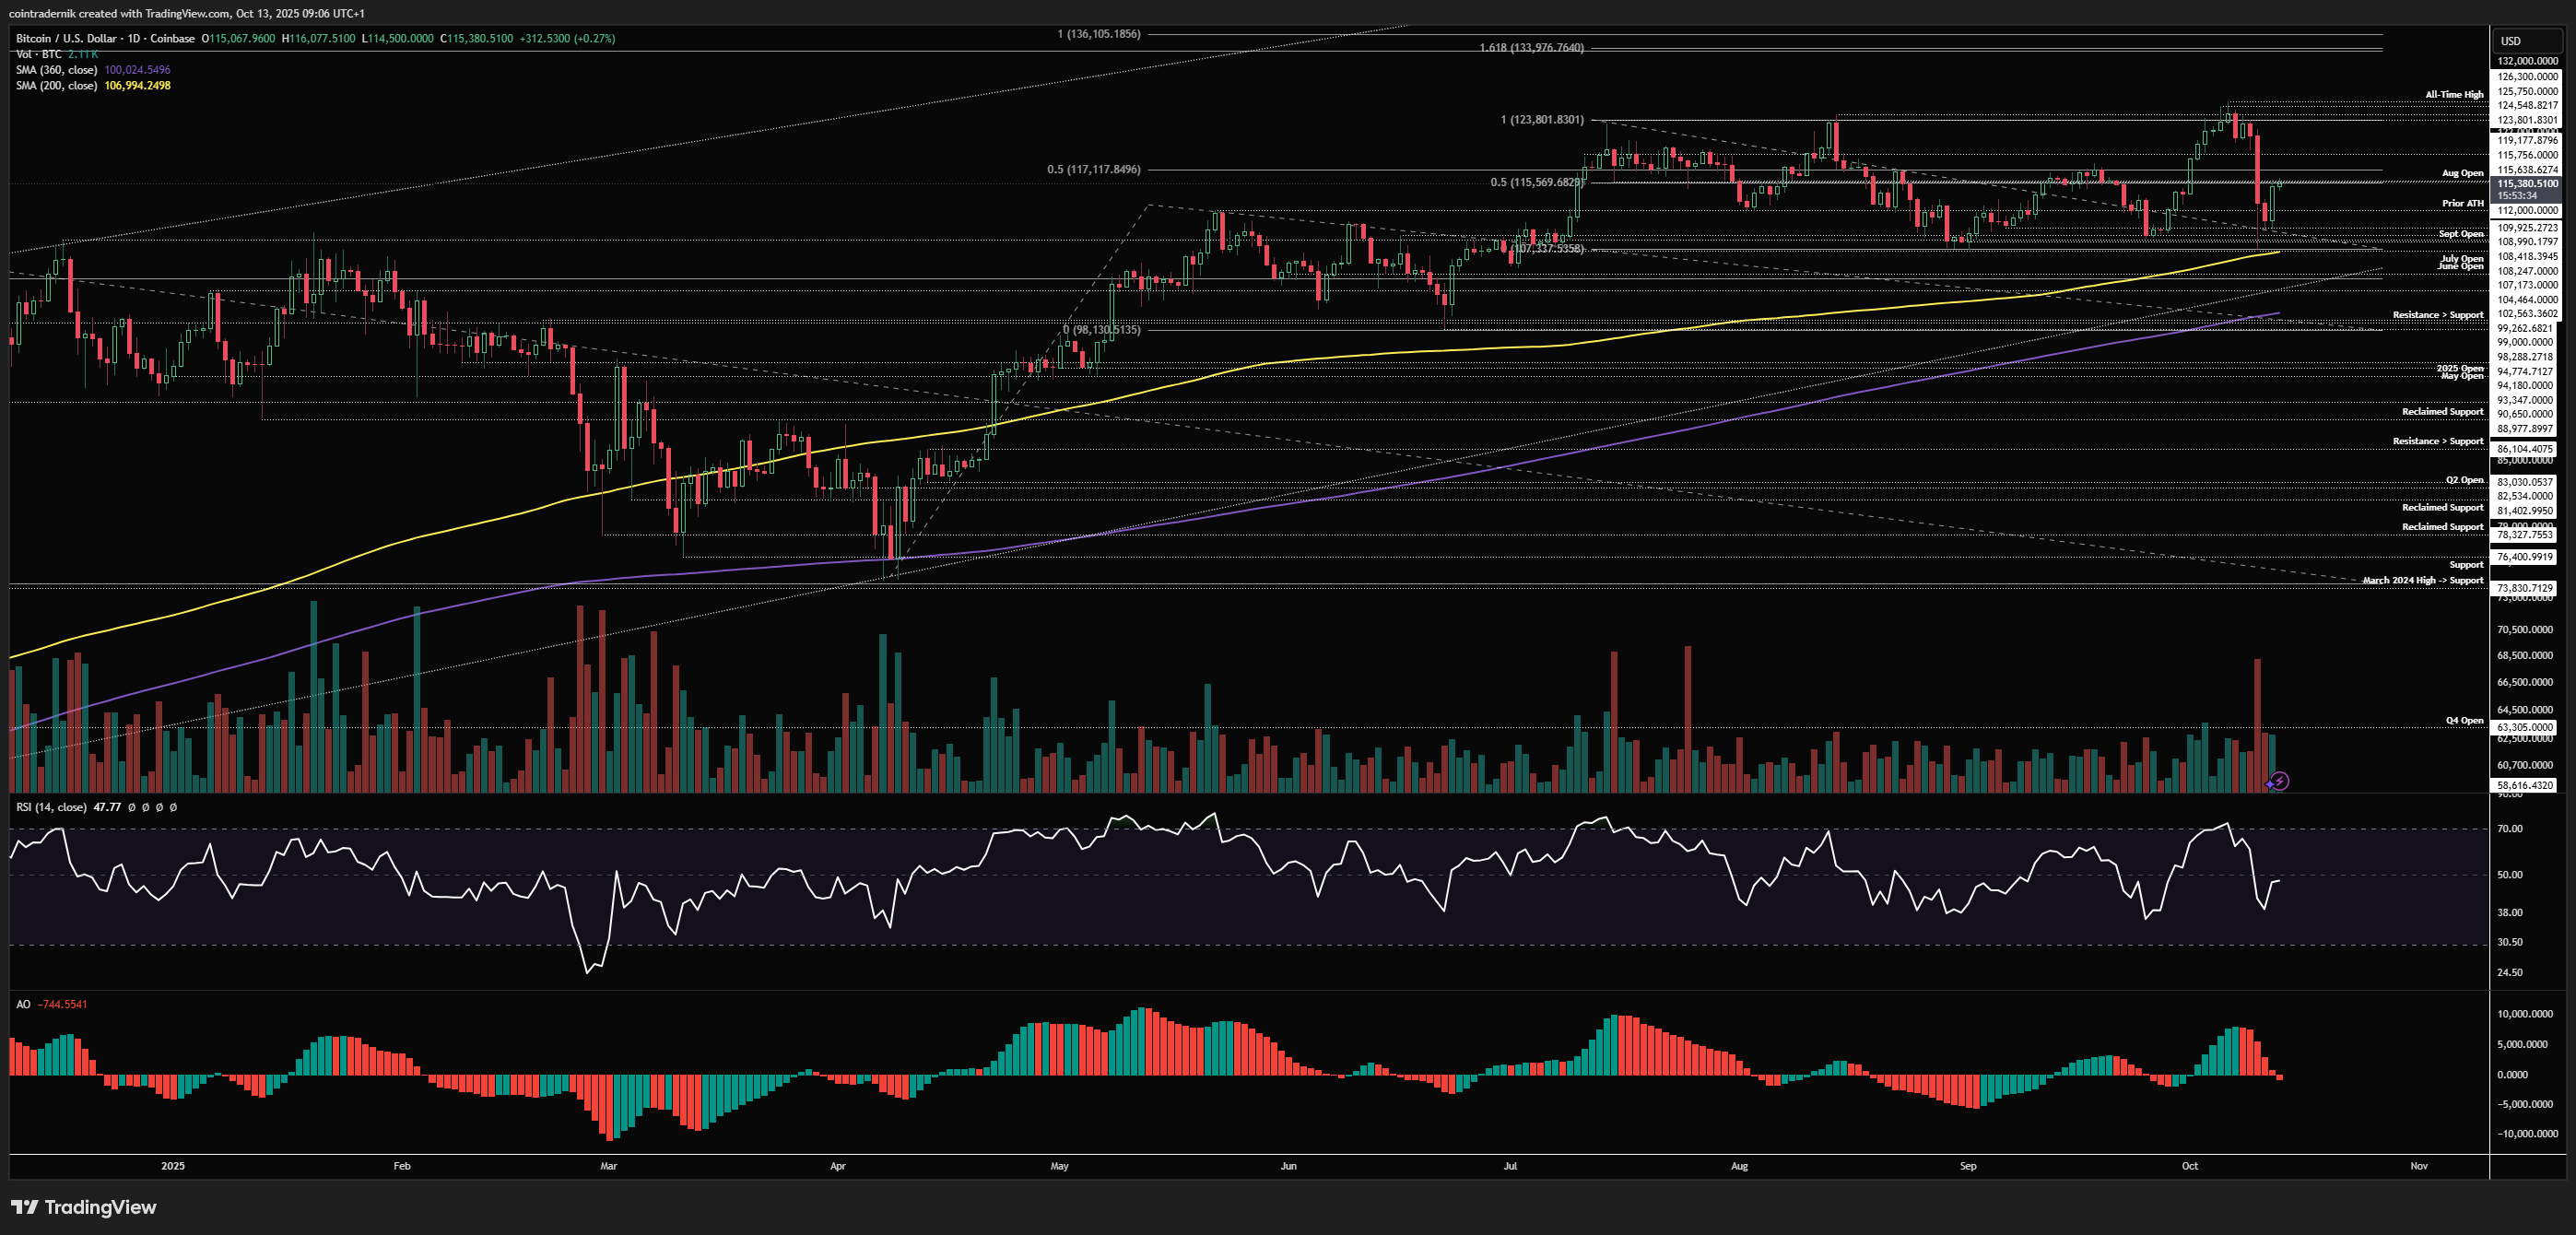
Looking at the daily, we can see that price swept the highs twice into $126.3k before rejecting, breaking back below $123.8k, retesting it as resistance and collapsing. It was kind of perfect price-action. Momentum on the daily has now reset and price wicked right into the 200dMA that I said would likely mark the absolute low on any capitulation into early October. Now, I can't toot my own horn too loudly on this because I did then fully expect that MA to be front-run once we traded higher off $108k, but I do still think anyone expecting sub-$100k will remain sidelined for a long time - if you didn't get it on the largest liquidation event in crypto history, I don't think you're getting it until we enter a bear market, which we're not in, in my view. A daily close below the 200dMA, flipping it into resistance = invalidation of this view and high probability of trading into the 360dMA at $100k, which is my personal line in the sand for a full-blown flip into bear market territory, given we have failed to close below it on all of the corrections this entire bull run (and it is confluent with that $99k swing-low that preceded the run to $123.8k highs). I think it is extremely unlikely we fill in the entire wick down to $107k, rather expecting $112k prior highs to act as support and form a higher-low, from which any acceptance back above $116kish looks like the rotation back to the top of the range at $123.8k, with expectations of price discovery beyond that. I do think we run higher much sooner than most probably expect after such a brutal liquidation event - gun to my head I think we trade $125k by early next week and $133k by month-end.
Looking at potential setups for the week, it's obviously quite a difficult one after such a major liquidation event but I'd prefer to see downside early this week (and ideally another move lower in equities with VIX/VIX3M printing some sort of divergence). I don't know how likely that is with Trump's tendency to TACO. Nonetheless, any weakness into mid-week likely forms a higher-low between $110k-$112k, which is a range I would ladder bids between and invalidation would be a daily close below $107k with a hard stop at $105k, looking for at least $121k but likely much much higher:
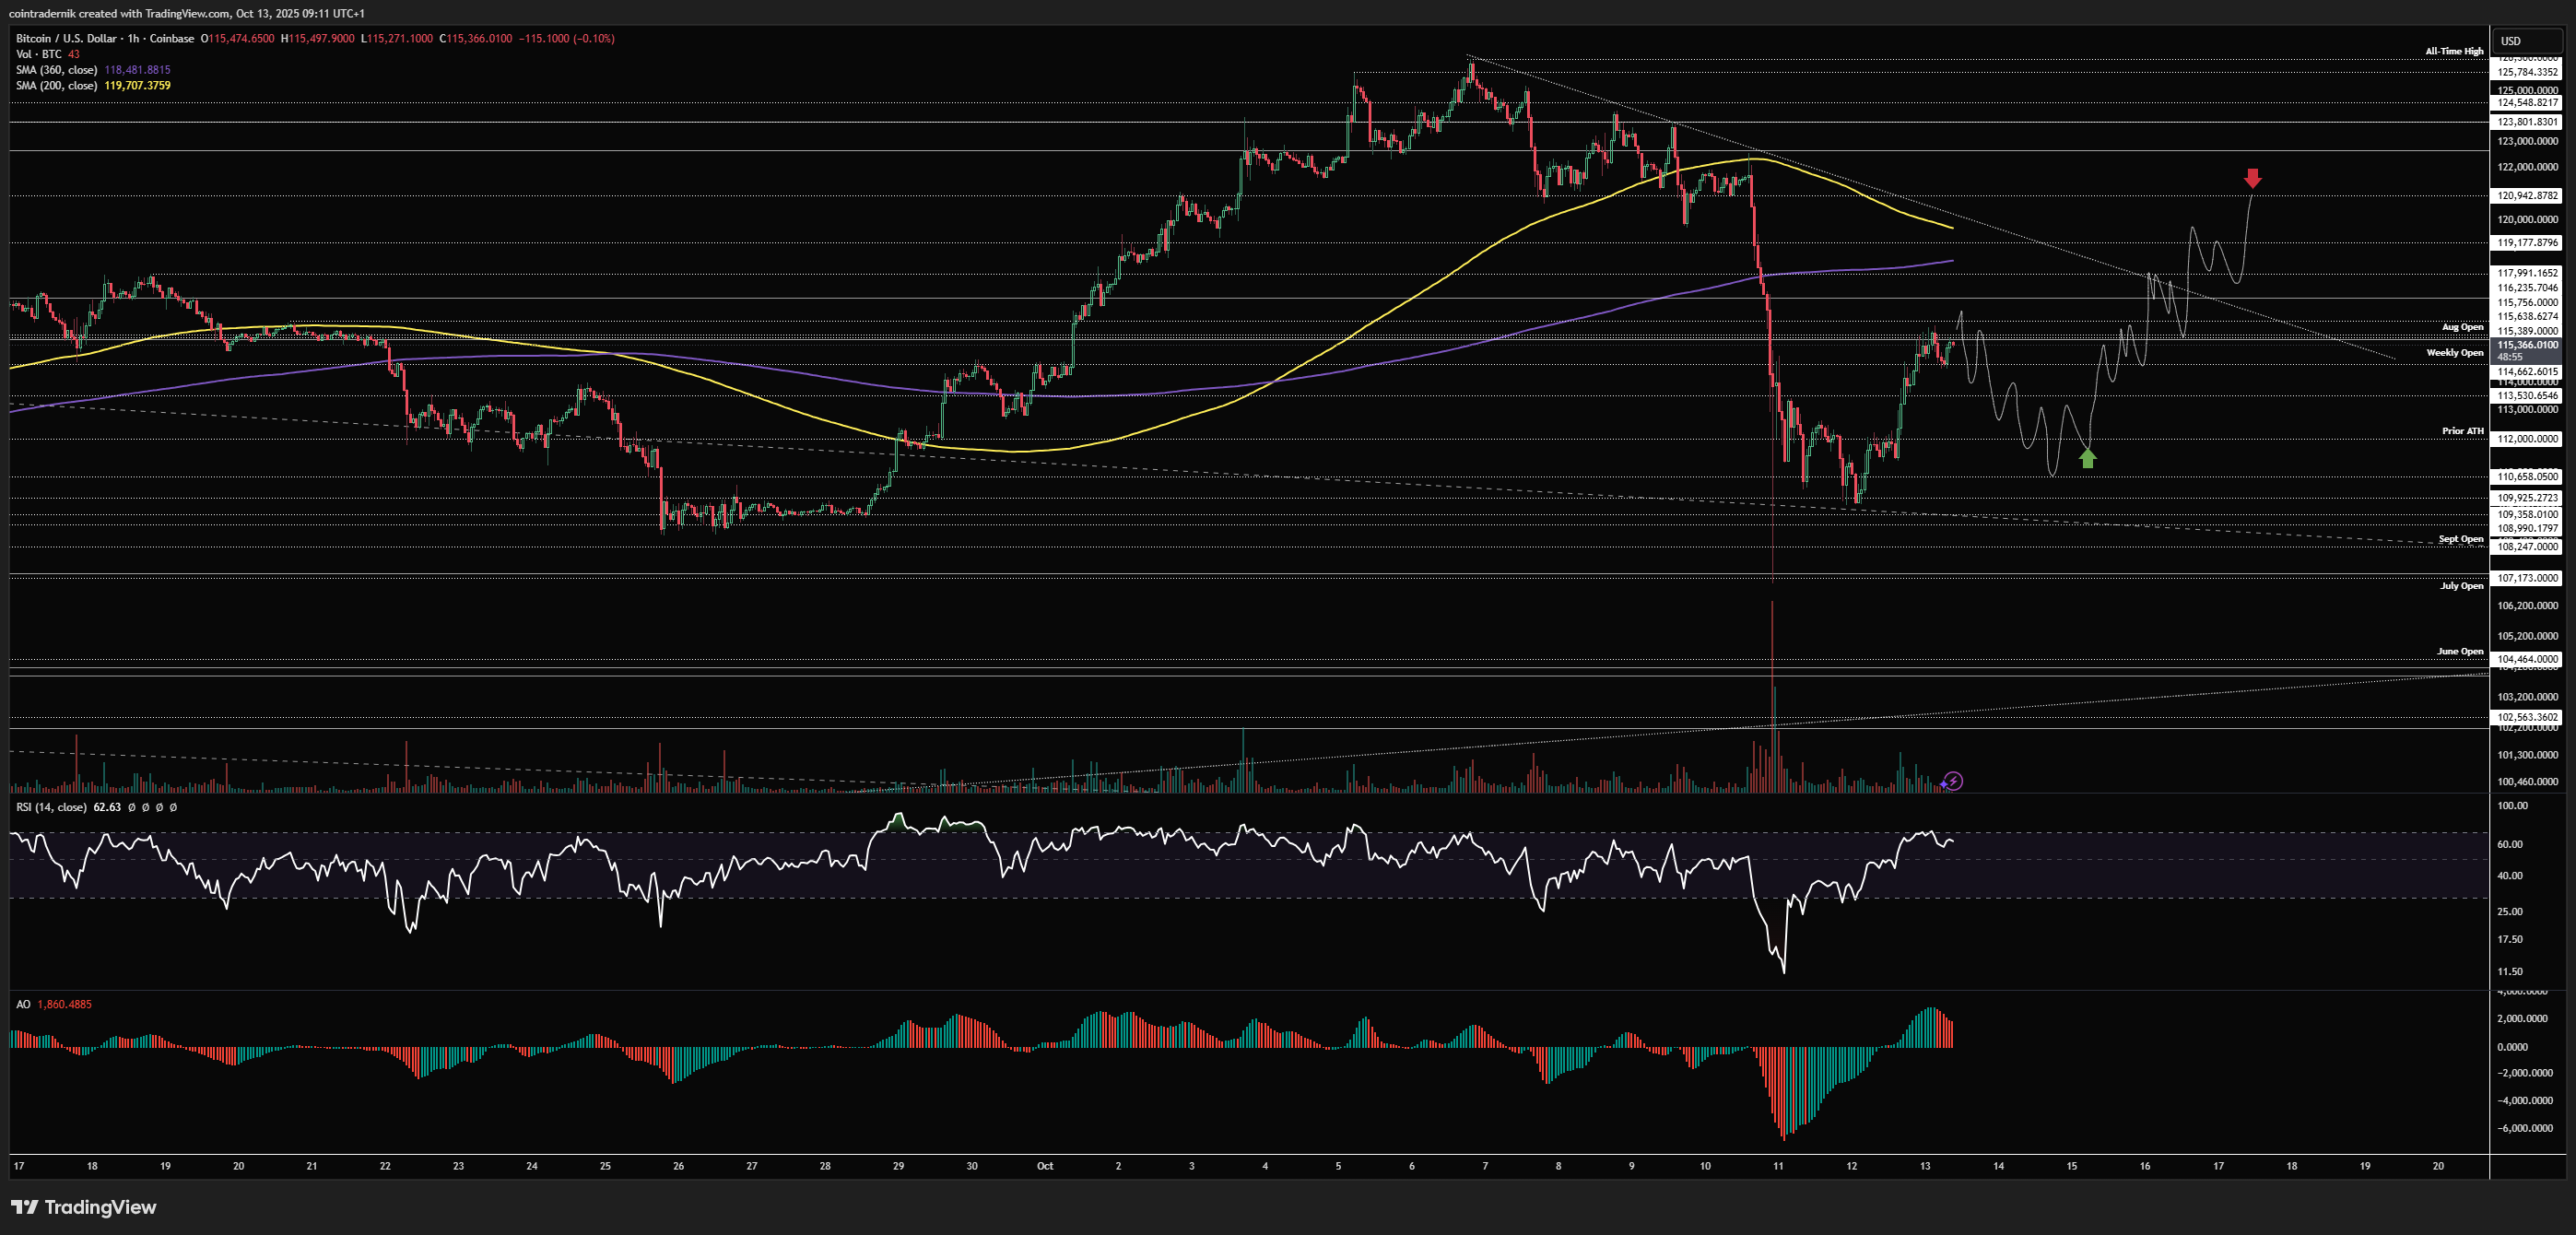
On the short side, you would want to see price just grind higher early this week, peek above the trendline and confluence of MAs into $121k and then reject and close back below $118k, looking to fade that and add on a move below the weekly open for a retest of the $110k-$112k area (with possibility of wicking below that weekend low at $109.4k). Obviously, you'd only want to take this if we don't move lower first this week to form a higher-low:

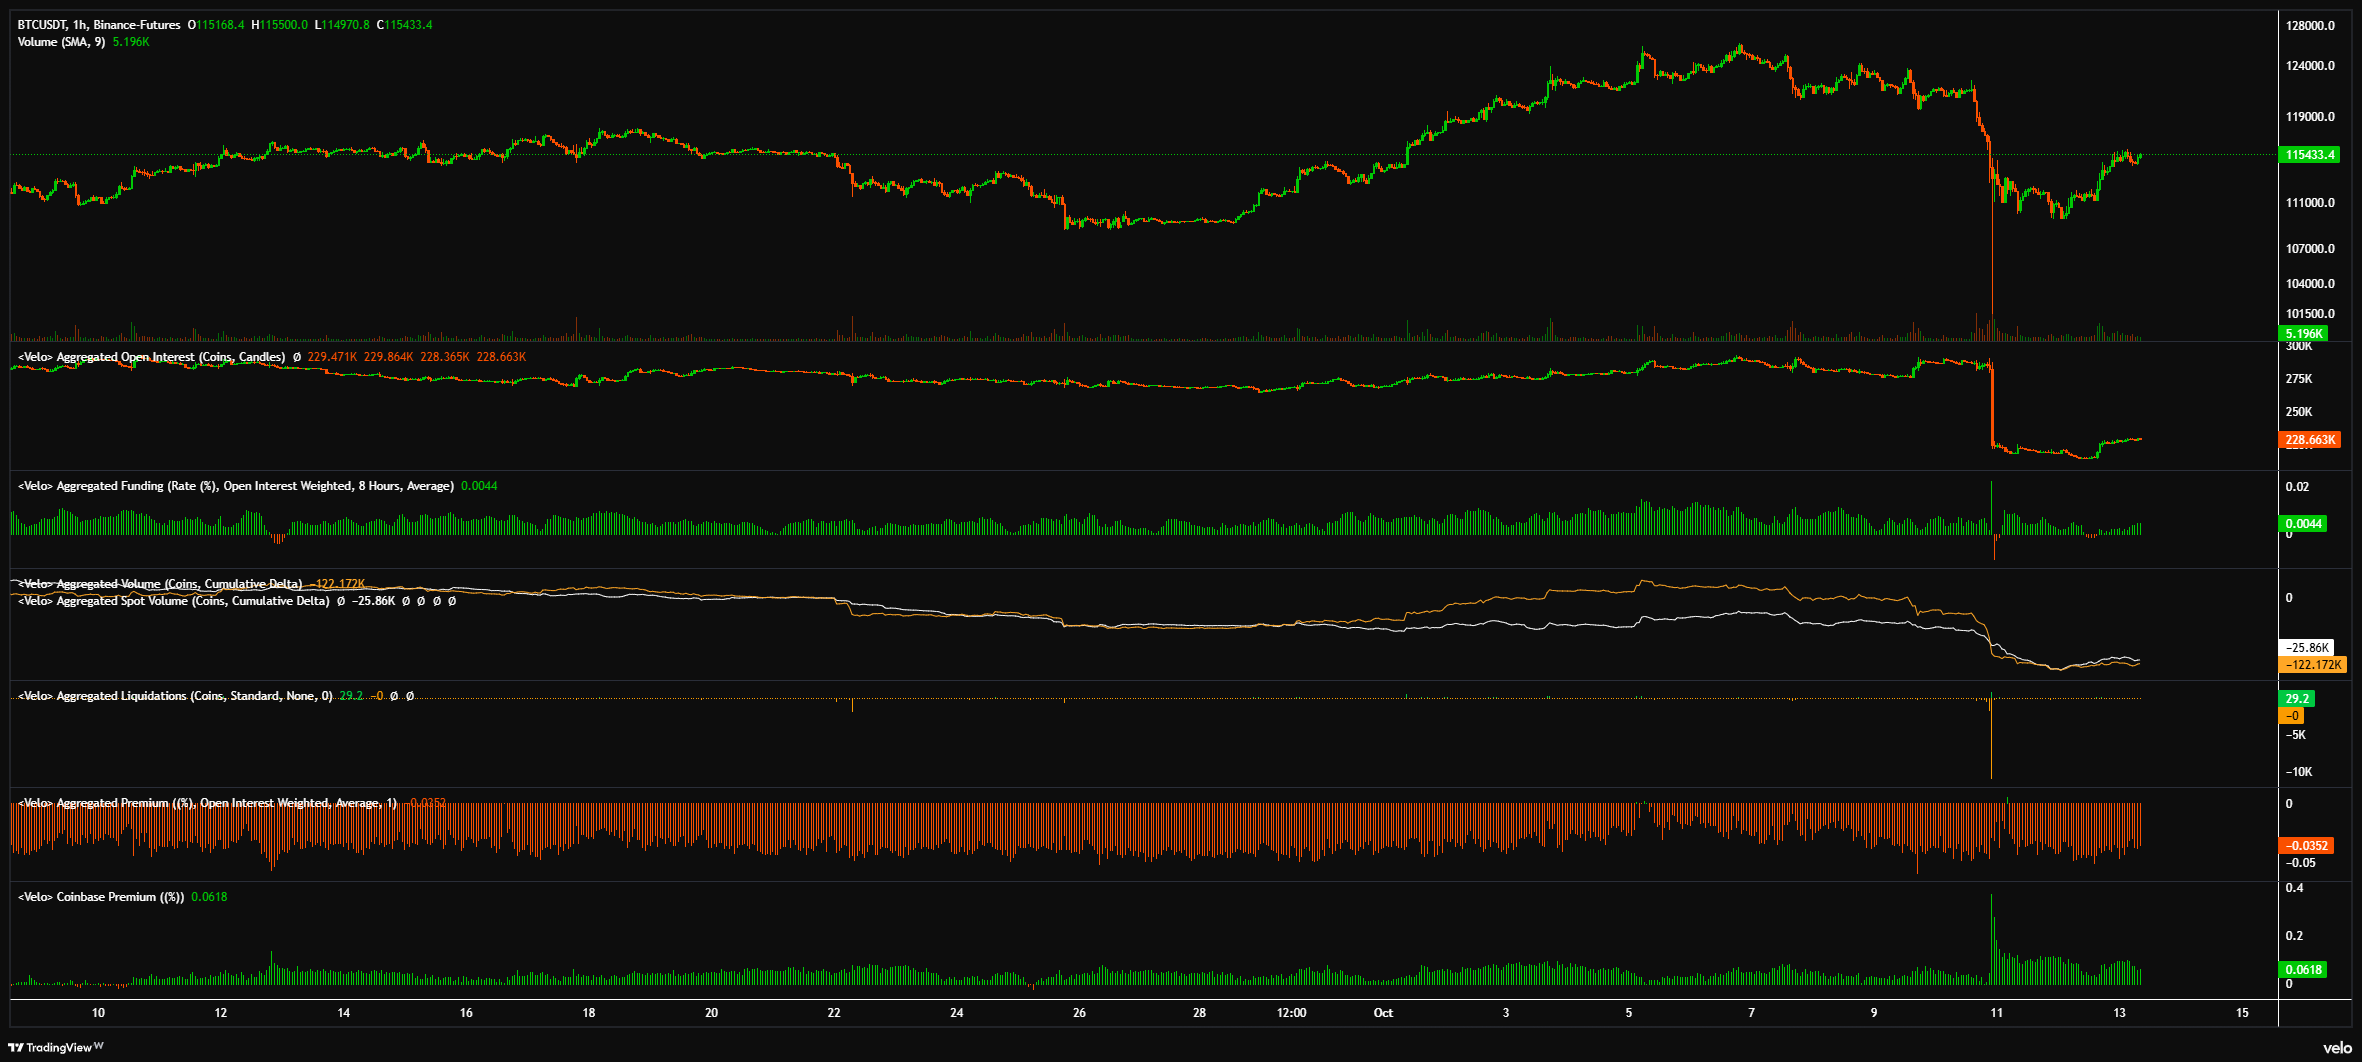
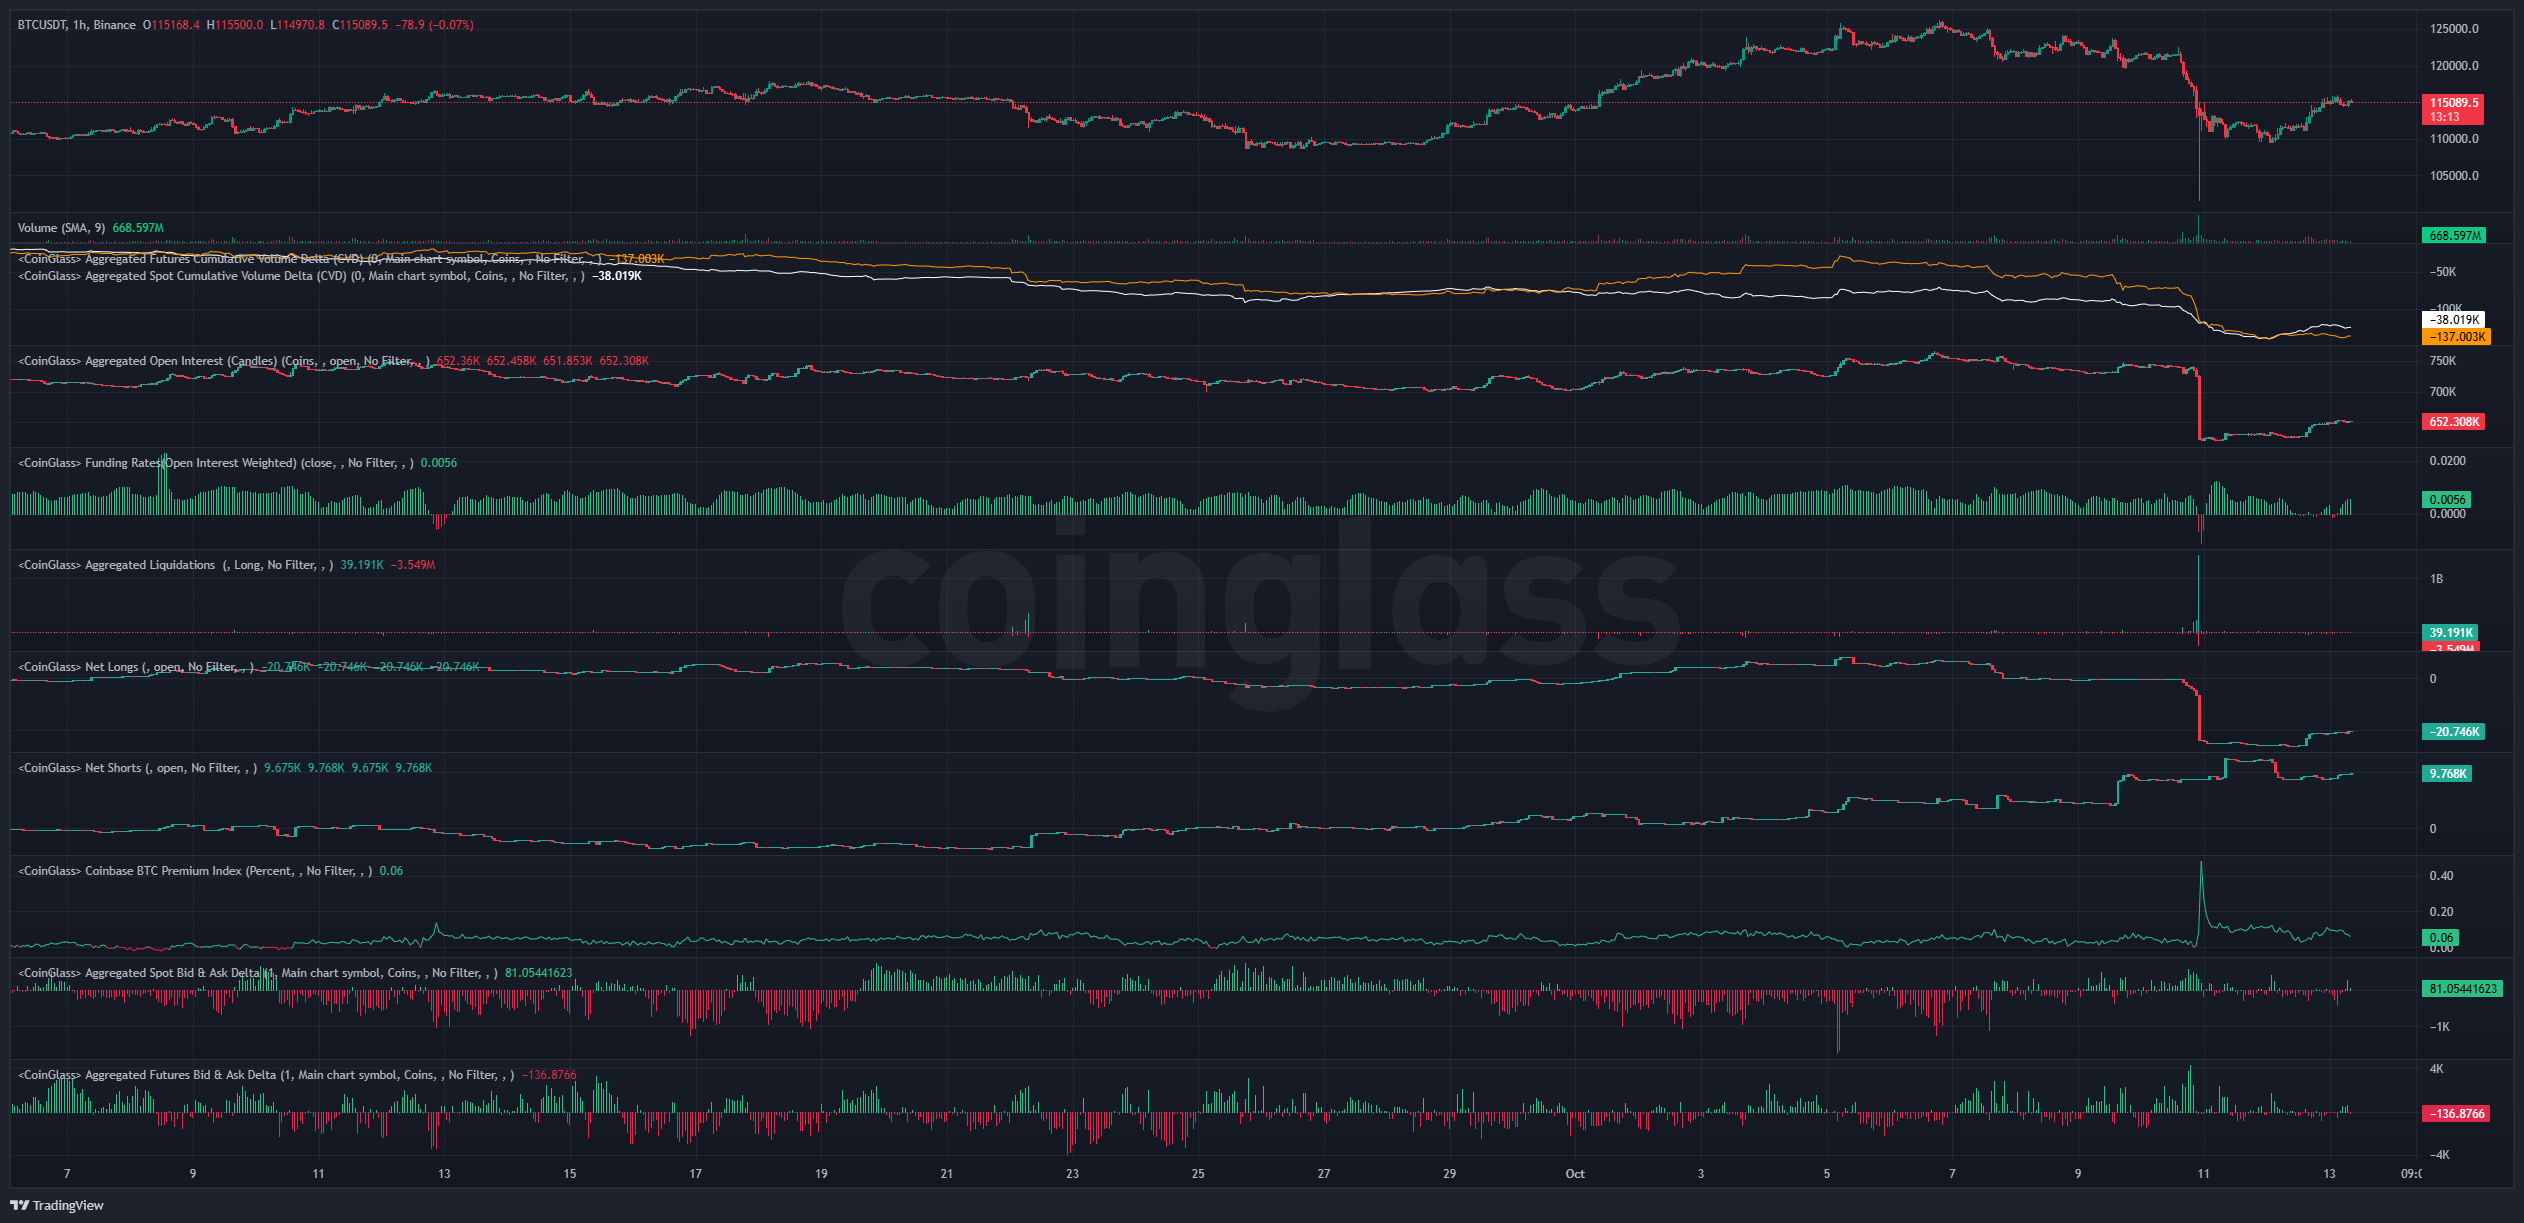
And here's a snapshot of positioning across Velo and CoinGlass, where open interest has been obliterated and Net Longs on Binance are back to Liberation Day lows:
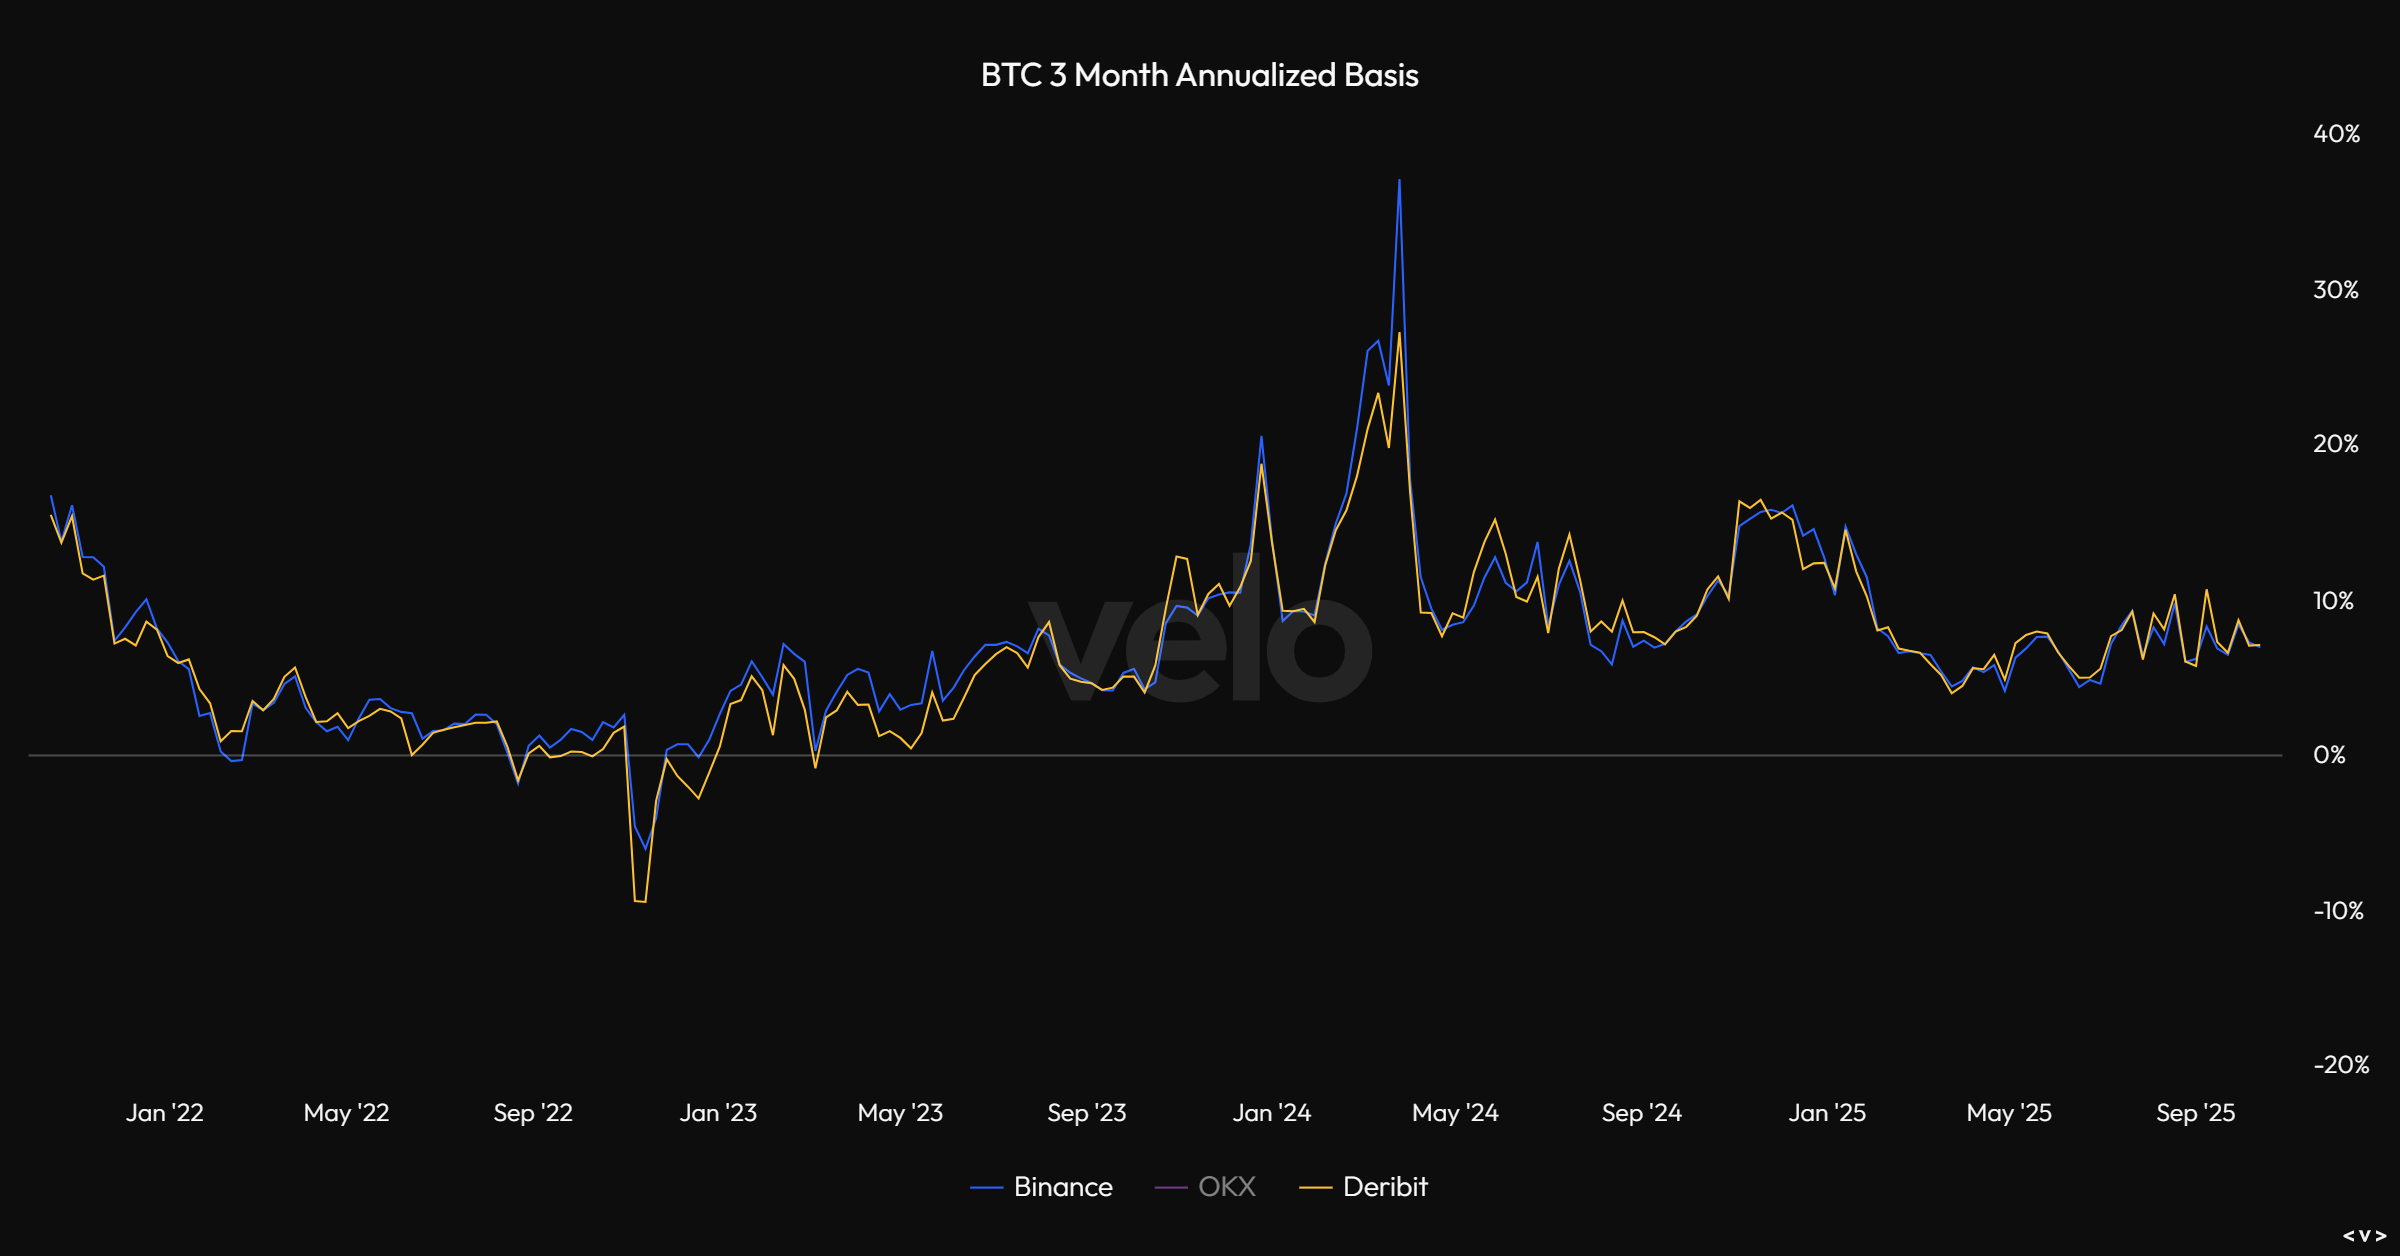
And here's 3-month annualized basis:
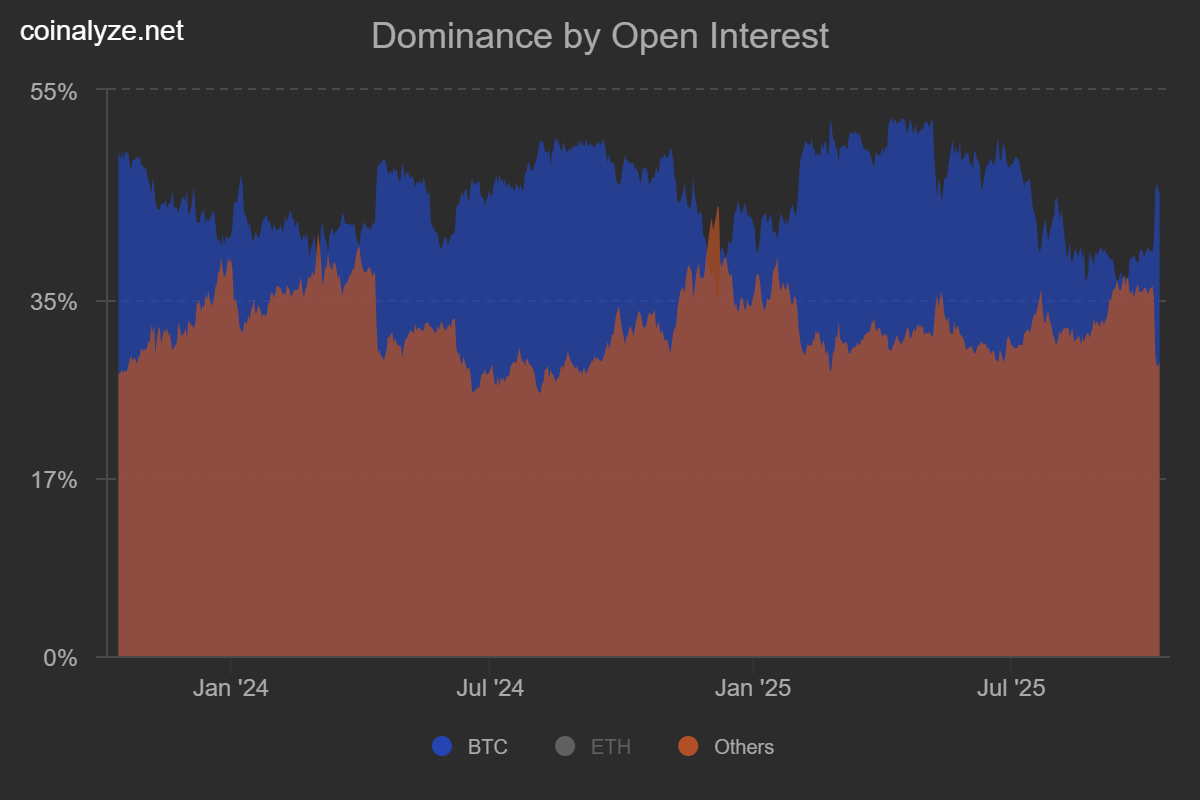
And Bitcoin OI vs Altcoin OI:
And finally some of the expected 1-week and 1-month liquidation levels:
-2025-10-13_09_01_41.png)
-2025-10-13_09_02_10.png)
Price: $4195
ETH/USD
Weekly:
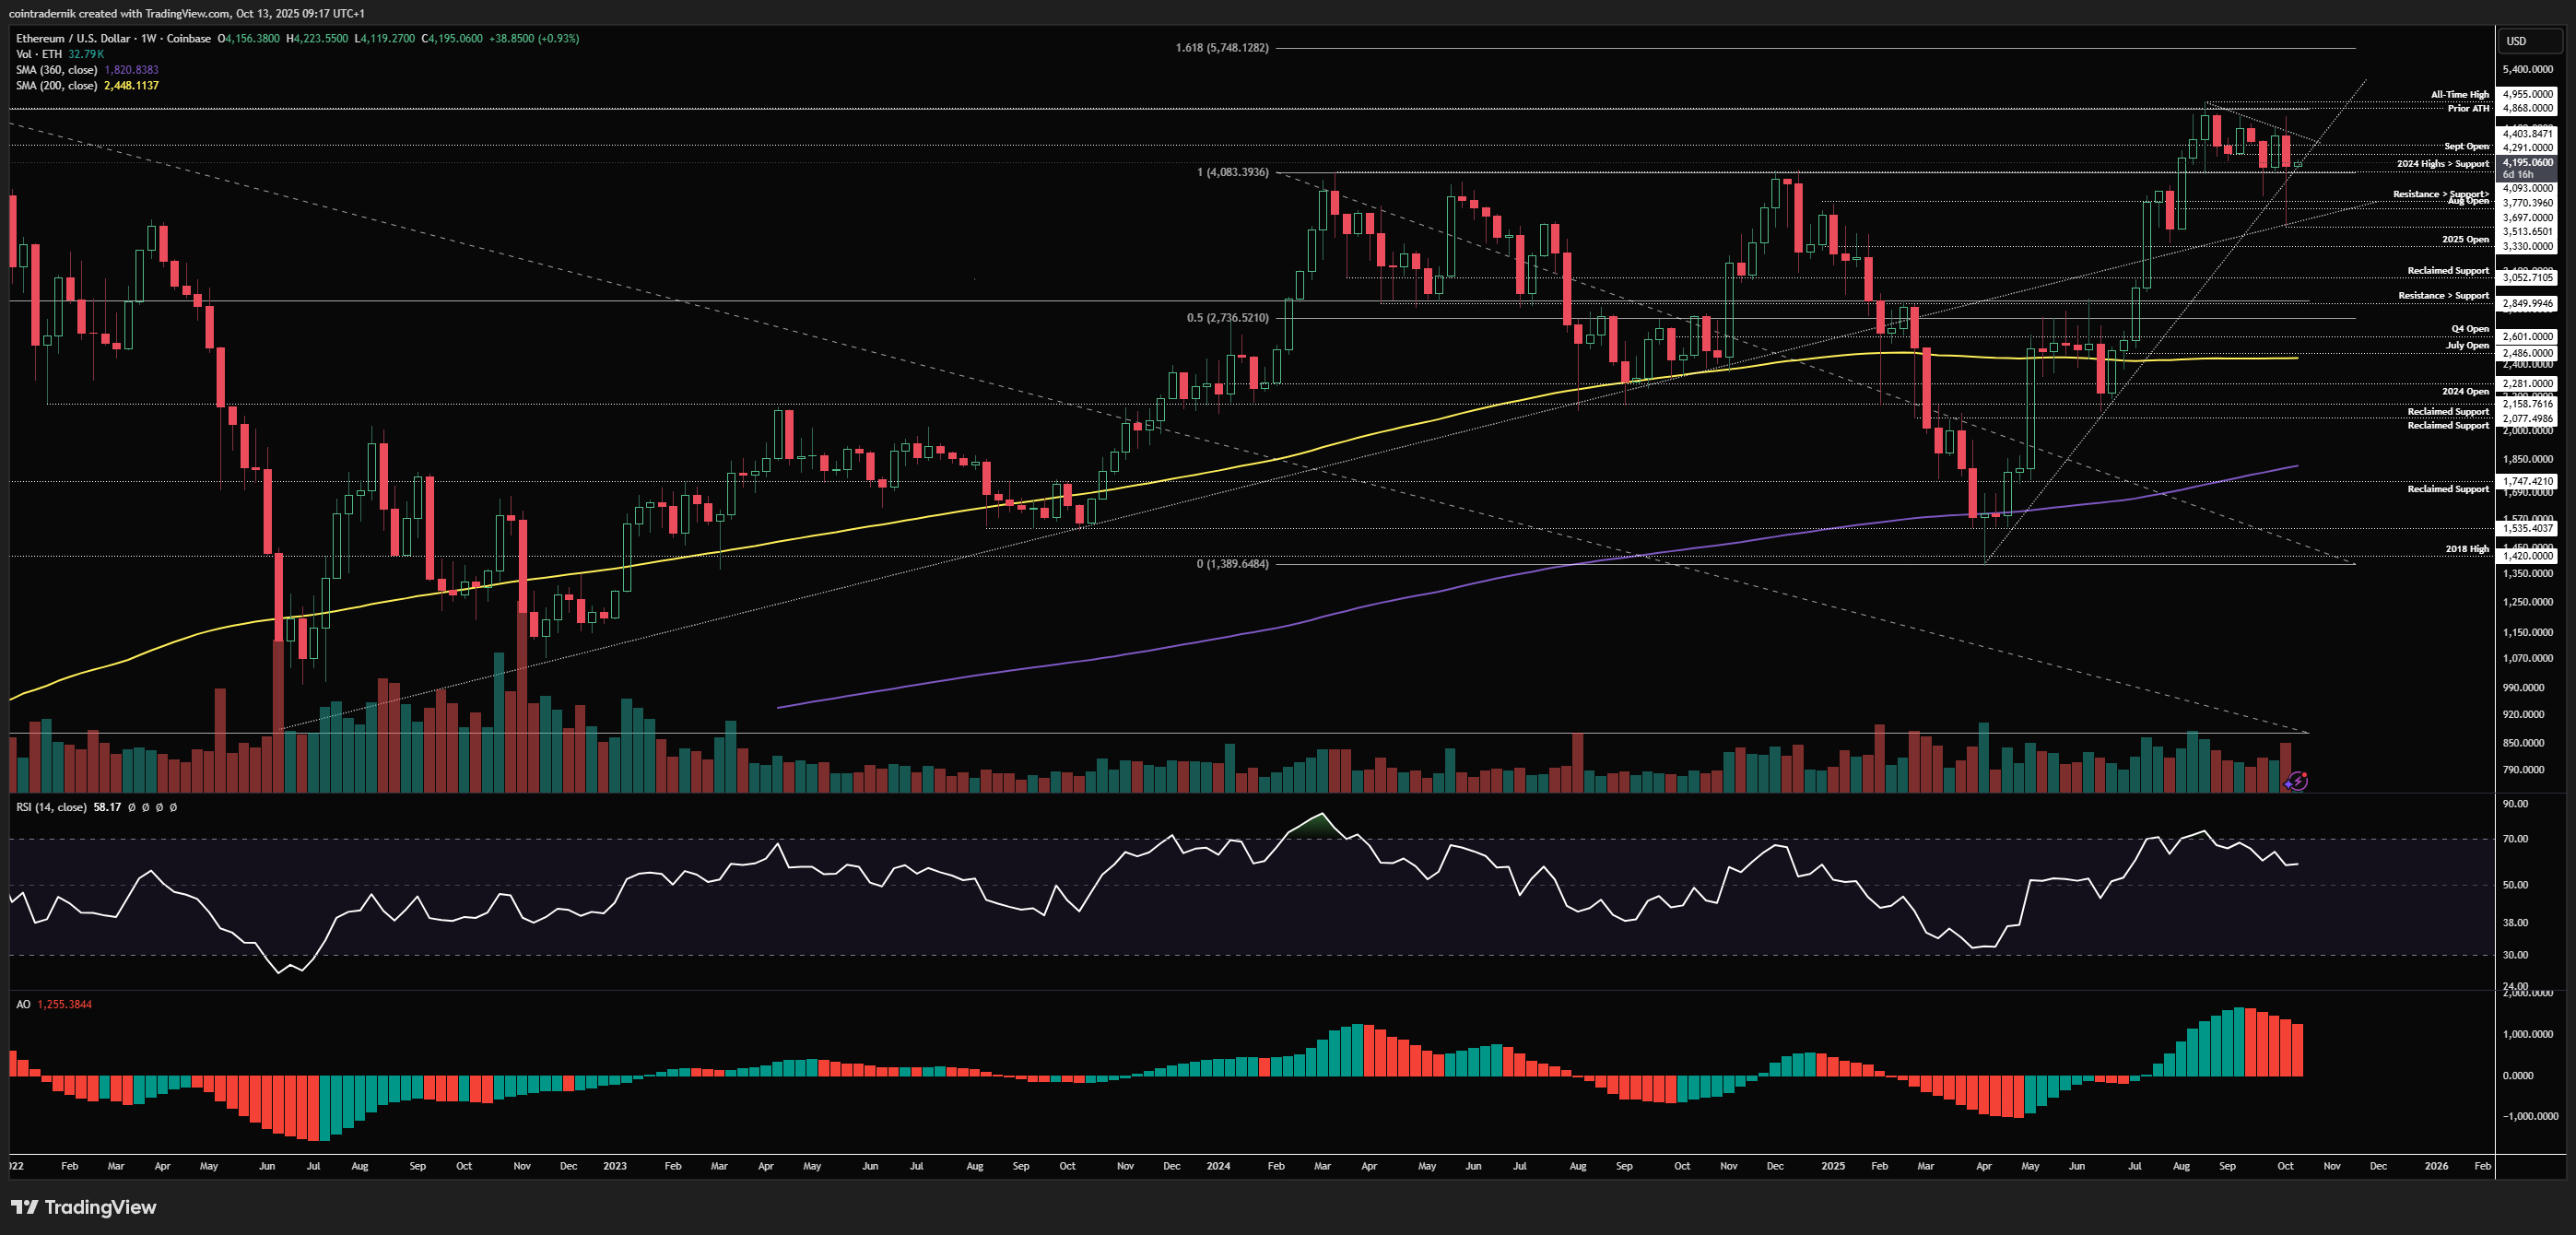
Looking at the weekly for ETH/USD, what a picture we have here. We saw price wick above trendline resistance and reject, then leading to capitulation below the $4093 pivot and through the $3770 support into $3513, holding above the yearly open. More impressively, however, price bounced to close the week back above $4093 - again. If you needed any more convincing about the significance of this level of support, you just got it, and the failure to hold below that level in spite of the events of Friday into the weekend convinces me of the brutal bear trap scenario, where I expect any wick early this week to hold above $3770 but price to again close the week above $4093 and then start to push higher, with any weekly close above trendline resistance and the $4400 level leading to an all-time high breakout. It is my view that ETH trades through $4950 within 10 days, and then continues towards $5750 in November. Again, nothing about this higher timeframe view looks bearish and we now have significantly less positioning to be concerned by on any move higher. In my opinion, the Q4 lows for ETH are now in.
Daily:
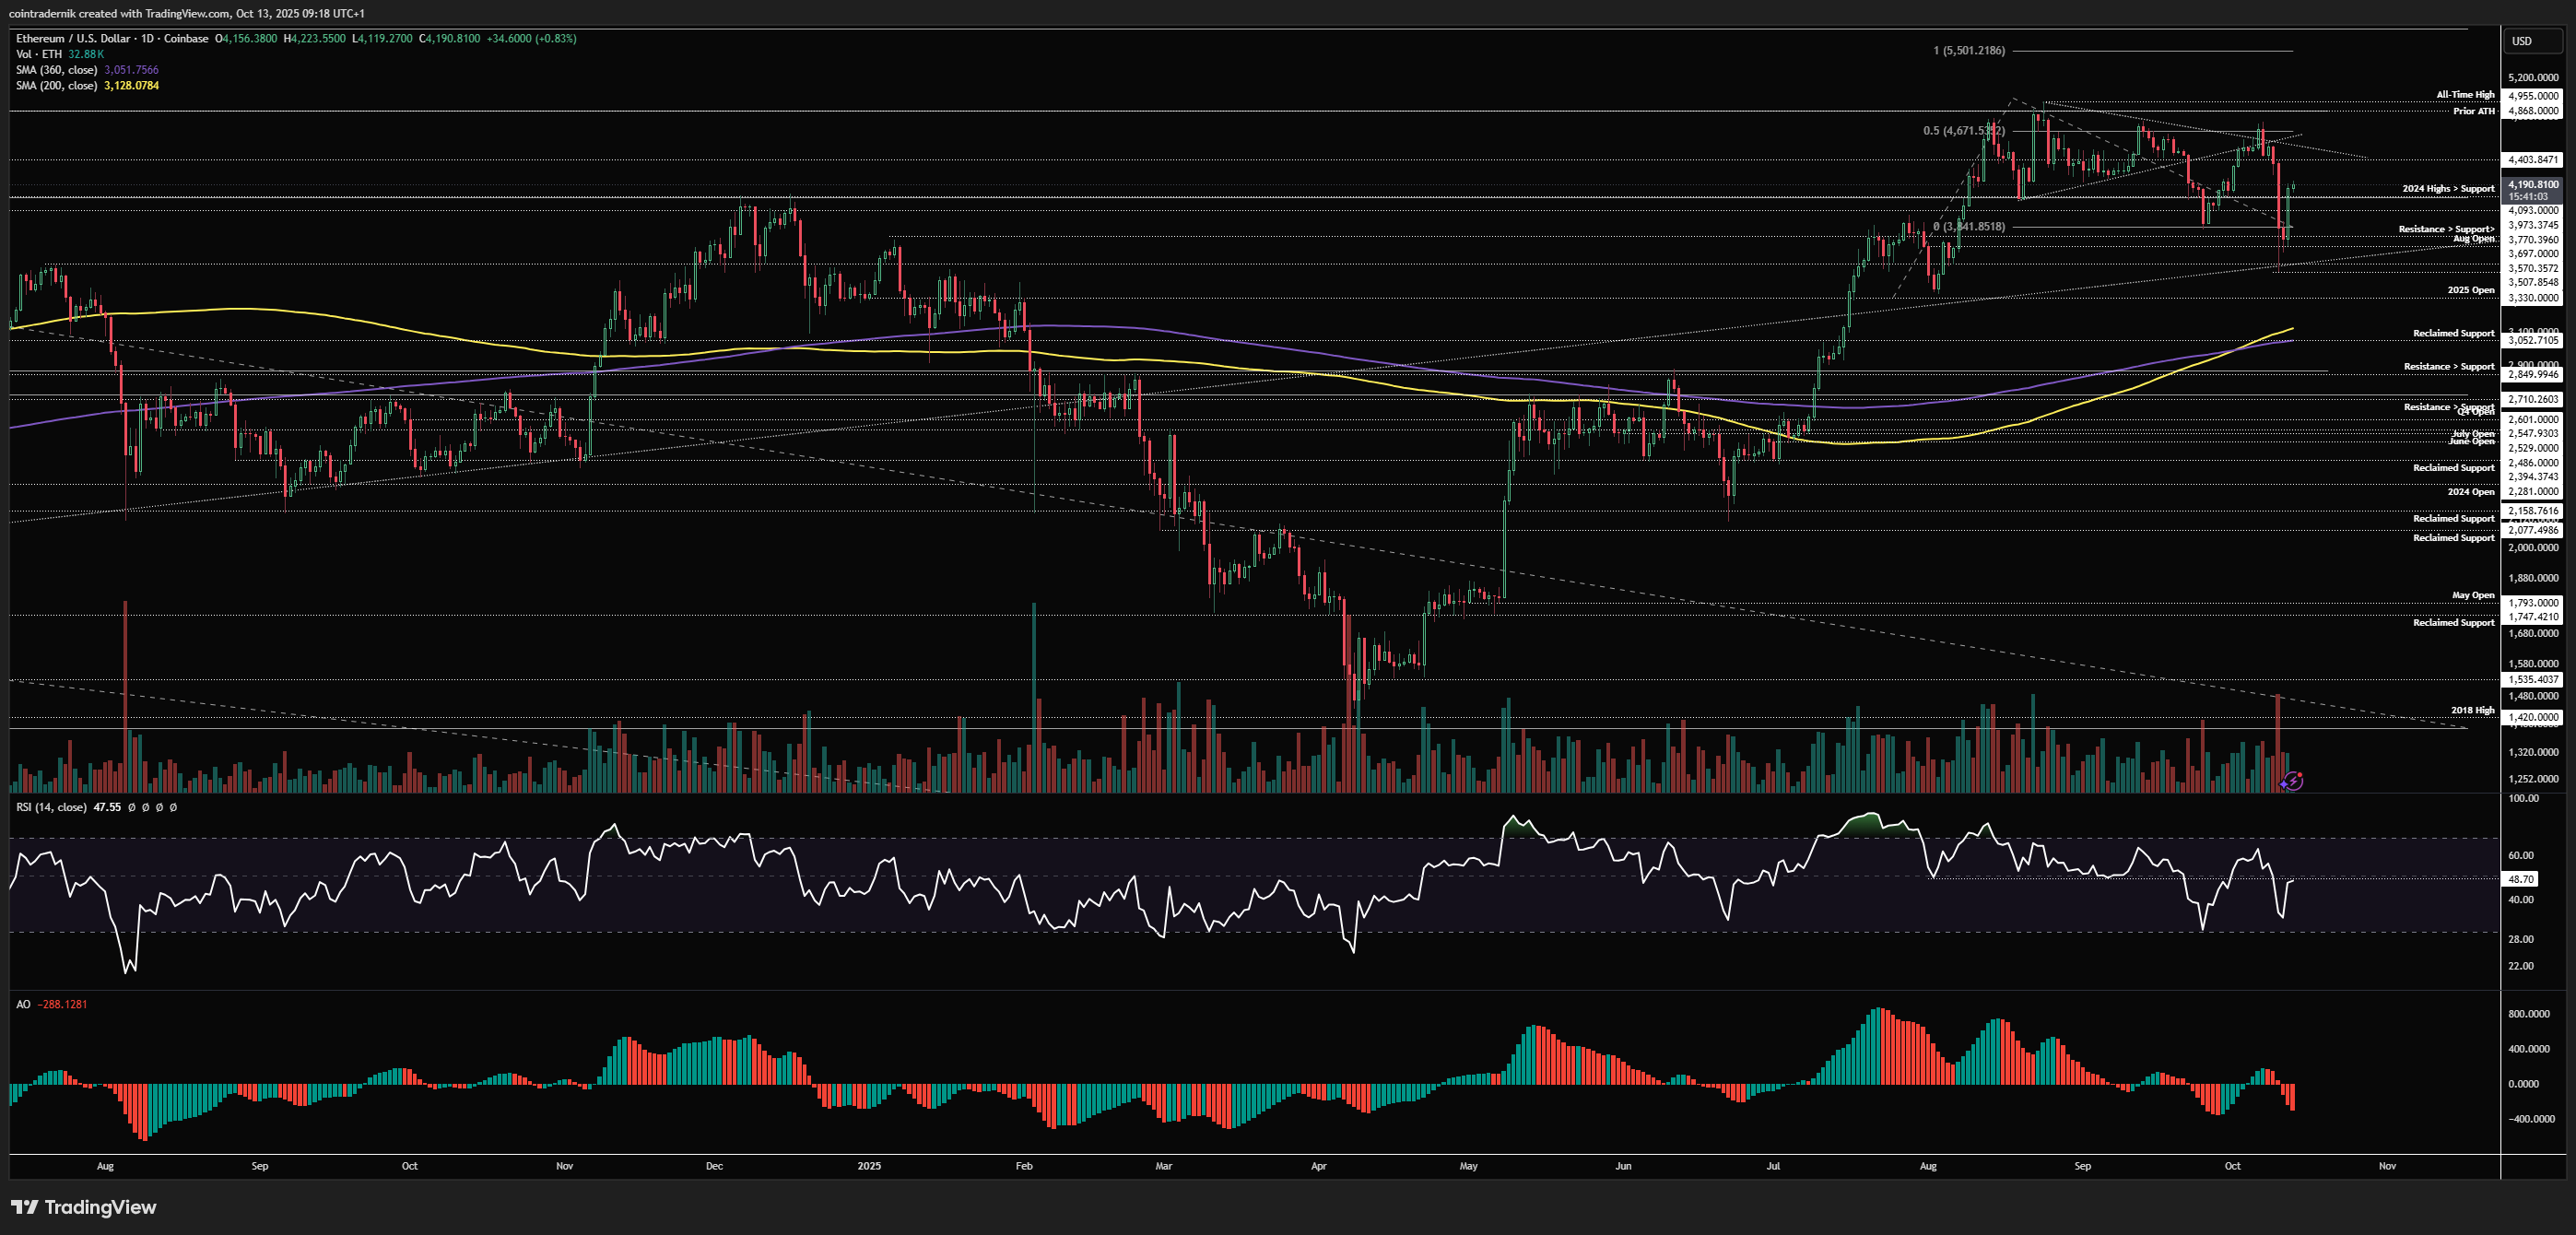
Dropping into the daily, we can see that price formed bullish divergence on the most recent push below $4093 with price bouncing off the long-term trendline reclaim and then pushing back towards $4200. I think it is unlikely we don't retest the $3850 area to form a higher-low, so that's where I'd be looking if you wanted ETH longs, where the formation of that higher-low and then a daily RSI reclaim of 50 as price holds above $4093 as reclaimed support would be very constructive going into next week. Daily close above $4400 (now also the origin of the capitulation candle) = $4868 retest and then the breakout we are all awaiting patiently.
ETH/BTC
Weekly:
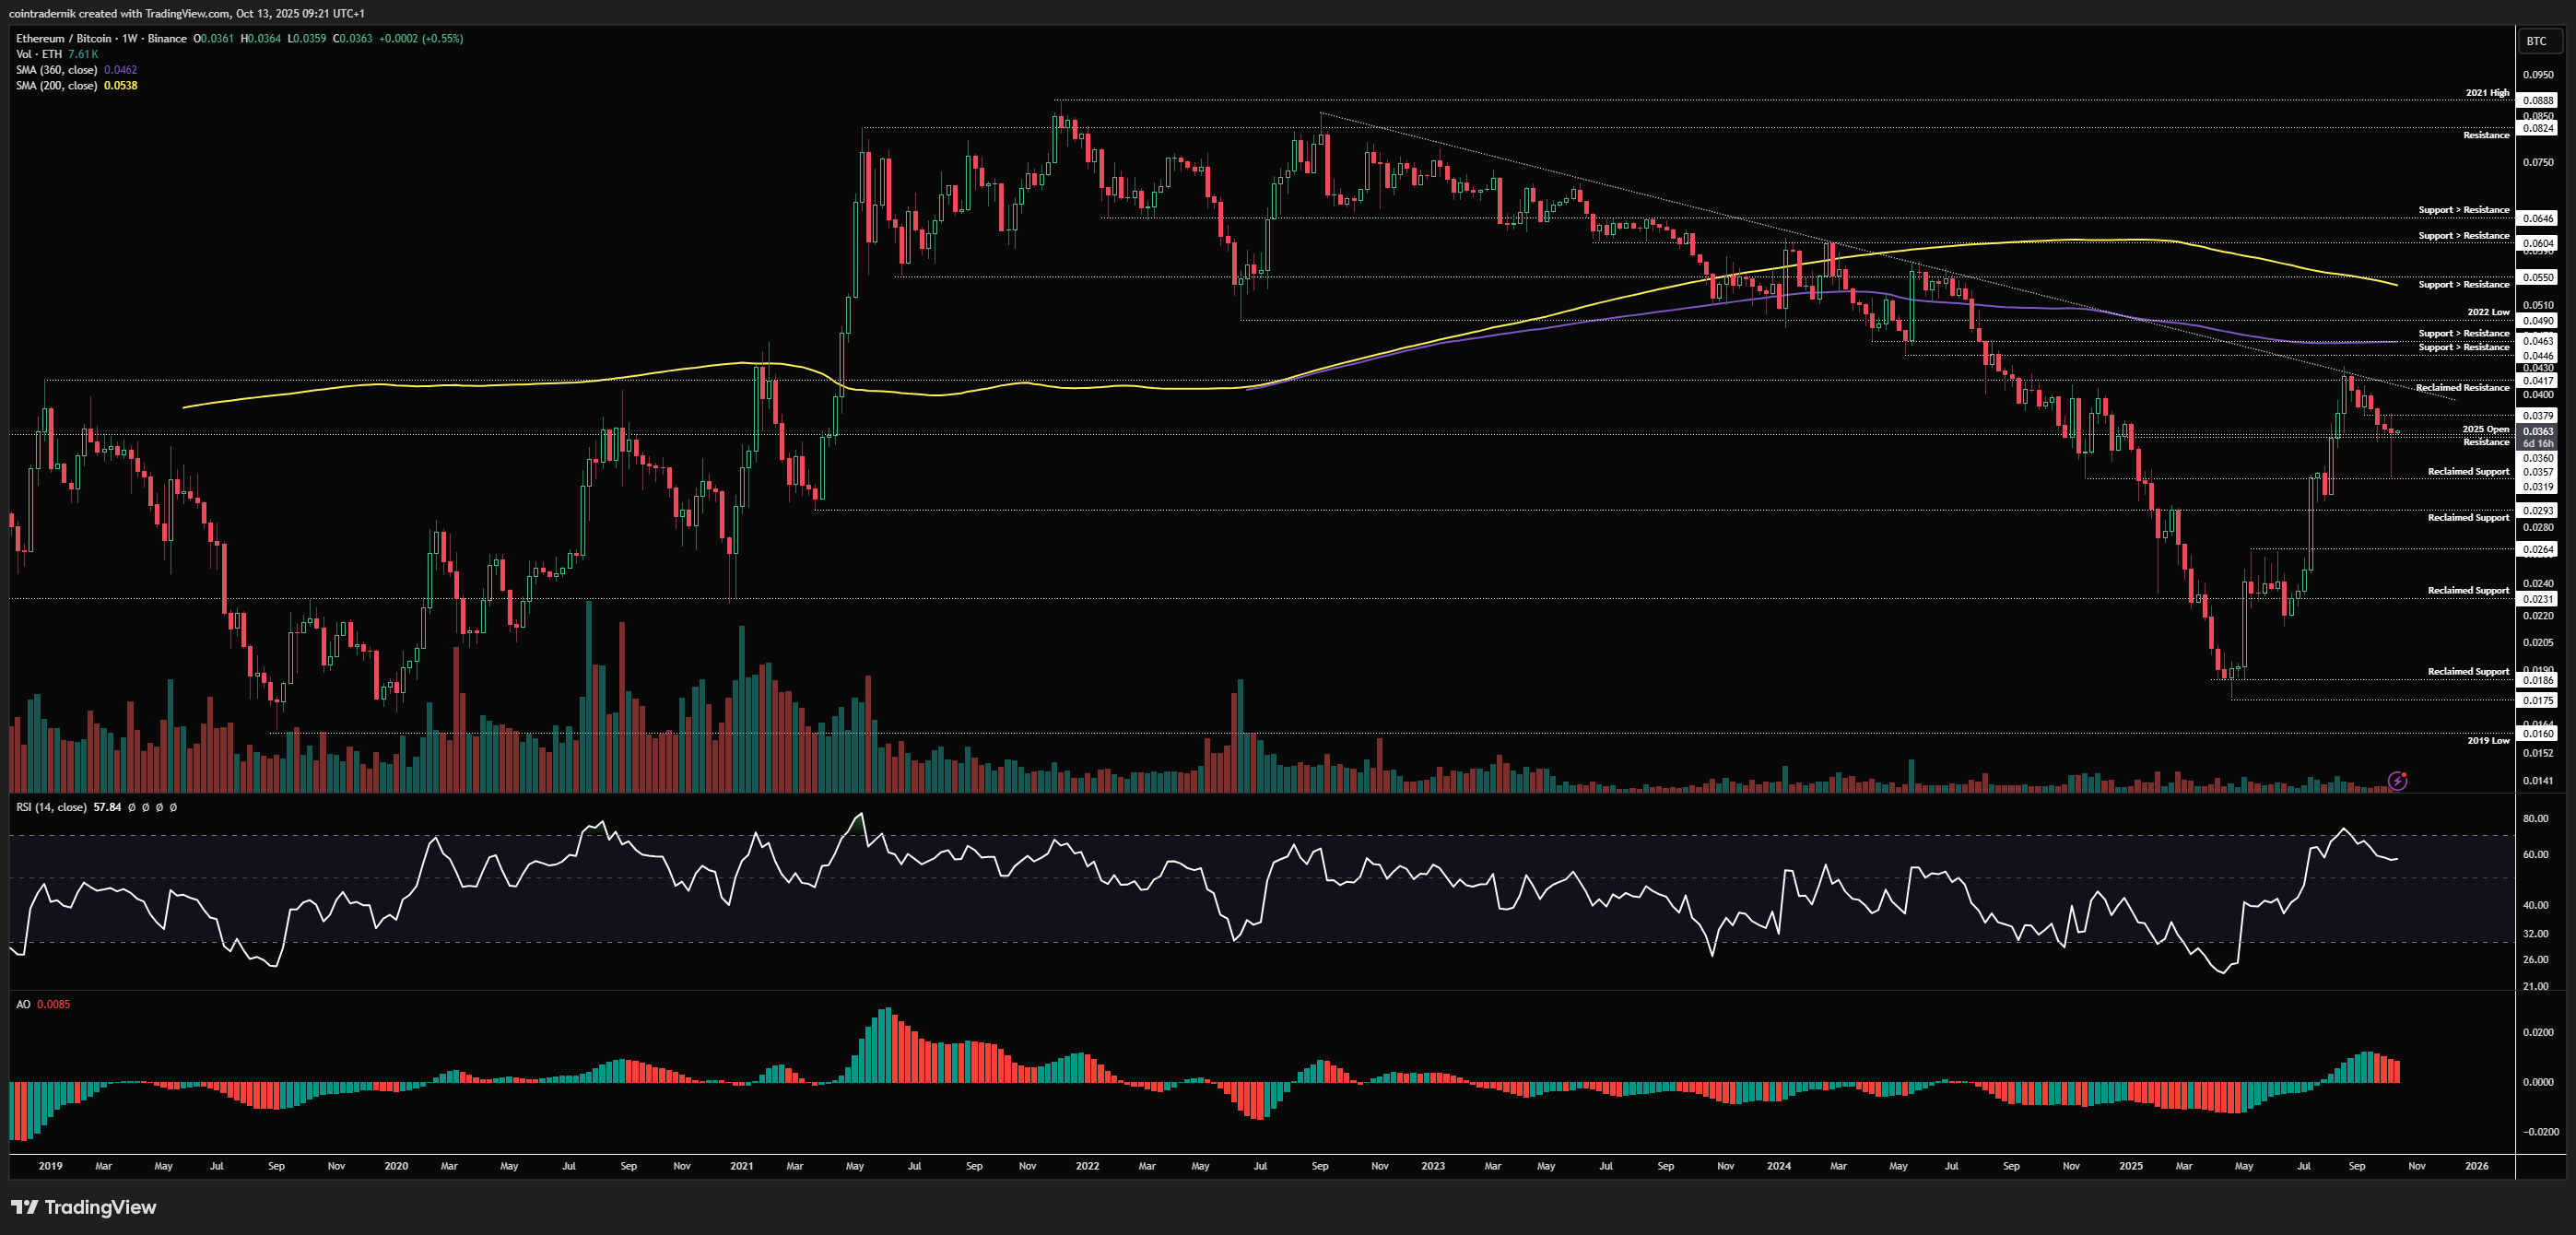
Looking at the weekly for ETH/BTC, the price-action last Friday gave us exactly what we have been expecting of the pair, which is a move below the yearly open to retest that 0.0319 support and form a higher-low between the two levels. I believe this is precisely what we now have and the ETH/BTC low for Q4 is now in. Whilst we may not immediately reverse to a trendline breakout, I think ETH outperforms BTC from here into year-end and unless we start to flip the 2025 open into resistance there is nothing bearish about last week's move. If we can get a weekly close above 0.0375, I think we then test that trendline again and likely break beyond it, then looking for that next leg higher through 0.0417 towards 0.055. Bullish.
Daily:
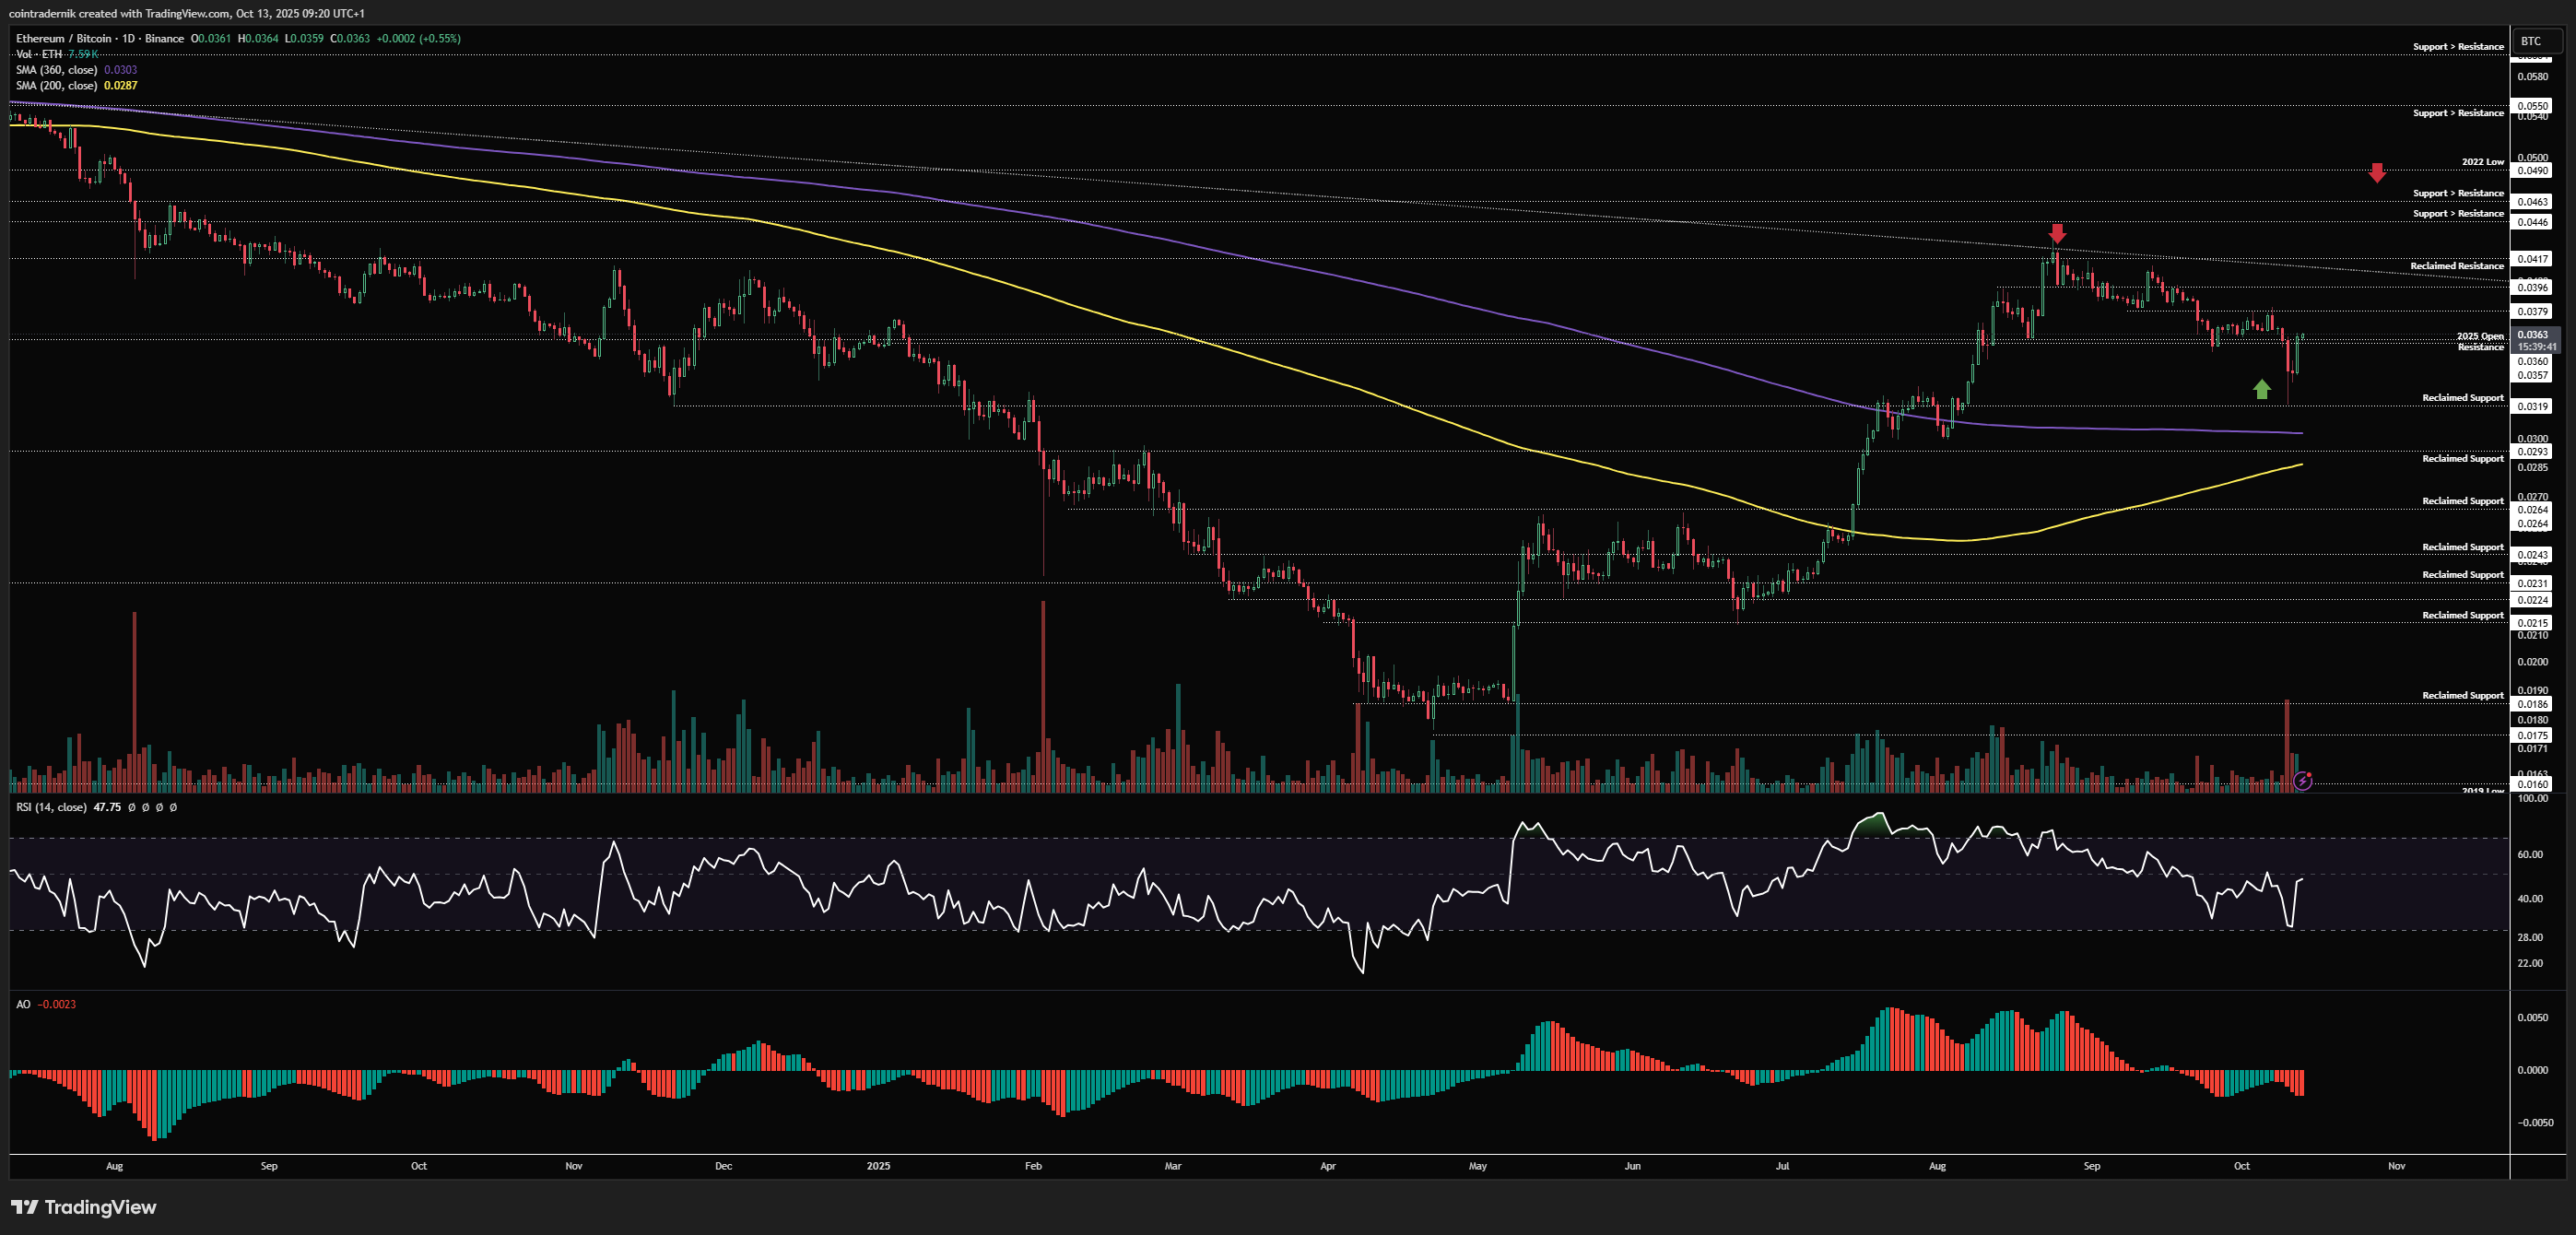
On the daily, we can see this structure more clearly, with support flipping into resistance on the way down since that initial August high at the trendline. Last week saw price front-run the 360dMA retest and hold at 0.0319, bouncing since to reclaim the 2025 open. I would like to see a higher-low now form this week and price to again close the week above 0.036, leading to a move higher through 0.038 next week. If we move lower here to form that higher-low but then flip 0.036 into resistance and close the week below it, the picture looks a little different and I'd expect more chop short-term. Unless we close below last week's low, I don't see anything but higher for ETH/BTC in Q4.
Receive the latest updates directly to your inbox

Price: $98.77
Weekly:
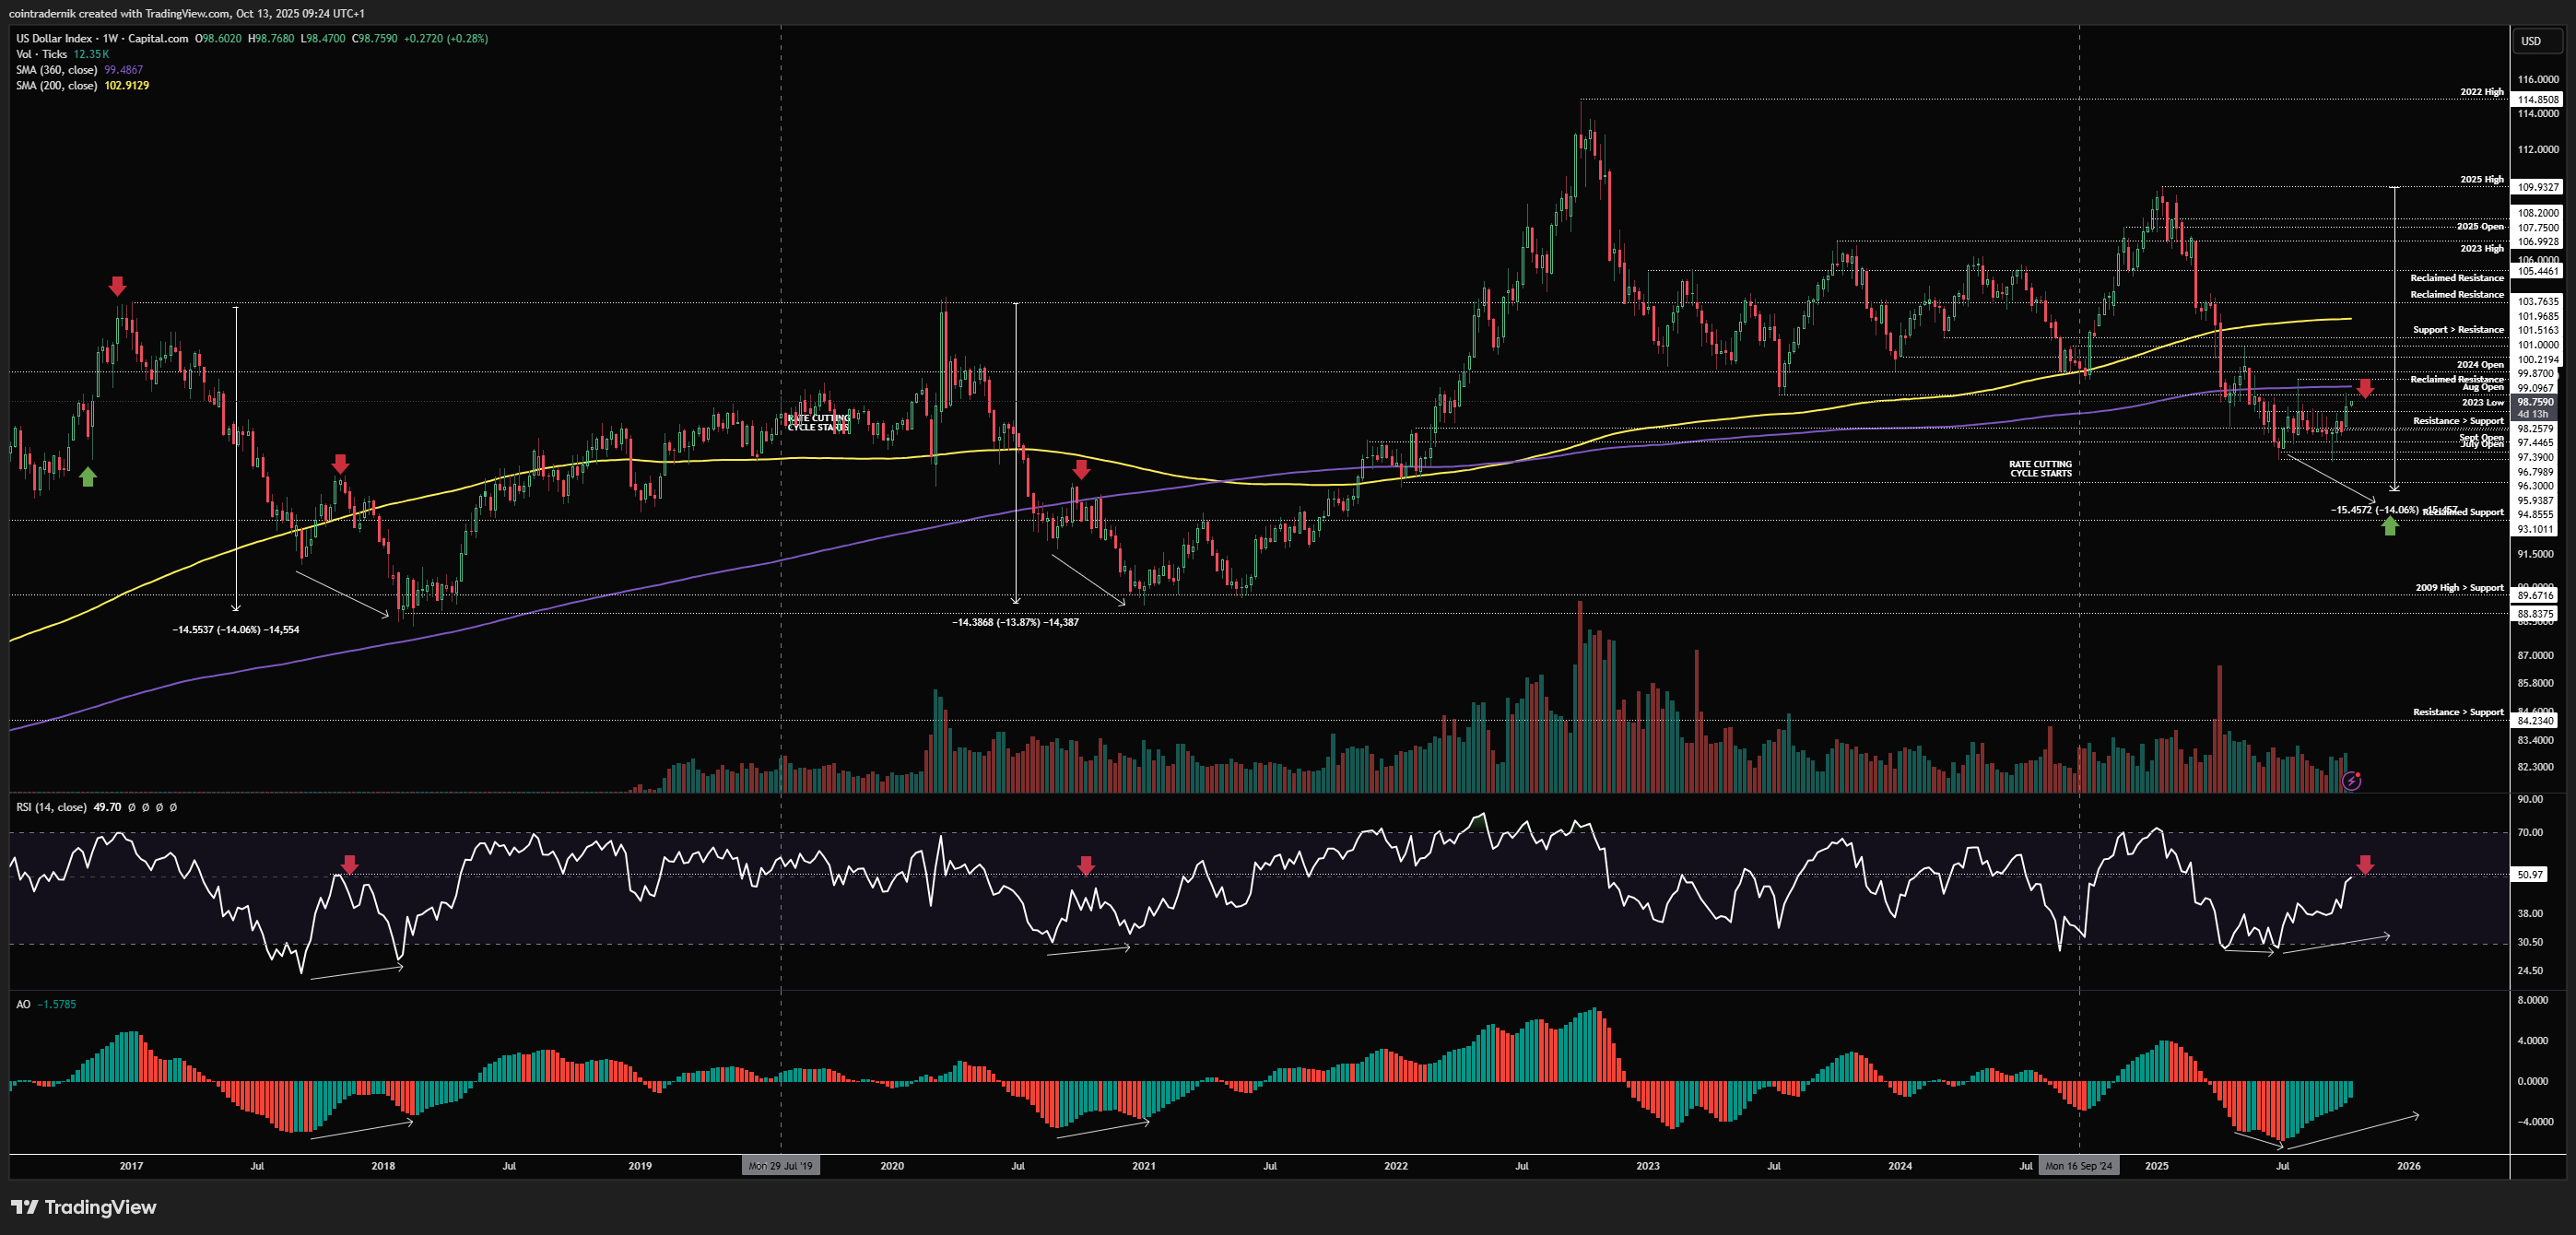
Beginning with the weekly, the Dollar played out precisely as expected last week with continuation of the bid off reclaimed support towards the 99 handle, with DXY closing out the week at 98.6. We are now sat right below 50 on weekly RSI and below the 360wMA and August open, with major support turned resistance at the 100 handle. I am expecting this Dollar bid to cease over the next couple of weeks, though I am not sure where we hit before that top forms and it doesn't look like we're there just yet. If we wick above the prior swing-high into 100 as weekly RSI pokes above 50 and then DXY breaks down on the lower timeframes, that's something I'd begin to consider as a local top. In any case, I don't think we're far off in % terms and I continue to expect that multi-year range support to cap this rally before another leg lower through 96 later this year.
Daily:
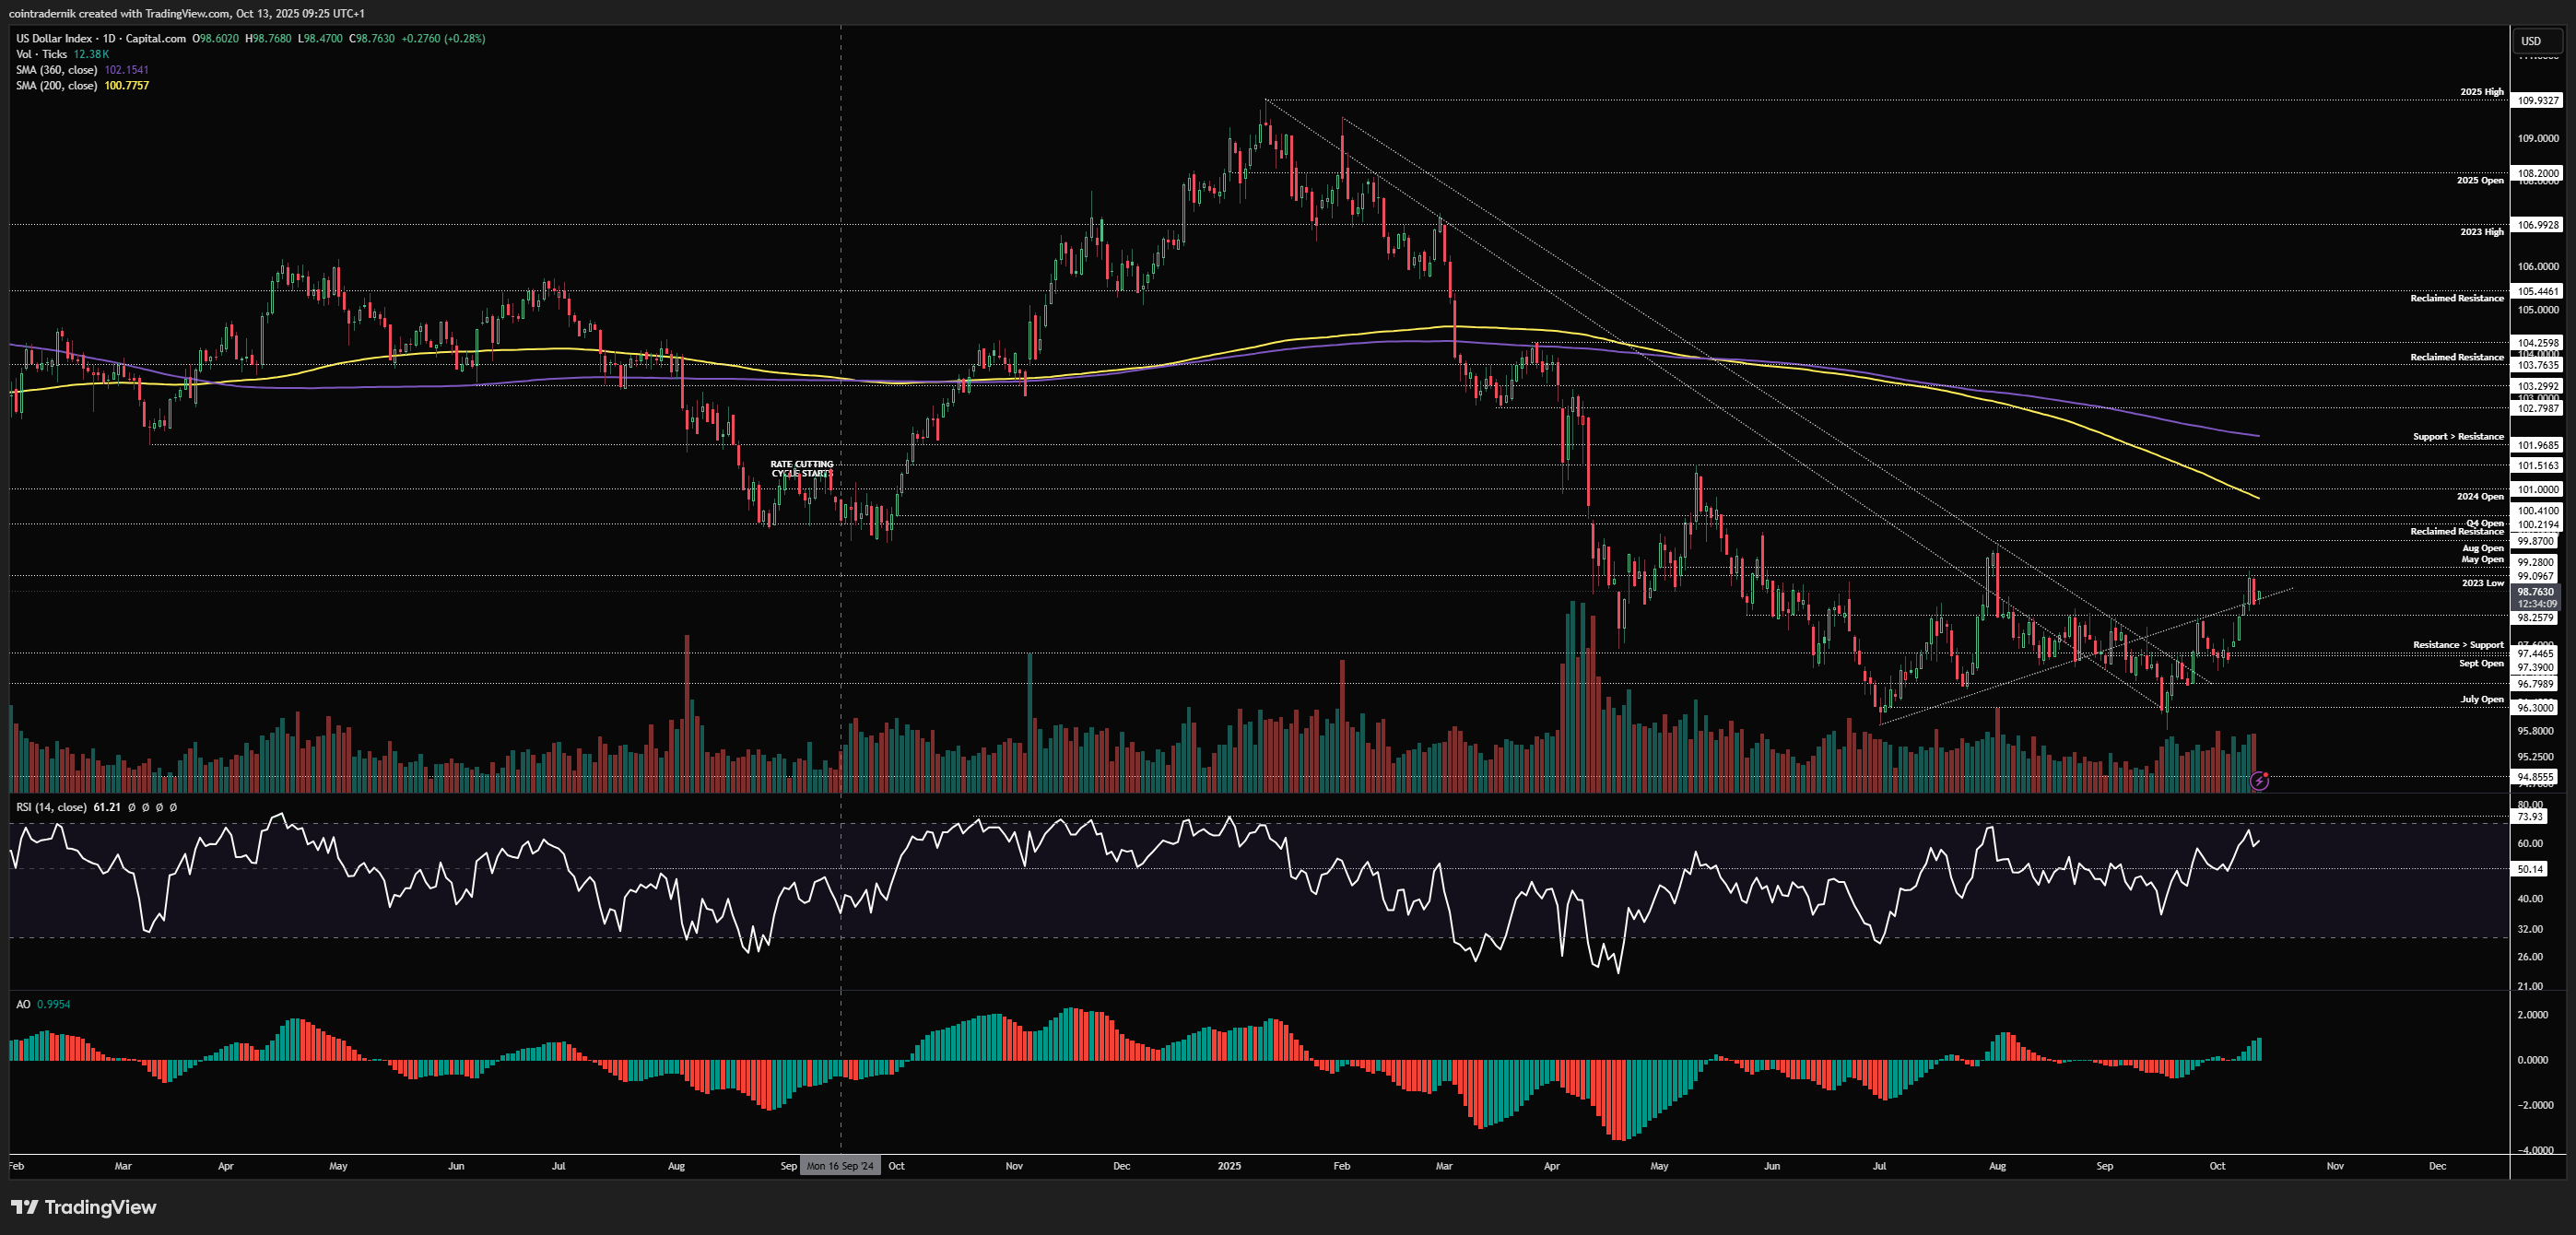
Looking at the daily, we are sat above 98.25 as reclaimed support with daily RSI pushing towards the top of its yearly range that has capped rallies. If we don't have the juice for the 100 handle retest, I would expect last week's high to get ran into 99.3 but price to hold below the late July highs before rolling over, where we could look at lower timeframe trend exhaustion followed by acceptance back below 98.25 as support turned resistance to be more confident in a local top. Acceptance above 100 with that level acting as support remains my invalidation for the broader view that we still have some dollar weakness yet to come before the cyclical reversal.
Price: $6652
Weekly:
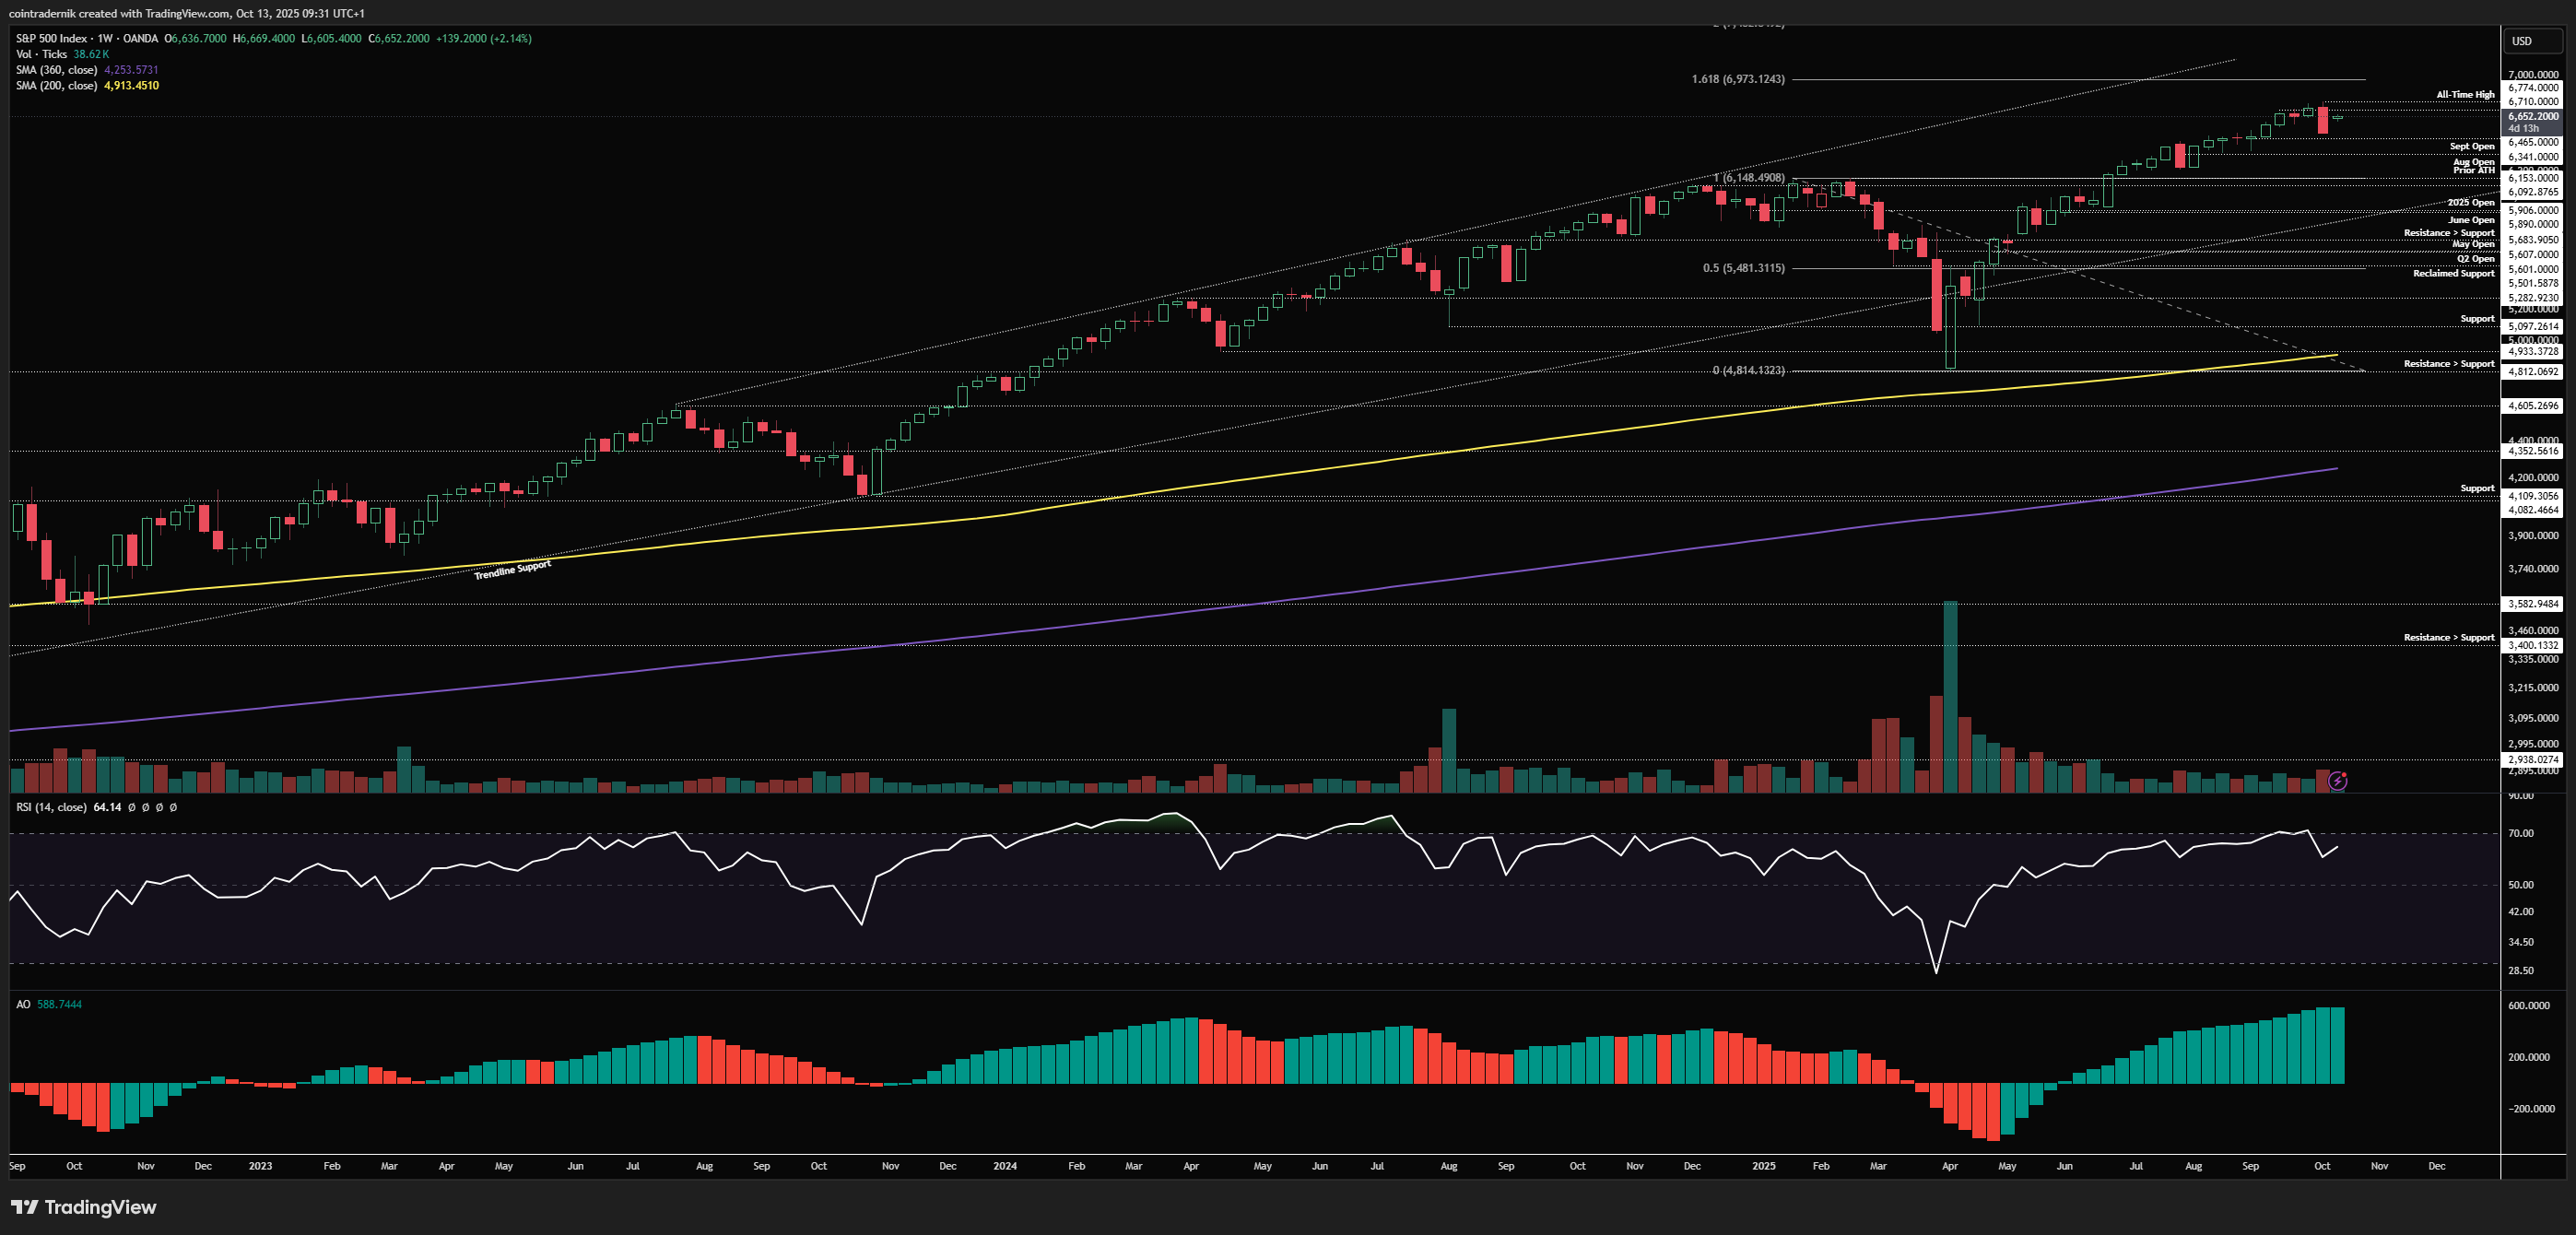
Beginning with the weekly for SPX, I'd first like to shout out myself for being certain enough that we'd get a volatility event in equities last week but being stupid enough to have my put spreads expire two days before it happened. Now that's settled, where are we at? Well, Friday saw SPX trade 3% lower into the weekly close to engulf weeks of grinding higher after wicking into a fresh all-time high at $6774 just the day before. We closed the week right at the lows around $6500, only to gap up at $6636 on Sunday night after Trump walked back his rhetoric. We don't even wait for Tuesdays anymore for the TACO apparently. Weekly structure and momentum remain bullish and there are some great stats being shared around the strength of fourth quarters after strong summers, as well as the probability of returns after 2.5% moves lower the day after all-time highs; needless to say, statistical data is pointing towards the same thing that the price chart and sentiment/positioning suggest: higher for longer. Whilst we may not yet have actually bottomed on equities, with some weakness potentially ahead at least into next week, the buyback blackout ends soon, earnings season approaches and I fully expect fresh highs by end of month, followed by a very strong Nov where I think it becomes more probable that the sentiment and positioning data that has been so entrenched in a wall of worry begins to turn into some sense of real belief. This would potentially lead to a December pullback that shakes the faith once again before continuation higher in Q1. My year-end target is the 1.618 extension of the April crash at $6973. The reason I say we may not yet have bottomed is because I would not rule out one more bout of headlines that could give us another spike above 1 on spot VIX vs 3-month forward and that would be an opportune dip to buy if we are so lucky; if we get out of this week without making fresh lows, I think it is less likely we make fresh lows next week, particularly as we draw closer to a Nov 1 deadline on China tariffs that I am currently confident will be averted.
Daily:
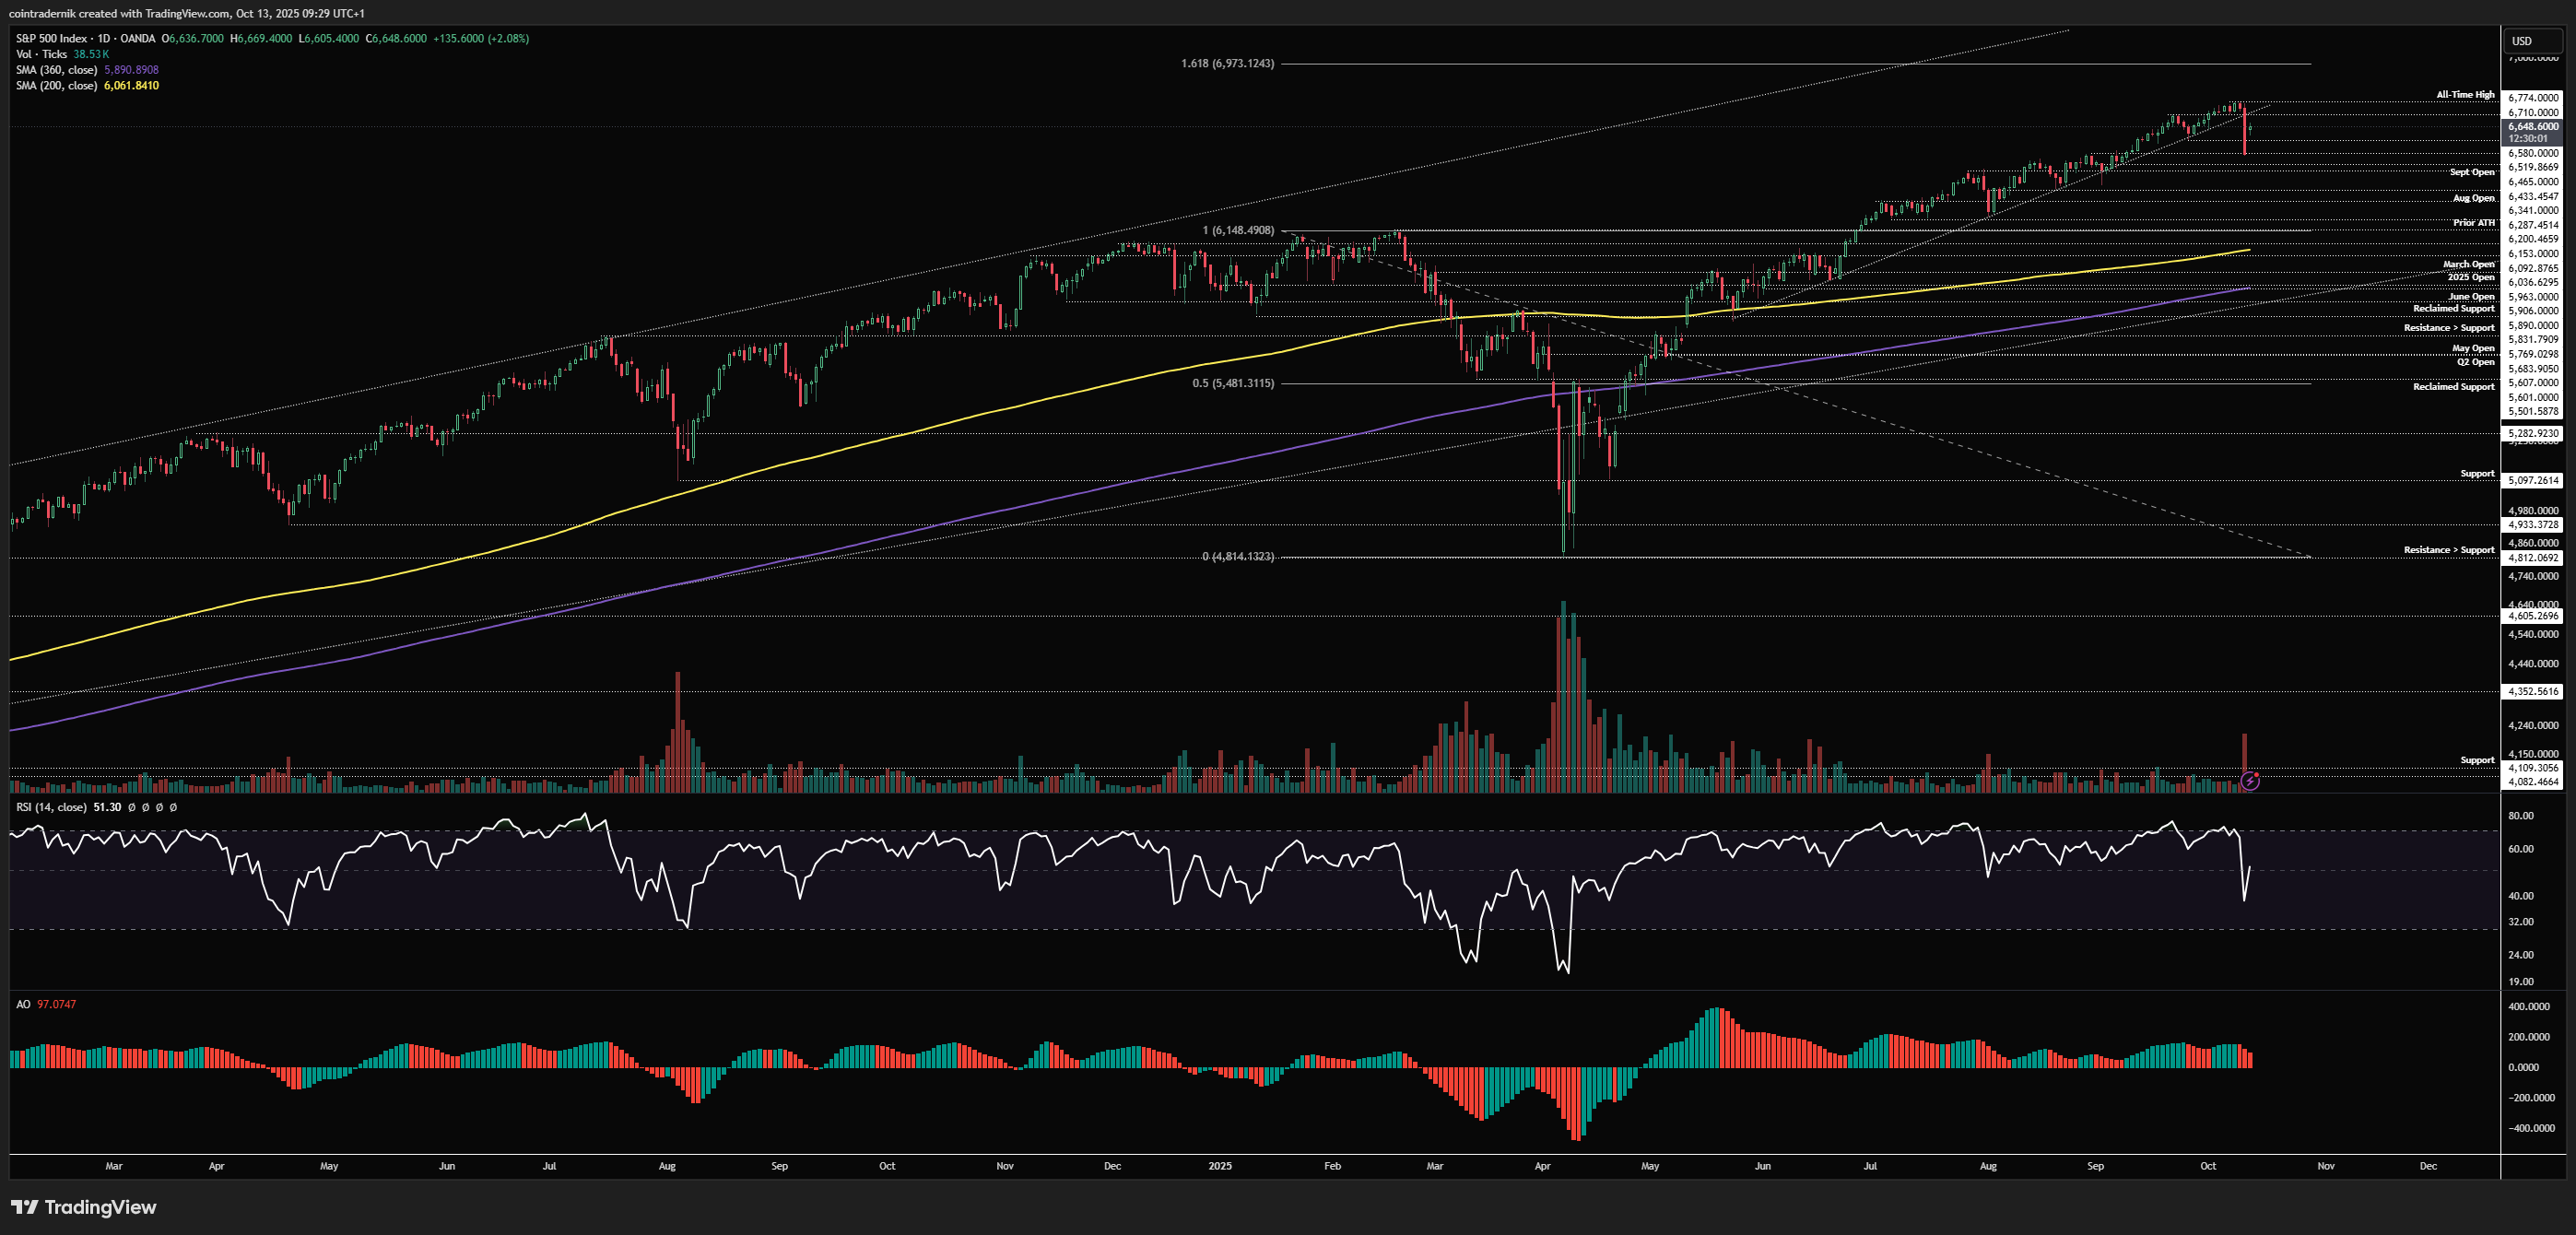
Looking at the daily, we can see we finally broke the trendline from the May lows that has been marking out a bunch of higher-lows as price kept grinding higher on low volatility. Last Friday saw price sell off from the open right into the close and turn daily structure bearish with that close below $6580, where I had expected the FOMC lows to have been taken out before any bottom was found. We have now swept those lows into prior resistance turned support above the September open and gapped higher. If we close this week above $6710, then we v-reverse to new highs and beyond quite swiftly; if, instead, we get one more tantrum and a sweep of last week's low into $6465, that would be a great opportunity to long in my view. Only if we flip that Sept open as resistance into Nov would I be more concerned about a more protracted drawdown.
Price: $275bn
OTHERS/USD
Weekly:
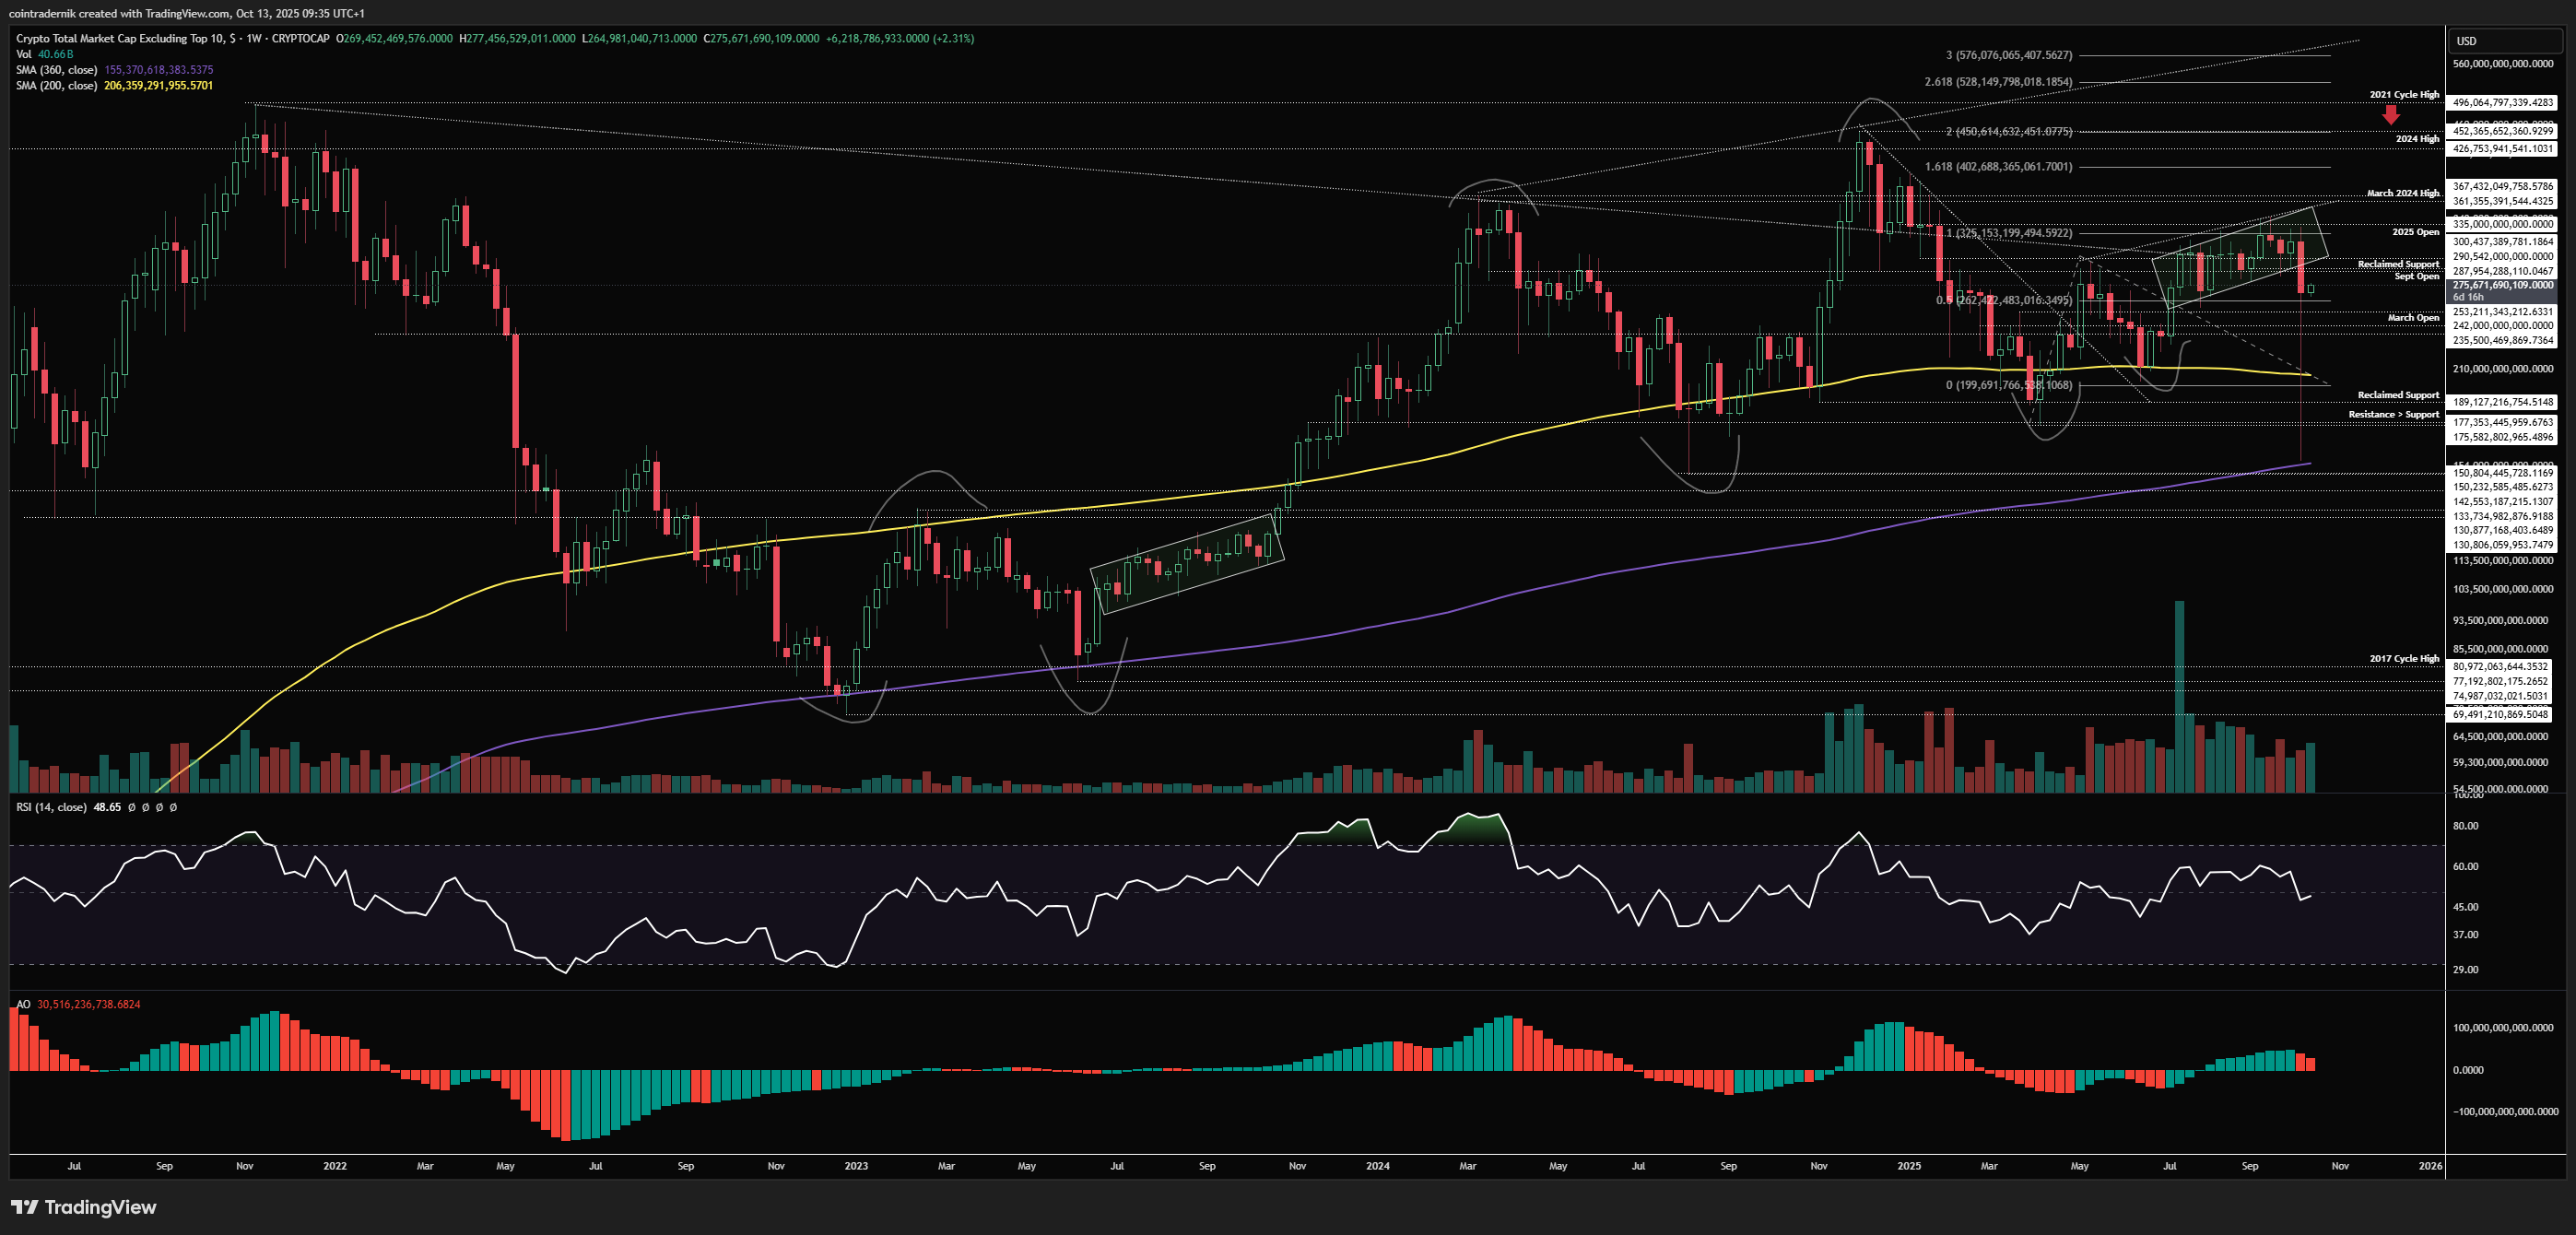
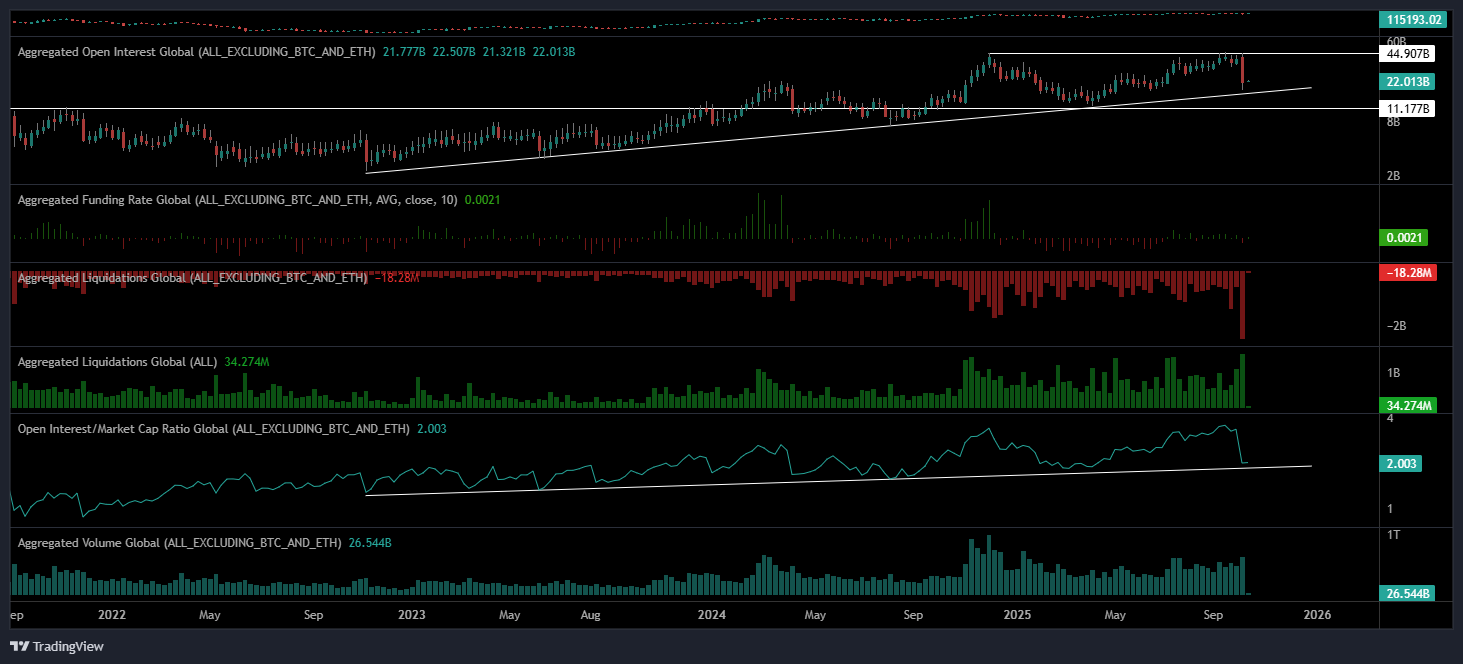
Right, where do we begin with alts? Well, you don't need me to tell you we had the largest and most brutal altcoin liquidation event in history, given the breadth of tokens that saw greater than 50% daily drawdowns and wiped out basically every levered position in the books. Altcoin open interest more than halved in a day and open interest as a percentage of market cap hit multi-year trend lows, as seen in the chart below:
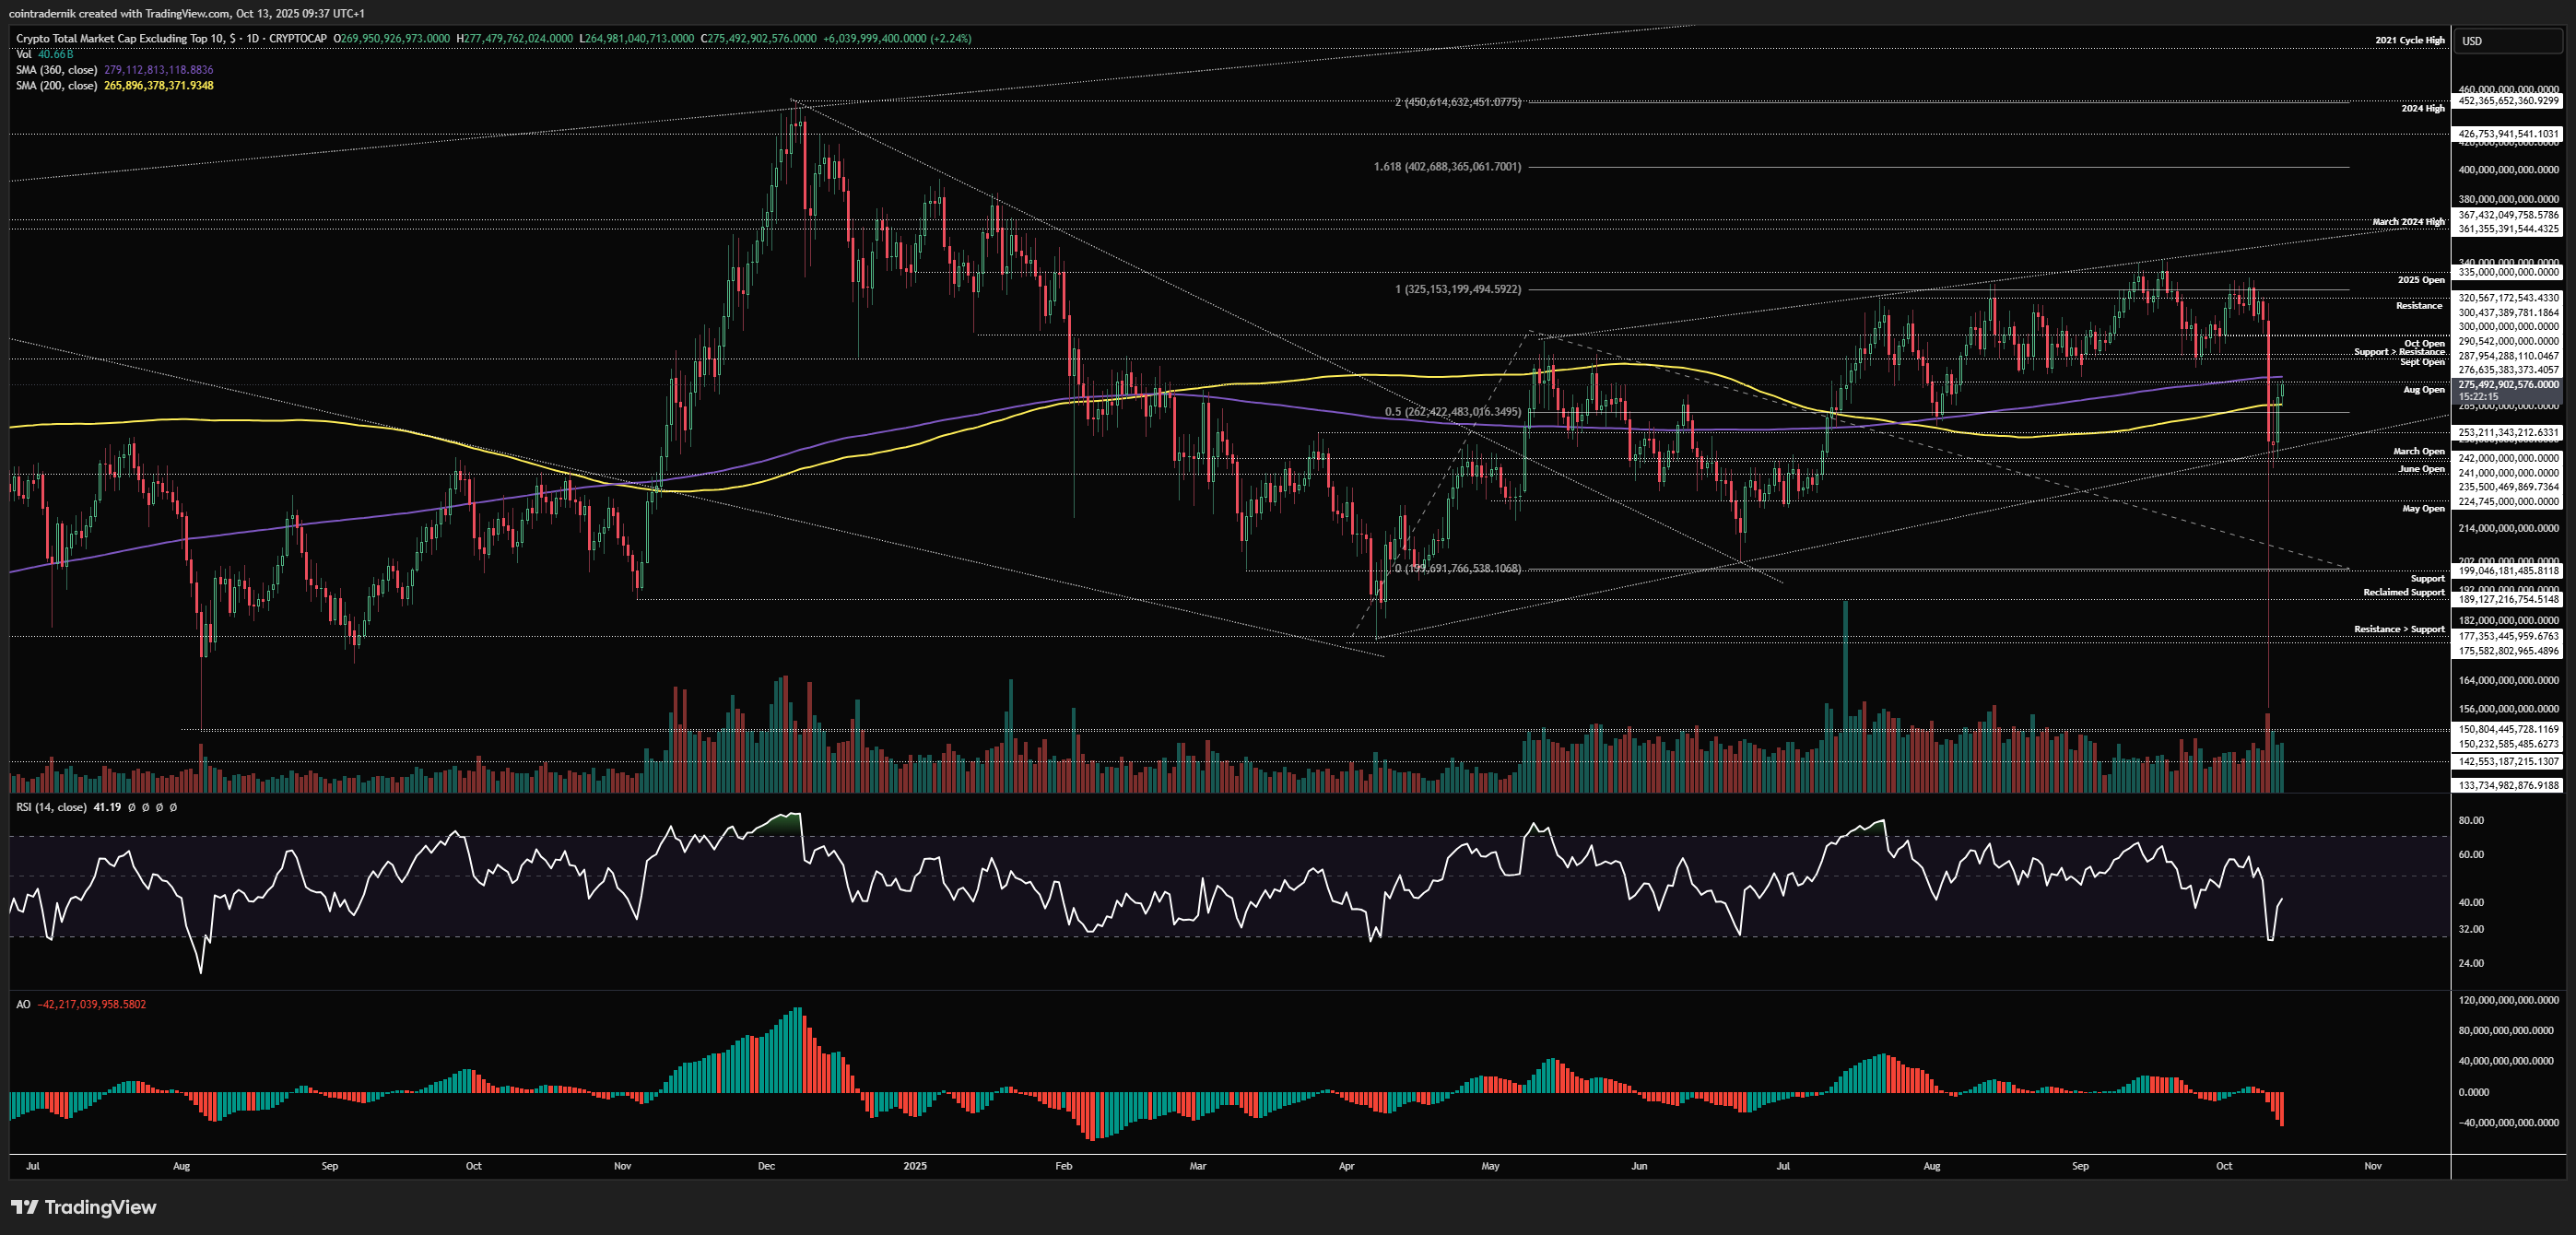
Looking at OTHERS, alts wicked all the way into bear market lows as an index, hitting the 360wMA at $150bn briefly before bouncing sharply higher to close the week back above all the recent support into $269bn, marking out a higher-low still above the $250bn swing-low. Kind of fucking insane when you look at it for a while. The nominal size of the weekly candle is simply unparalleled - $180bn from peak to trough. And yet weekly structure is still bullish and now we have no excess leverage in the system. It really is brutal to think that the broader altcoin market is back to where it traded just a few weeks ago but billions and billions of dollars in positioning got liquidated. What is more brutal is the multitude of alts that closed the week green. So, if that gives you any indication as to my view, it remains the same, albeit emboldened by the lack of excess positioning in derivatives, where I fully expect OTHERS to mark out a higher local low this week and then rally higher and reclaim the yearly open into November at $335bn, above which I think we run towards fresh cycle highs and all-time high resistance at $490bn. I still think we get another shakeout in December, so I will be monitoring positioning and sentiment carefully if we do run higher over the next 6 weeks or so; if this liquidation even has utterly decimated the psychology of derivatives traders, however, it is possible a correction in December is a lot less brutal than it could have been. If, instead, everyone who still has capital piled into levered positions and all the metrics start overheating again into Dec, it's gonna be a problem. I do not think we have entered a bear market, and if anything for alts vs BTC we are likely only just now emerging from a multi-year bear market, in the most devastating fashion. I think Q1 has the possibility to be stronger than Q4 for alts and will continue to update this view as new data comes in.
Daily:
Turning to the daily, we can see the wick even more clearly, with OTHERS taking out literally every support all the way back into the August 2024 yen carry unwind low before bouncing to close Friday back above trendline support from the April 2025 tariff lows within this broader uptrend. Price then marked out weekend lows above the June and March open and pushed higher, with early trading this week taking OTHERS back to the August open and 360dMA. We remain in a long-term uptrend but obviously daily structure is now bearish after the close on Friday. What we want to see on this timeframe is OTHERS to hold trendline support and the weekend lows on any weakness this week and then reclaim the October open at $300bn as support, which will then open up a retest and undoubtedly a breakout beyond the 2025 open at $335bn. Acceptance below $235bn would be bearish.
OTHERS/BTC
Weekly:
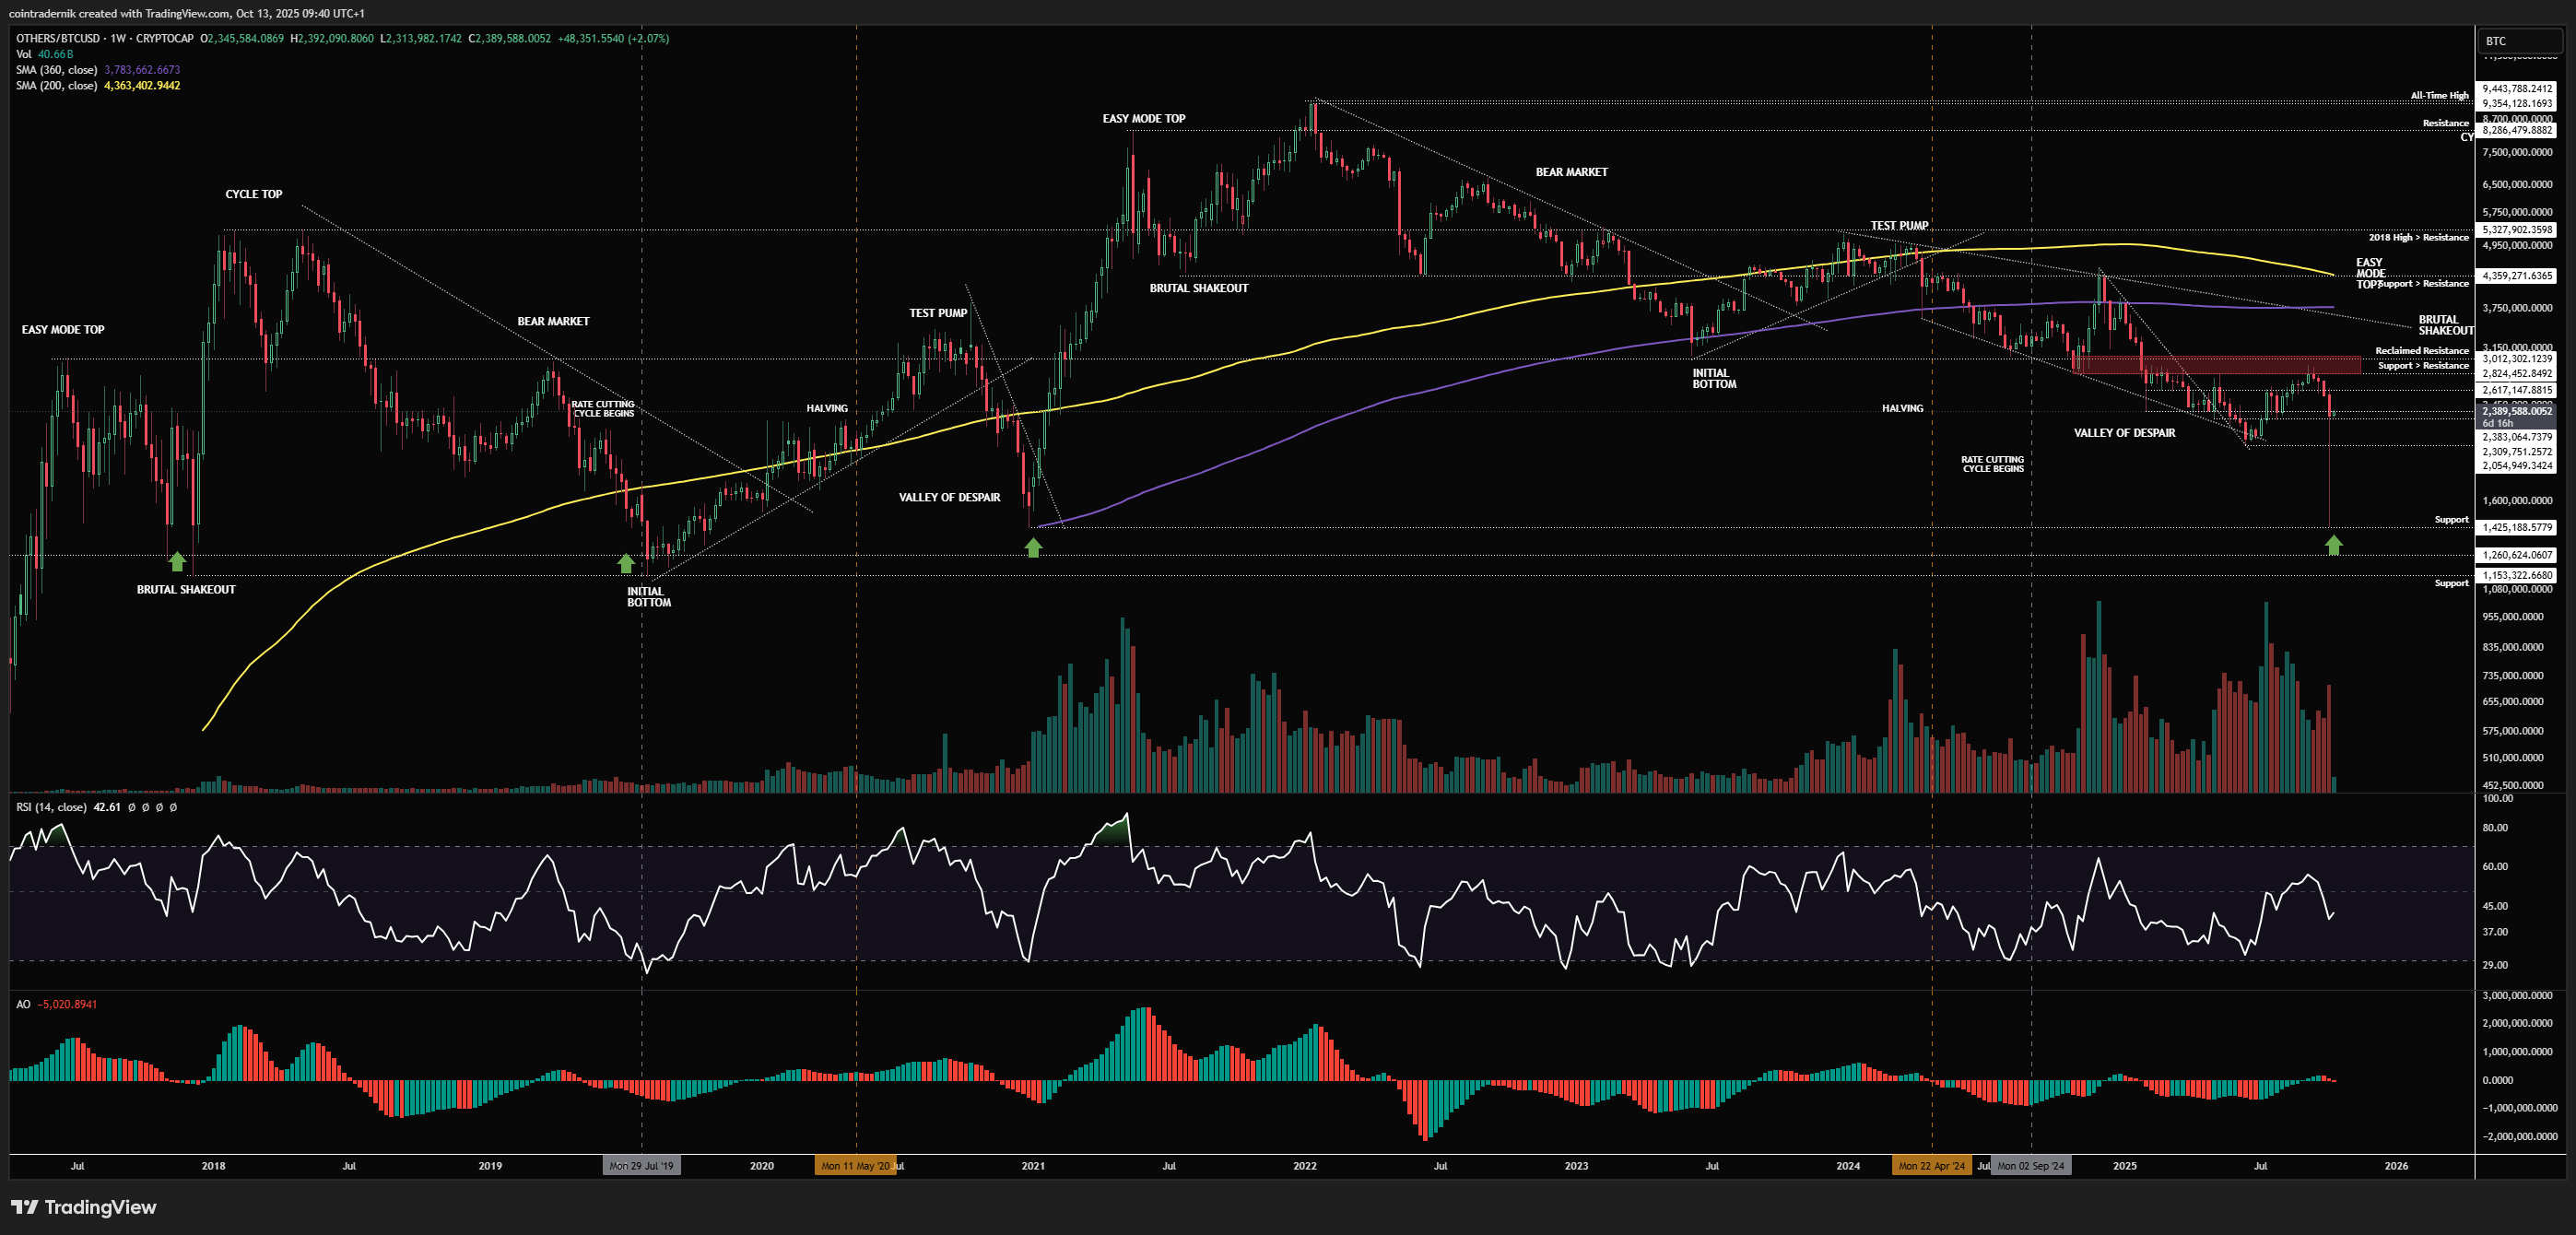
Look at that fucking weekly candle on alts vs BTC. Look at it again. We have never seen a weekly candle quite like that on this index. And look at where it bottomed - right where the December 2020 shakeout bottomed, where the August 2019 bear market bottomed and where the December 2017 shakeout bottomed. It's safe to say you're not getting alts down at 1.4mn BTC again any time soon in my view, and if you were lucky enough to be filled on some stink spot bids then nice work. We then saw alts bounce vs BTC to close right at reclaimed support ~2.38mn BTC. This is a weekly higher-low as it stands and unless we now close the week below 2.055mn BTC, I think it's pretty clear where alts go vs BTC from here; now, obviously if we do close below 2.05mn BTC, this weekly structure is bearish once again and we can talk about filling in wicks and more altcoin decimation etc., but right now this looks exactly like what a cyclical turning point has looked like previously, only even more wild because of the extent of the wick lower. What we now want to see is this support hold and alts move higher vs BTC to finally close a week above that overhead resistance cluster at 3mn BTC: if we see that going into November after this liquidation event, I now think we get an alt season that rivals historical ones, where this OTHERS/BTC index could really push higher. Just look at this chart on the this timeframe: we have been downonly.exe since January 2022 and last Friday - after almost 4 straight years of downonly.exe - we got the largest liquidation even in history for alts. That is equal parts devastating and opportune.
Daily:
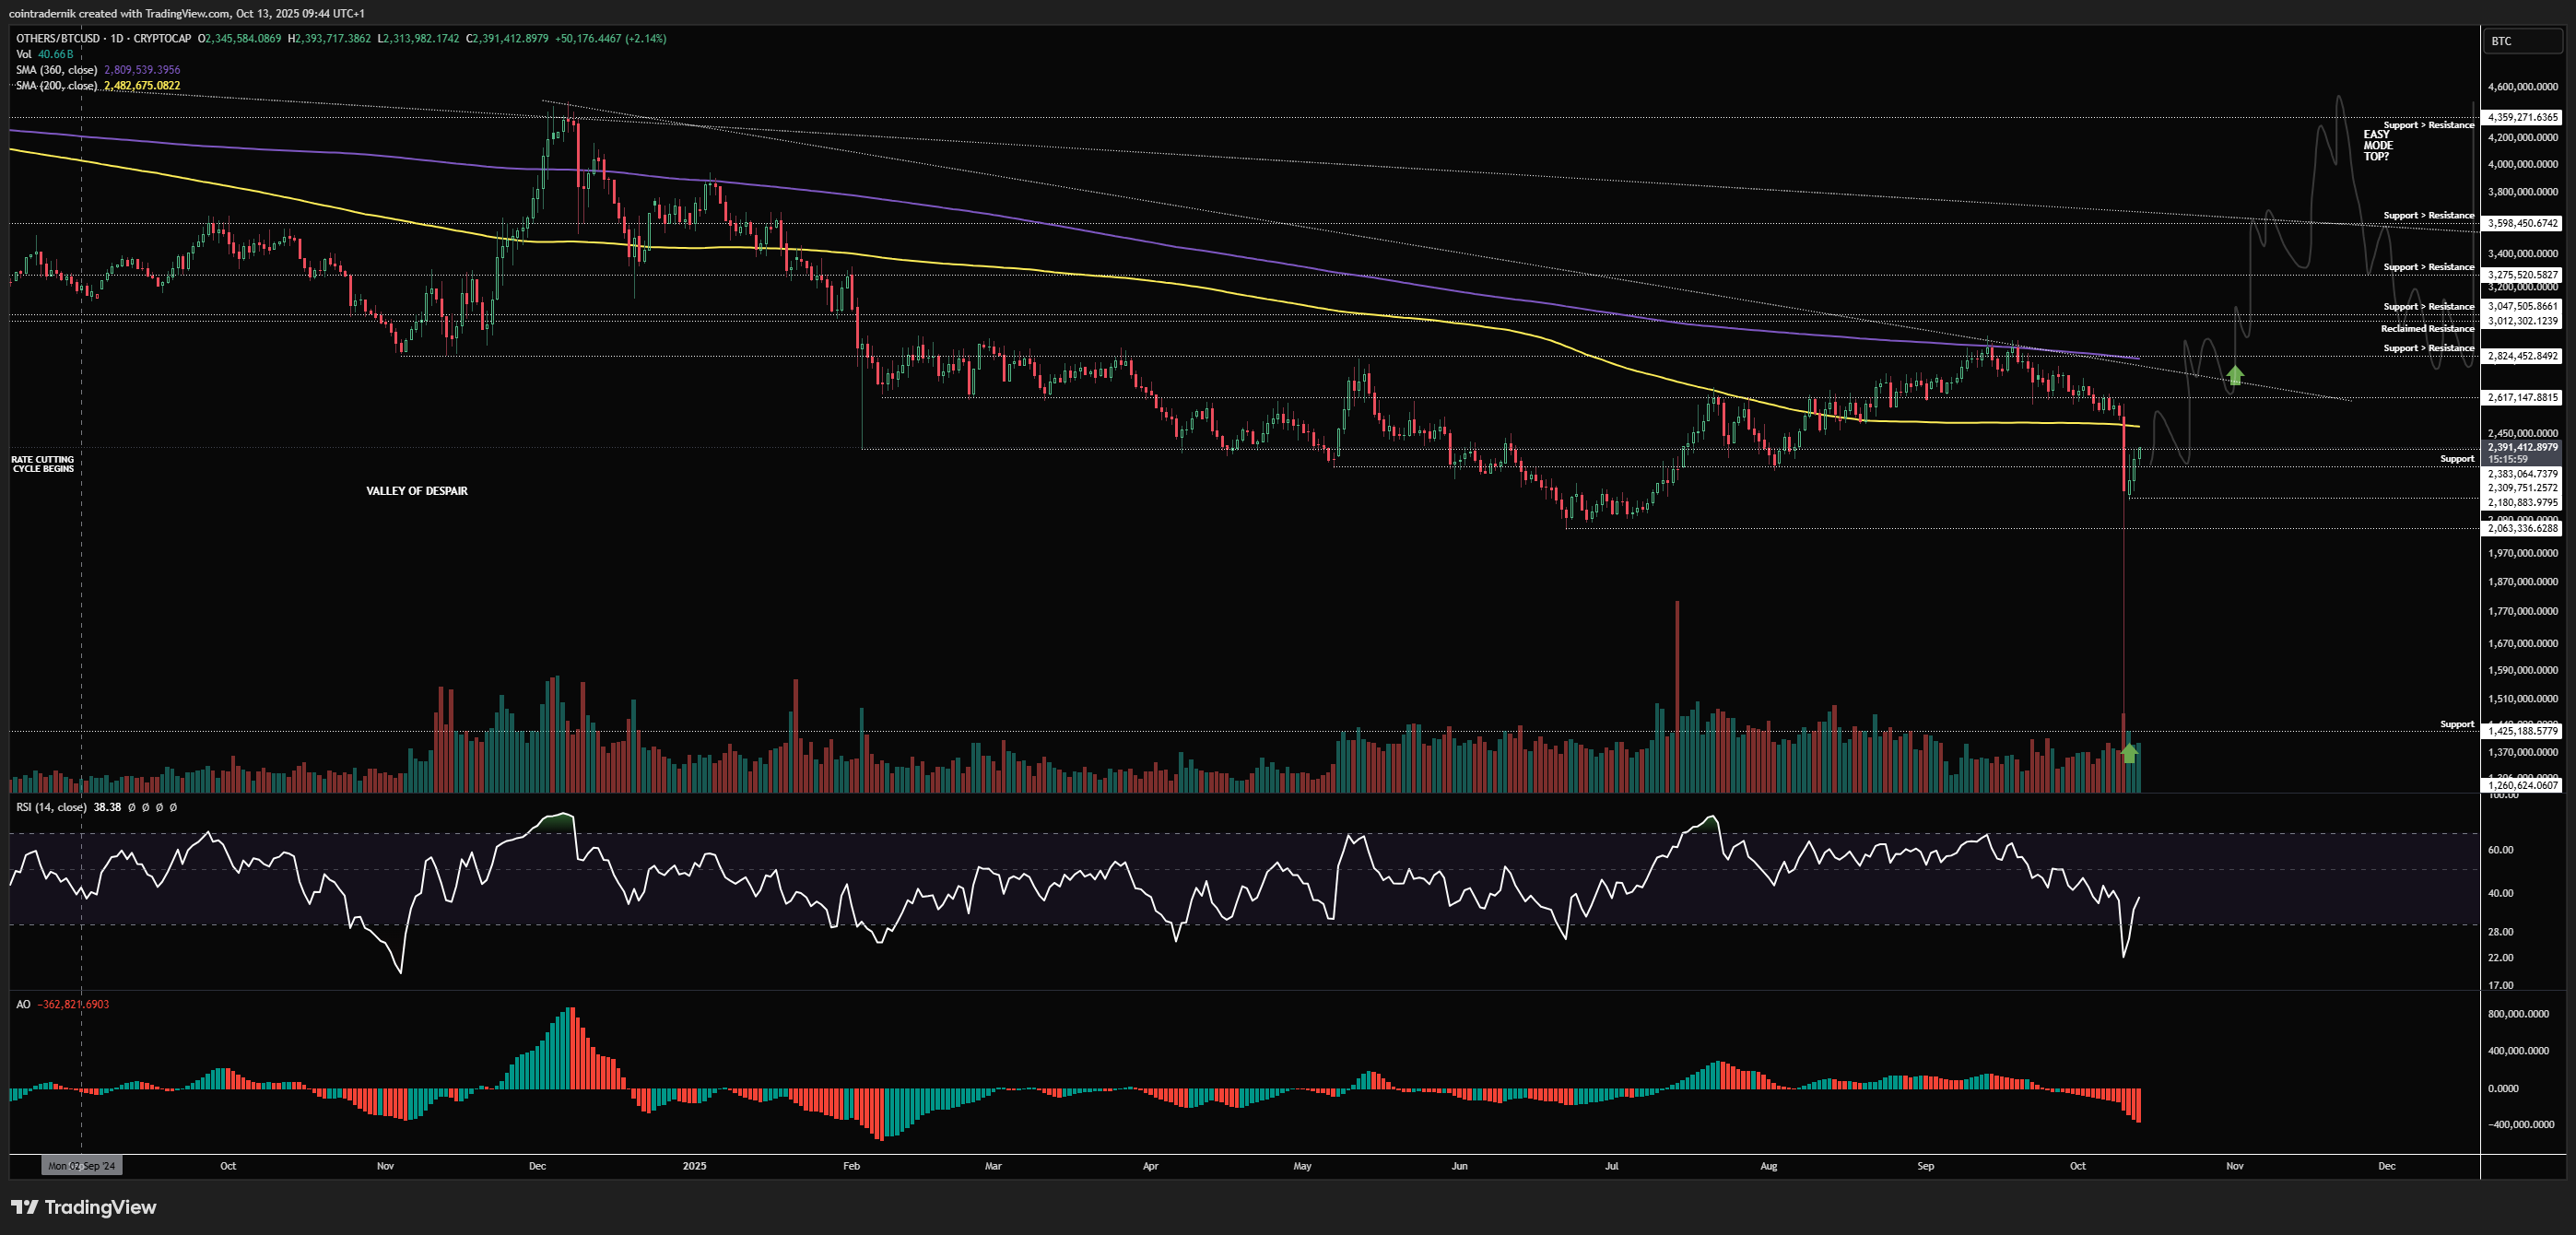
Looking at the daily, what I want to see here is a higher-low above 2.38mn BTC after a push higher, with October then closing above the 360dMA at 2.82mn BTC. Subsequently, I think we rally sharply higher in November, into at least 4.4mn BTC, if not 5mn BTC, before many variables determine the extent of the shakeout into year-end. If we flip 2.05mn BTC into resistance and break lower, this view is invalidated and I'll be selling any spot alts I have because the chart would look significantly worse if after a historical liquidation event, itself after 4 years of downtrend, alts cannot more broadly hold onto bullish structure on the higher timeframes. I just don't think that's the case and I think by December OTHERS/BTC has had several consecutive green candles, with a view towards more of a blow off top in Q1.
I hope you've found some value in the read this week!
And if you've not already signed up for Ostium, please do so and test out some of the recent updates, including:
Sign up here (you don't have to use my ref link, of course): https://ostium.app/trade?from=CL&to=USD&ref=CTNIK

.avif)