

Market Outlook #54
October 6, 2025
-
12
min read


This blog references an opinion and is for entertainment and informational purposes only. It is not intended to be investment advice. Seek a duly licensed professional for investment advice.
In this 54th Market Outlook here at Ostium Research, we'll be taking a look at the week ahead in markets, focusing specifically on price-action, positioning and event risk for Bitcoin, Ethereum, DXY, Gold and altcoins via OTHERS.
Firstly, let's take a look at the calendar for the speech-heavy week ahead:
MONDAY: ECB LAGARDE SPEECH
MONDAY: BOE BAILEY SPEECH
TUESDAY: VARIOUS FED SPEECHES
WEDNESDAY: RBNZ INTEREST RATE DECISION: (CONSENSUS 2.75% VS PREVIOUS 3%)
WEDNESDAY: BOJ GOVERNOR UEDA SPEECH
WEDNESDAY: FOMC MINUTES
WEDNESDAY: VARIOUS FED SPEECHES
THURSDAY: FED CHAIR POWELL SPEECH
THURSDAY: US INITIAL JOBLESS CLAIMS: (CONSENSUS 223K VS PREVIOUS 218K)
FRIDAY: US MICHIGAN CONSUMER SENTIMENT INDEX (OCT): (CONSENSUS 55 VS PREVIOUS 55.1)
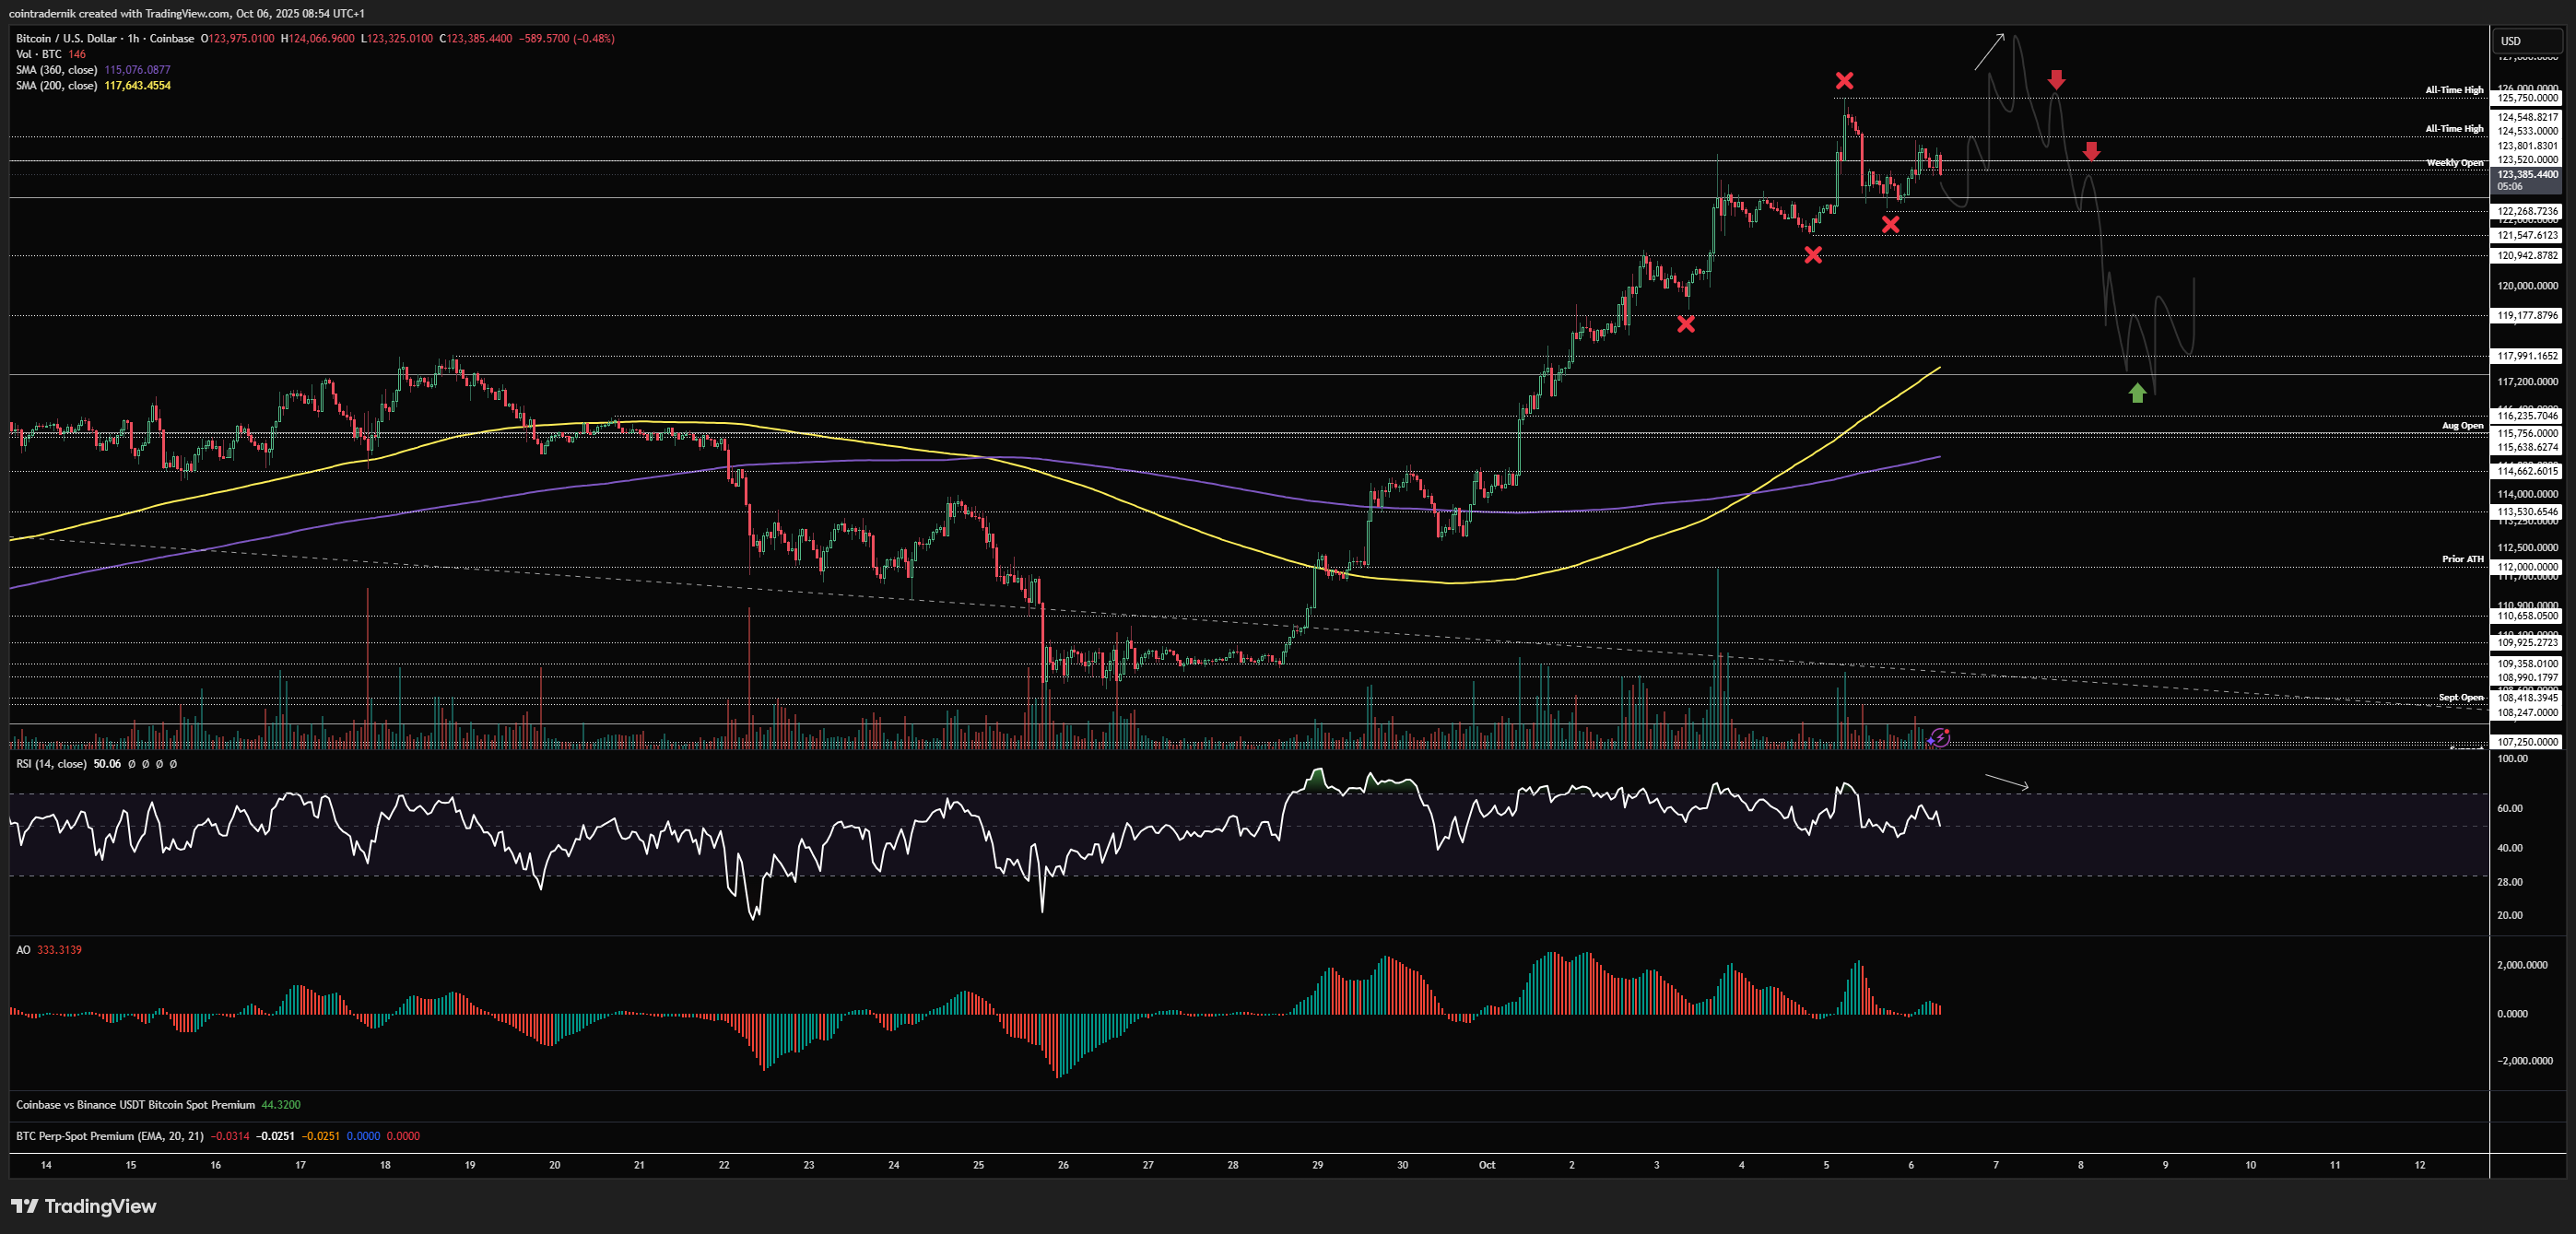
Now, let's dig into asset-specific price-action for the week ahead, looking firstly at Bitcoin:
Price: $123,466
Monthly:
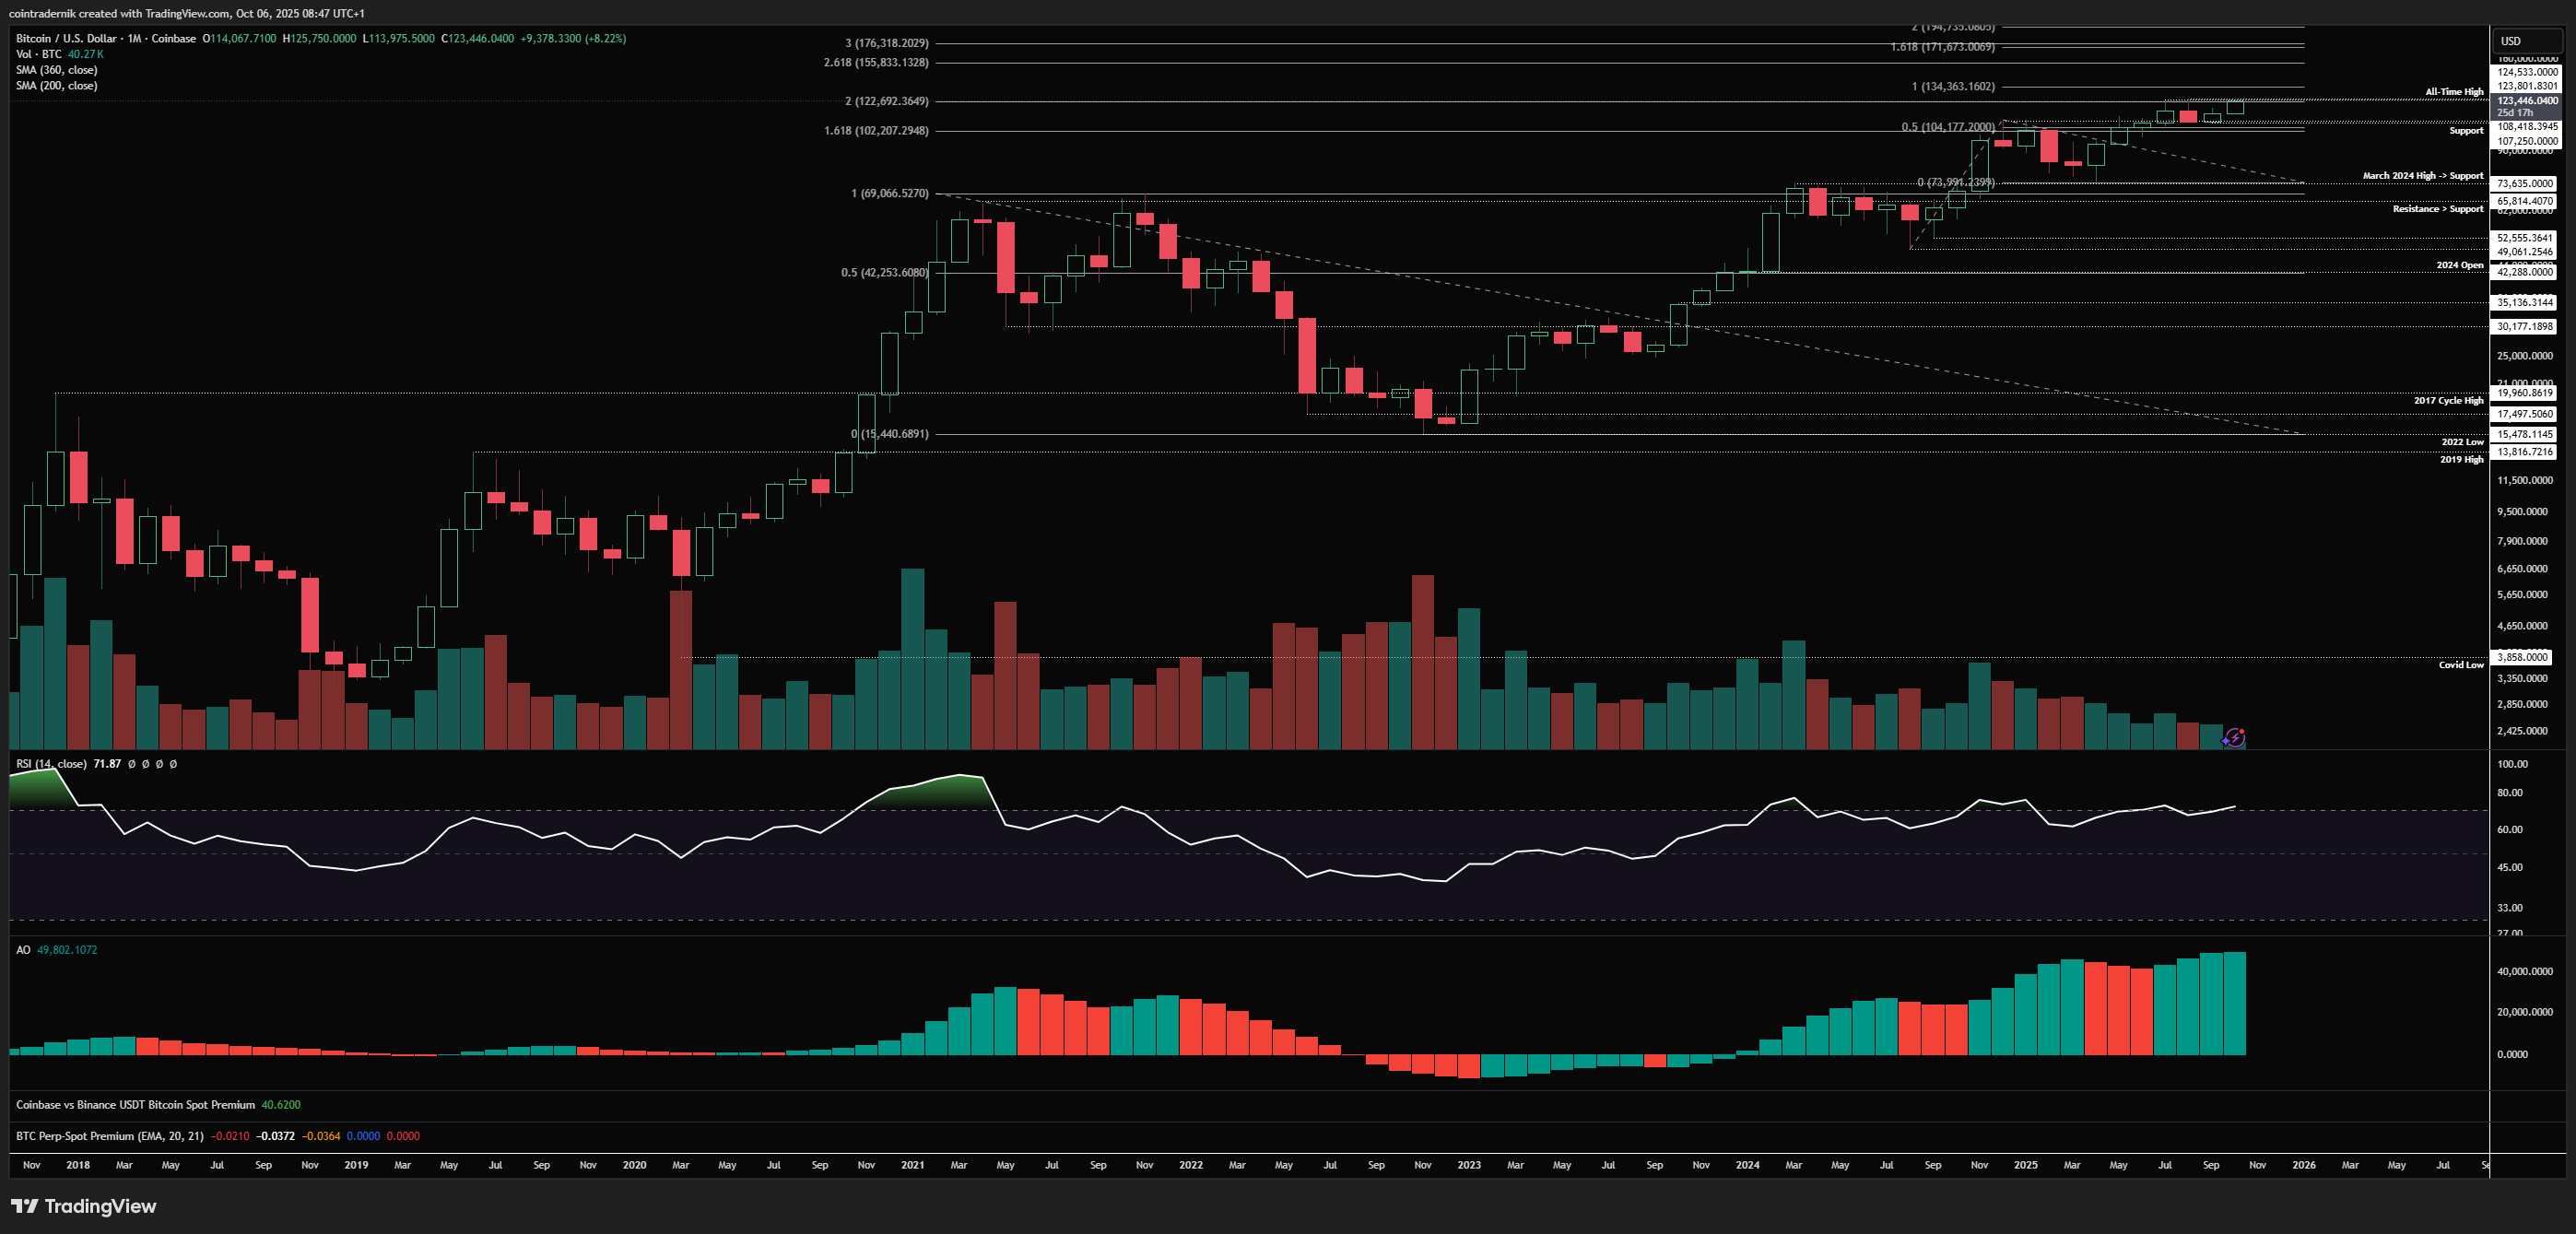
Beginning with the monthly for BTC as we start this final quarter of 2025, we can see that September closed green in spite of consensus expectations, but most importantly it held firm above major support at $104k, pushing into $114k for the close, just shy of the all-time high monthly close. Early price-action in October has been strong, rallying off day one to set the current monthly low at $113.9k and pushing to fresh all-time highs at $125.7k as of yesterday. Monthly momentum continues to be supportive of continuation, which is not what the average market participant was seeing with all the 2021 fractals and monthly divergences on the timeline in September; if anything, momentum now looks ready to ramp higher towards those 'overbought' conditions more resemblant of 2021. The only bearish case now would be an October close below the September open at $107k, which would look like a failed breakout into November and open up significant downside back towards the $74k swing-low on this timeframe. Outside of that, there is nothing bearish about this chart on the monthly timeframe and we should see price push towards some of those overhead fibs, such as the $135k level, followed by the $155k level, with confluence of fibs around $170-$175k.
Weekly:
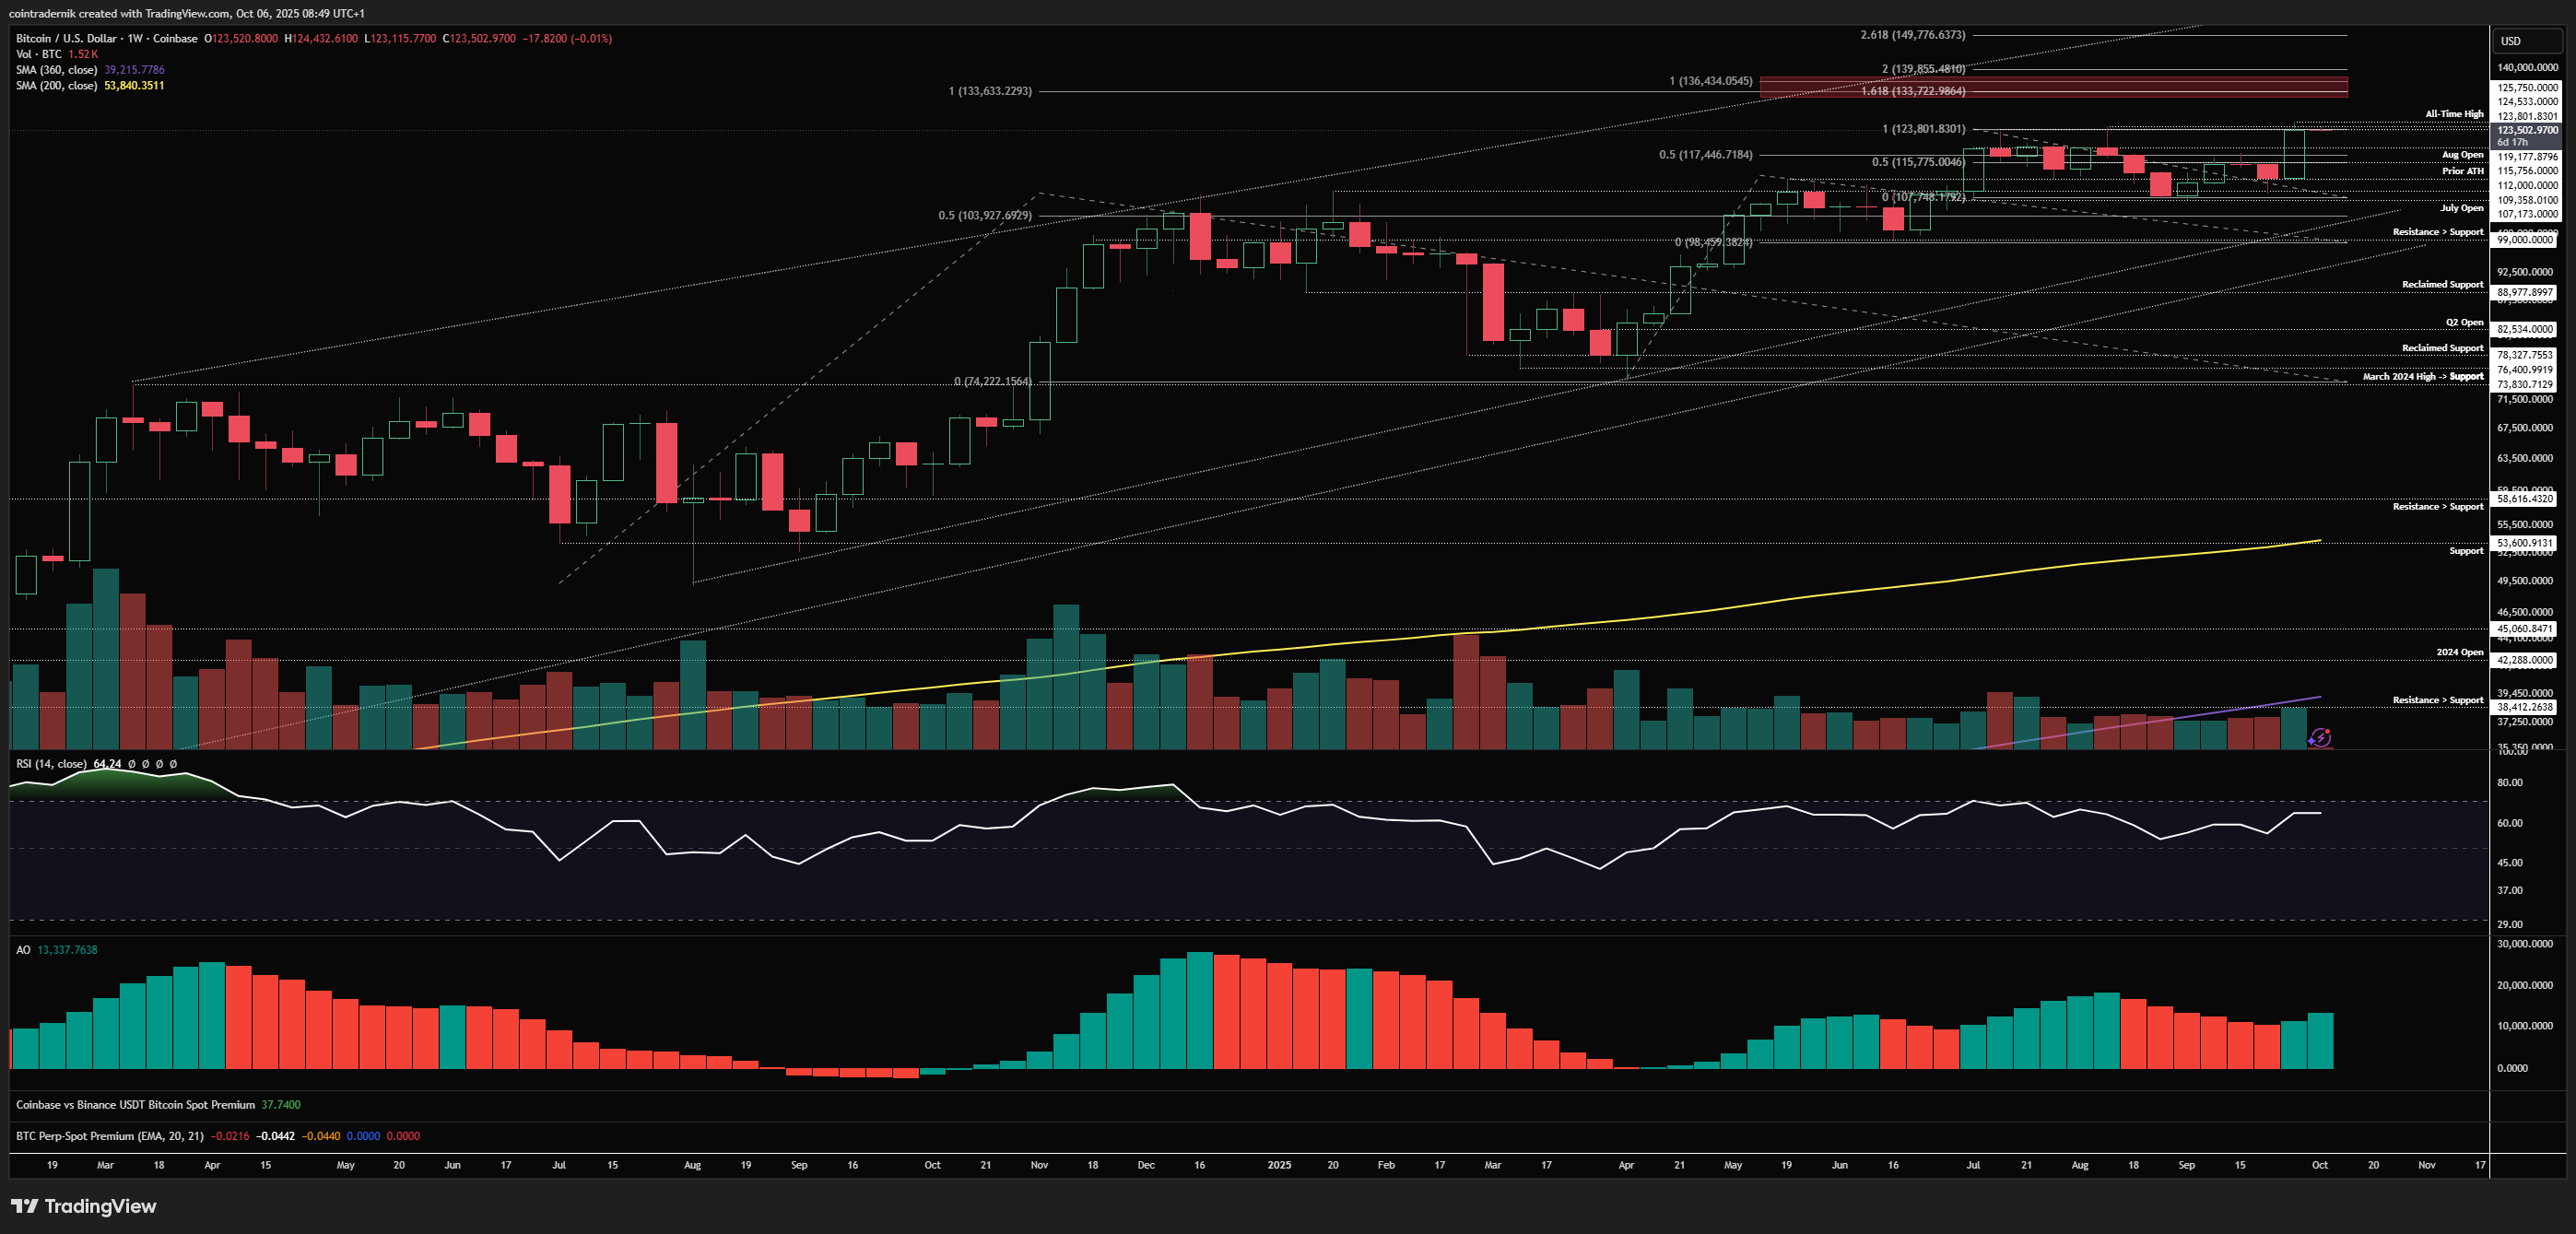
Now, looking at the weekly timeframe, we can see that last week closed extremely strong, with the highest weekly close of all time on growing volume and with weekly momentum having bottomed out above 50 on RSI. Again, nothing bearish about this. If we are to shake out some late longs this week, we should look towards the August open at $115.7k as likely the lowest level you would get, though likely higher prices than this will mark the low as shallow pullbacks are more probable if this breakout is to stick. Now, if some market-wide volatility event occurs this week and we sweep $113.9k to form a fresh October low, that would obviously be a bid and I do not expect any such wick to be durable, but right now I'm placing a low probability on such a pullback this week; rather, my expectation is we retest the $118k region, mark out a higher-low around there and then push towards $134k later this month. Bearish scenario here would be to wick above the $125.7k high then reject and close this week back below the August open at $115.7k, opening up downside through $113.9k next week into $107k again.
Daily:
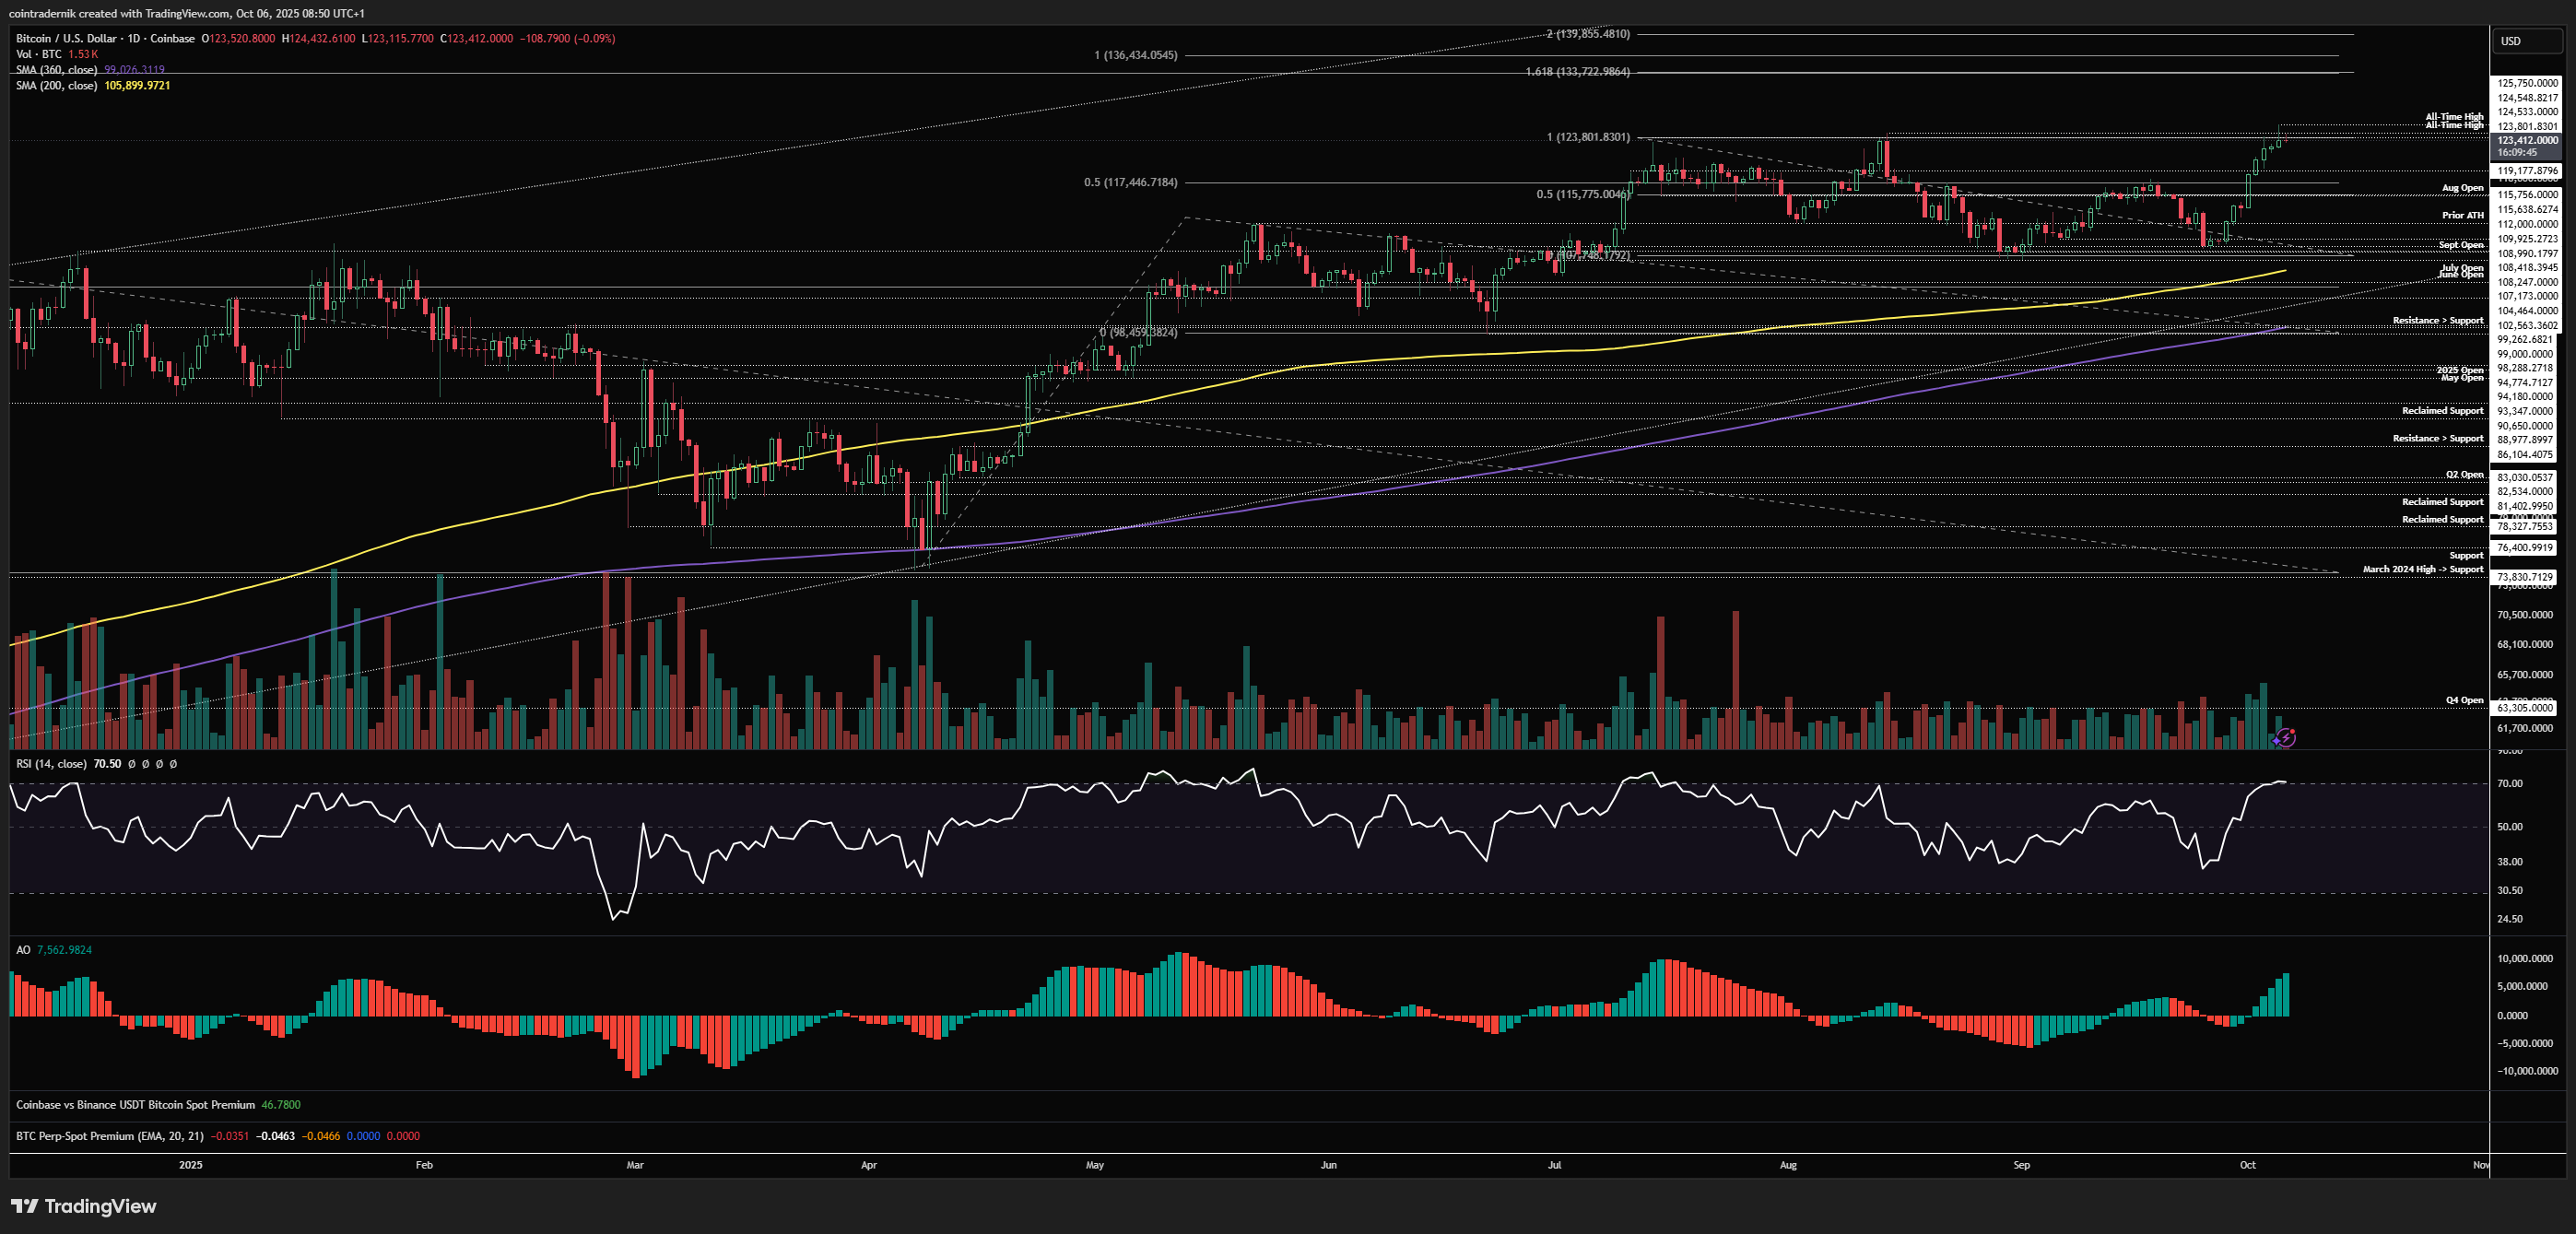
Looking at the daily, we can see how price rallied sharply off the close through the August open, breaking through all resistance levels and pushing into $123.8k before consolidating right at all-time highs and then pushing through yesterday, though it closed the daily marginally below $123.8k resistance. Nonetheless, this is strong price-action, and we should now see a higher-low form above that August open in my opinion, where we might take out the weekend lows into $119k, sweep that level and then push higher from there. If we are not to get that early weekly pullback, we want to see a daily close above $124.5k as the prior high to confirm continuation higher, where there is no real resistance until we hit those 1.618 extension fibs above $133k. Nothing else to add here for now...
Looking at setups for the week, for the high probability long you obviously want to see that Sunday high left untapped at $125.7k -> price to take out the weekend lows through $119k and look for lower timeframe exhaustion around there to ladder in bids above that August open early this week, looking for continuation into $126k and beyond subsequently:
On the short side, you want to see the weekend lows left untapped and price to rally higher today through the $125.7k high, form momentum divergence above the high and then reject and break back below the high, looking to fade that and add back below the weekly open for a sweep of $119k:
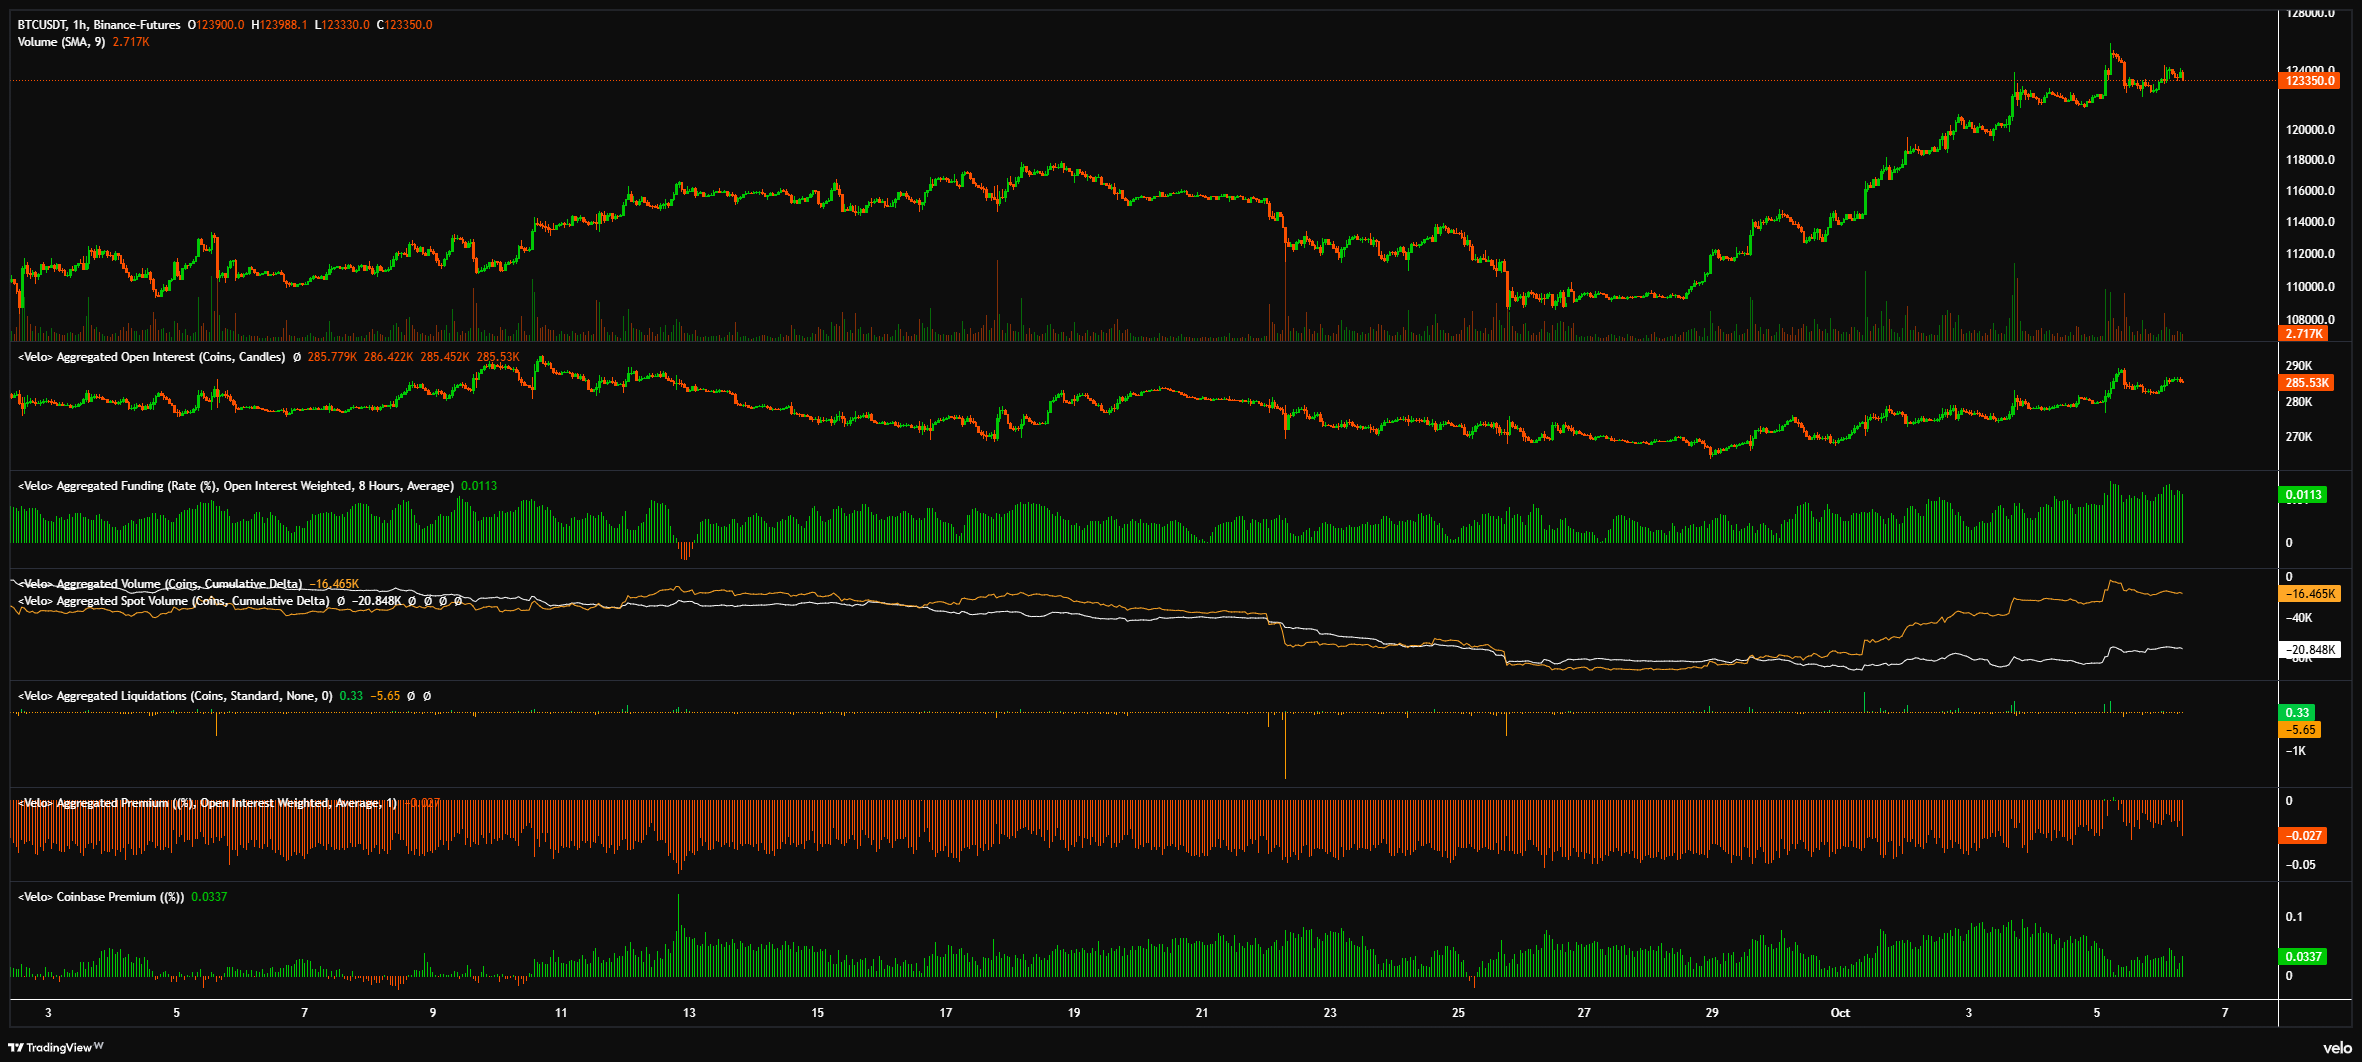
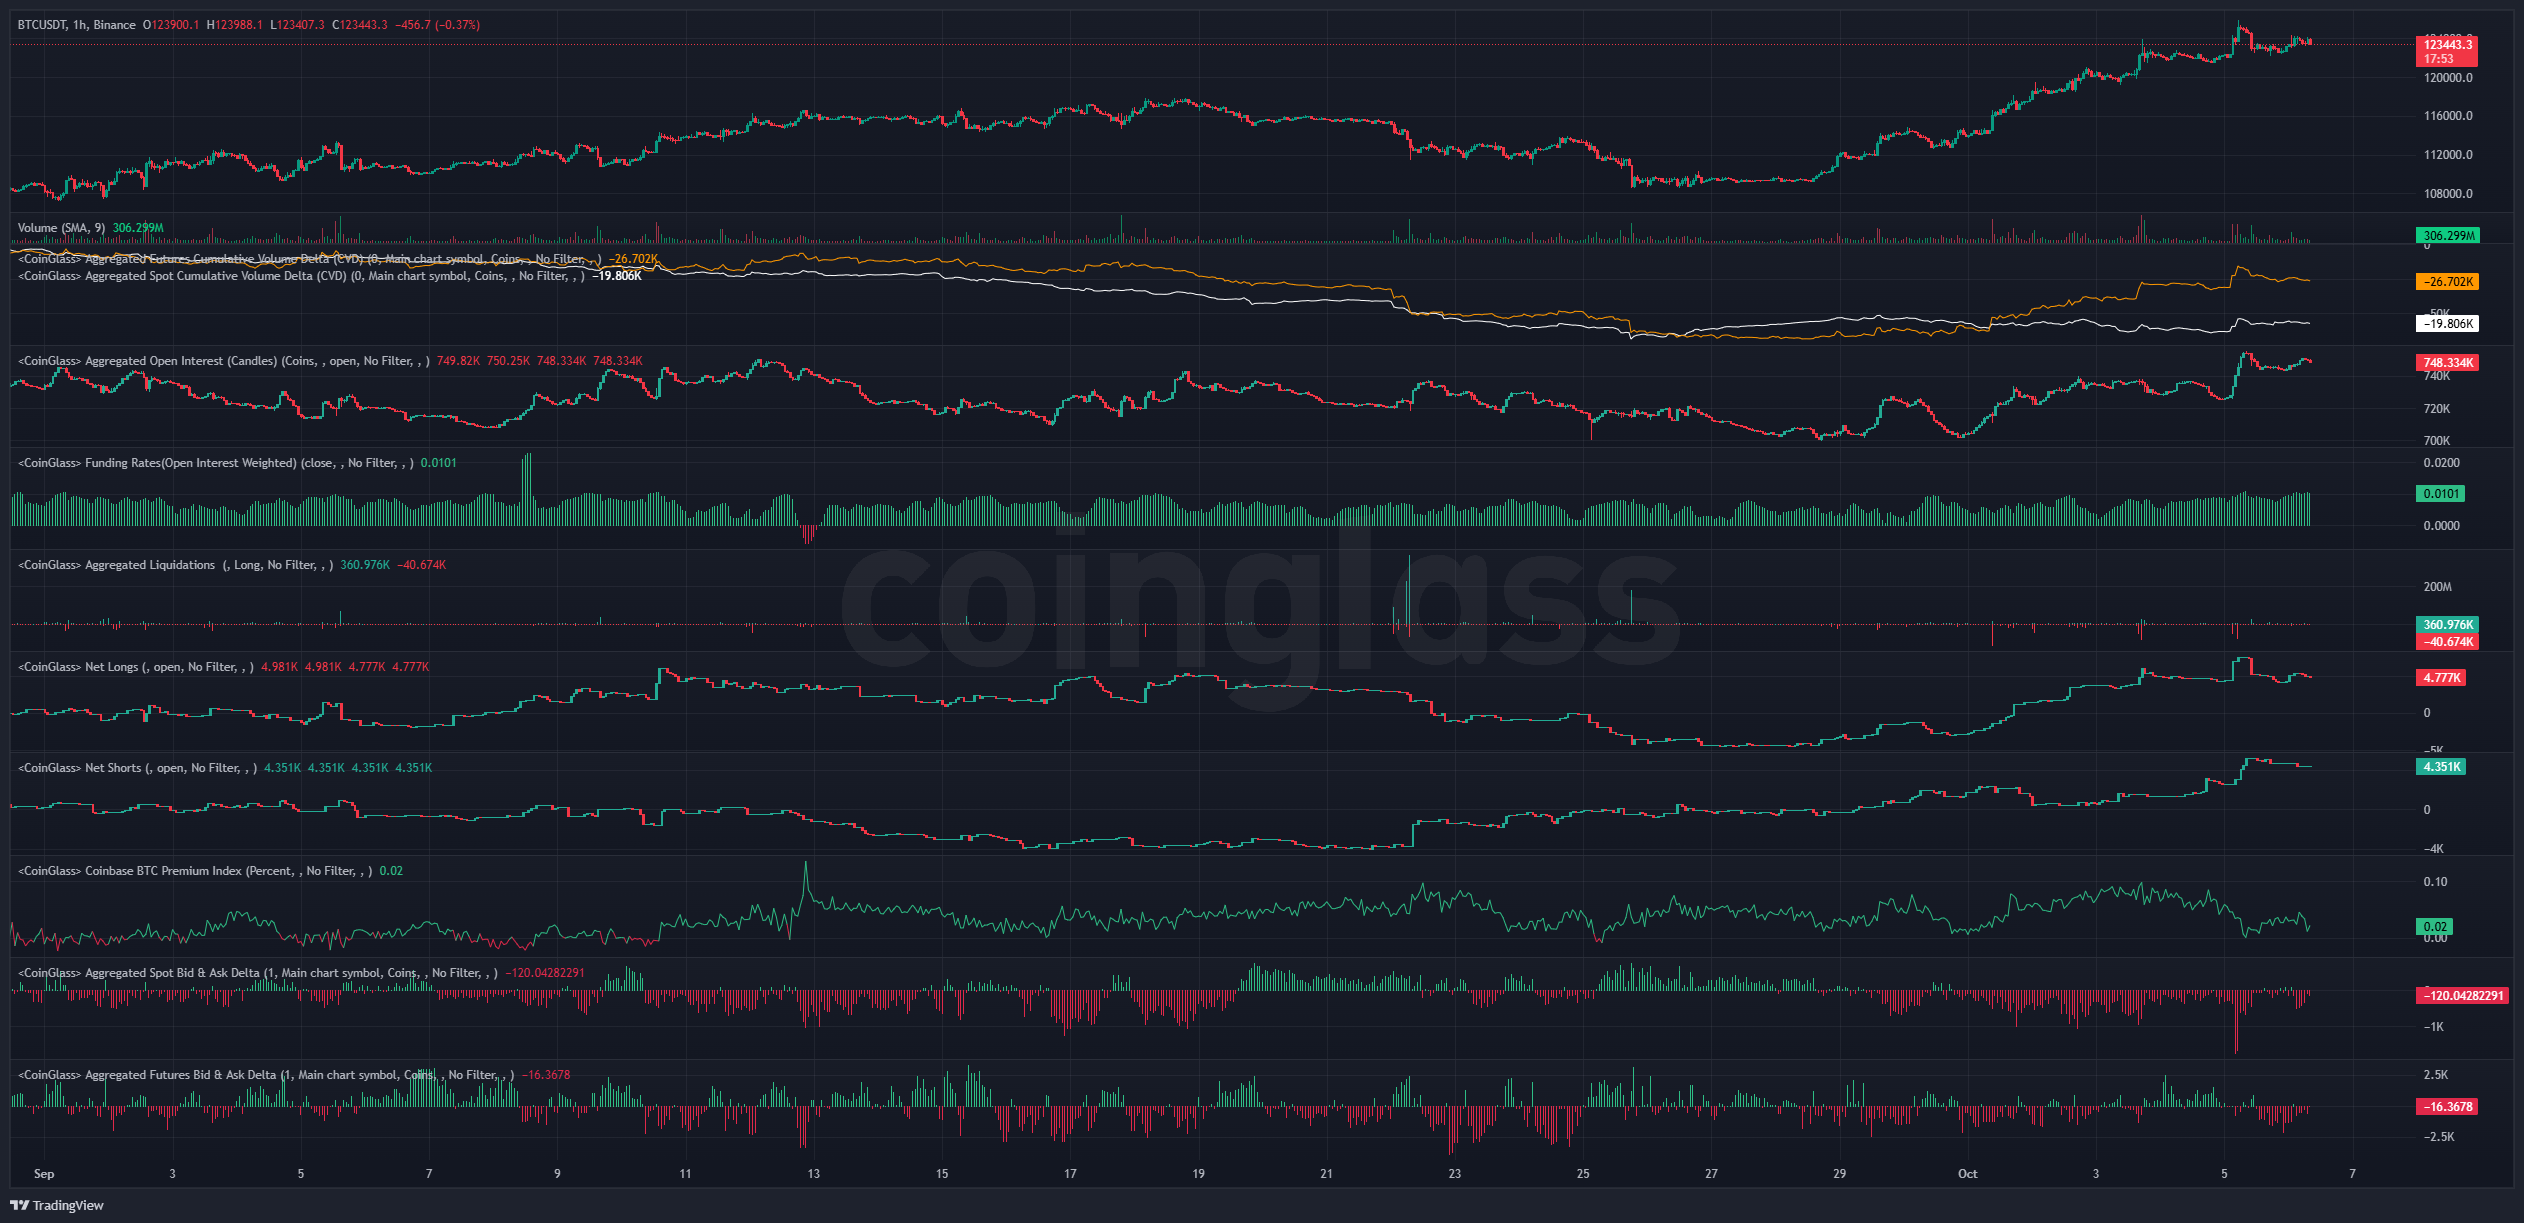
And here's a snapshot of positioning across Velo and CoinGlass:
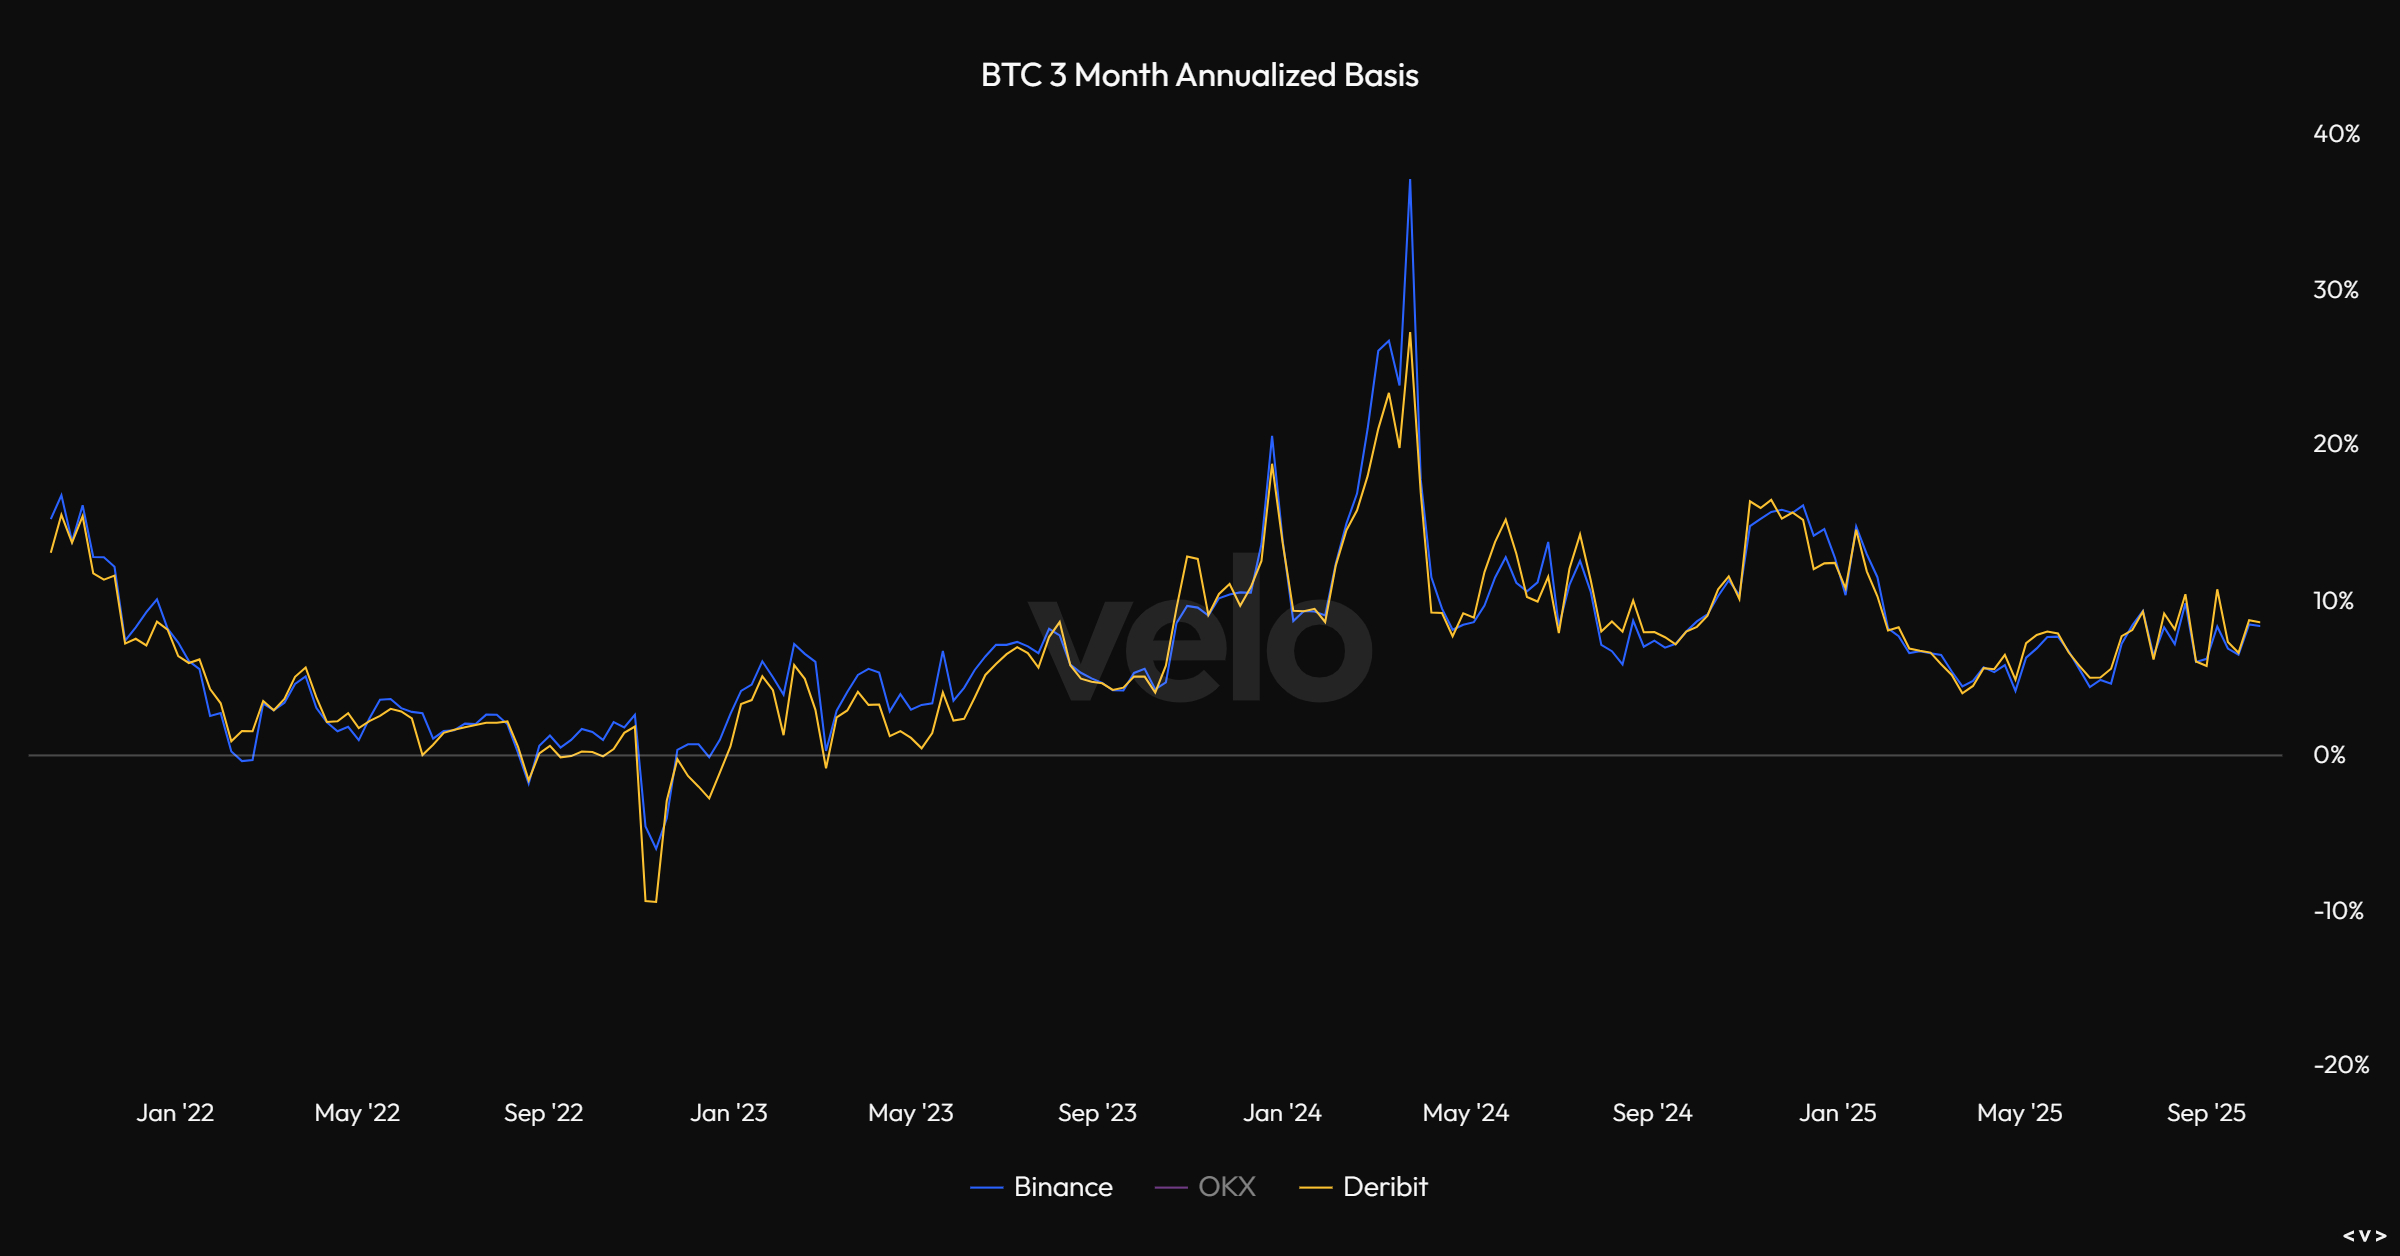
And here's 3-month annualized basis:
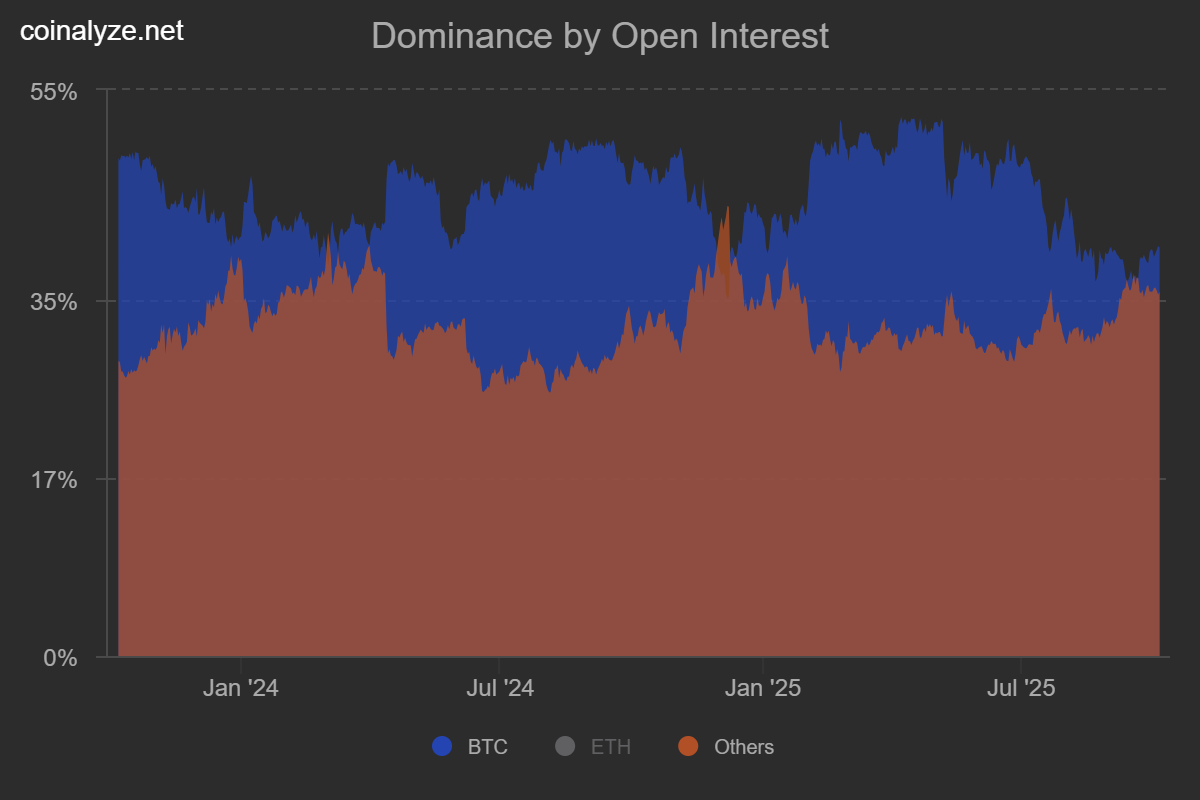
And Bitcoin OI vs Altcoin OI:
And finally some of the expected 1-week and 1-month liquidation levels:
-2025-10-06_08_40_30.png)
-2025-10-06_08_39_50.png)
Price: $4551
ETH/USD
Monthly:
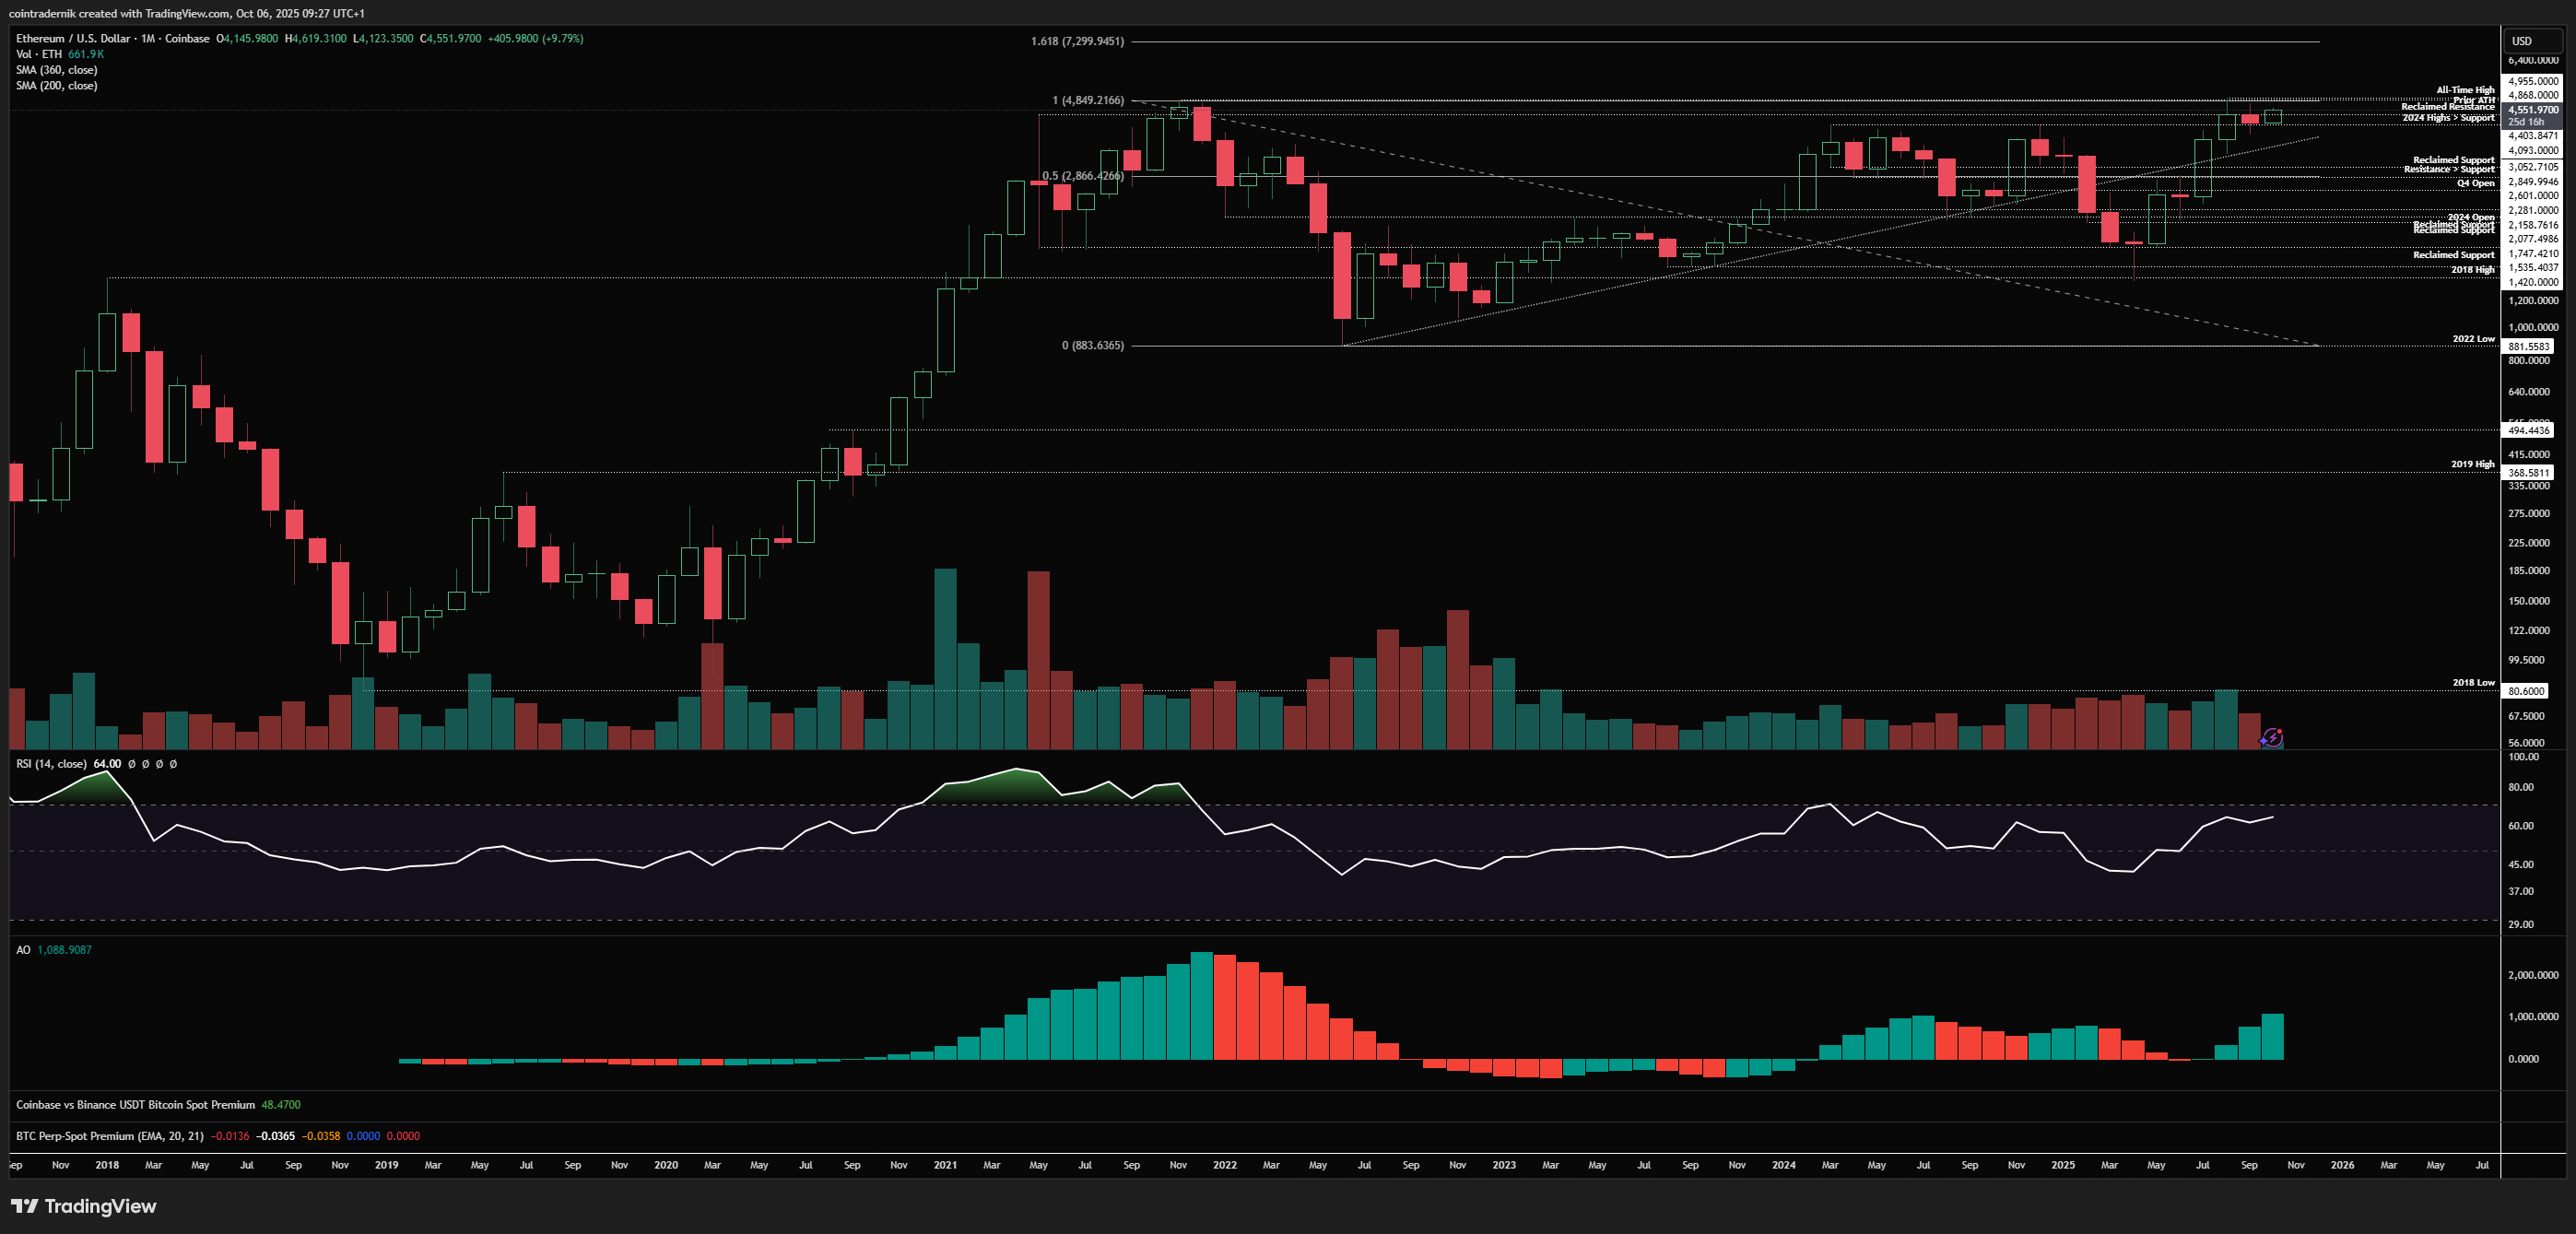
Beginning with the monthly for ETH/USD, we can see that price closed September marginally red after pushing fresh all-time highs in August, consolidating within the August range but holding above the multi-year resistance turned support at $4093 into the close. Volume was lower last month as one would expect of an inside month consolidation but monthly momentum looks poised for a breakout beyond 70 on monthly RSI, which has not been breached all cycle. Early October price-action has seen ETH bounce off the monthly open at $4145 into $4620, now sat around $4550. It is my expectation that October sees ETH push through $5000 resistance and enter a period of price discovery, where a monthly close above that level would open up a very strong November, with the 1.618 extension of the bear market up near $7300.
Weekly:
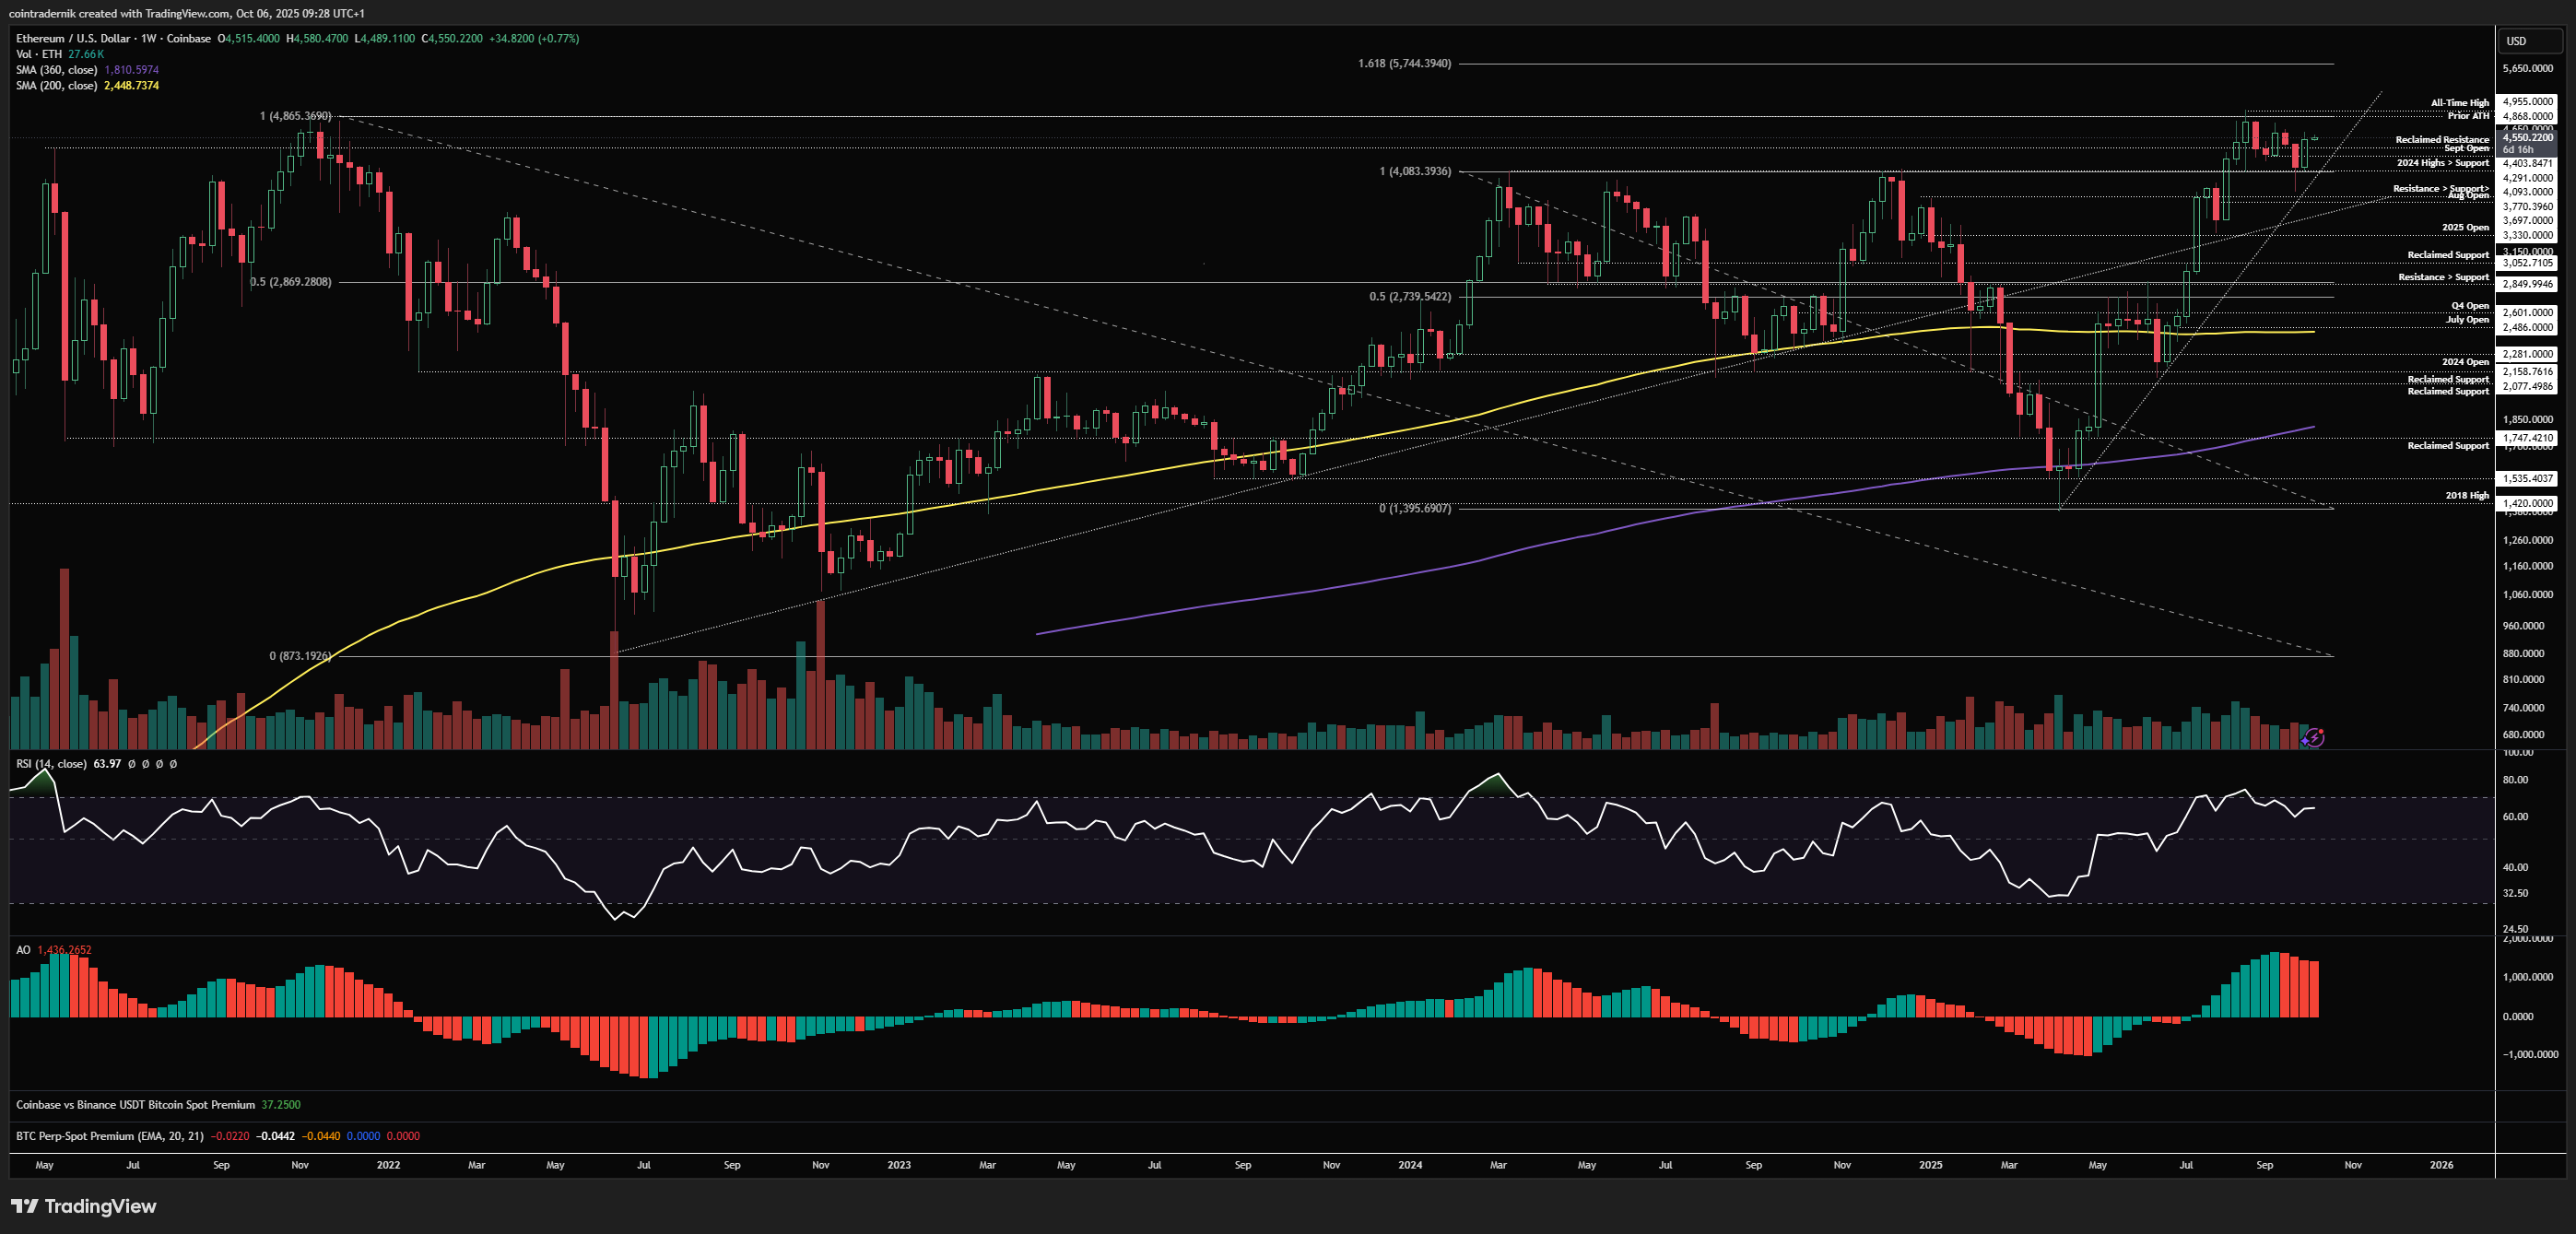
Looking at the weekly, we can see that price held above trendline support from the yearly lows after sweeping $4090 into $3770 support and bouncing to close back above the level. Price then confirmed this as a bear trap in my view by bouncing hard off that support last week to close at $4515, back above the September open. Any breakdown shorts below $4090 are now trapped and we should see price continue to squeeze higher from here into $4870 and then beyond to fresh all-time highs, where pull-backs into $4300 should be viewed as opportunities to get long. Invalidation on this view would be a weekly close below $4090 and trendline support. The next major target is $5750.
Daily:
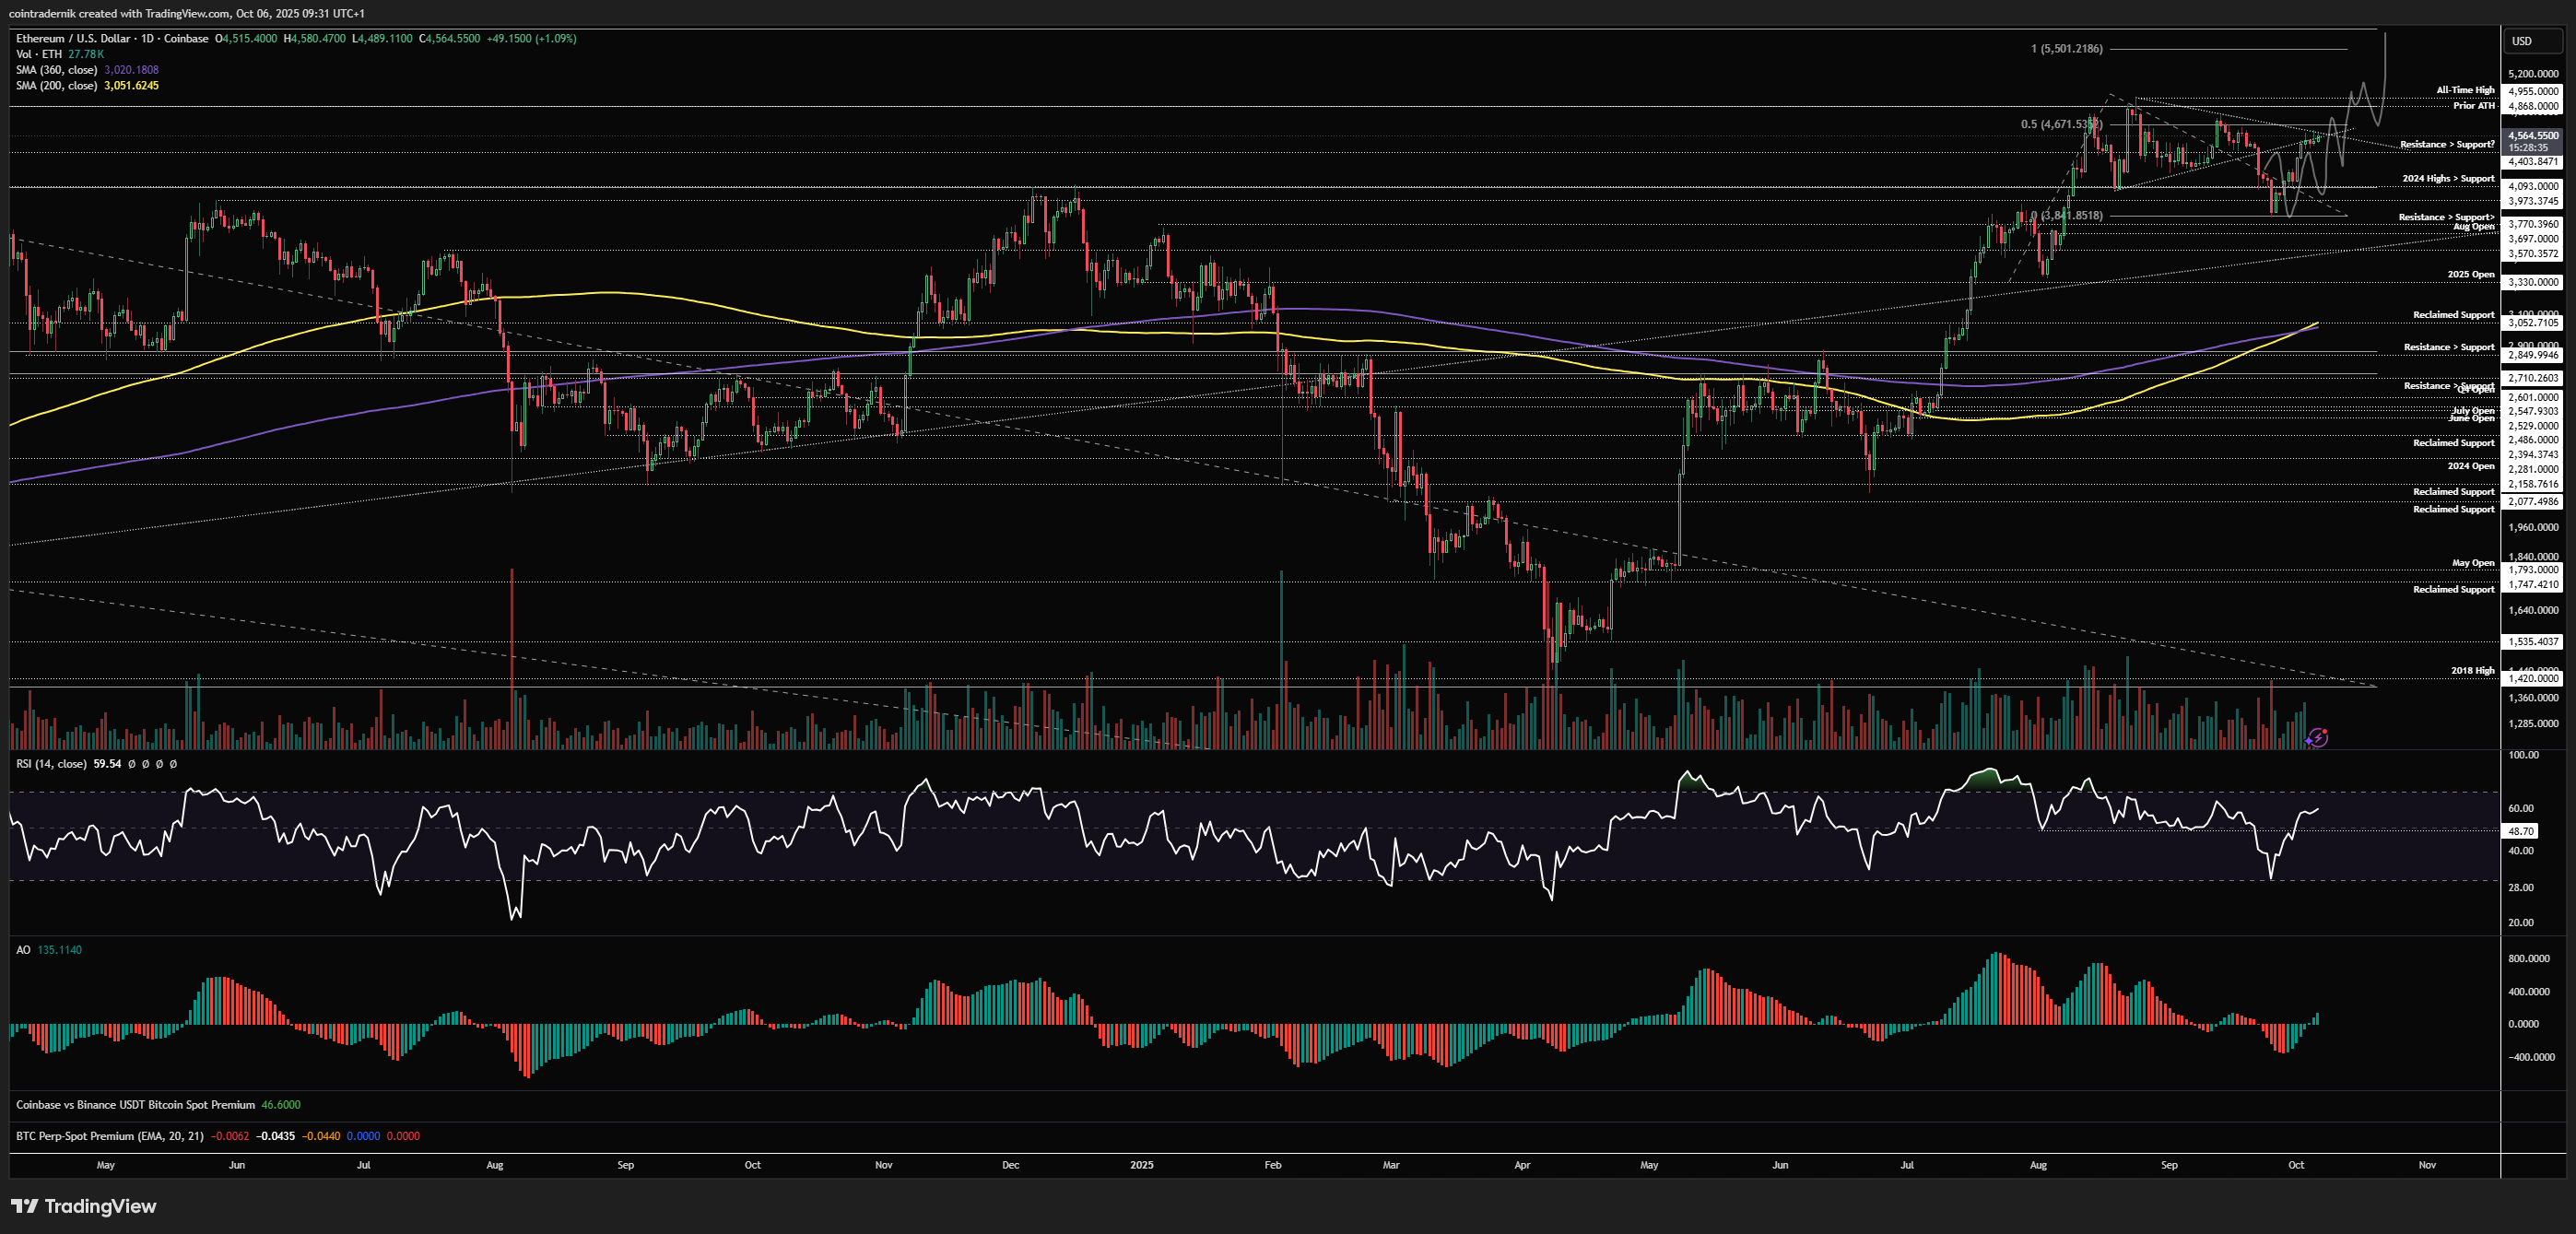
Dropping into the daily, we can see that the more probable scenario highlighted a few weeks ago is playing out pretty tightly so far, where the more bearish scenario was, in my view, invalidated when price failed to turn $4090 into resistance after that break below the level, with the daily RSI reclaim of 50 confirming this. We are now pressing up against local trendline resistance, with local support below at $4400. I do think there's a good chance we move lower to form a higher-low above $4090 this week before breaking out above this trendline and then retesting $4900 next week. This is pretty much exactly that ascending triangle fakeout scenario I had outlined in September. If we can accept above $4670 next week, I think the next attempt at an all-time high breakout will be successful and we trade towards $5500 as minor resistance, followed by $5750 later this month.
ETH/BTC
Monthly:
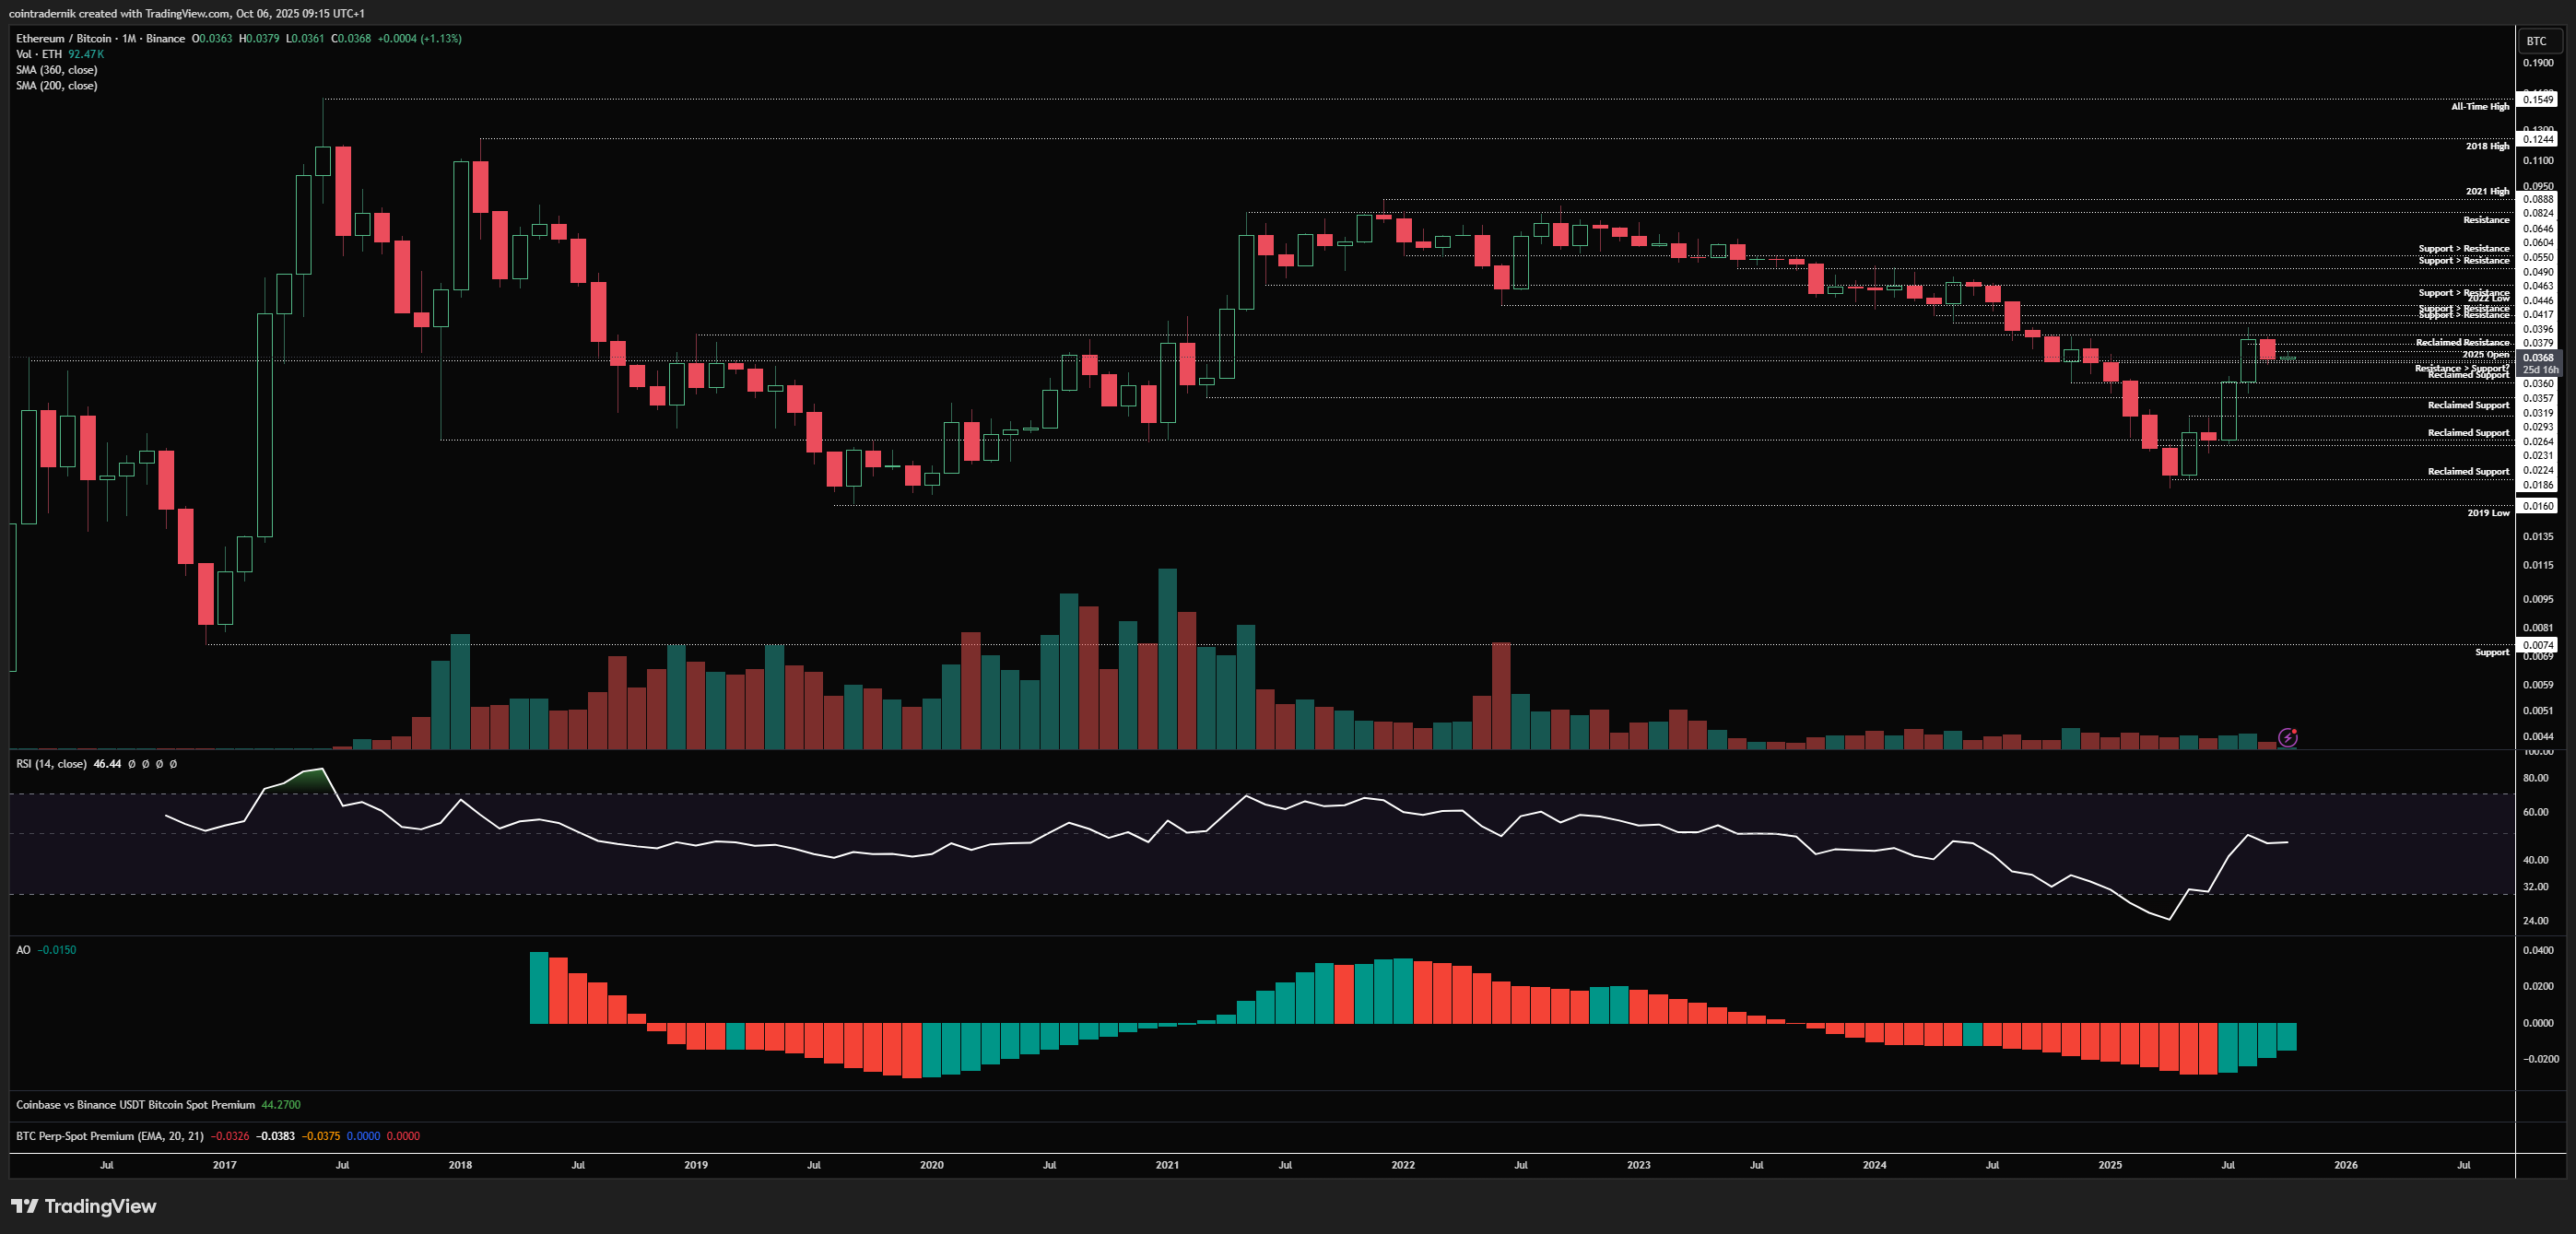
Looking at the monthly for ETH/BTC, there really isn't a huge amount to say here to be honest. We saw a very strong August followed by an inside month in September on low volume, as the pair consolidates below key resistance with monthly RSI sat just shy of 50. We should see continuation higher this month for ETH/BTC, with a monthly low below the September low likely, but I expect 0.032 to hold firm as support. A monthly close above 0.0417 would be confirmation of November expansion towards 0.055.
Weekly:
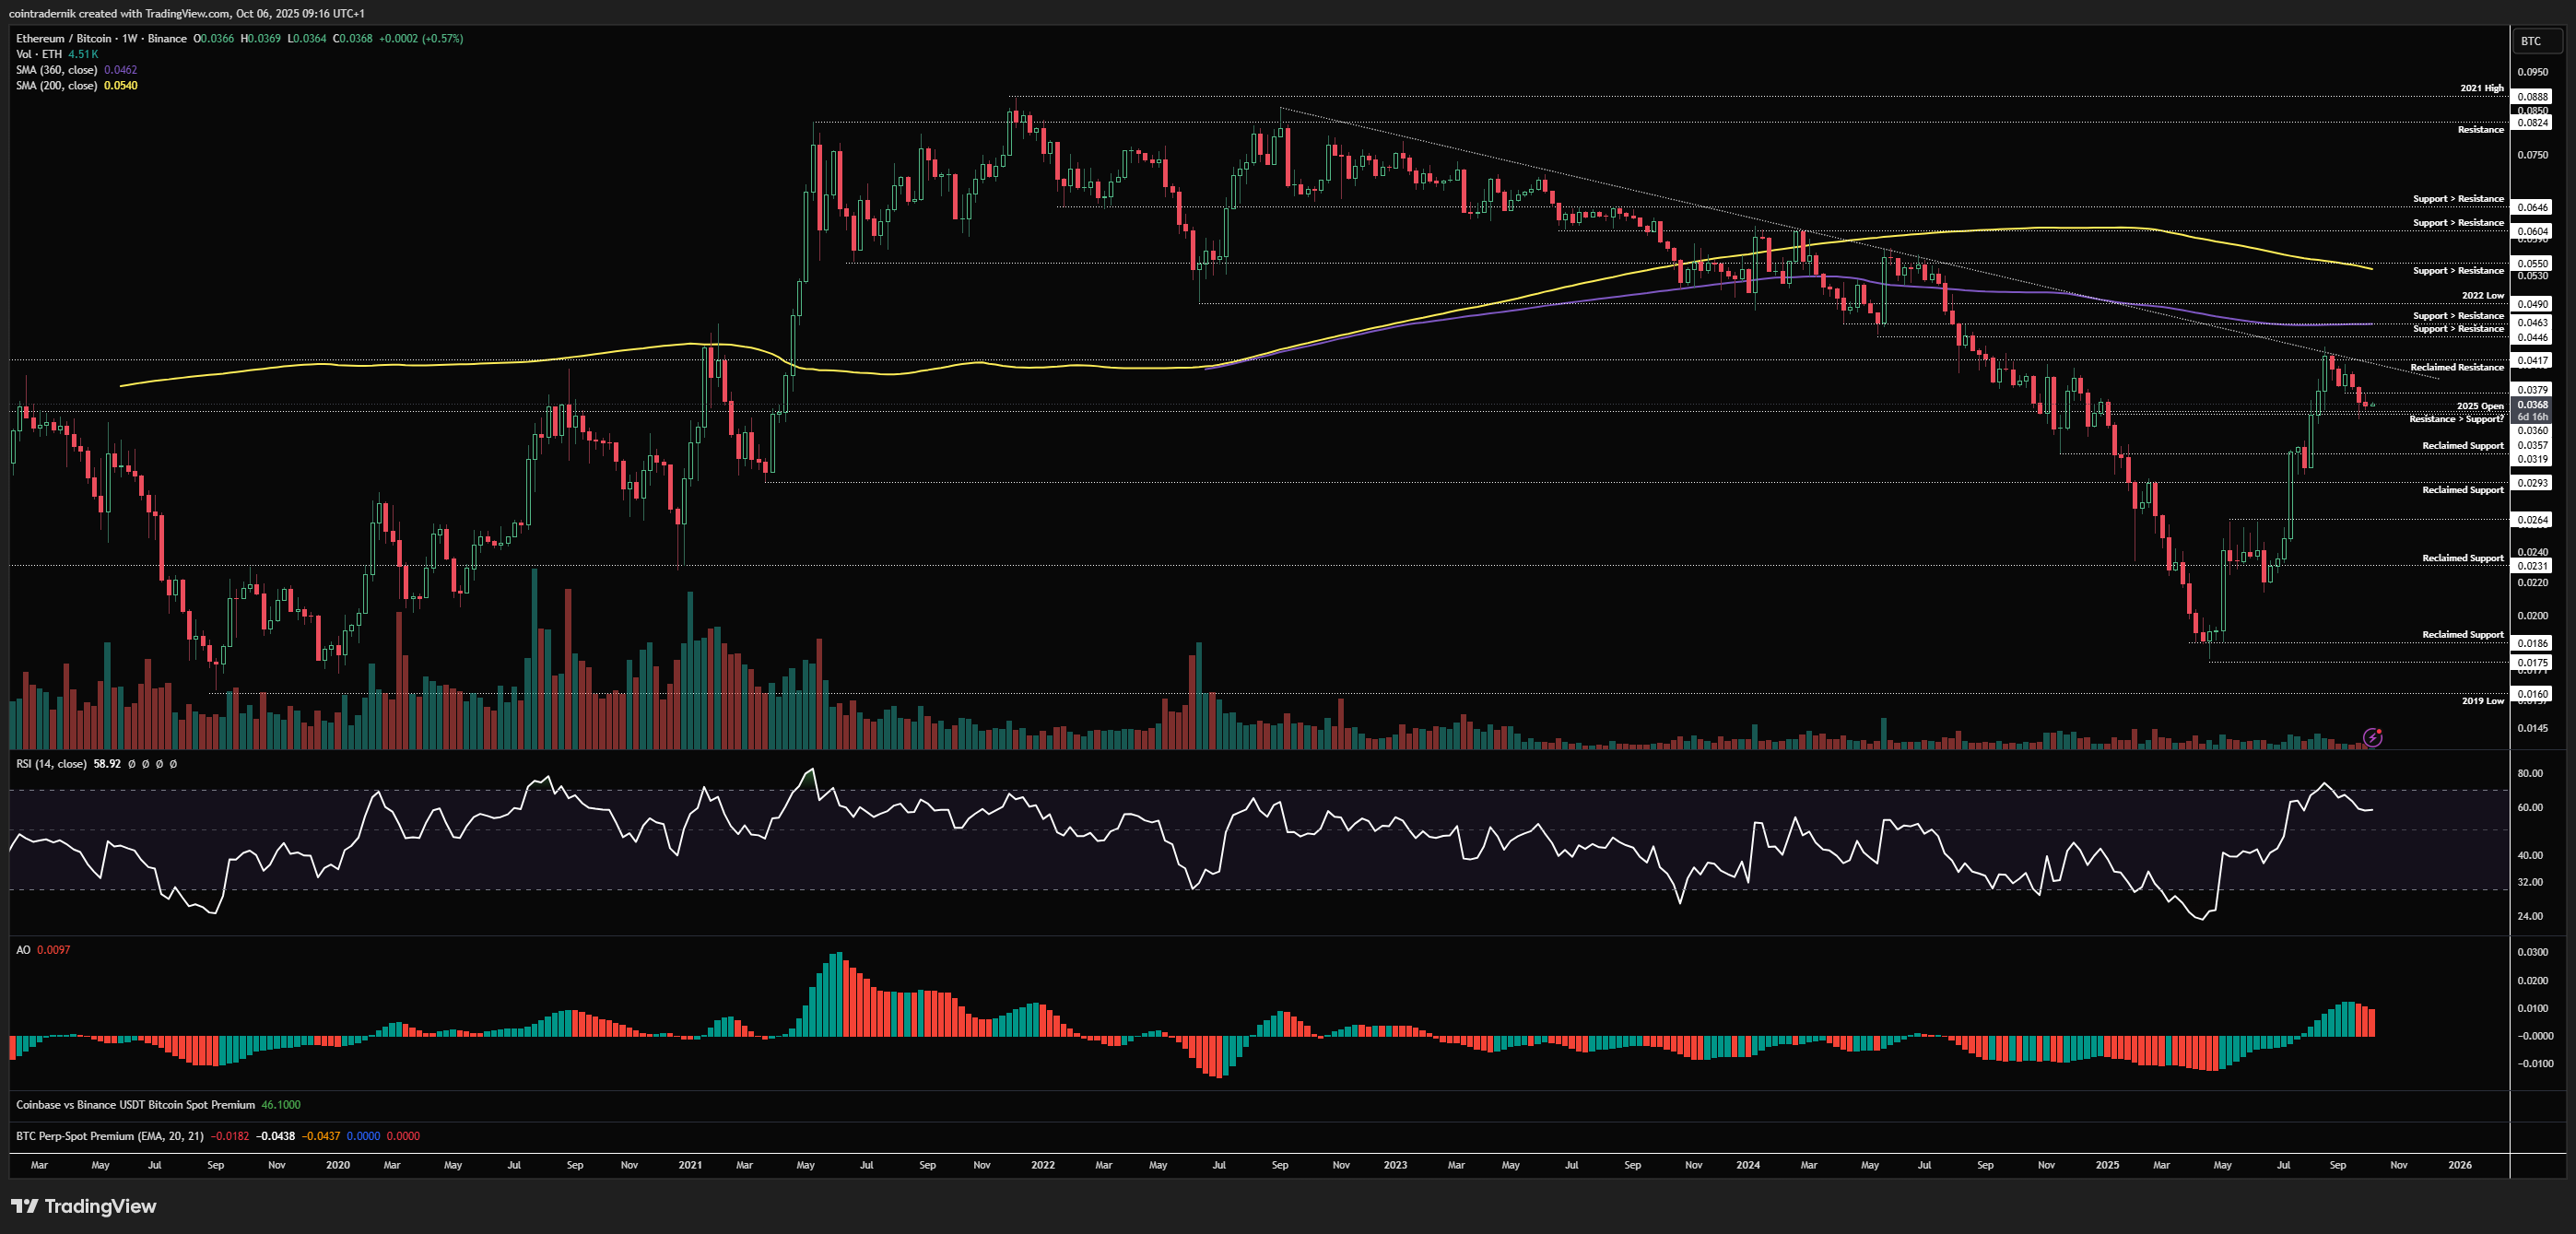
Turning to the weekly, we can see weekly momentum has come off a little as price has retraced this past couple of months, with last week consolidating above the yearly open and below 0.0379 as local support turned resistance. I think there's a decent chance we sweep that low below the yearly open and form a swing-low between 0.033 and 0.0357 for October, bouncing higher from there into a multi-year trendline retest, where flipping that into support and pushing through 0.0417 is likely where we see what might be considered 'the Banana Zone' for ETH, with 0.055 as the 200wMA the main target beyond. Nothing bearish here unless this loses 0.0293 to be honest.
Daily:
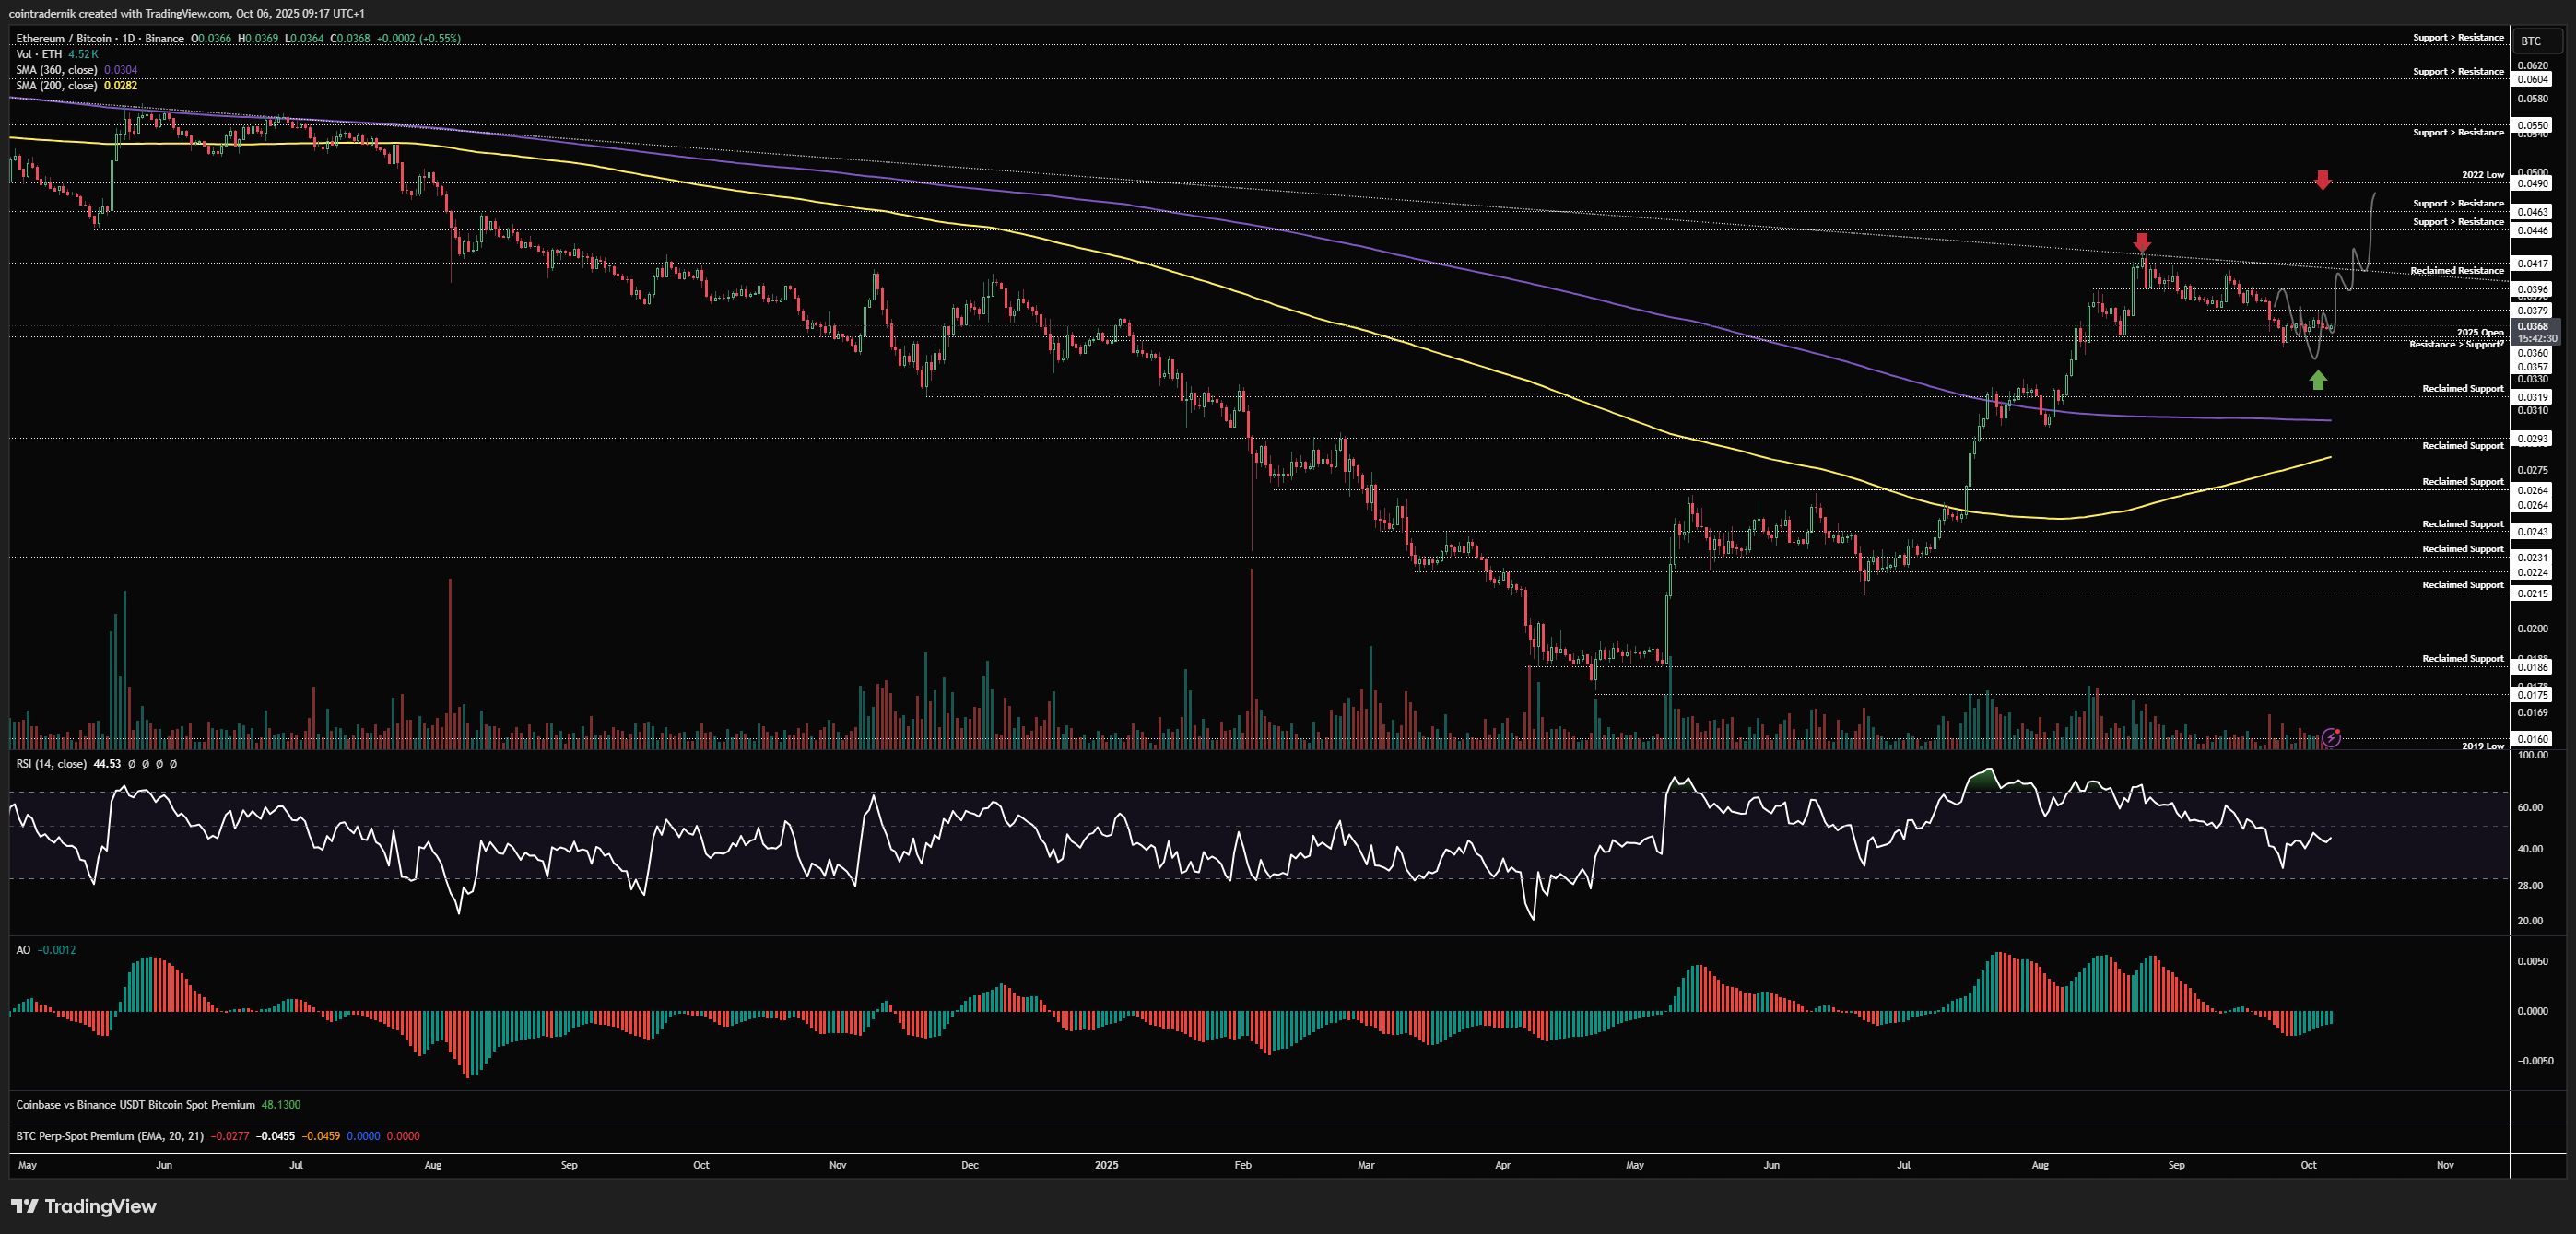
Looking at the daily, we can see price is chopping around between these two levels, with support around the yearly open and resistance at 0.0379. Flipping 0.0379 into reclaimed support would be the first sign that the sweep of the September low is not likely and instead we should see price push higher from there into the trendline and beyond. A daily close below 0.0357 = a push towards 0.0319, though as I have been saying I think that level gets front-run hard as a 360dMA retest and we bottom out somewhere closer to 0.033, assuming we break down here. Very clean textbook structure from ETH/BTC here.
Receive the latest updates directly to your inbox

Price: 97.94
Monthly:
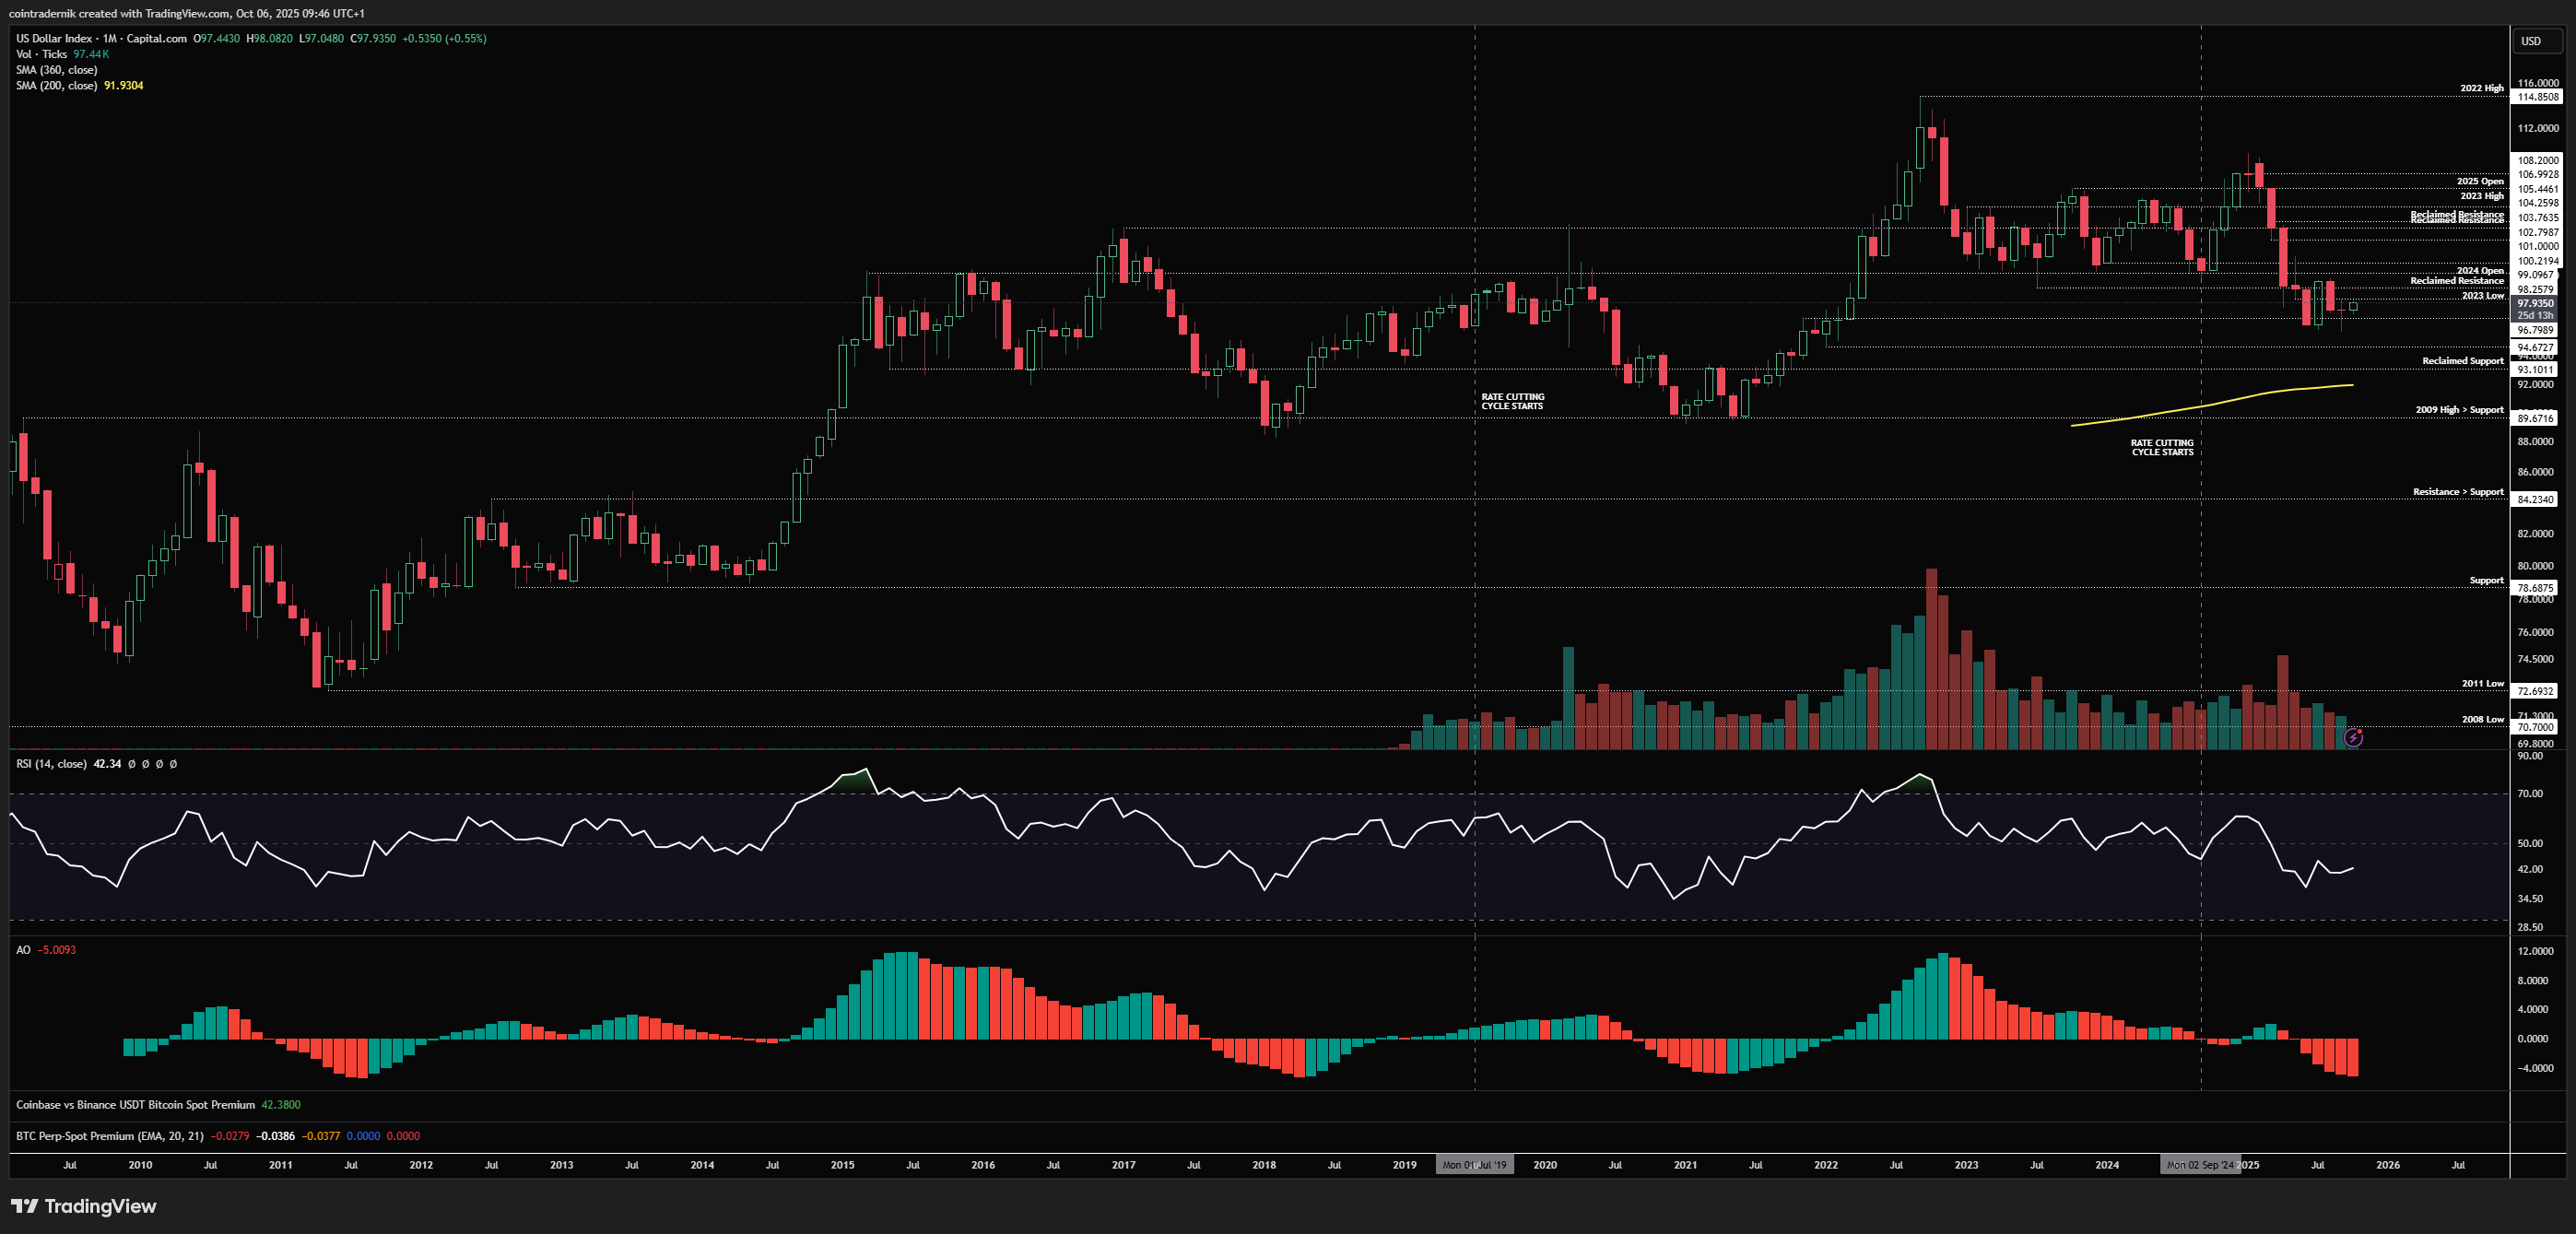
If we begin by looking at the monthly for the Dollar Index, we can see that September swept the July low and bounced to close back above 96.8 but capped by 98.3, with major resistance above that into 100. Whilst I had expected the push below the July lows to lead to expansion to the downside, the stubbornness here along with my current view on Gold is making me think we could have a bit more of a squeeze here short-term for the Dollar, where lower timeframe acceptance above 98.3 leads to a retest of the 100 area, perhaps wicking above the August high or perhaps rejecting marginally below it. I remain of the view that at present nothing is pointing towards a cyclical bottom in the Dollar here and unless we close back above 100, confirming that as reclaimed support, I continue to view local rallies as short squeezes given the bearish dollar positioning. Taking out 99 into 100 in October would be very much possible and I would then expect sellers to step in again and push the Dollar lower again across the board, with the ultimate target of 93 some time later this year. Again, acceptance above 100 on the monthly would invalidate this and open up further upside into 103.
Weekly:
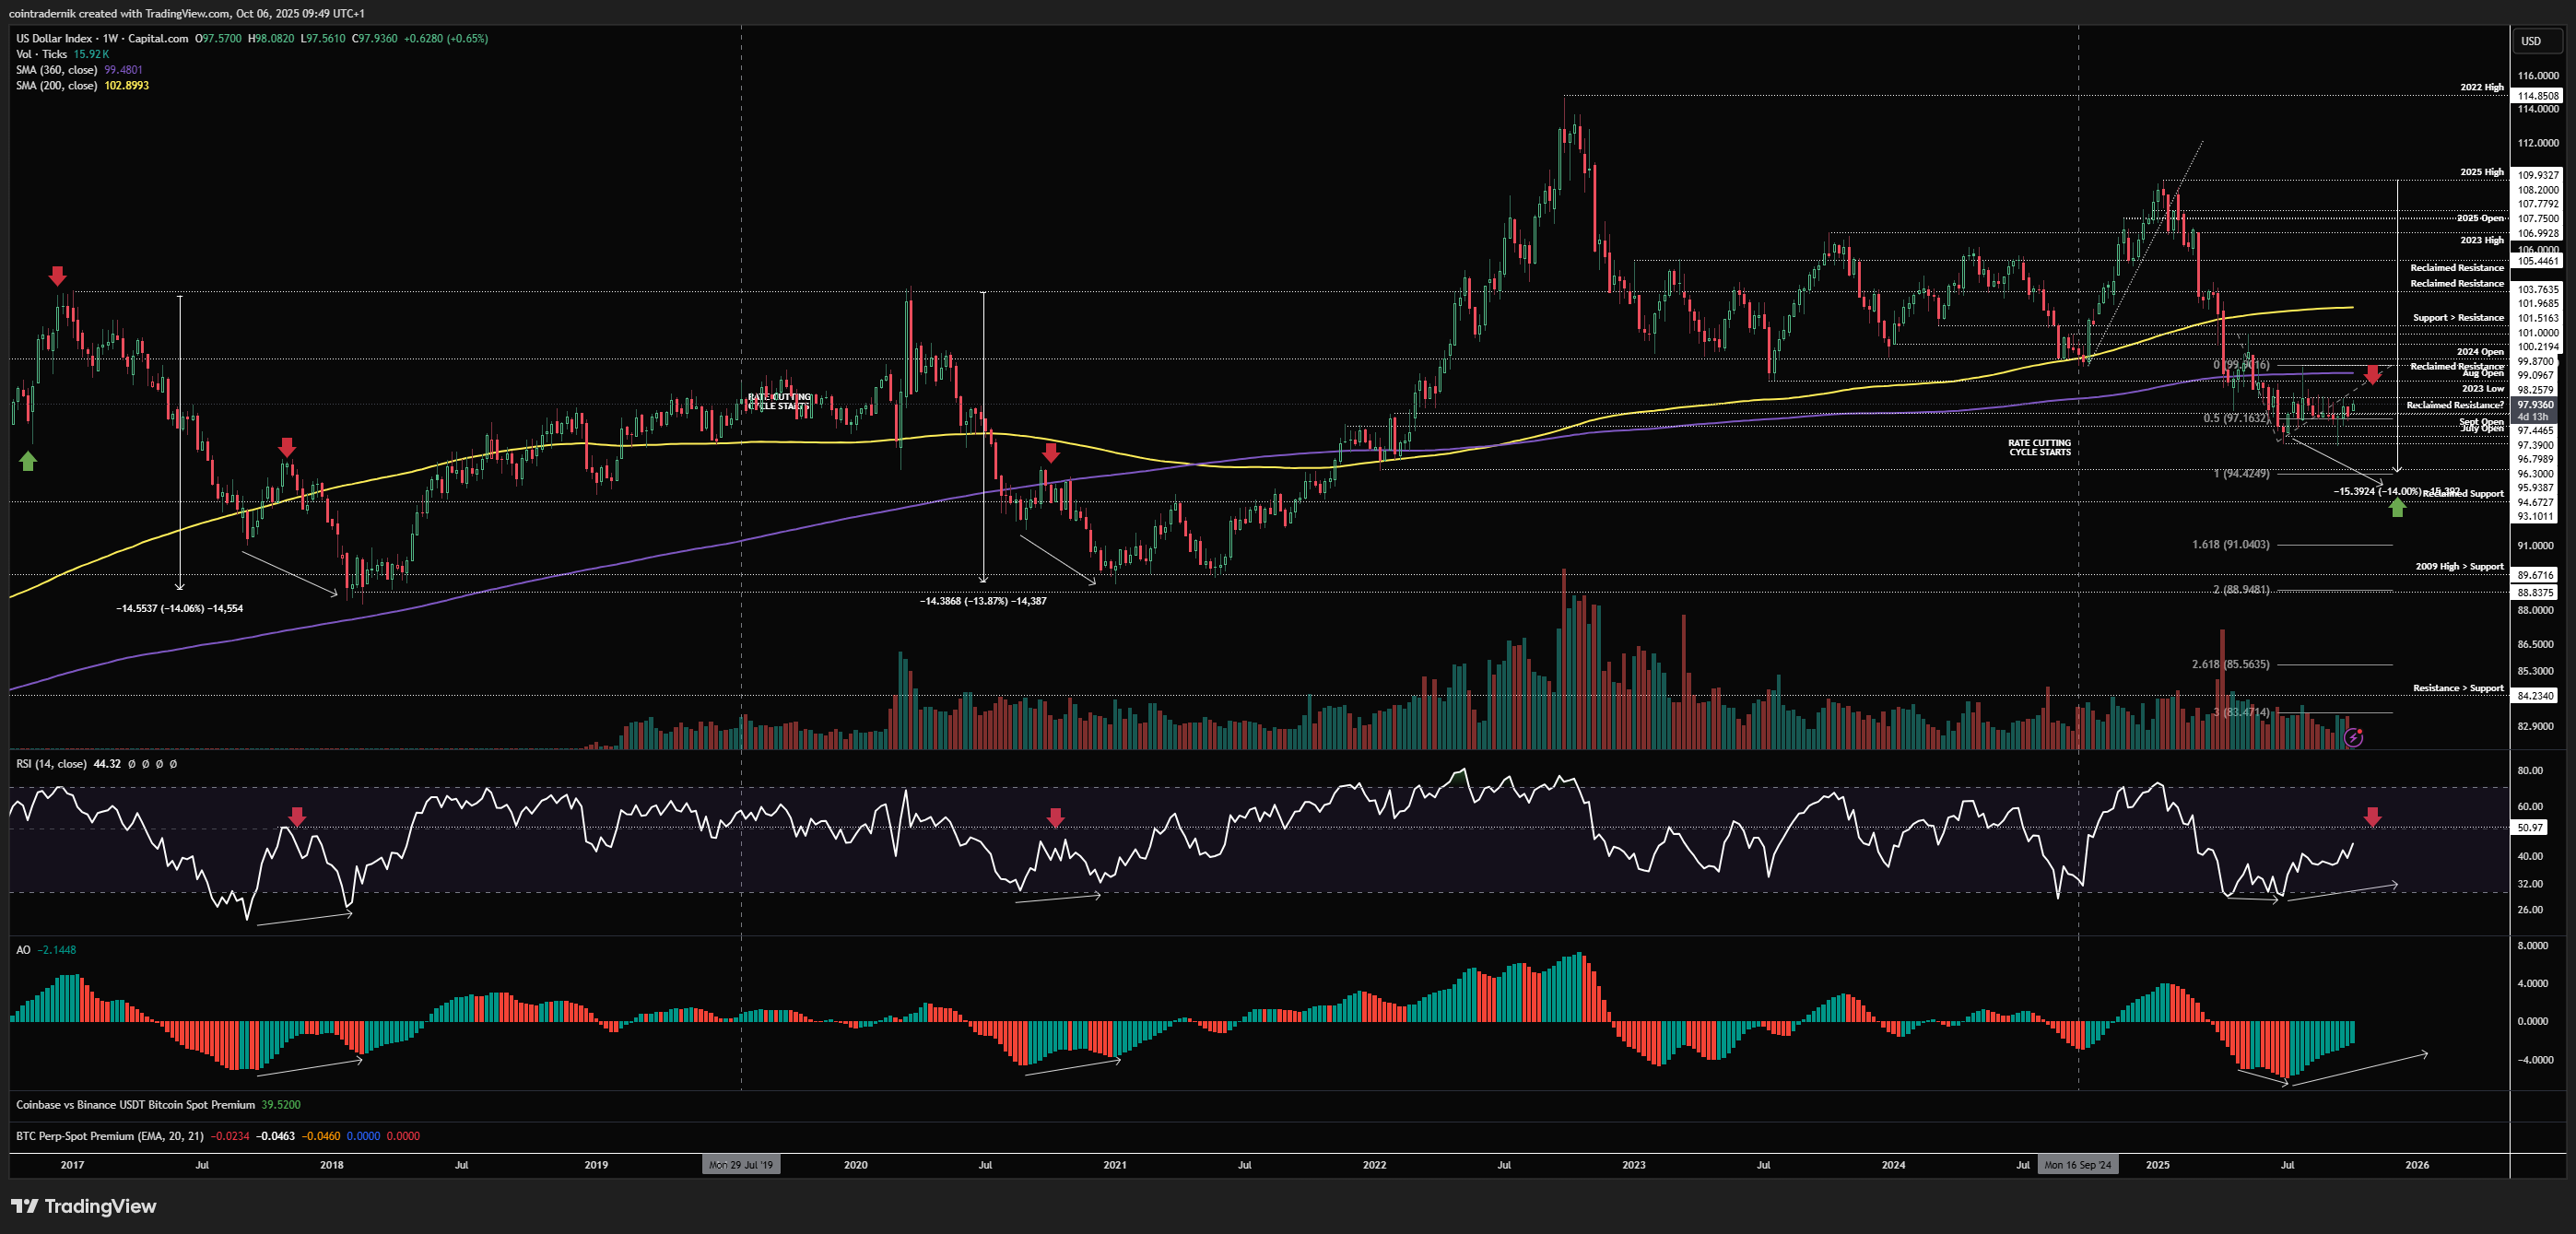
If we now look at the weekly, we can see that in the prior DXY cycles the short squeeze after the initial bottom saw Weekly RSI hit ~50 before the Dollar got slapped down again and formed bullish divergences on the next leg lower; whilst we did get a squeeze into the 360wMA at 99.5 a couple of months ago, weekly momentum remained muted. As last week saw price retest local support but fail to break it, we could see momentum continue to push higher here with a 99-100 handle retest leading to that 50 print on weekly RSI before continuation lower to form momentum exhaustion into what I expect to be a cyclical low. A weekly close below 96.8 here would invalidate this and begin that next leg lower swiftly; and conversely acceptance above 100 = improbable we make fresh lows below 95.9 this cycle (assuming the reclaim is sticky). Base case is 99-100 this month and then 93-94 into year-end.
Daily:
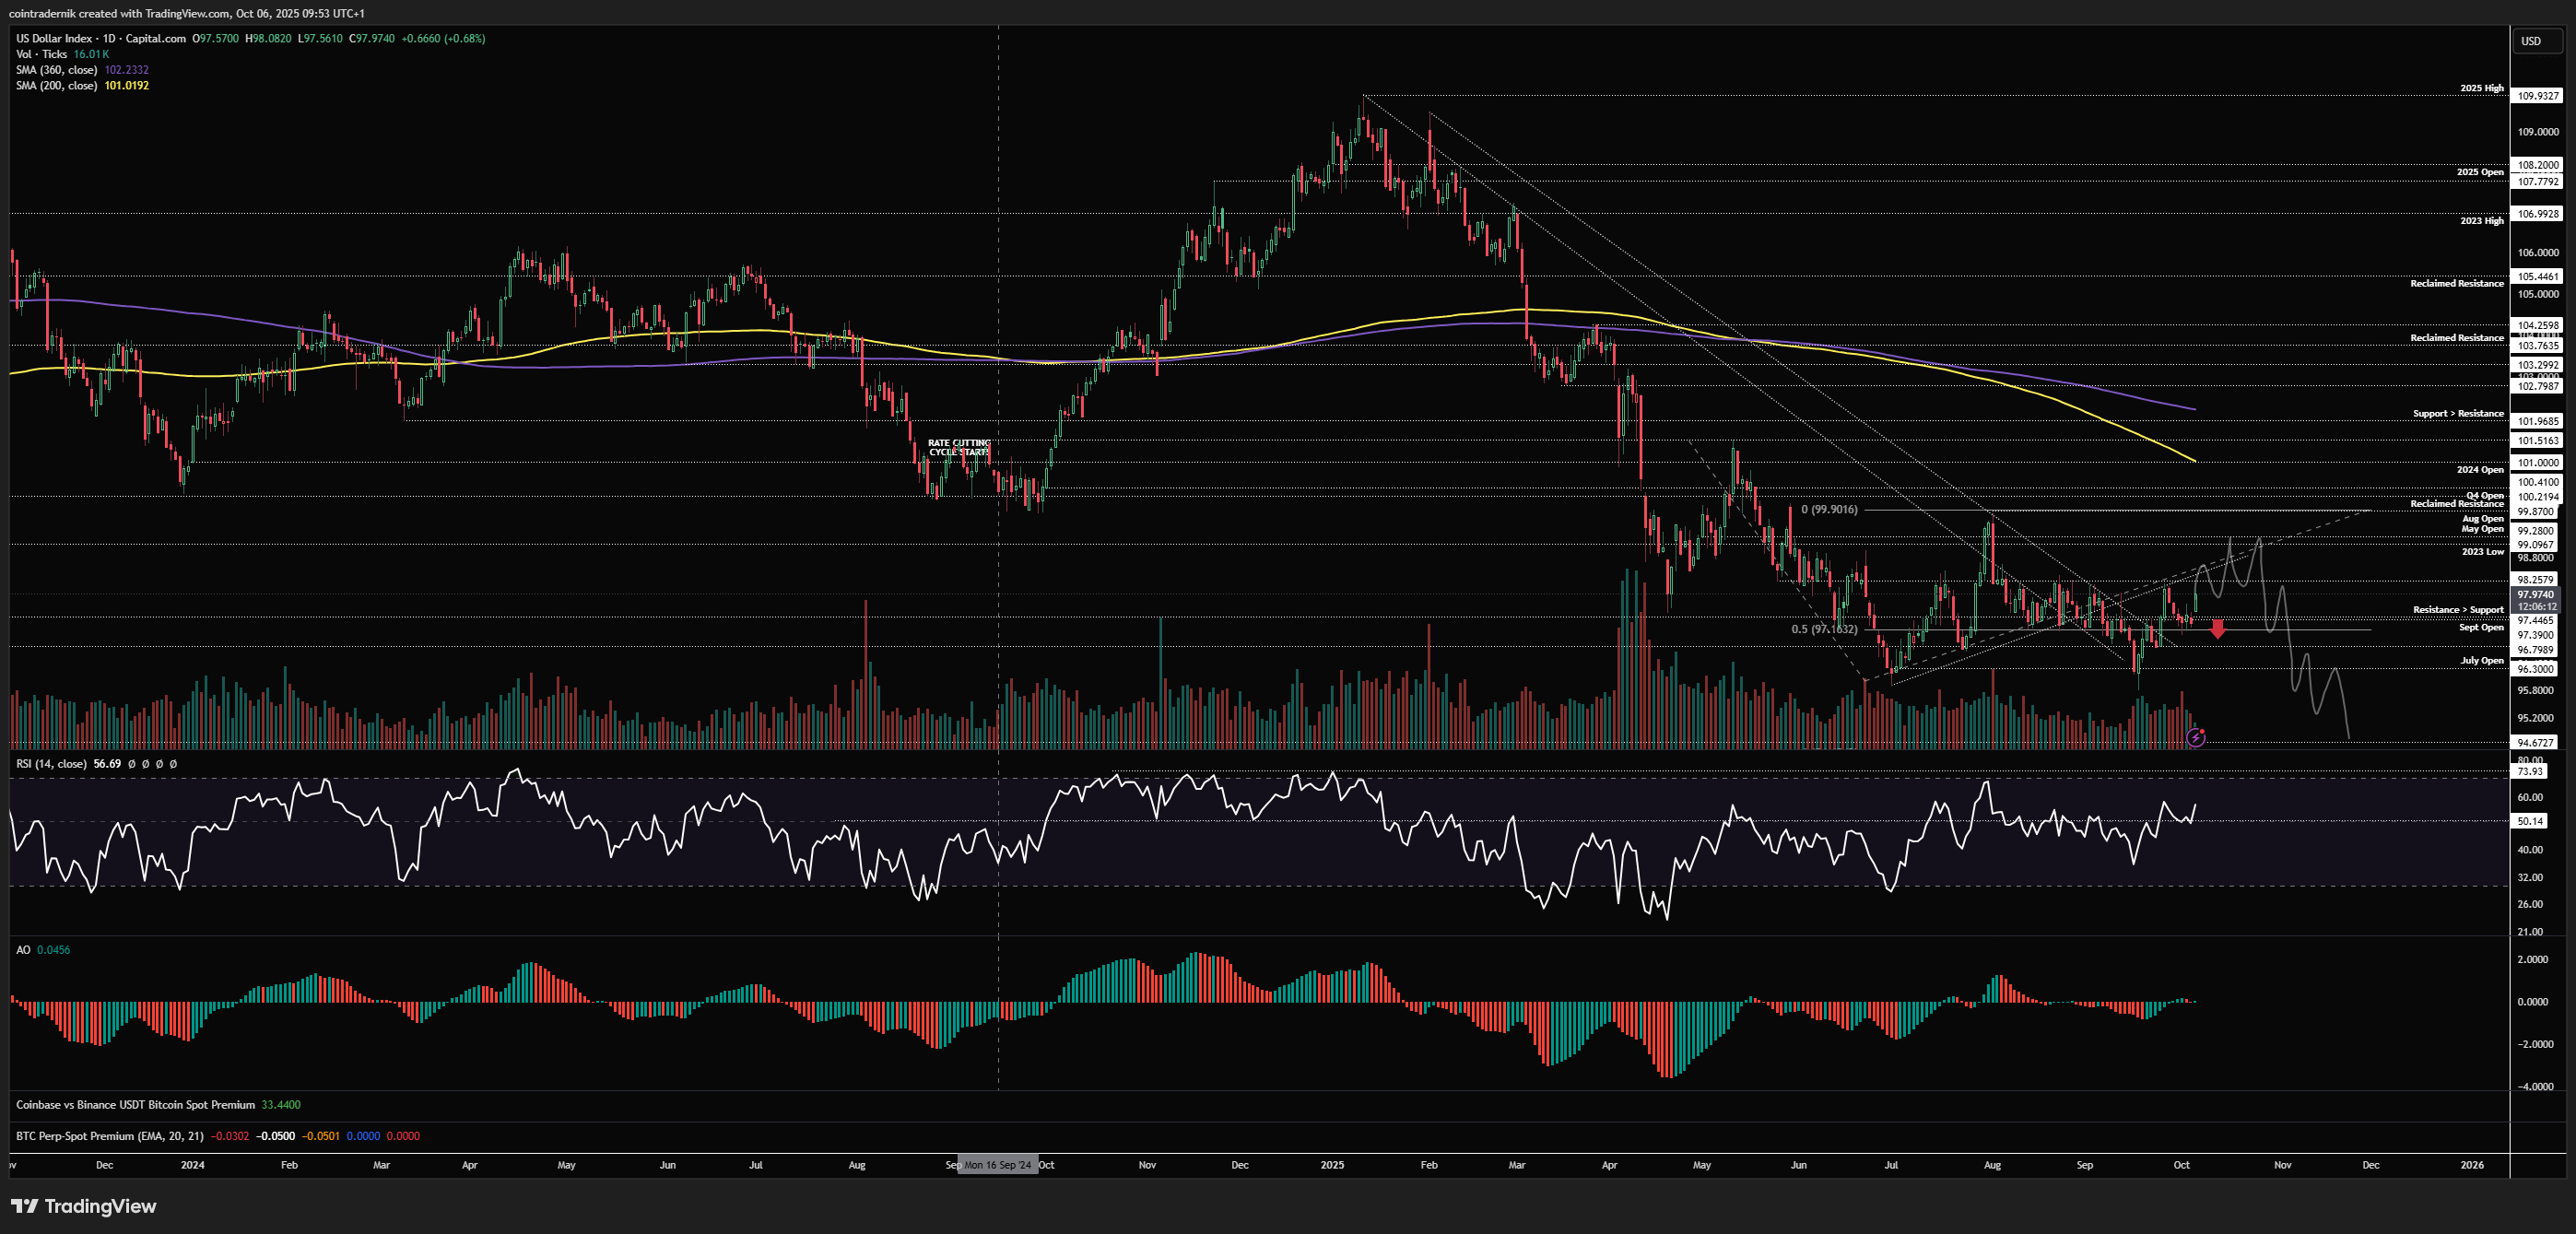
Looking at the daily, we can see how this plays out if we do get a continuation of the squeeze with acceptance above 98.25 here leading to a retest of 99.3, followed by potentially a sweep of 99,9 into that multi-year range support turned resistance around 100.4. That is ultimately where I do expect the Dollar bid to be capped and flipping the 2024 open at101 into support on the daily timeframe would very much look like invalidation of my broader view into year-end where we could then push towards 103.3. All of this is itself invalidated if we lose the September open here and flip 96.8 into resistance, then leading to that leg lower towards 93.
Price: $3942
Monthly:
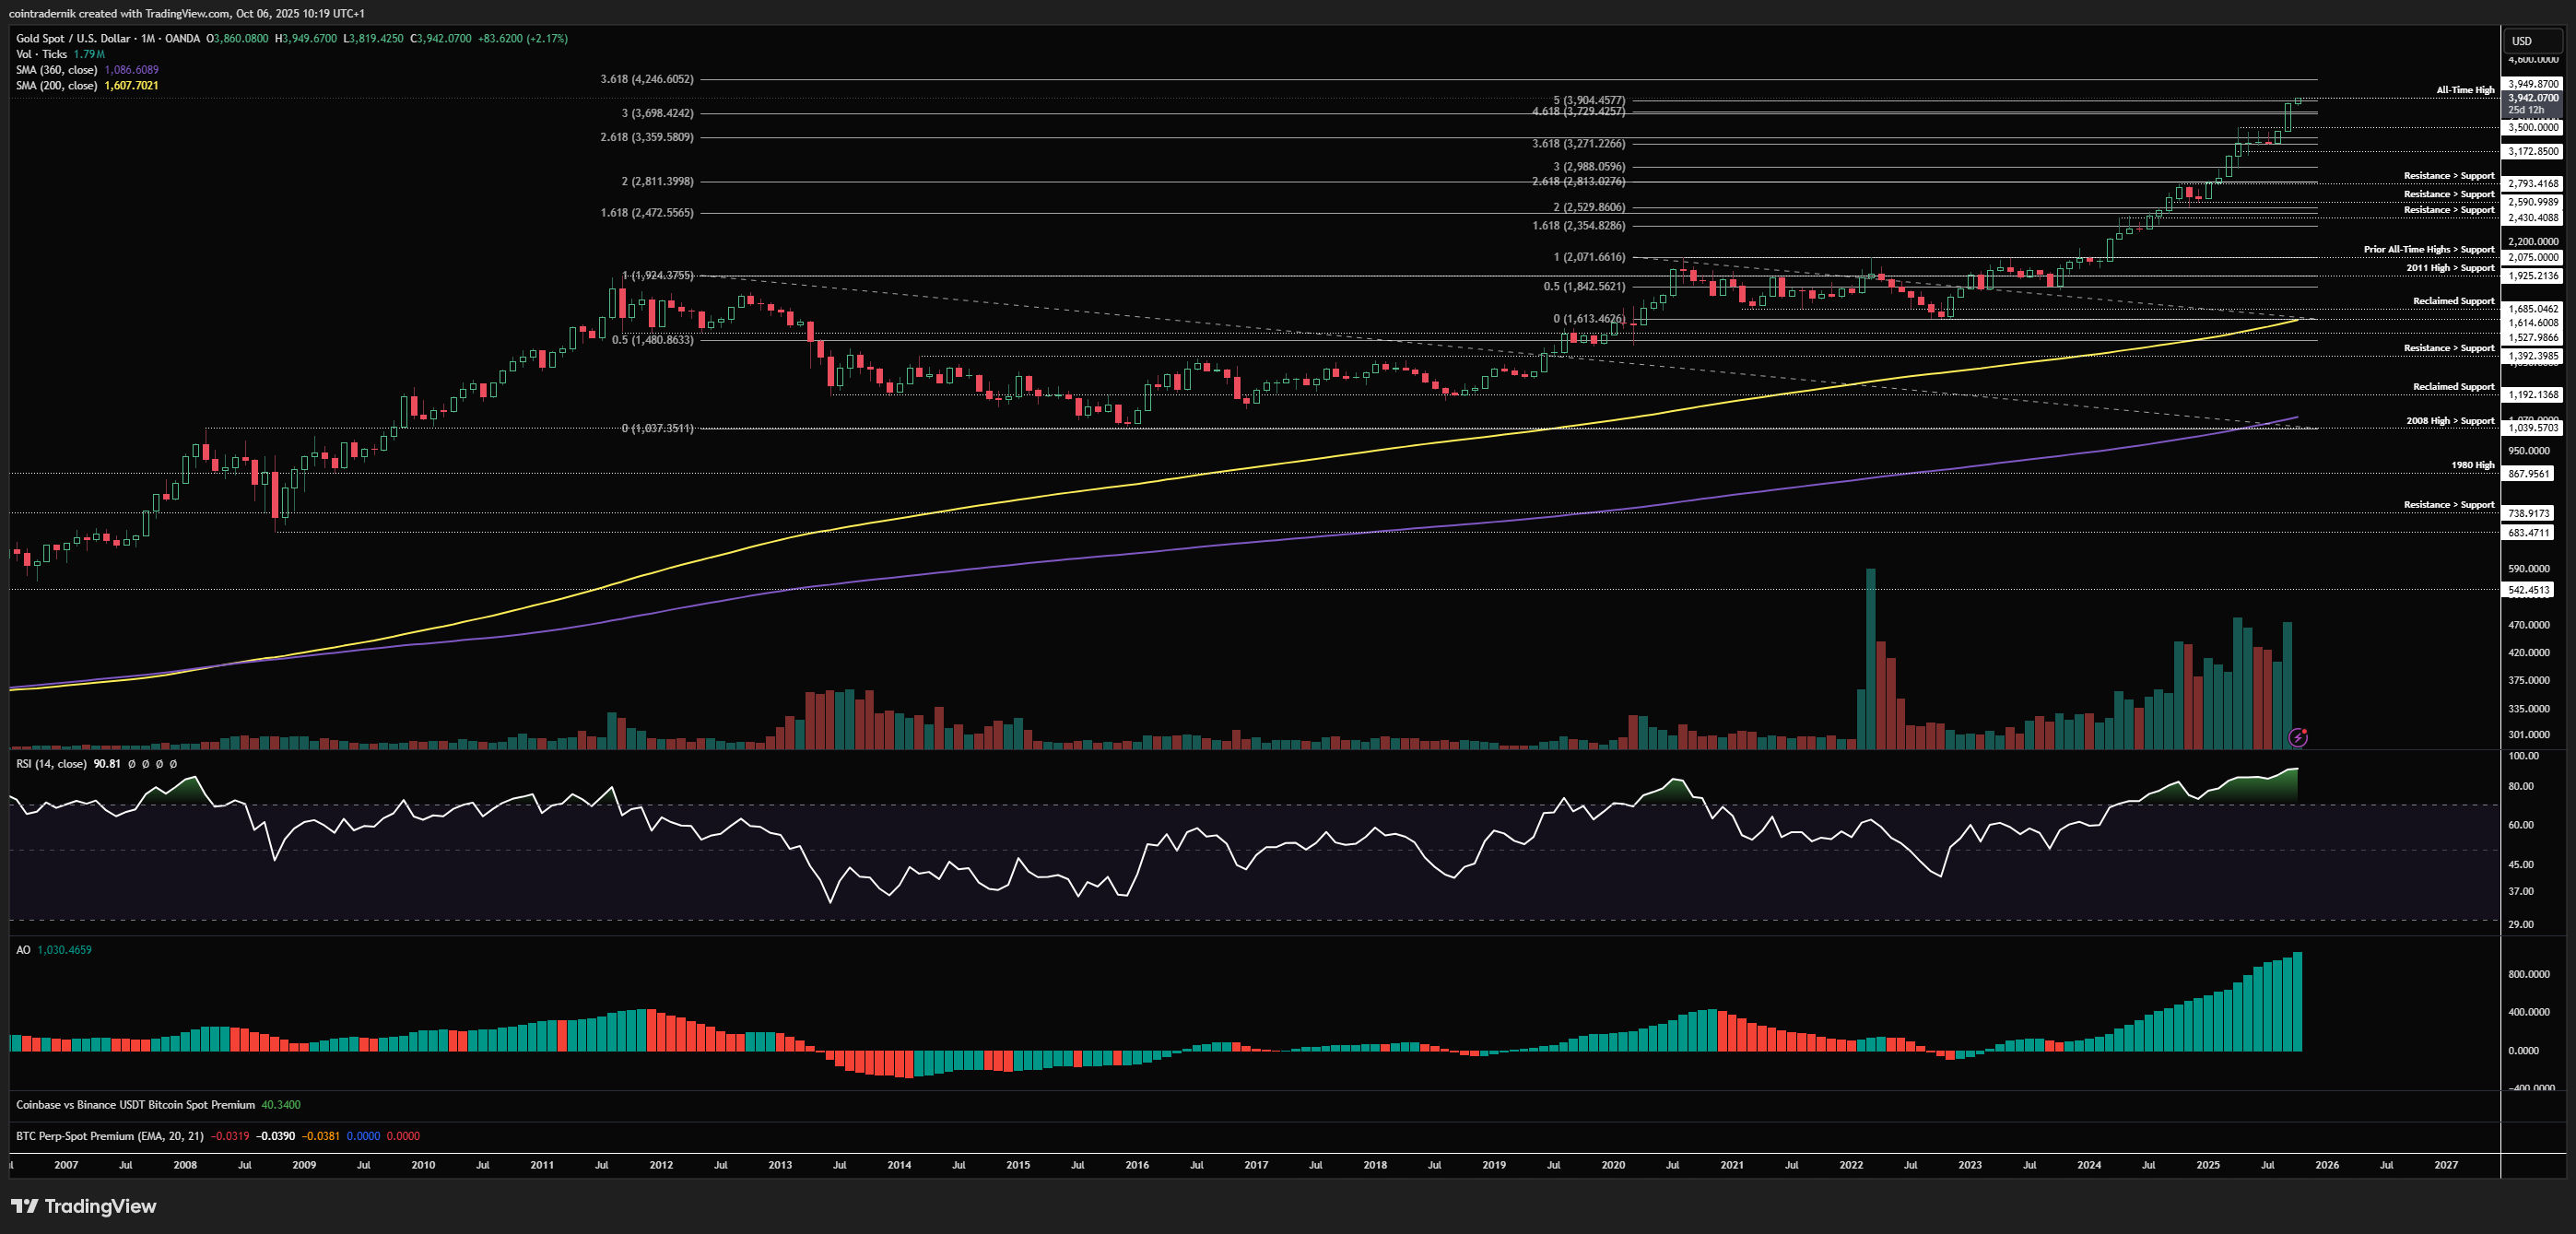
If we begin with the monthly timeframe for Gold, it has been on an absolute tear with a monster September that saw price rally off prior highs turned support at $3500 into the monthly close at $3860, with monthly RSI at 91 and AO confirming both the strength of the trend and how extreme it is. I am going to say something stupid now, which is that despite this strength I think we are quite close to a local top for Gold, and that is in part because Gold miners are no longer outperforming Gold itself with GDX/Gold showing signs of weakness (see my recent tweets highlight this), which has then marked local tops. Obviously, if you wanted to naked short this sort of setup you'd pick the miners, but right now I am short Gold as part of another long BTC pair trade. If we get confirmation via breakdowns in Gold miners, I will look to short GDX too. Now, early price-action this month has seen price push higher through the September high into a fresh all-time high this morning at $3950, and signs of a local top remain absent on this higher timeframe; obviously if we now close significantly back below the $3860 level into November, then you have some sort of confirmation but you may have already missed the entry on the miners by that point, so we need to look at the weekly and daily. On the big picture - talking months away - I think this still has more upside in it through towards $4250.
Weekly:
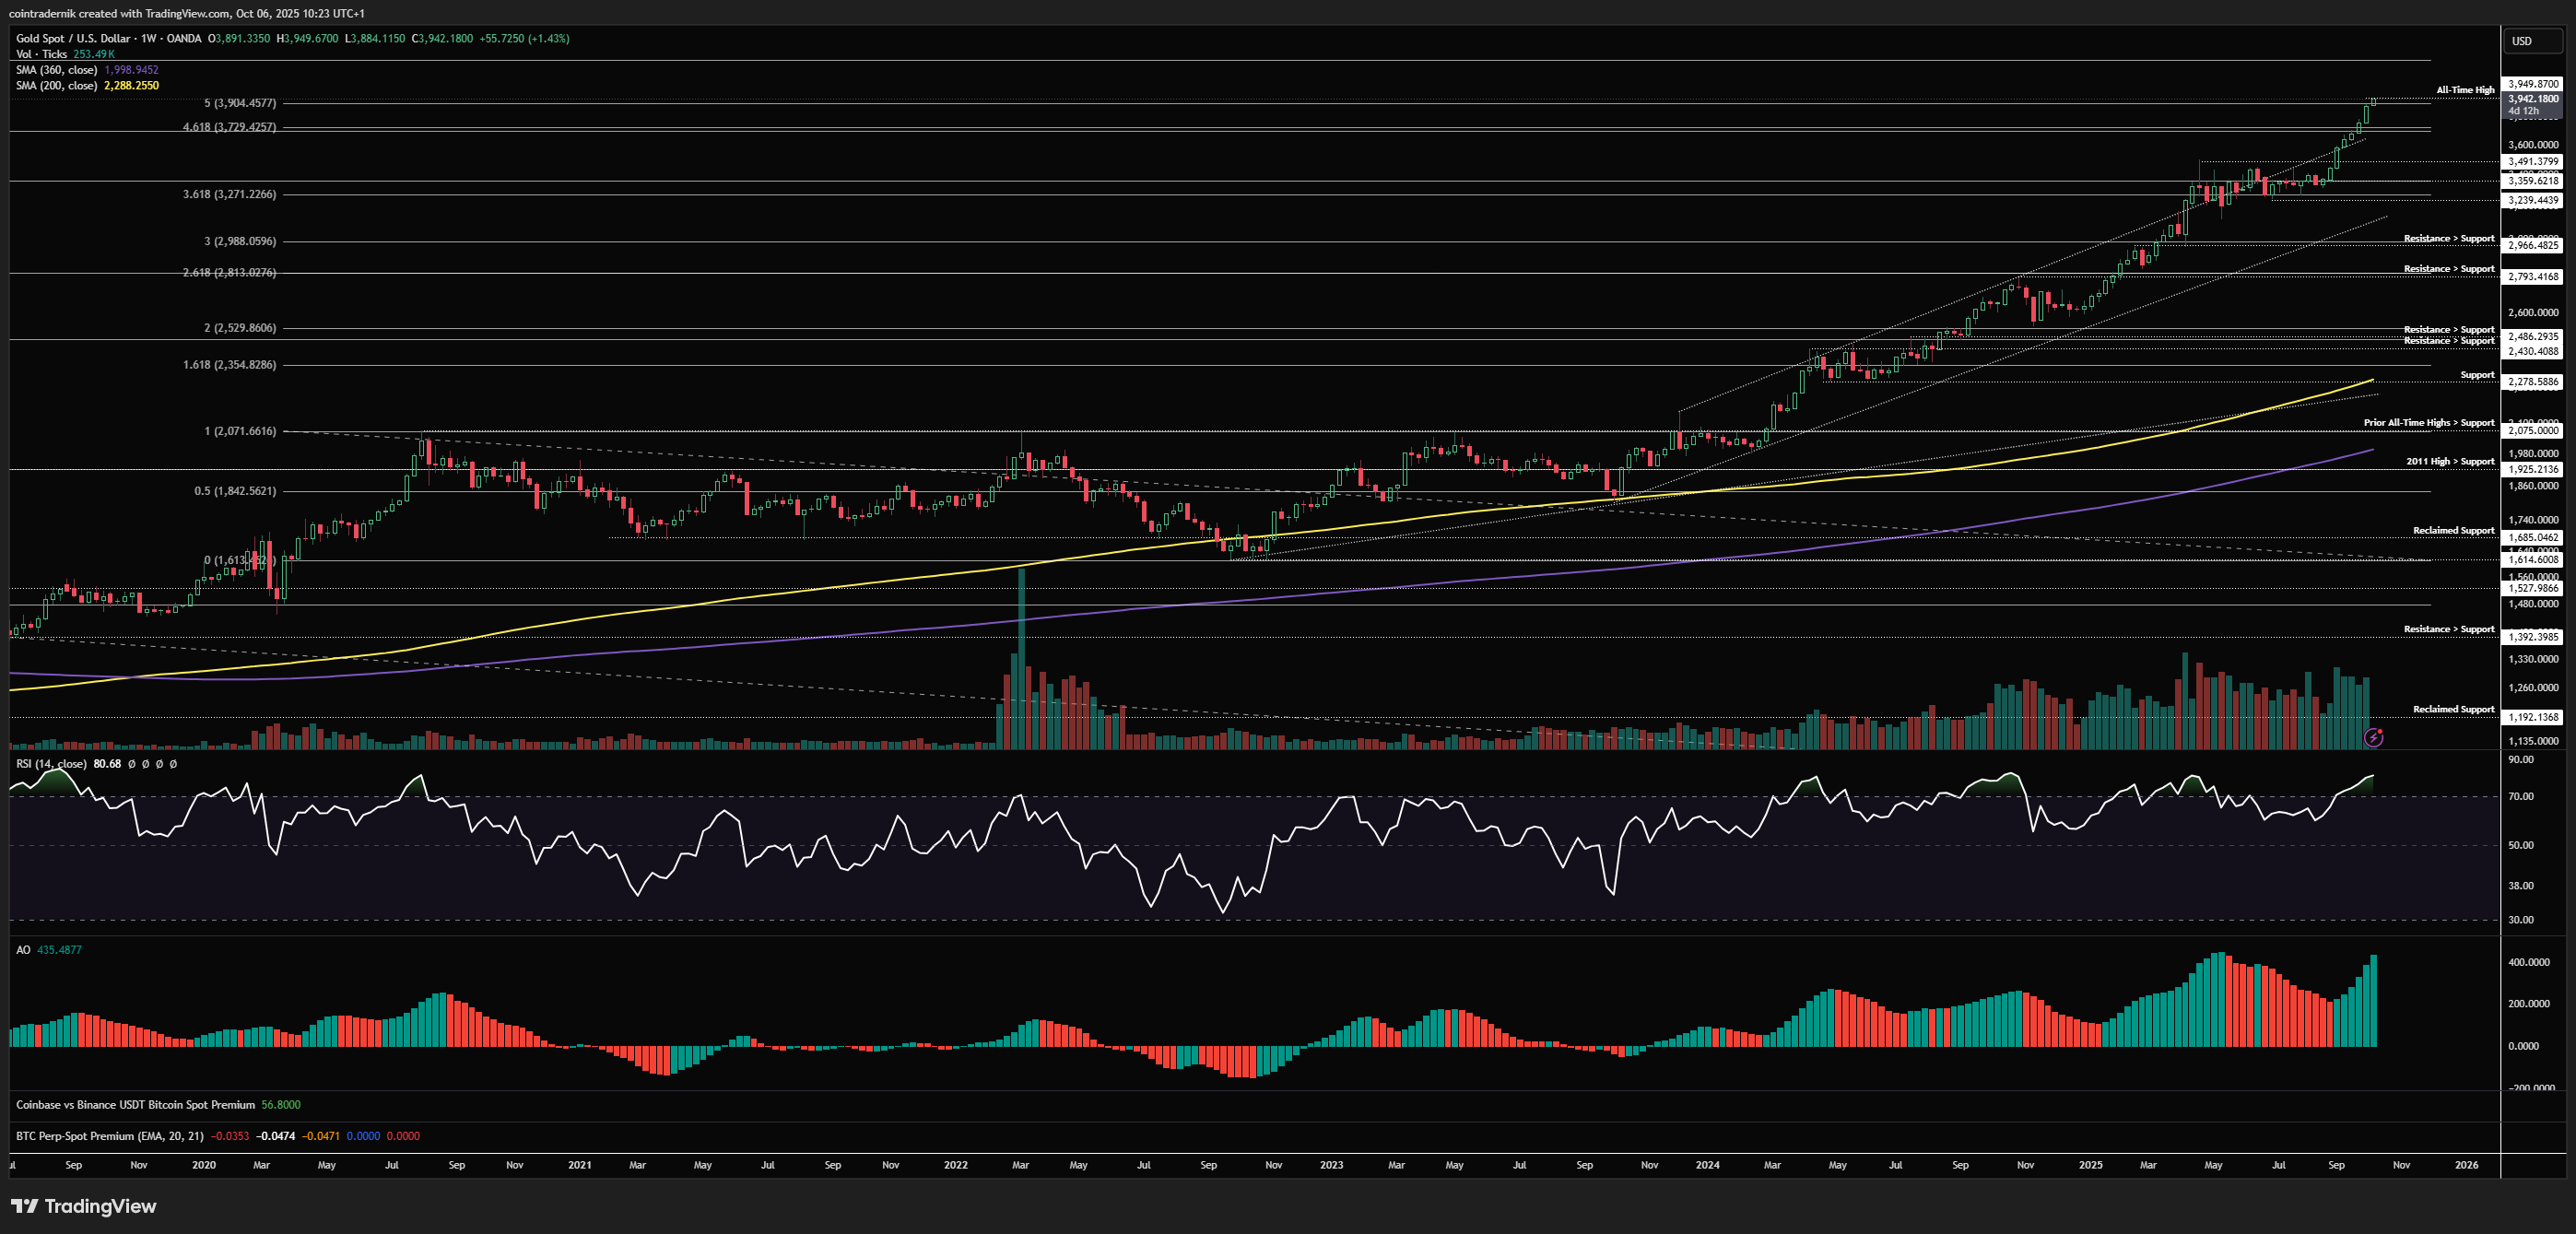
Looking at the weekly for Gold, we can see that price has closed 7 consecutive weeks green and has opened up this week above the 500% fib extension of the 2020-2022 range at $3904. Weekly momentum is strong across RSI and AO but is at roughly similar levels to those which preceded local tops throughout this rally since the Q4 2023 low. Just eyeballing the chart, it's plain to see how parabolic this more recent price-action is and if we do not see signs of weakness emerge on the lower timeframes then no doubt we push into $4000 this week, with $4250 as a major fib above that, though likely to be some short-term profit-taking at that big figure. If we do see this week push higher and then reject to close the week red, that gives some confidence to the local top scenario, with a sweep of last week's low as a first target on a pullback, followed by a retest of $3500 as resistance turned support if it is a more durable top. Until we see that spike higher followed by rejection, however, we should expect this to just keep grinding up, but there are some weaknesses creeping in as mentioned re: miner outperformance.
Daily:
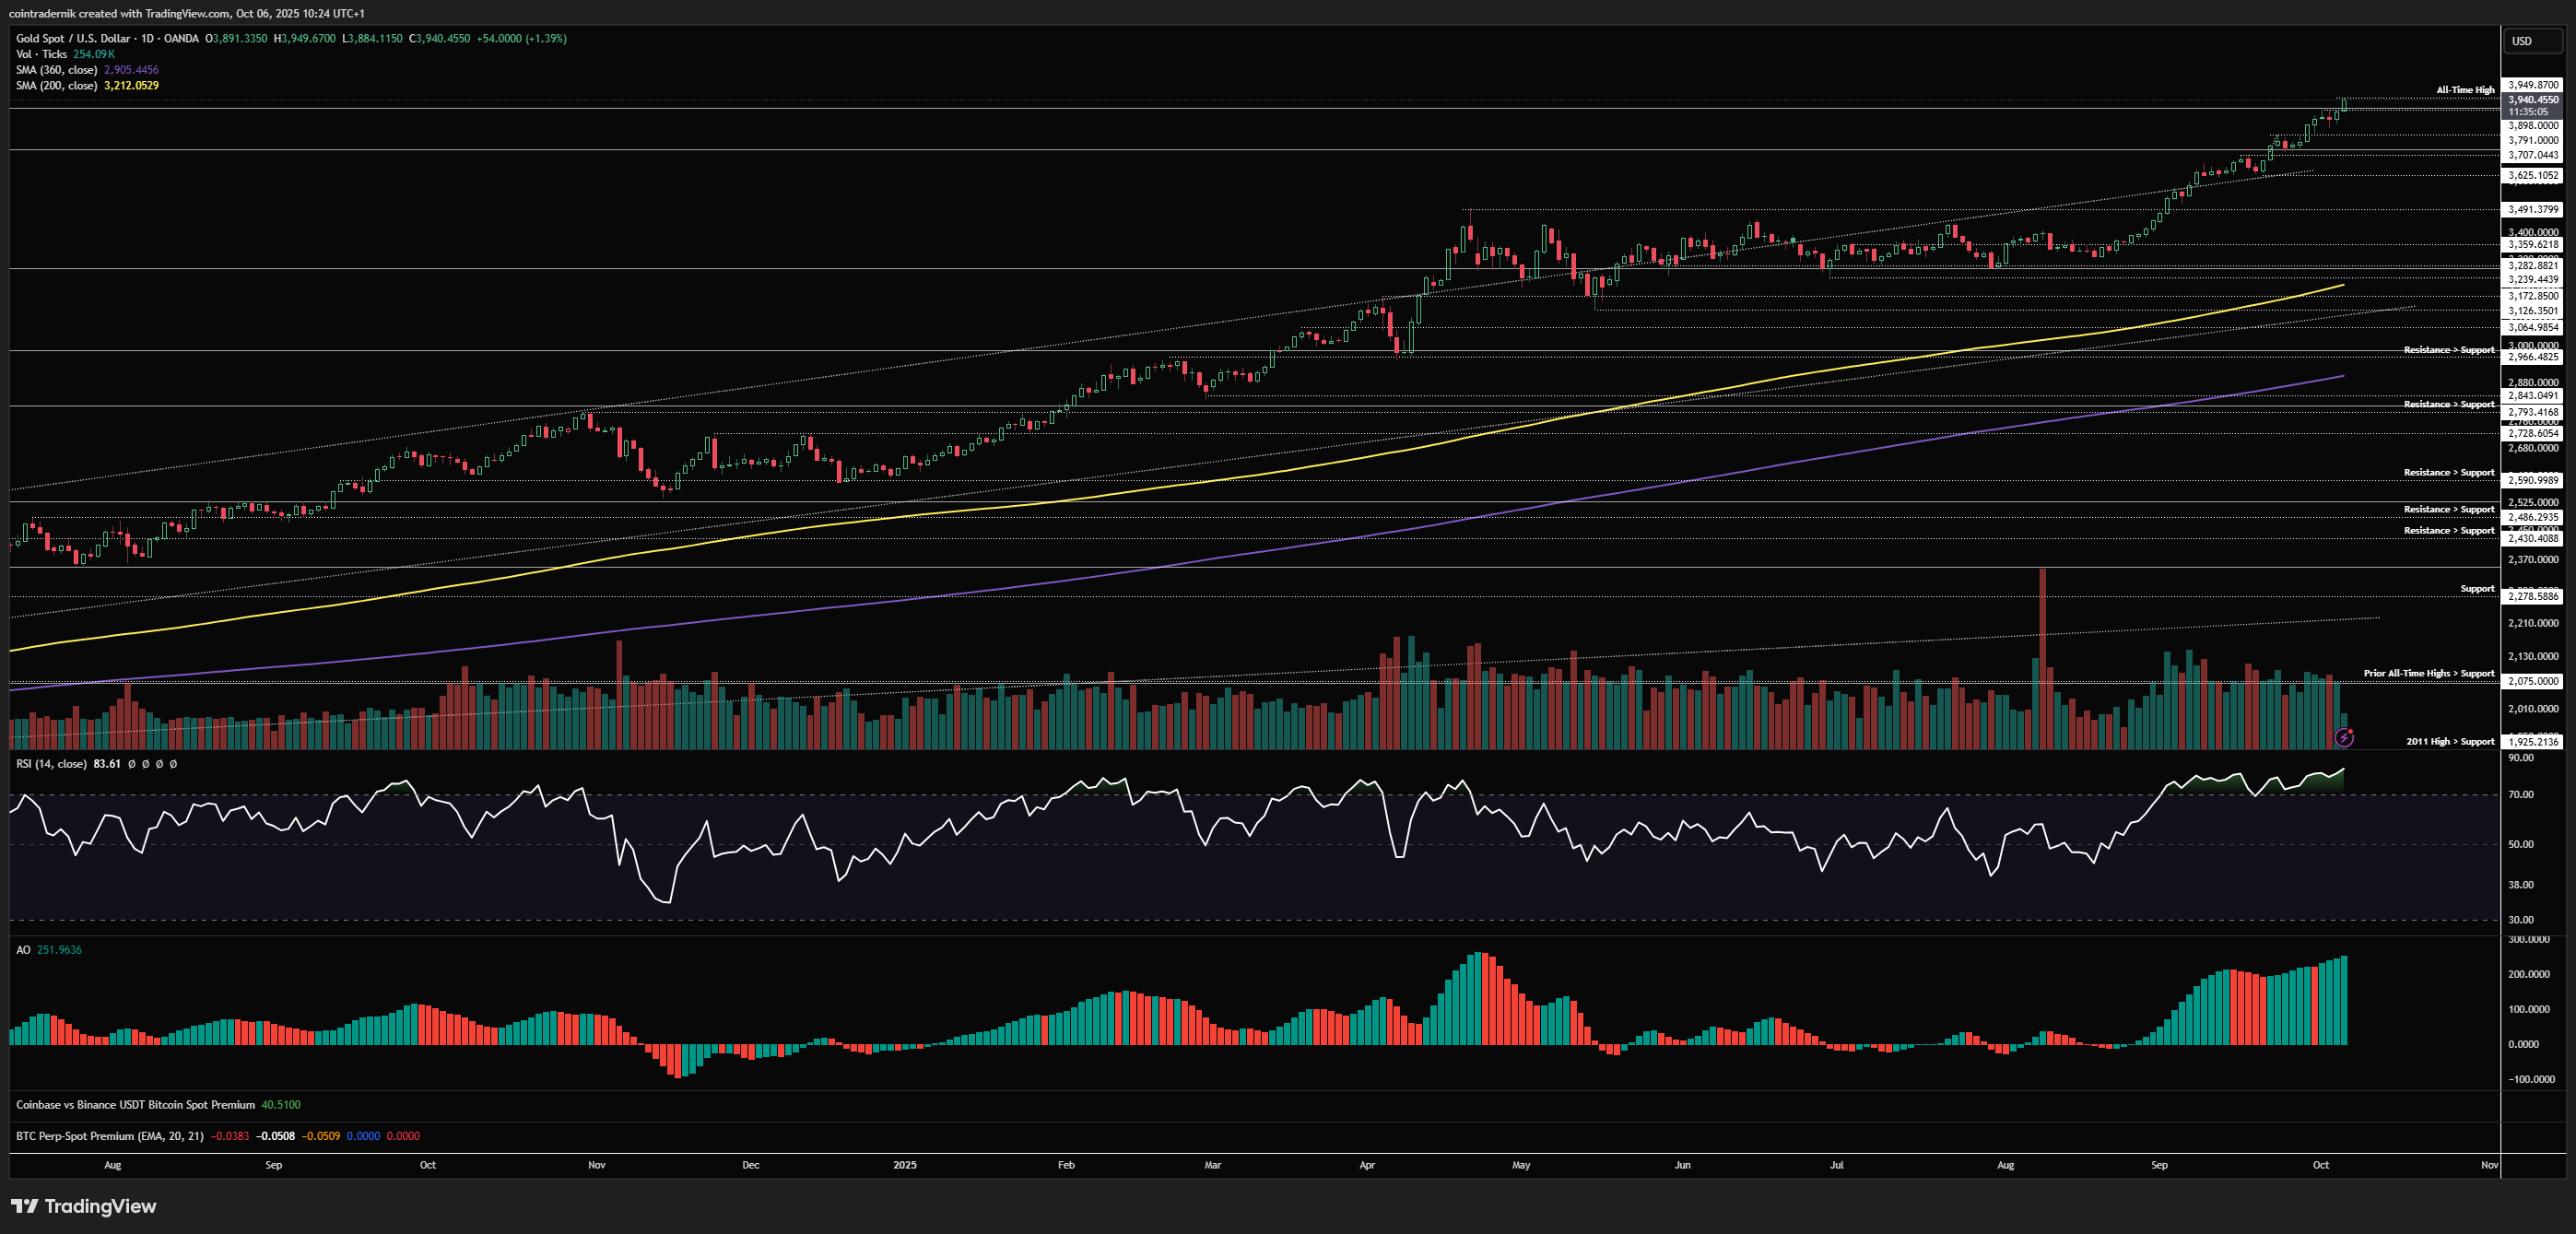
Finally, looking at the daily, we can see that price continues to flip local resistance into support, with $3791 being front-run last week as price bounced and made fresh highs. Daily momentum is the strongest it has been all year and we are yet to see bearish divergences appear, though they have not always been required from local tops in Gold over the past couple of years. What we would want to see here to be more sure on the weakness in GDX/Gold playing out in Gold itself is price push above today's high tomorrow and then reject hard and close the day back below the weekly open at $3891, trapping late buyers shy of that $4000 area. Something resembling that would be step one; we would then need to see $3891 act as resistance on the lower timeframes and price push lower from there to close the week red. If, instead, $3891 acts as support on any dip early this week and price continues to close at the highs, that marginal weakness in miners is not yet translating into Gold itself and we need to just keep paying close attention. If we look at other measures like distance from the 50-day MA, a similar sense of overextension is seen - but again, naked shorts before any of this actually starts to play out in price-action is a suicide mission, despite spidey senses tingling for downside in the coming weeks.
Price: $319bn
OTHERS/USD
Monthly:
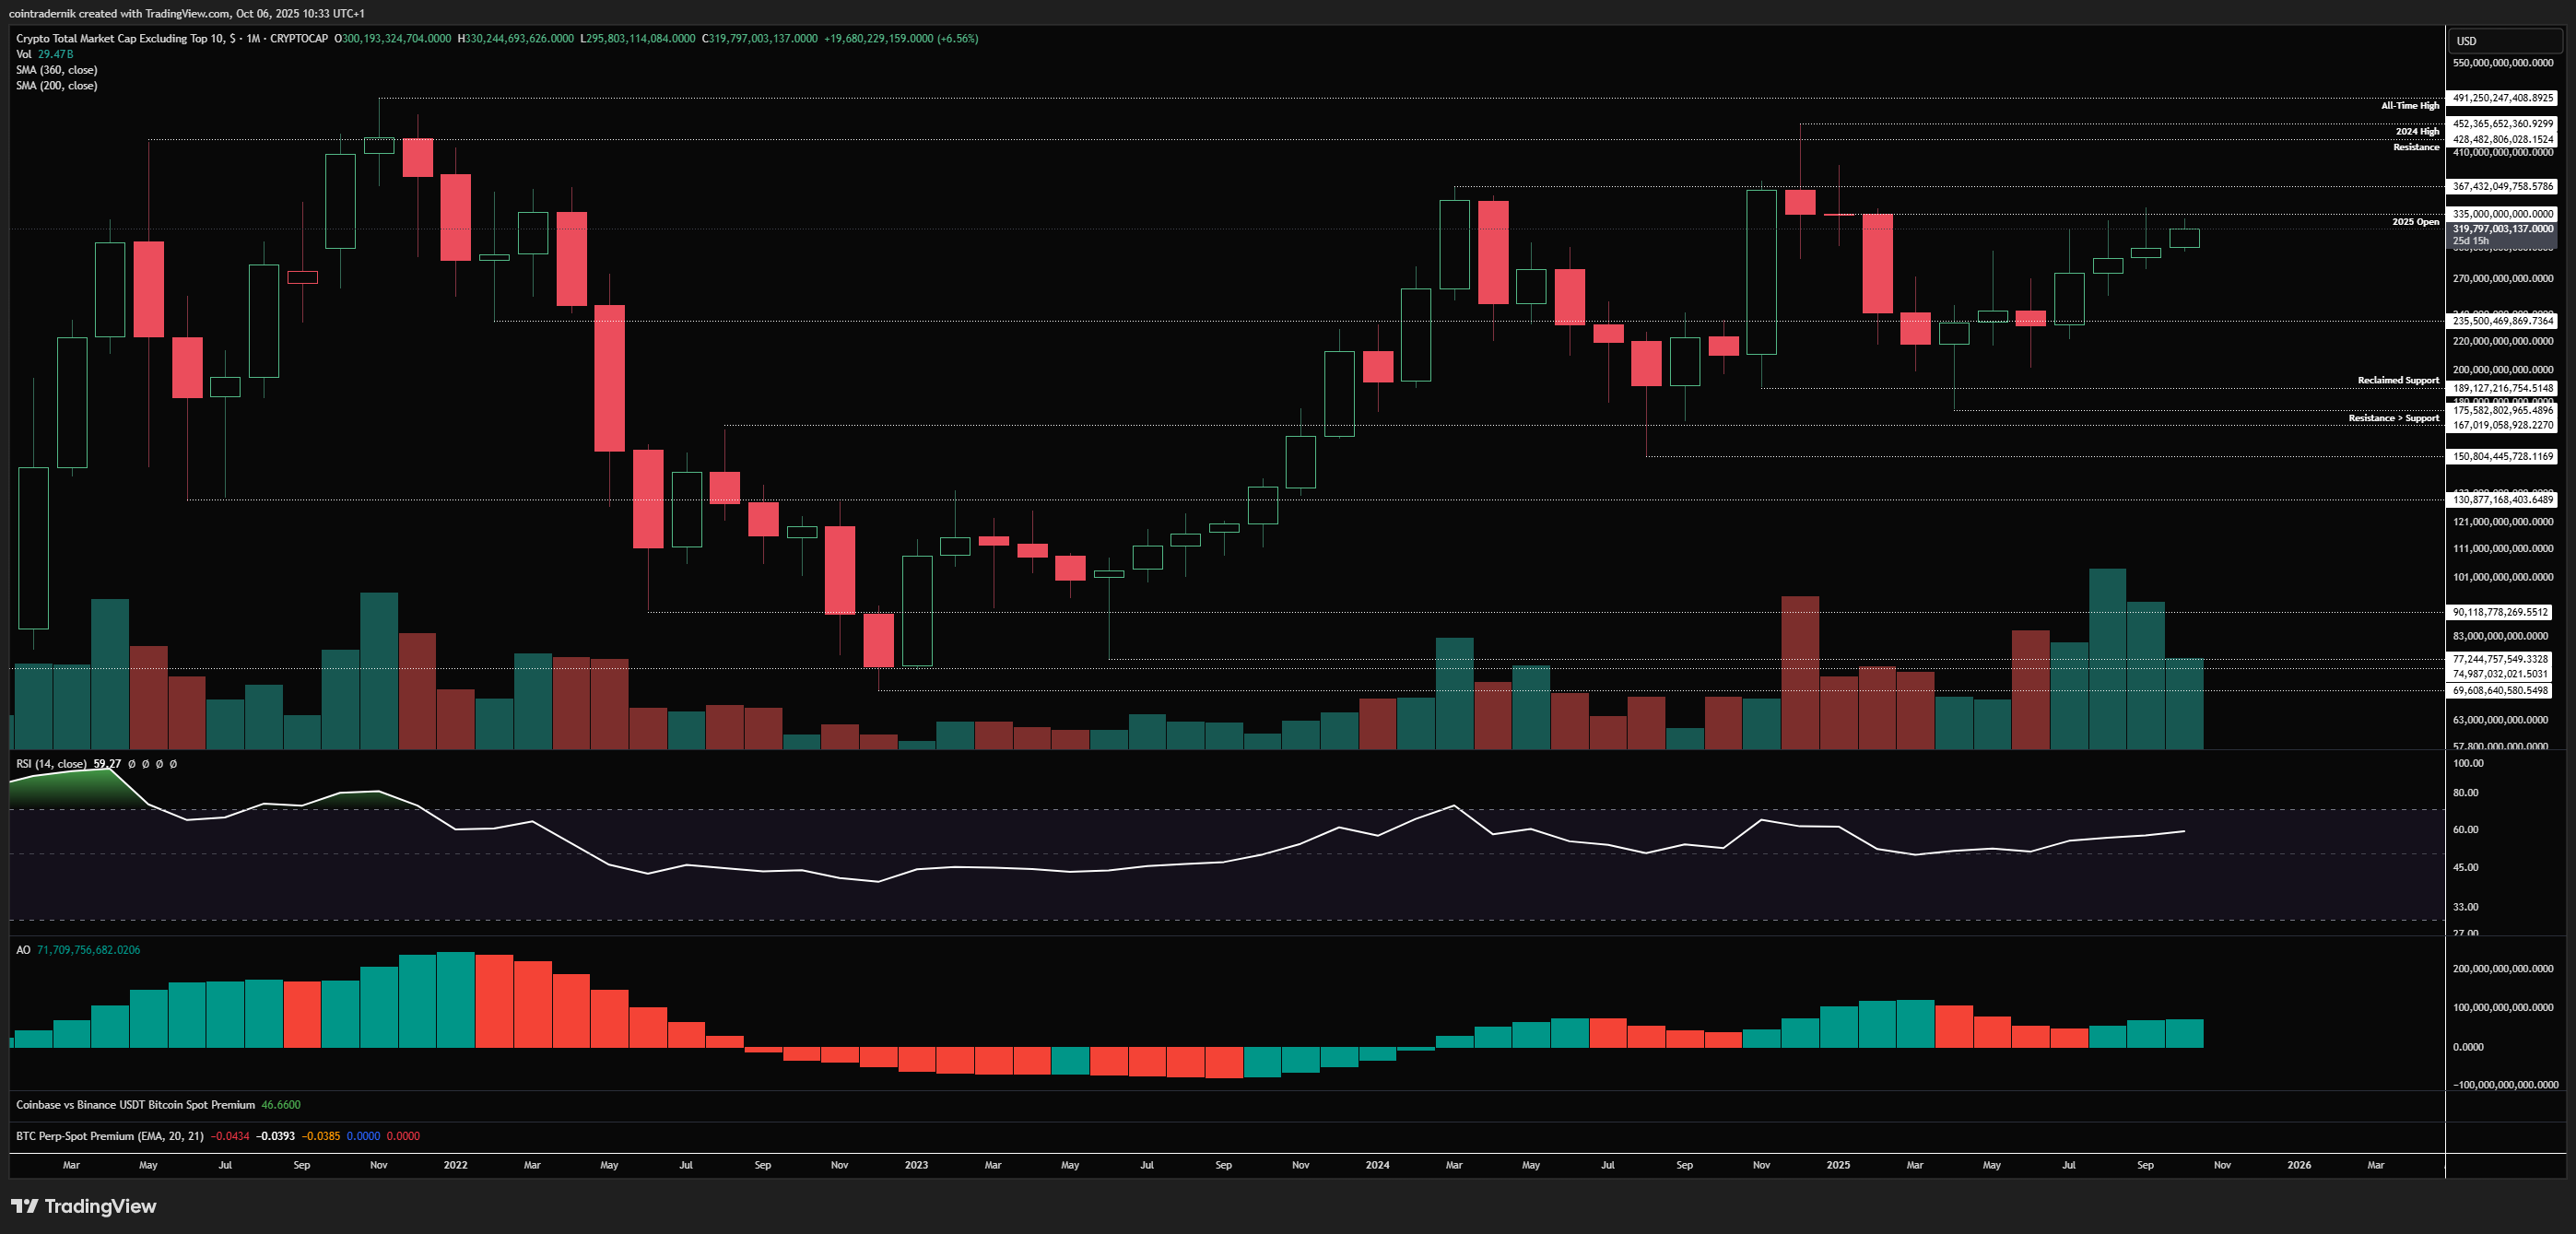
Beginning with the monthly for OTHERS, the first thing to say is we remain in a long-term uptrend despite the lacklustre performance from non-majors, and that has been felt by the 'primarily sideways but marginal grind higher' price-action since the March 2024 top. Nonetheless, we do have a higher low on this timeframe and have since rallied back above $235bn support and have been consolidating right around the yearly open for four straight months, each month pushing into the level but rejecting. As such, I do expect a monthly close above $335bn in October, and I expect that close above the yearly open to ignite animal spirits in November with alts pushing towards new cycle highs and all-time highs at $490bn in December. Here is where I think we could get some sort of major liquidation event into year-end that very much resembles a major top, where we could see a brutal shakeout buy crucially a Q4 close above $335bn - I think that then sparks that period of price discovery furthest out the risk curve above $500bn on OTHERS in Q1, when consensus has written off another leg higher or extension of 'the cycle' into next year.
Weekly:
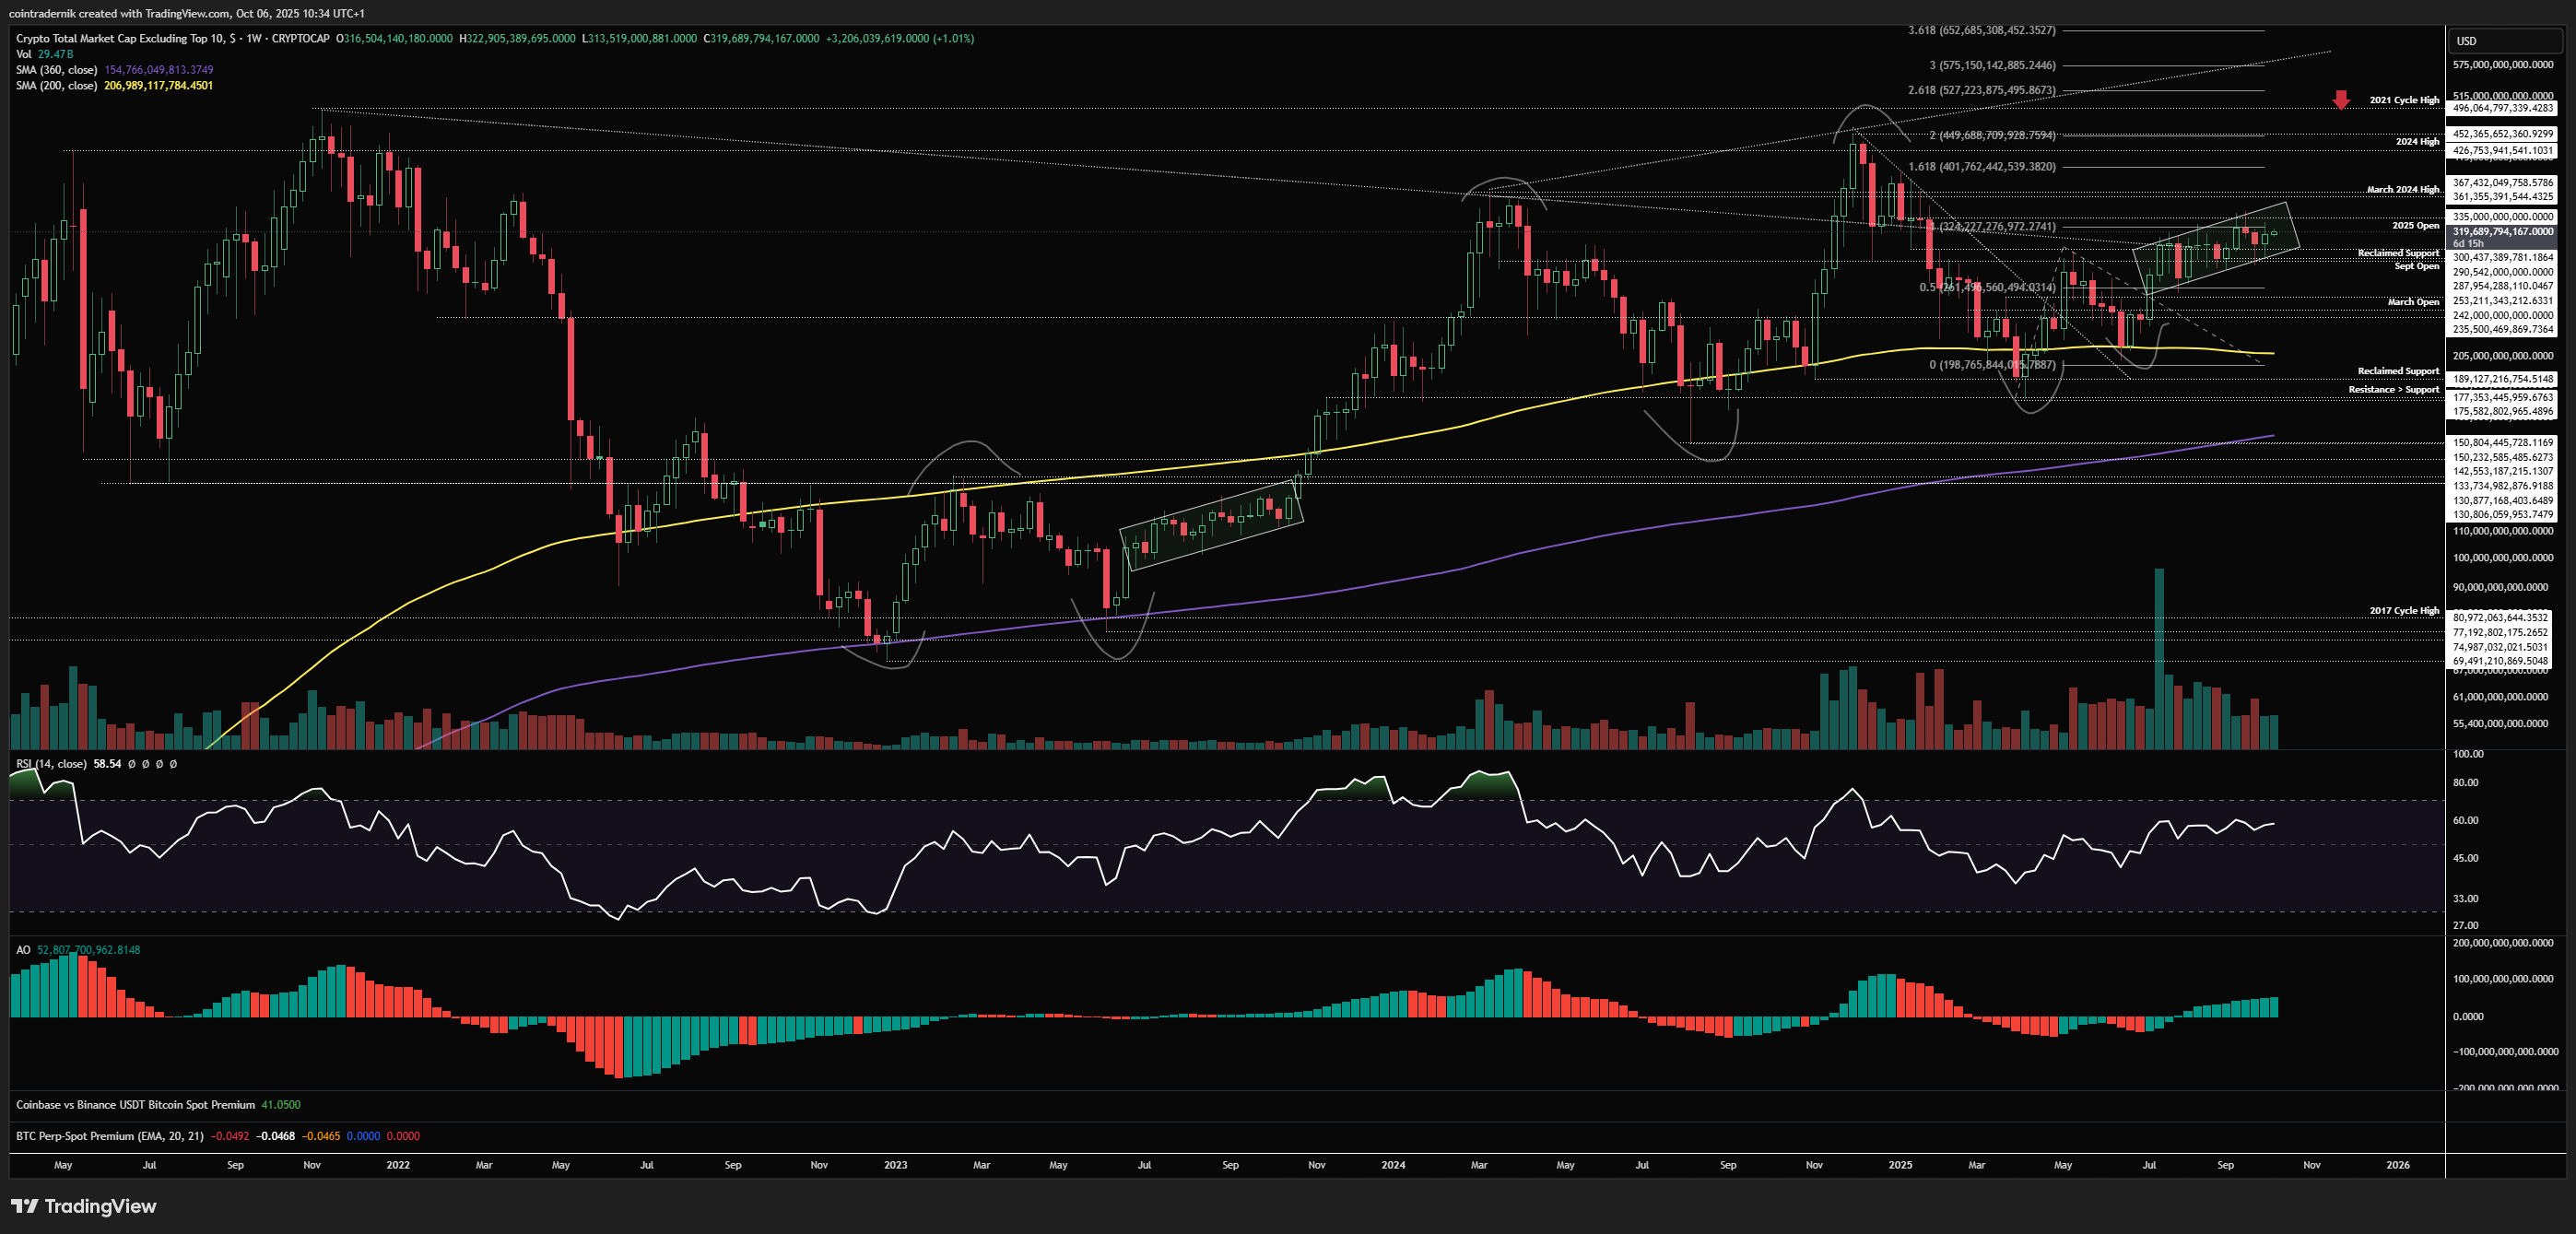
Looking at the weekly, we can see that alts continue to chop and grind higher almost identically to Q3 2023 and where a weekly close above $133bn was the catalyst for expansion back then (turning weekly structure bullish after the bear market), I think acceptance above the yearly open will be the catalyst here. If we get that weekly close above $335bn, I think we push swiftly into $367bn - the March 2024 high - then pushing through that in November to begin a leg higher into cycle highs and all-time highs between $450bn-$490bn. As mentioned above, I think if we're pushing into that zone in December, that's likely where we get another shakeout; if, instead, we're accelerating faster and are at those highs in early November, we would more probably push through into price discovery. Whilst this is making higher-lows and higher-highs, there's no reason to be bearish alts.
Daily:
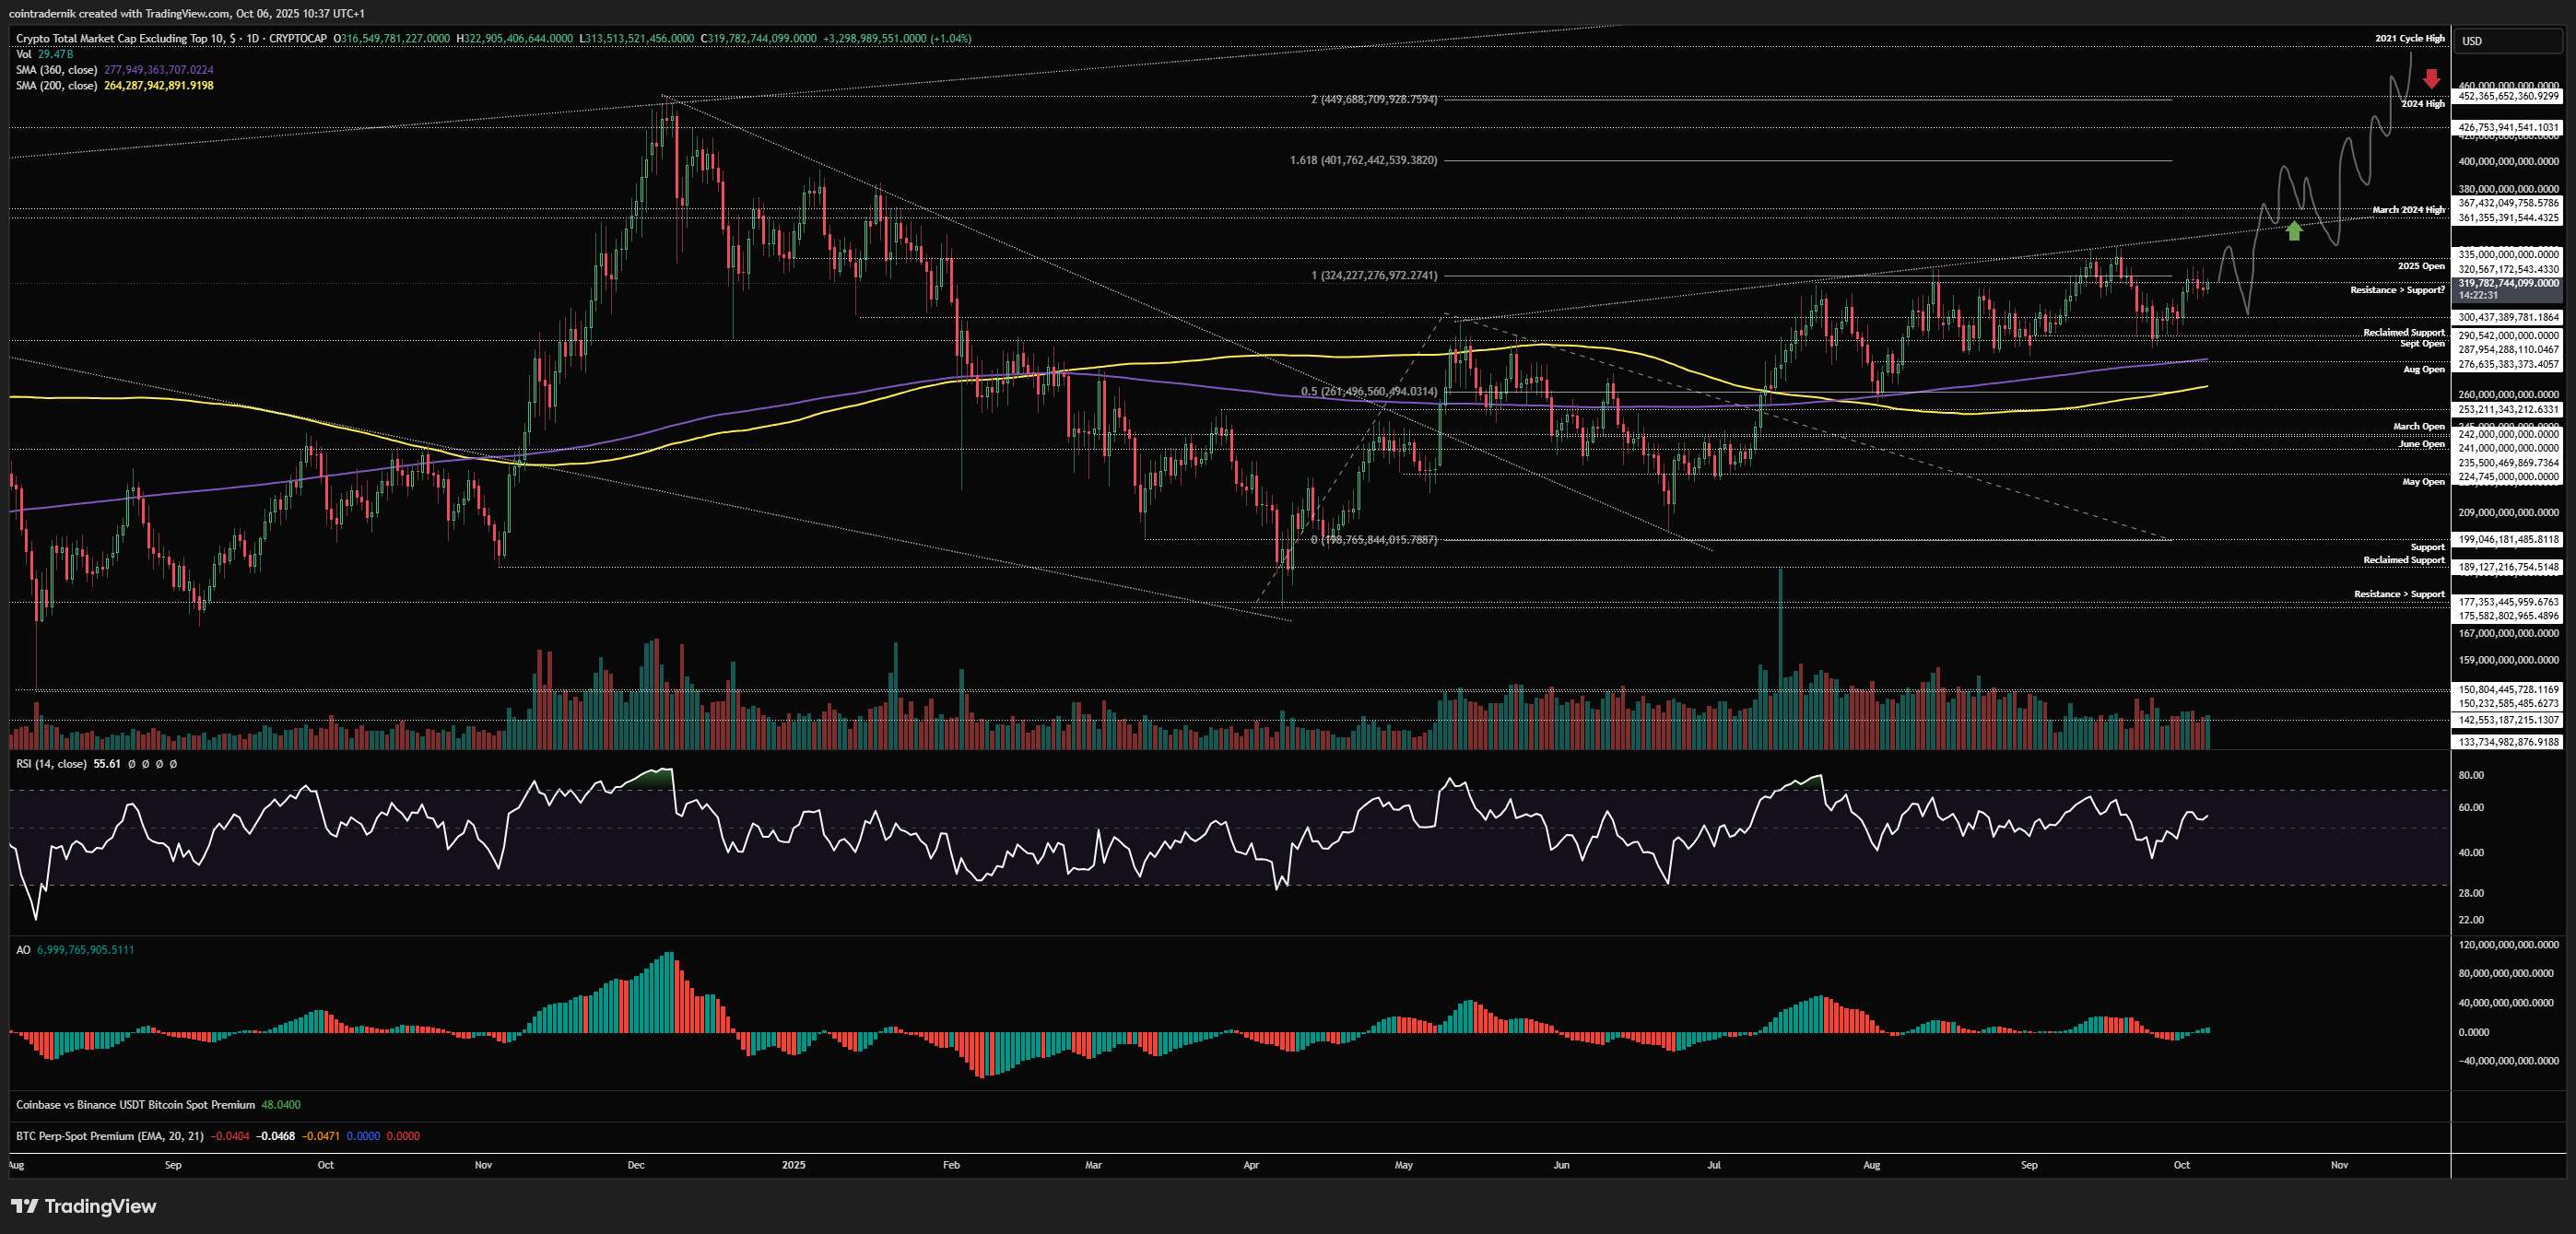
I have marked out a very rough trajectory on the daily, with alts breaking above the yearly open later this month and flipping the March 2024 highs as support, then sprinting higher into cycle highs in late Nov going into early December, where I expect some profit-taking and a brutal shakeout. Obviously it won't play out exactly like this and, as mentioned already, we may accelerate faster than this and be pushing through $500bn before we mark out a top, but I do think there is confluence for a multi-week top in December (from what I can see at present). Further, I do also think there are tailwinds for continuation into Q1 26...
OTHERS/BTC
Monthly:
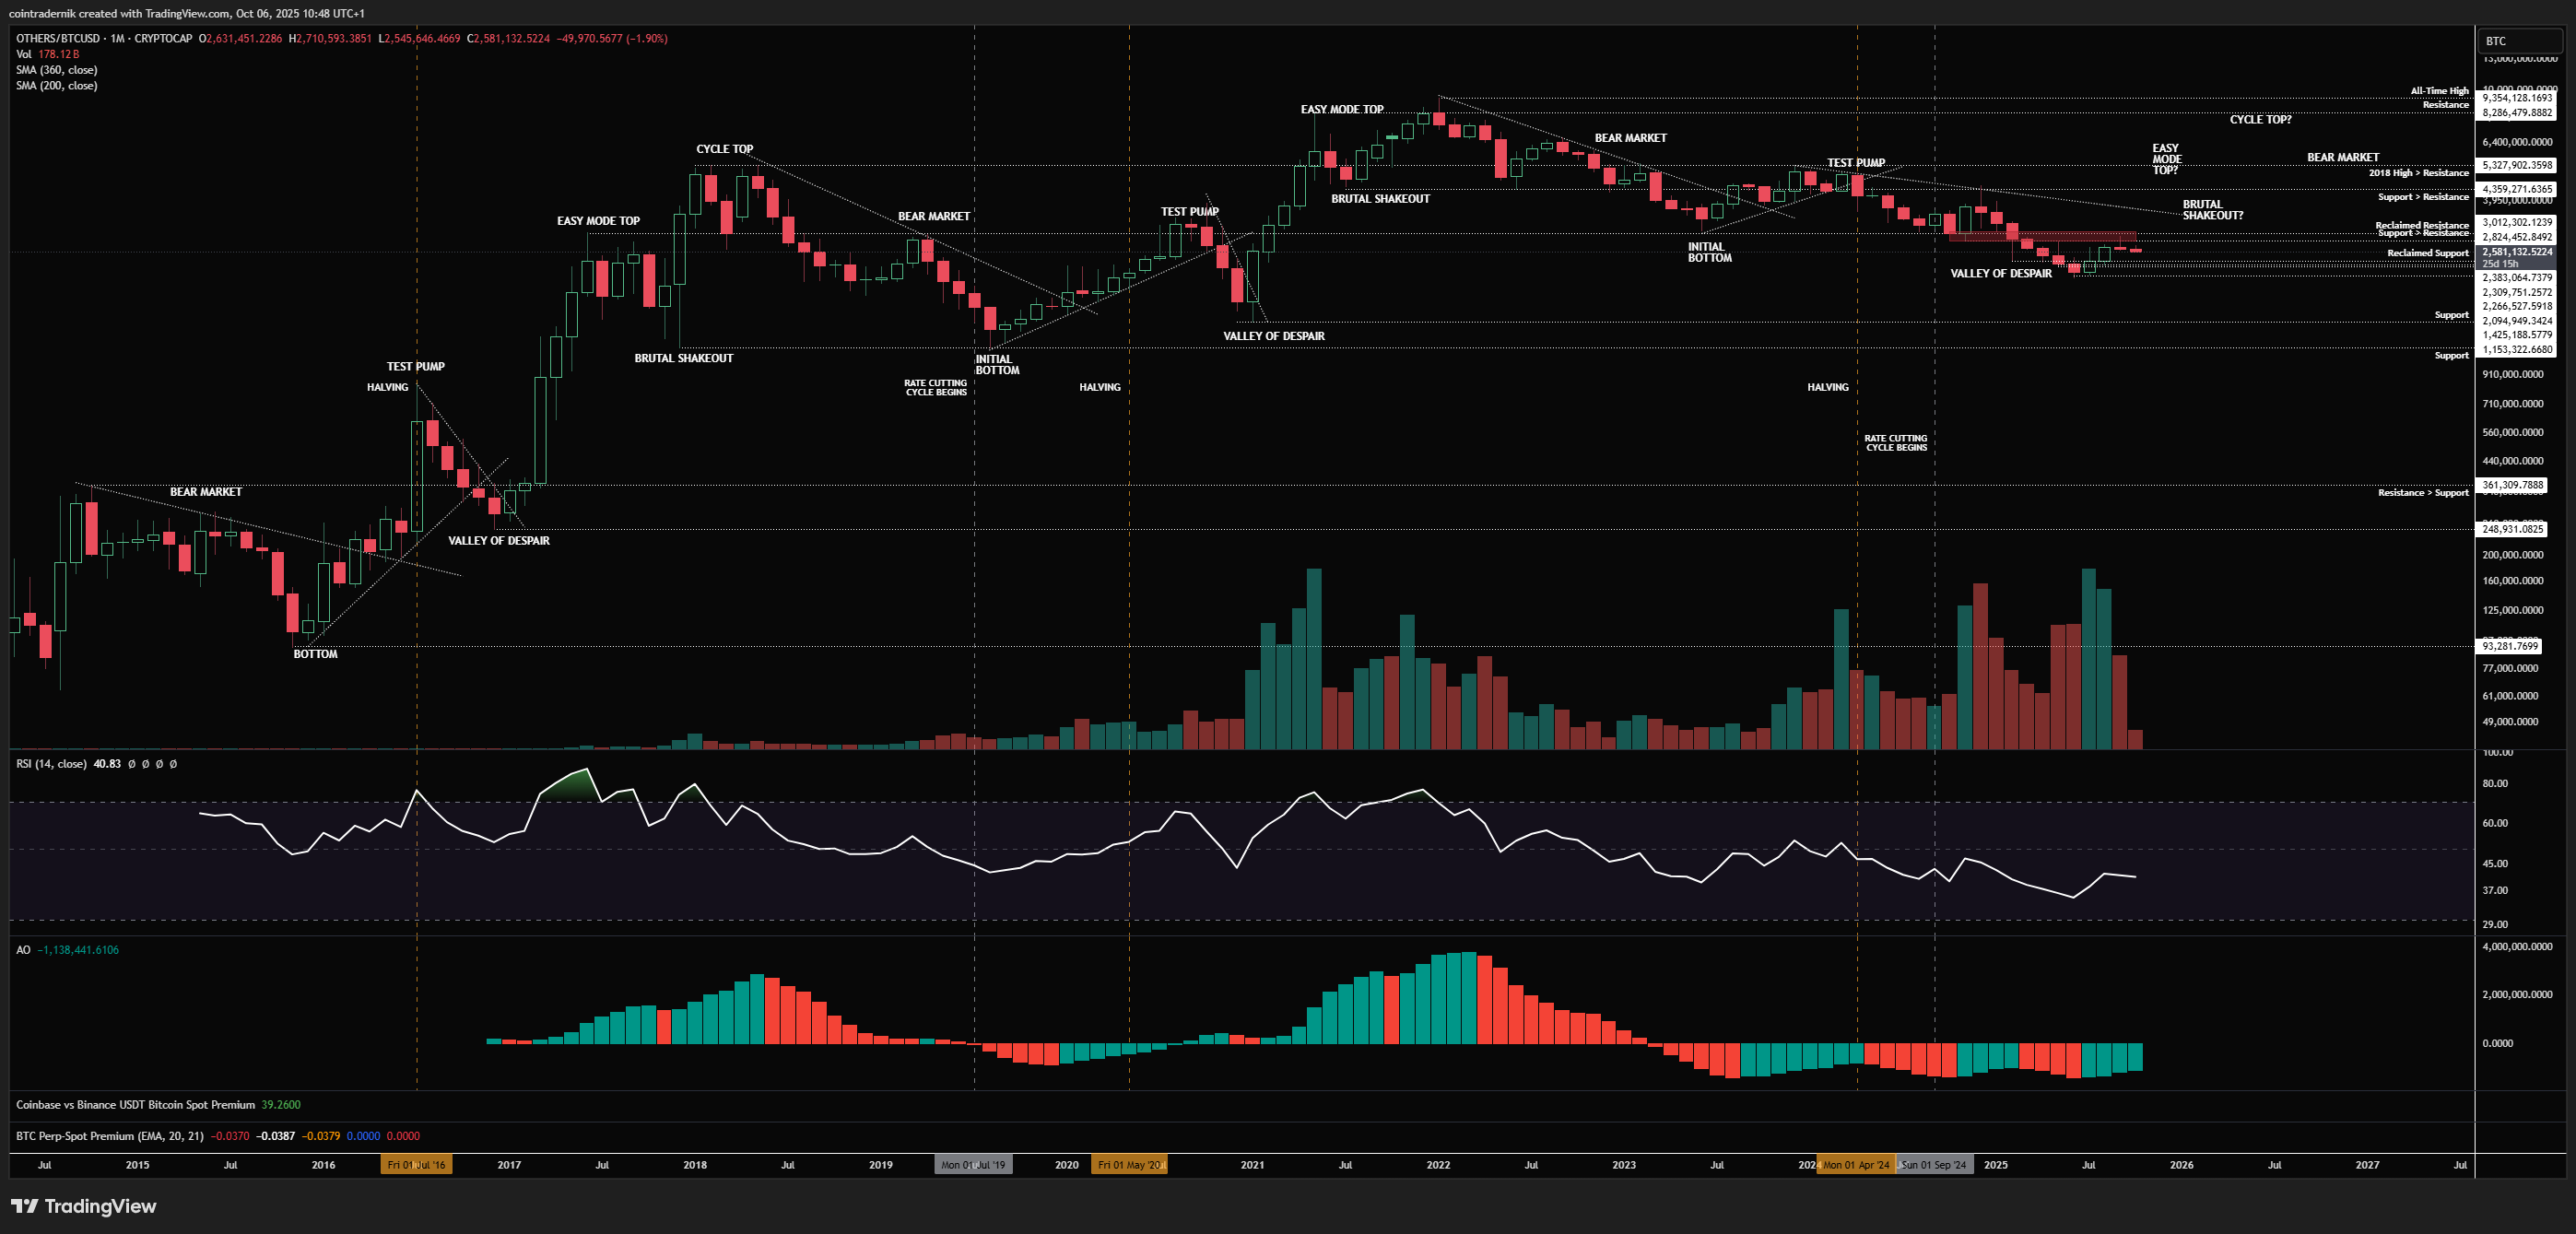
Looking at the monthly for OTHERS/BTC, we can see that alts vs BTC rejected at major resistance last month around 3mn BTC, but printed their first two consecutive green candles since the 2023 bottom. It is my expectation that we now hold a higher-low and close the month above the historical pivot at 3mn BTC, thus broadening out the outperformance of alts. If we do close October above 3mn BTC, I think the rest of Q4 sees alts outperform sharply, pushing towards 4.4mn BTC into year-end, before what I expect to be a brutal shakeout before the final leg higher in Q1 26. Invalidation of this is obviously a monthly close below 2.1mn BTC.
Weekly:
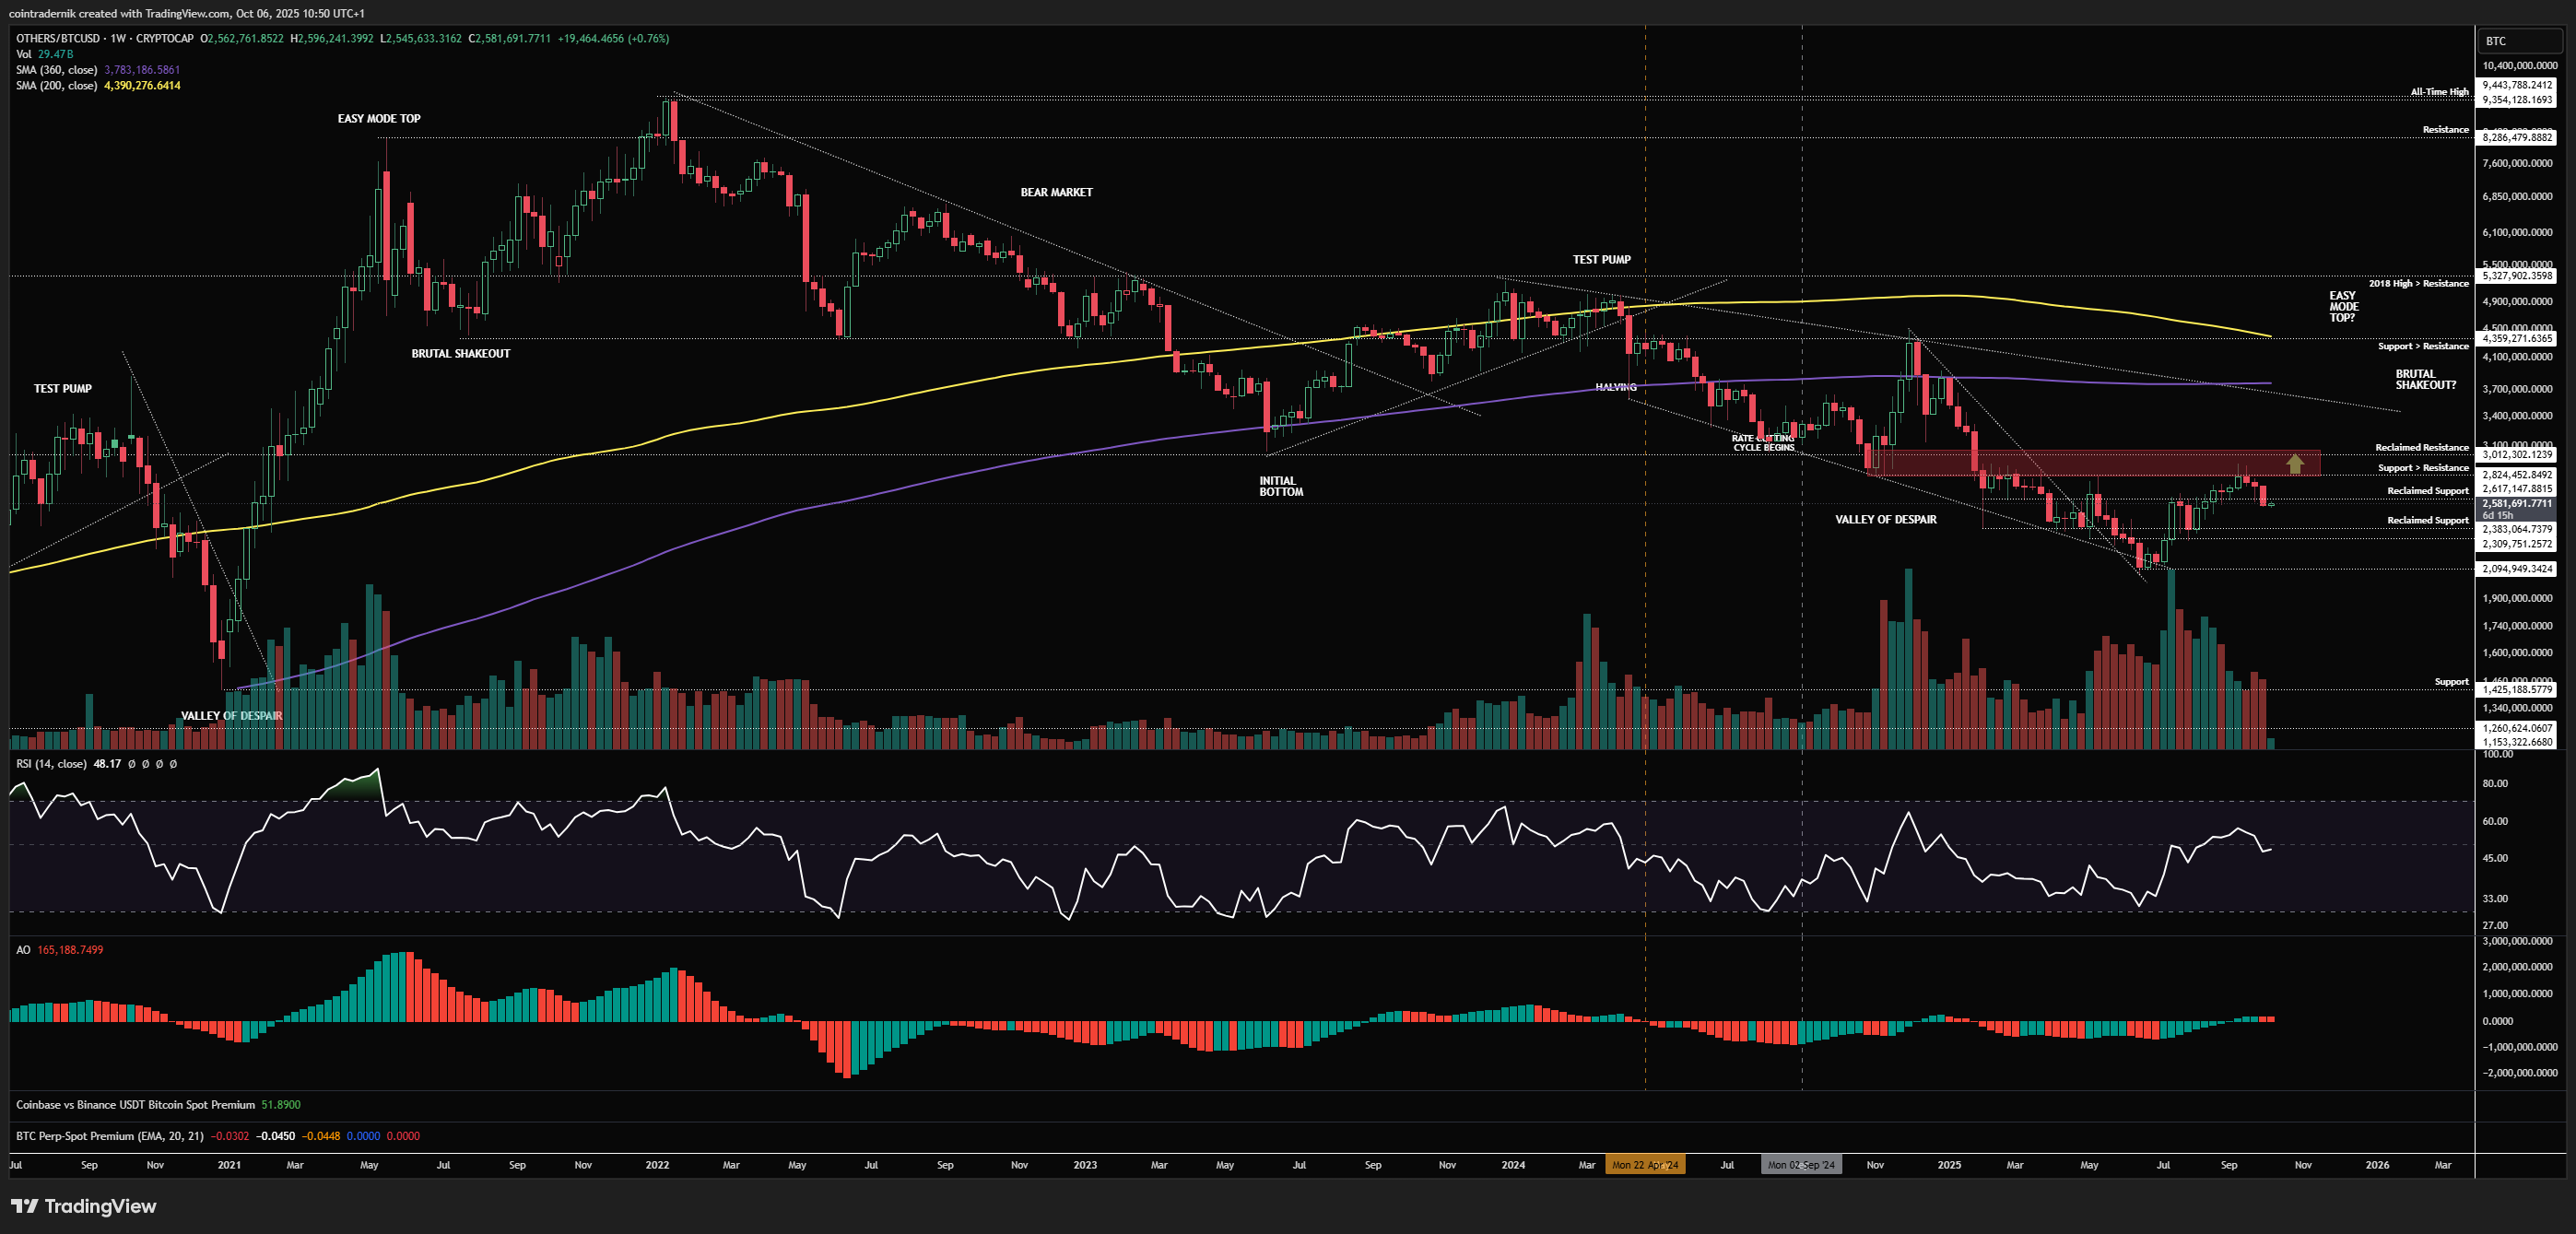
Looking at the weekly, we can see weekly structure is bullish, as is momentum, with alts rejecting into that resistance cluster as anticipated and pulling back here to form a higher-low above 2.3mn. As long as that low is protected and we don't close the weekly below it, all of this should be viewed as the formation of that higher-low from which we are likely to push back above 3mn BTC. Acceptance above the red box = 200wMA retest, in my opinion, likely followed by a retest of 3mn BTC as support during that anticipated year-end shakeout before continuation through the 200wMA towards ~8mn BTC.
Daily:
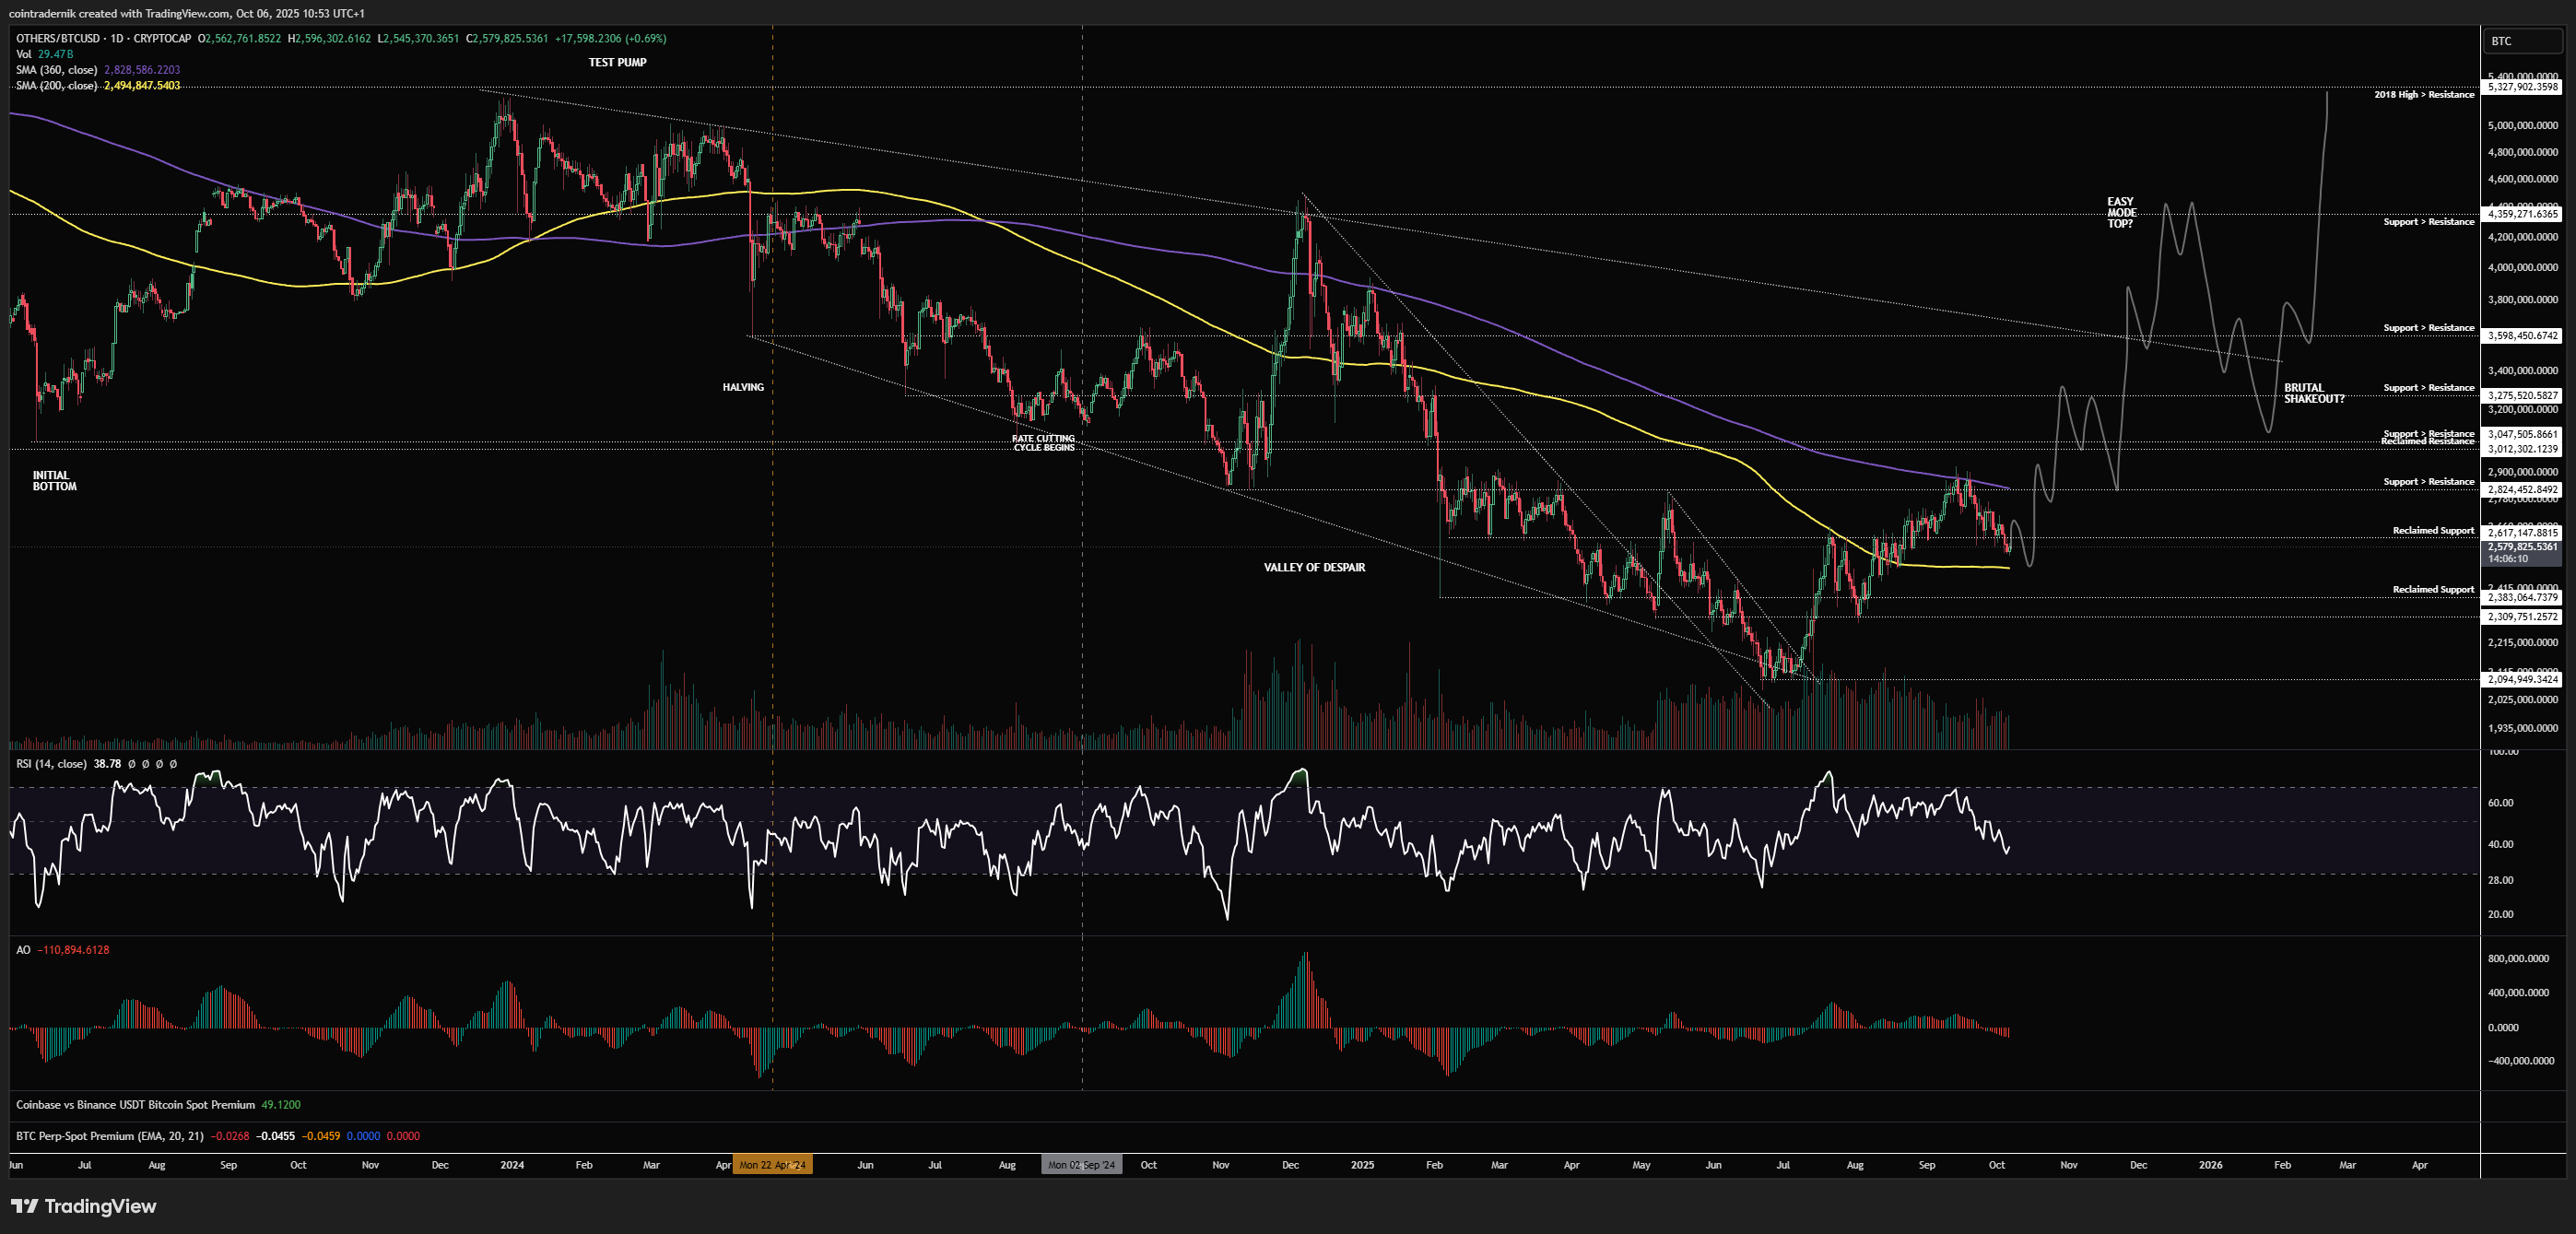
Again, this has been marked out crudely here and no doubt it will play out quite differently to this, but these are my current expectations for alts vs BTC: a rally above the 360dMA and major resistance cluster at 3mn BTC sometime this month, leading to expansion through trendline resistance into the Dec 2024 top at 4.4mn BTC late in Q4 -> a brutal shakeout back towards the ~3mn BTC area into January, followed by a more classical blow-off top later in Q1. I will update these views as we move through the quarter.
I hope you've found some value in the read this week!
And if you've not already signed up for Ostium, please do so and test out some of the recent updates, including:
Sign up here (you don't have to use my ref link, of course): https://ostium.app/trade?from=CL&to=USD&ref=CTNIK

.avif)