

Market Outlook #62
November 26, 2025
-
12
min read


This blog references an opinion and is for entertainment and informational purposes only. It is not intended to be investment advice. Seek a duly licensed professional for investment advice.
In this 62nd Market Outlook here at Ostium Research, we'll be taking a look at the week ahead in markets, focusing specifically on price-action, positioning and event risk for Bitcoin, Ethereum, Dollar Index, Gold and SPX.
Firstly, let's take another look at the rest of this week's calendar:
WEDNESDAY: RBNZ INTEREST RATE DECISION: (CONSENSUS 2.25% VS PREVIOUS 2.5%)
WEDNESDAY: US DURABLE GOODS ORDERS (SEP): (CONSENSUS 0.2% VS PREVIOUS 2.9%)
WEDNESDAY: US CHICAGO PMI (NOV): (CONSENSUS N/A VS PREVIOUS 43.8)
WEDNESDAY: US INITIAL JOBLESS CLAIMS: (CONSENSUS N/A VS PREVIOUS 220K)
WEDNESDAY: FED'S BEIGE BOOK
THURSDAY: TOKYO CPI (YOY) (NOV): (CONSENSUS 2.7% VS PREVIOUS 2.8%)
Now, let's dig into asset-specific price-action for the week ahead, looking firstly at Bitcoin:
Price: $86,962
Weekly:

If we begin by looking at Bitcoin on the weekly timeframe, we can see that last week saw continuation lower following the breakdown below the yearly VWAP, with price rejecting at the monthly VWAP near $96k and selling off from that high into and below the Q2 open at $83.5k, forming a low above $80k and bouncing to close at $86.8k. Weekly momentum is firmly bearish here but we are now trading into higher timeframe support around those March/April lows above $74k. Last week saw the highest weekly volume traded since that capitulation dump that preceded the formation of the bottoming range in late February. It is no surprise that early trading this week has seen price range-bound between $85.2k and $89.2k, well within the prior weekly range. I would imagine the rest of this week sees us continue to consolidate within that prior weekly range, expanding beyond either side next week. Monthly VWAP at $95.7k should cap any rallies this week and as long as we hold above $82.5k I would expect last week's low to hold too for the next few days. What I think is most probable here is that following the formation of an inside week this week, we see range expansion next week, more likely to the upside to clean up some of the unswept local highs throughout this sell-off. If we trade into the yearly VWAP / 365d rolling VWAP, which is roughly confluent with the anchored VWAP from the all-time high, this would be where I think we could form a lower-high if we are to trade into a complacency shoulder and continue lower through $74k from there towards the 200wMA at $56k in traditional 4-year cycle fashion. However, looking at last week's price-action in the broader markets followed by this week's movements, into the Nov close, there is a pretty high probability that the stuff that really impacts the longevity of the BTC 'cycle' has put in a nasty bear trap and is now reclaiming key levels. I shared more on this on X and will stick to price-action analysis of BTC here, but junk bonds and cross-sector outperformance in equities (as well as equal-weight SPX) looks to have unwound all of the prior week's move lower and is turning daily structure bullish whilst trading back above anchored VWAPs from yearly highs. This is not bearish and reaffirms a 'higher for longer' view into 2026. Naturally, this also gives us a really nice invalidation on this view, because if we now unwind the unwind and move below last week's lows on all of these key markets, it's a pretty clear indicator for a tumultuous time for risk over the coming months; conversely, it is really hard to be bearish on Bitcoin, expecting a classical 4-year cycle with continuation of this downtrend below $74k, if junk bonds move back to yearly highs, credit spreads tighten up, real rates fall, the Dollar rolls over and microcaps vs consumer staples, high beta vs low vol, growth vs value etc. all return to outperforming. If one looks solely at IWM (smallcaps) or IWC (microcaps), it looks like last week was a massive bear trap that has been retraced fully, therefore is the more probable path ahead price discovery above a 4-year resistance level on IWM? And, if so, in that environment for risk appetite, do we think it is more probable that Bitcoin outperforms again, having already digested a huge amount of selling and drawing down 36% from the high? I'd be lying if I said I was 100% confident on any path ahead right now, as there continue to be mixed signals, but if we see the broader market indicators turn higher, I think there's a very good chance Bitcoin puts in a higher-low here above the $74k April low and returns to new all-time highs in Q1, continuing higher from there. Now, the tactical way to play this would be to await a move higher into that zone between $100k-$110k (intentionally broad here), look for signs of trend exhaustion on the daily timeframe, sell/derisk/hedge/short whatever you want off your book, and then if it is a complacency shoulder you can look to re-add risk much lower much later or if we accept above these key levels you can re-add that risk (if you wish) at a higher price, accepting that that is the cost of more confidence in your positioning.
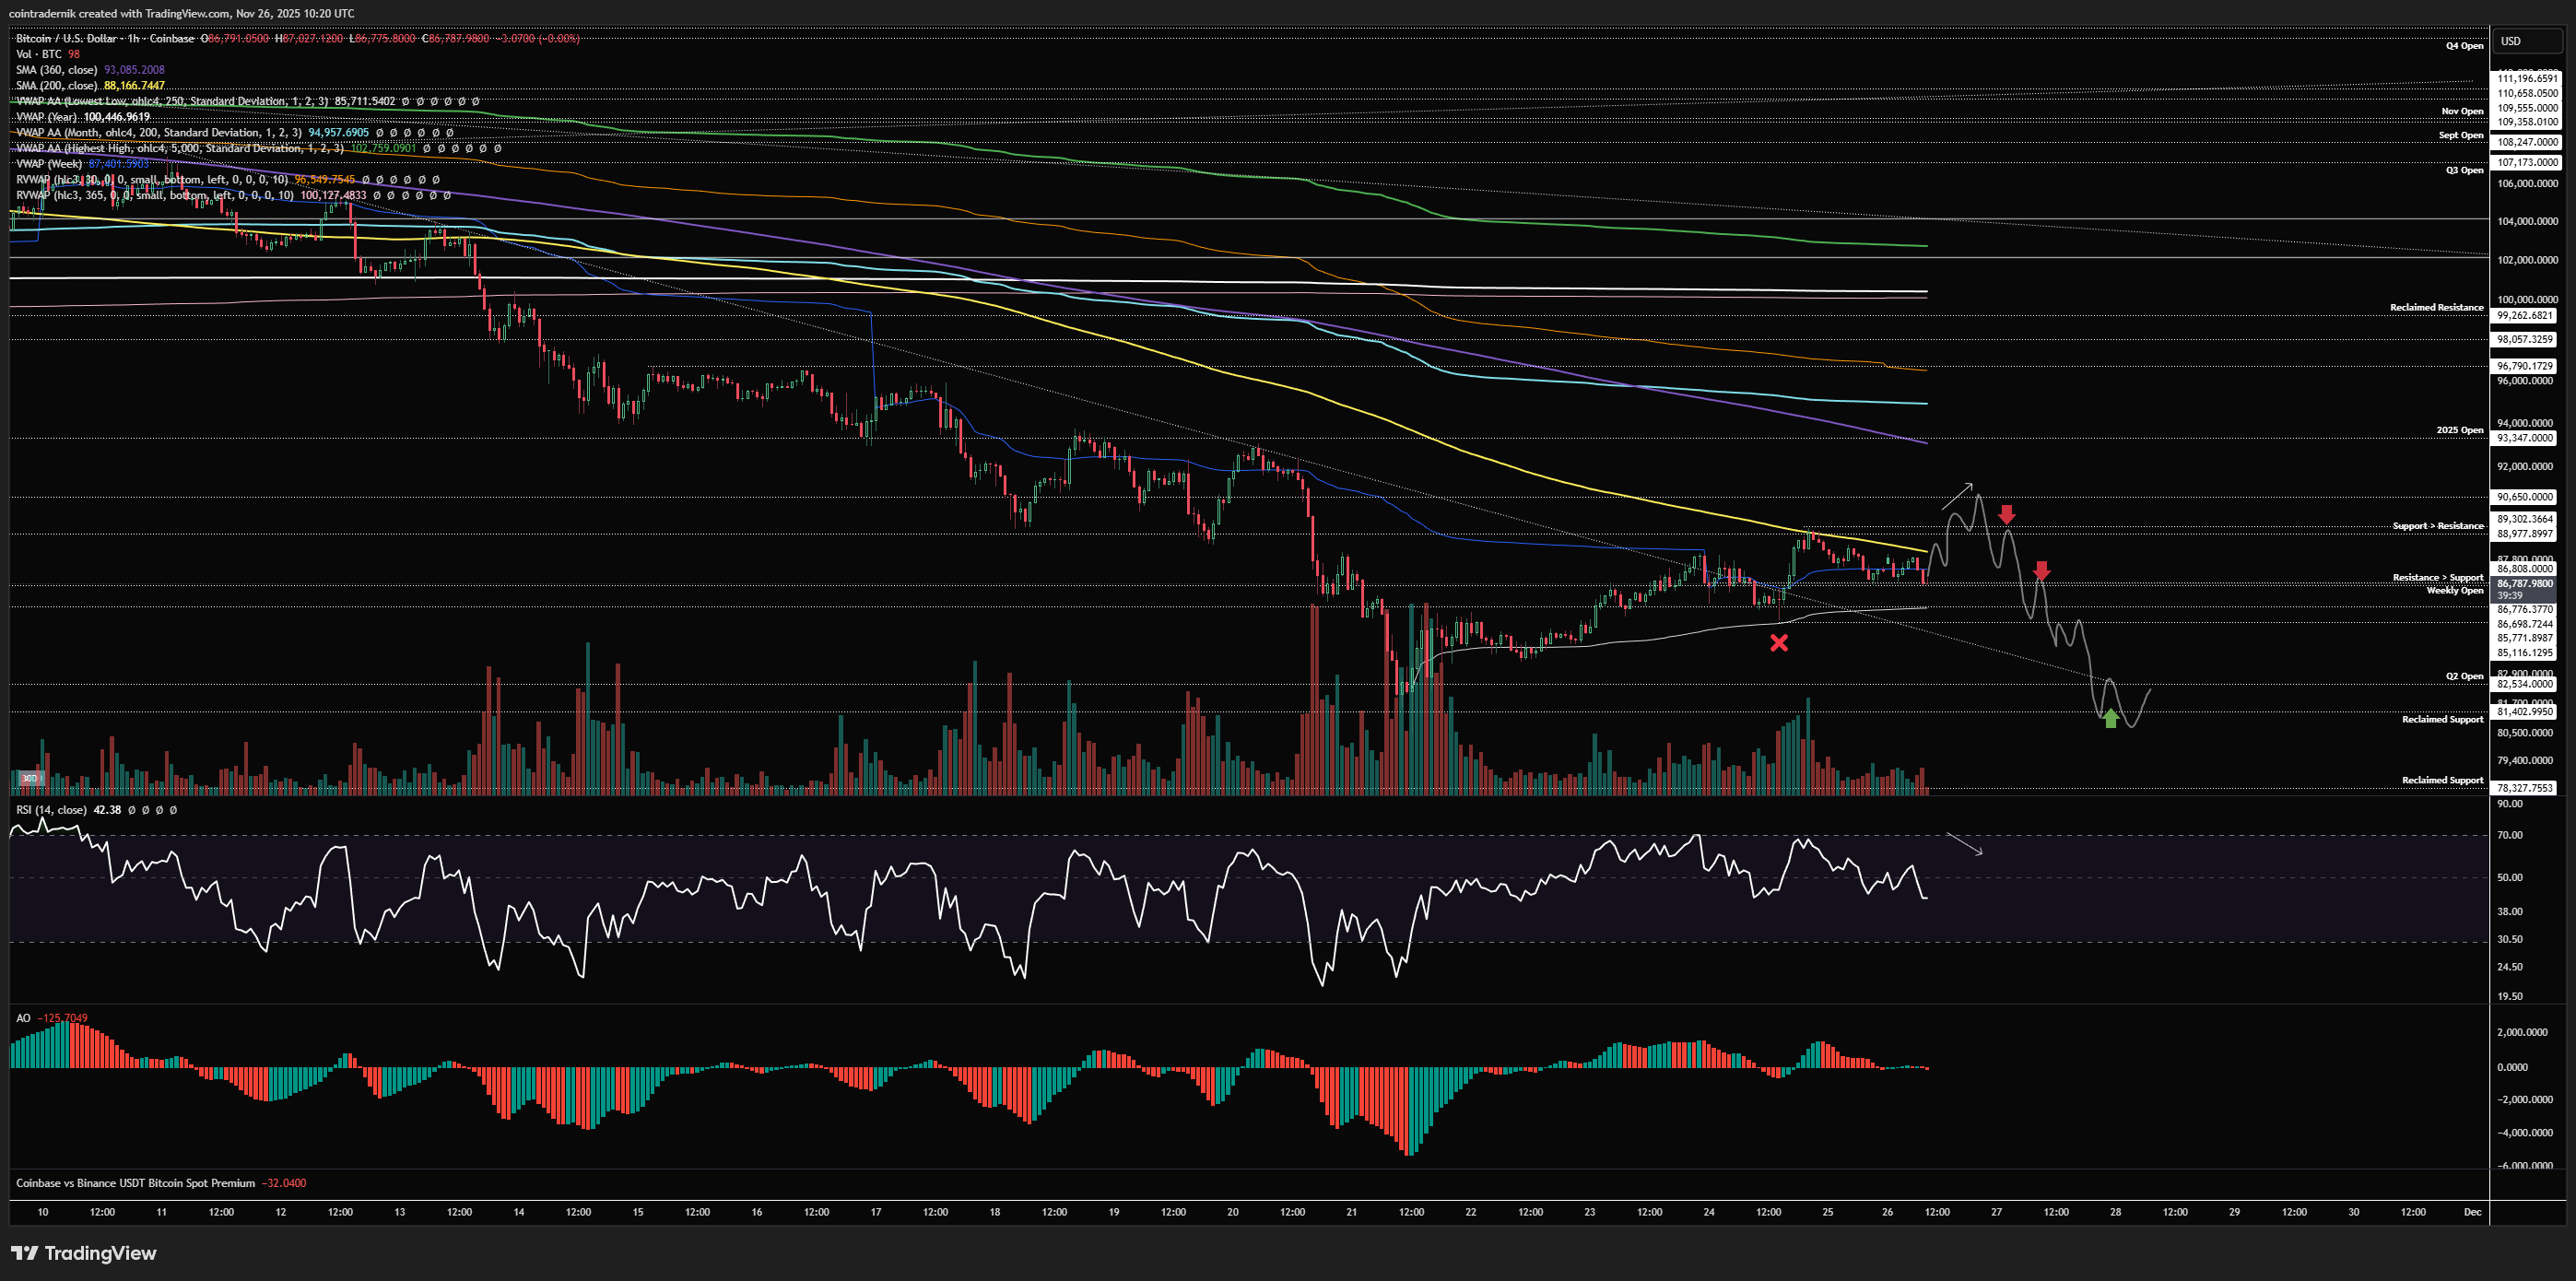
Daily:

Now, looking at the daily, we can see that price has not shown any signs of trend exhaustion on the daily but we are approaching extremes last seen in late February, from which we did see a meaningful bounce before the trend exhaustion / momentum divergences could form in March. We have put in a low on the highest daily volume since January and price has bounced off that low to marginally break above trendline resistance from the $107k swing-high that preceded this huge leg lower. We have reclaimed $86.7k as support here but price is capped by prior support up near $89k. If we are rejecting here, we could see another retest of the Q2 open at $82.5k that would be a likely candidate for some momentum divergence on this timeframe, from which a larger bounce would be probable back into and above the yearly open, with the monthly VWAP above that at $95k as key resistance. If we closed below $82.5k and did not put in some momentum divergence into that low, it would look awful, and I would expect $78k to be tagged as major support before another bounce is attempted. It's important to note that a move into $78k short-term would be a 2 std dev move below the 365d rolling VWAP, which is incredibly rare and tends to mark a multi-week bottom if tagged historically (June 2022, March 2020 and Dec 2018 are examples). As such, there is a good chance we are front-running that area here but it is potentially a great bid if we tag it with some trend exhaustion over the next week or two. If we can hold above $86.7k this week and close the daily above $89k, I think that leads to a sweep of the yearly open at $93.3k, with multiple local highs in that region that remain untapped. Reaction in that area will determine whether we keep squeezing higher into that huge support turned resistance zone above or go lower to attempt to mark out a higher-low.
So, given all of the chaos, what can we look for from the rest of the week with regards to setups? Well, if we run today's low into the anchored VWAP from last week's low around $86k, I think that's a high R/R long for that squeeze higher, where you could add half on a tag of that level and half on the first pullback above $89k, looking for $93k as a first TP followed by $97k to clear out that double top, obviously moving your stops higher as price-action evolves:

On the short side, I would say you don't want to see $86k tagged today but price to keep squeezing higher above $89k, then rejecting with bearish divergence only a little above that level (say $90.6kish) and then sell the first pullback after a break and close back inside $89k, then adding below the weekly open and looking for a retest of $82.5k at least, though probably a sweep of last week's low into the major support below if this is how price-action plays out into the monthly and weekly close:
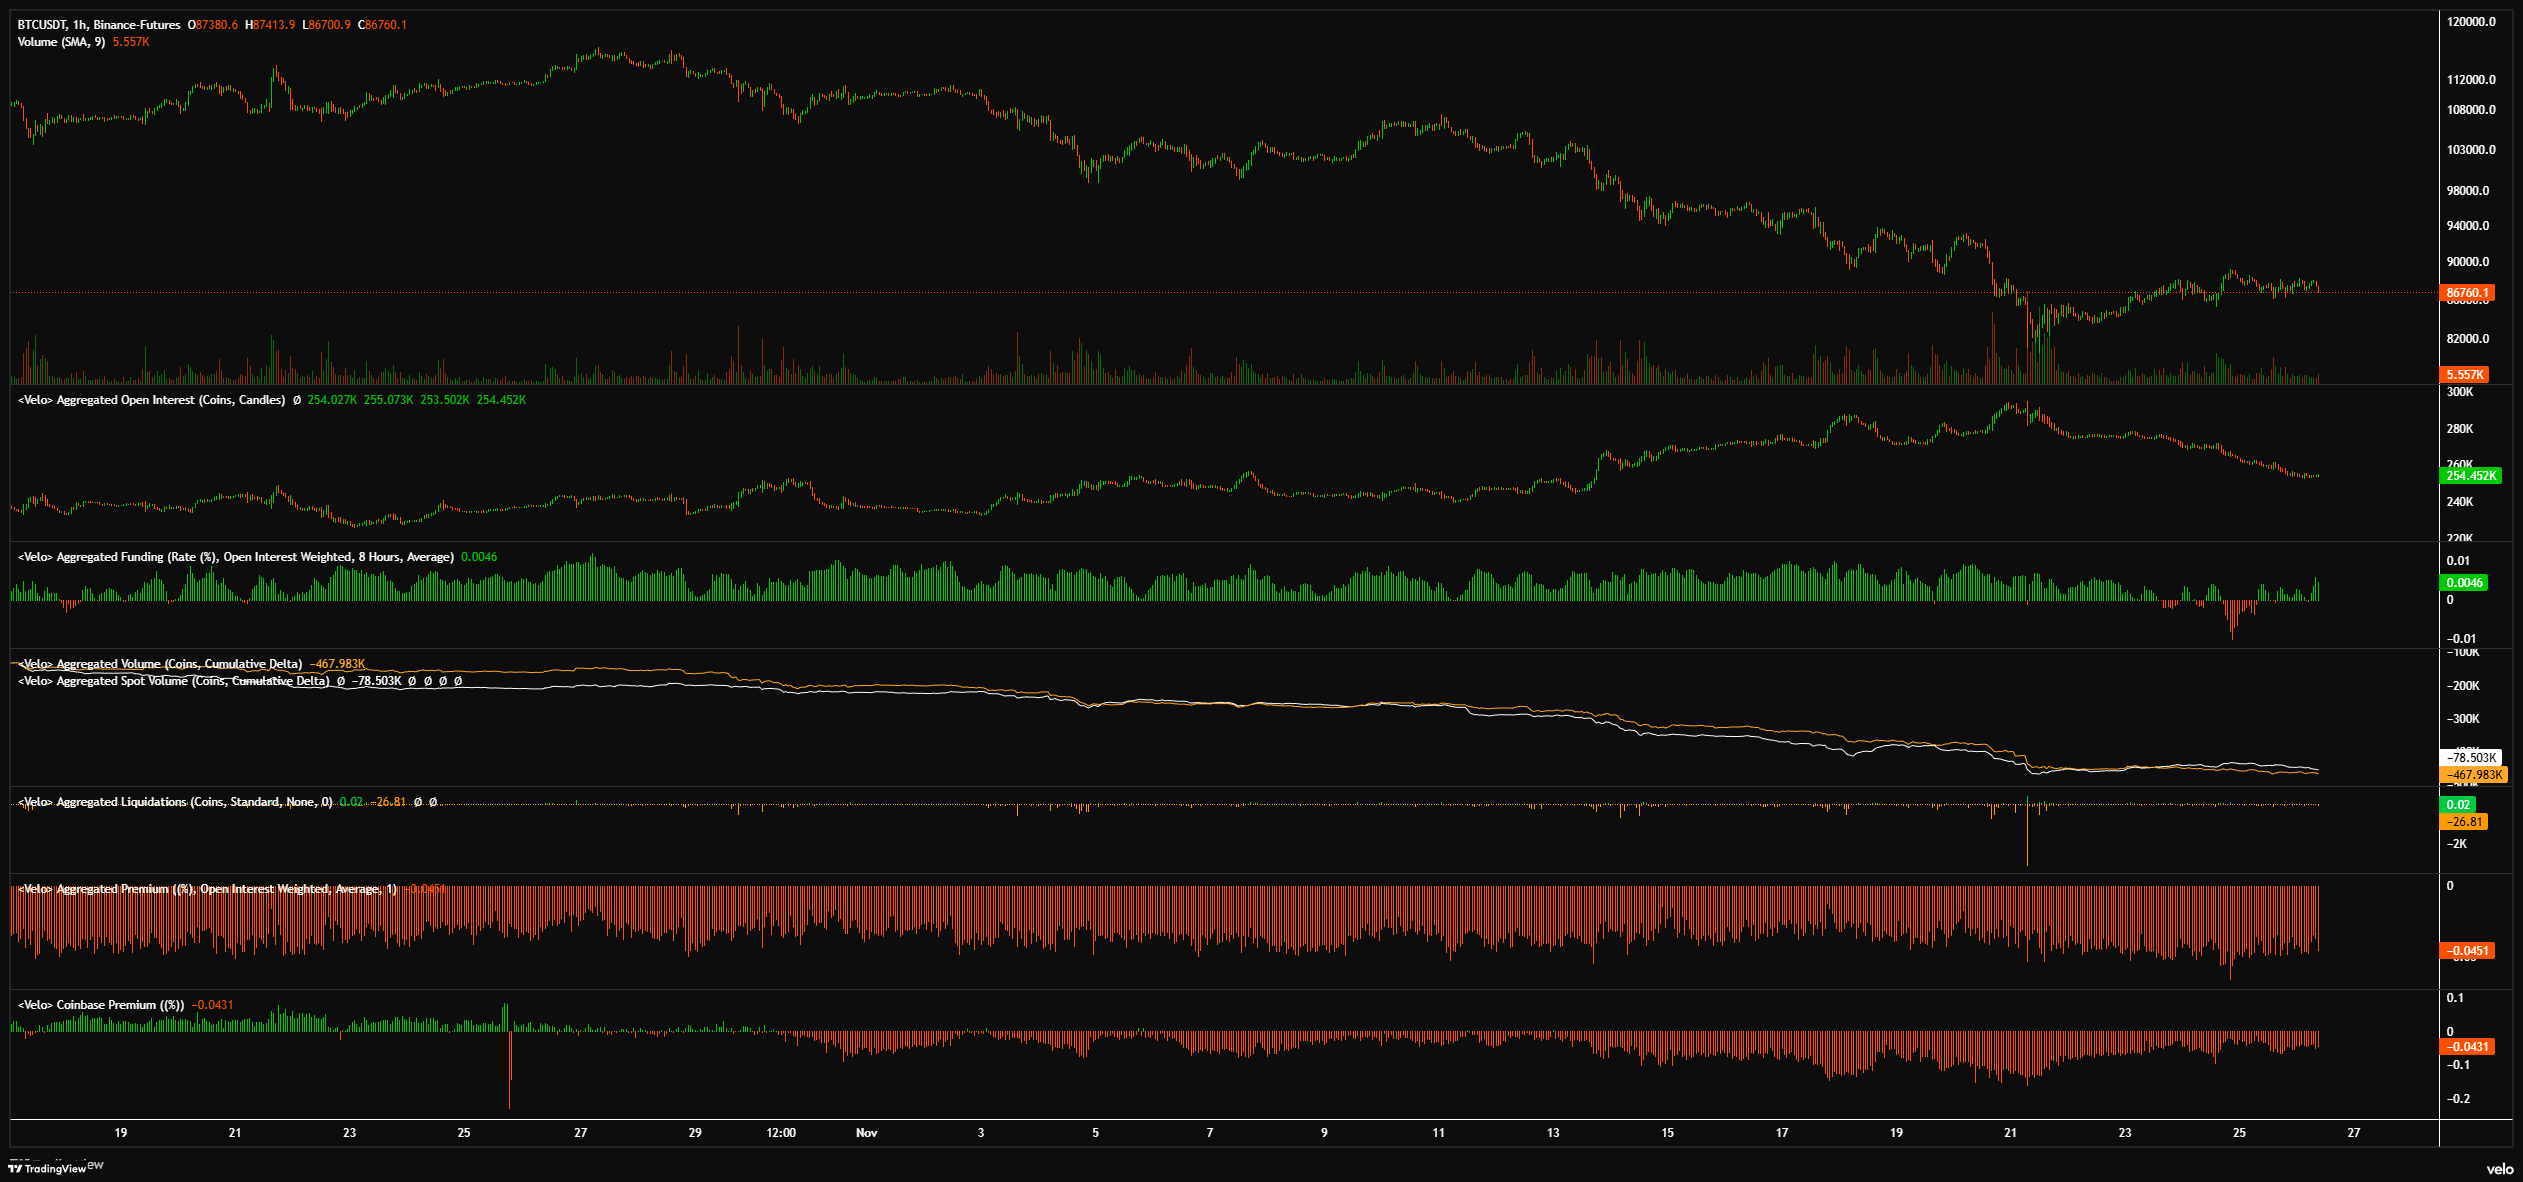
And here's a snapshot of positioning across Velo and CoinGlass:

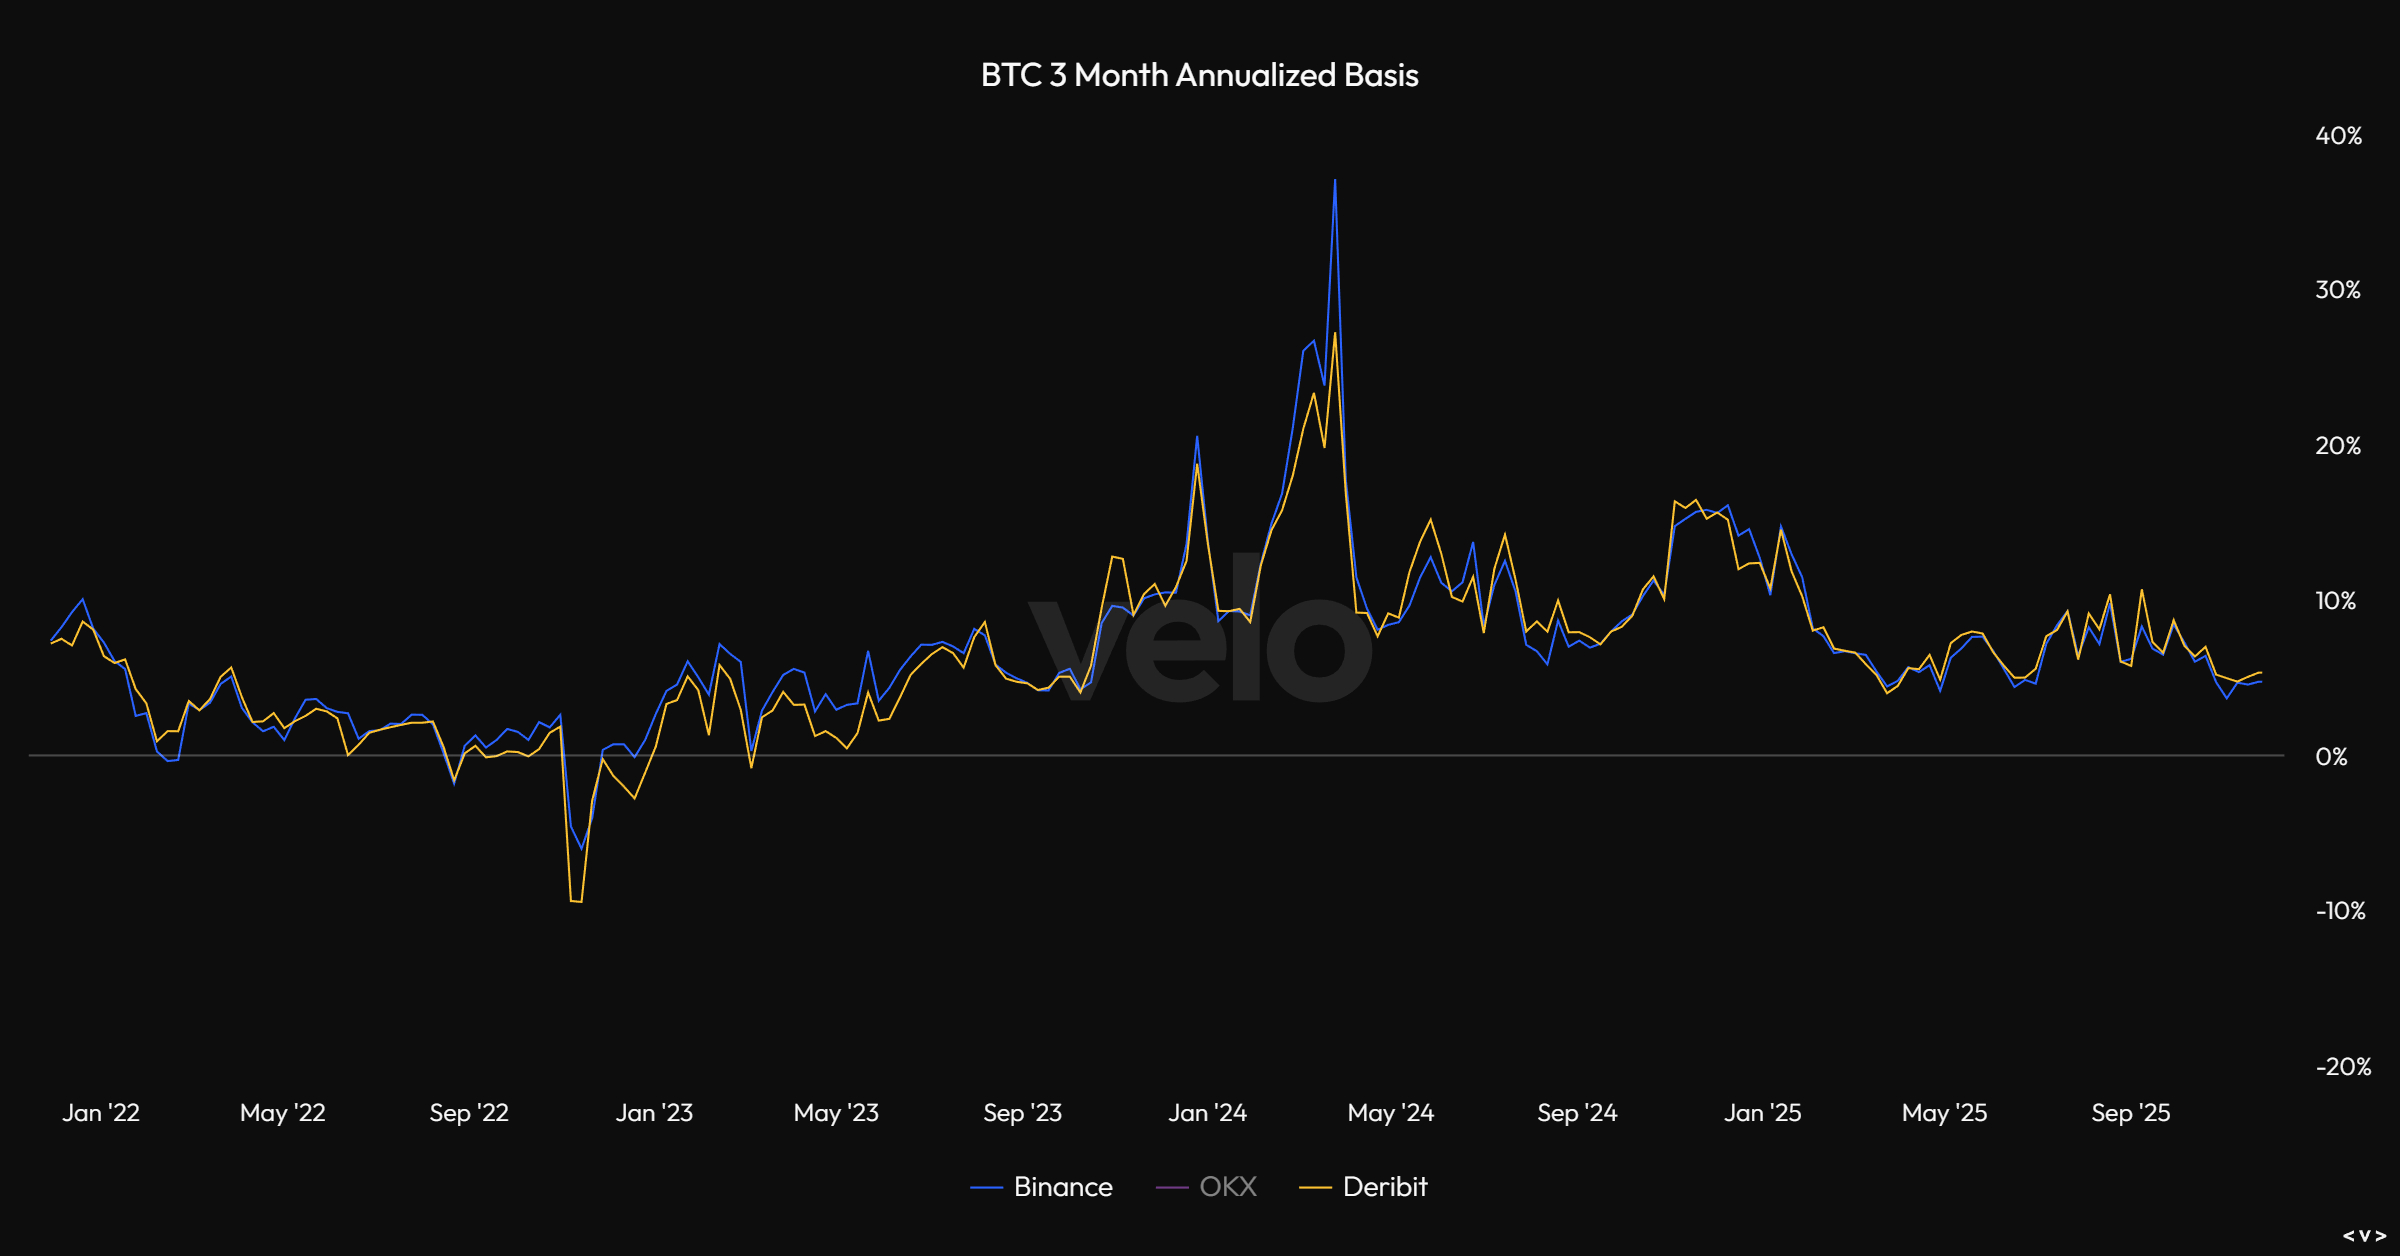
And here's 3-month annualized basis:
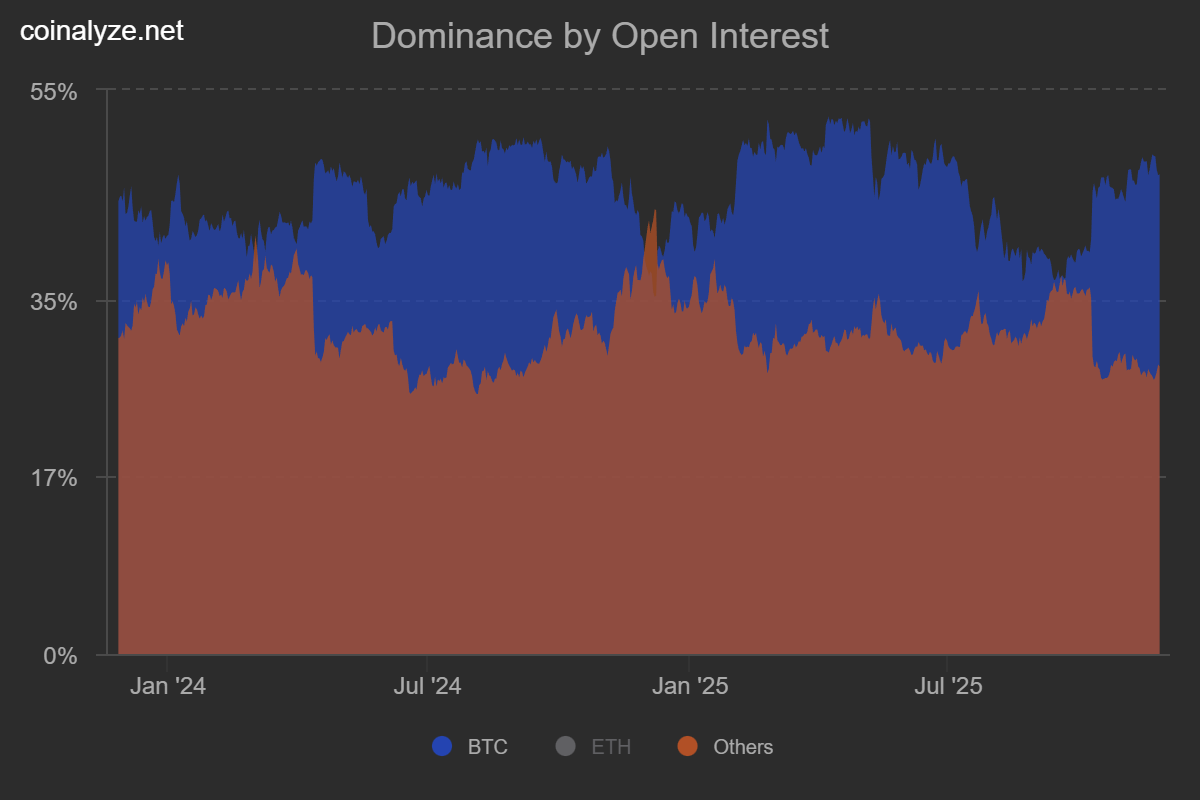
And Bitcoin OI vs Altcoin OI:
And finally some of the expected 1-week and 1-month liquidation levels:
-2025-11-26_10_01_27.png)
-2025-11-26_10_01_52.png)
Price: $2913
ETH/USD
Weekly:

Beginning with the weekly for ETH/USD, we can see that price found resistance below the monthly VWAP at $3241 and the yearly VWAP at $3050 last week, as well as flipping the anchored VWAP from the April lows into resistance. We then sold off into $2633 before bouncing to close around $2800, marginally below prior resistance turned support. Price-action early this week has reclaimed that support level and is trading around $2913, well within the prior weekly range, same as BTC. I would expect similar price-action to BTC here this week, with continued consolidation before expansion into early Dec, where if we can close back above $3050 I would expect the yearly open at $3330 to be retested, with acceptance back above that level leading to a much larger squeeze back towards $3770, which is the strongest candidate (in my opinion) for the formation of a complacency shoulder below the multi-year pivot at $4093. We have multiple key prior supports, MA and VWAPs clustered between $3770-$4093 and that would be the highest R/R zone to look for shorts for further downside given the clean invalidation. Obviously, the same broader market view applies as was shared above re: Bitcoin - if everything else is pointing towards a growth scare-led bear trap that is reversed, with the forward outlook on growth, inflation and liquidity rebounding, then I would not expect the formation of a complacency shoulder but rather continuation 'higher for longer' of this multi-year uptrend, through $5000 into price discovery in Q1 2026. Short-term, we can only look towards playing either side of the prior weekly range, with a weekly close below last week's low opening up further downside towards (and likely below) the 200wMA, whereas acceptance back above the yearly VWAP gives us confidence in longs into $3330 and potentially much higher.
Daily:

Turning to the daily, we can see that daily momentum and structure remain bearish with no trend exhaustion in sight, and prior support continues to be flipped into resistance. We remain below the yearly VWAP / 365d rolling VWAP / 360dMA (all of which are roughly aligned at $3050-$3100) and until we flip these back into support we should expect continuation of the trend lower. What would be bullish for a big short squeeze and durable low would be daily RSI back above 50 as price reclaims $3050, from which point I would expect the $3330 yearly open to be tagged at the very least, if not the larger move higher into $3770ish. Rejection this week below $3050 and a daily close below $2710 would open up that Q3 open retest at $2486 (also the 200wMA), though I don't know how well this level would hold and I'd be looking for signs of momentum exhaustion into that range between $2281 and $2486 before looking for longs.
ETH/BTC
Weekly:
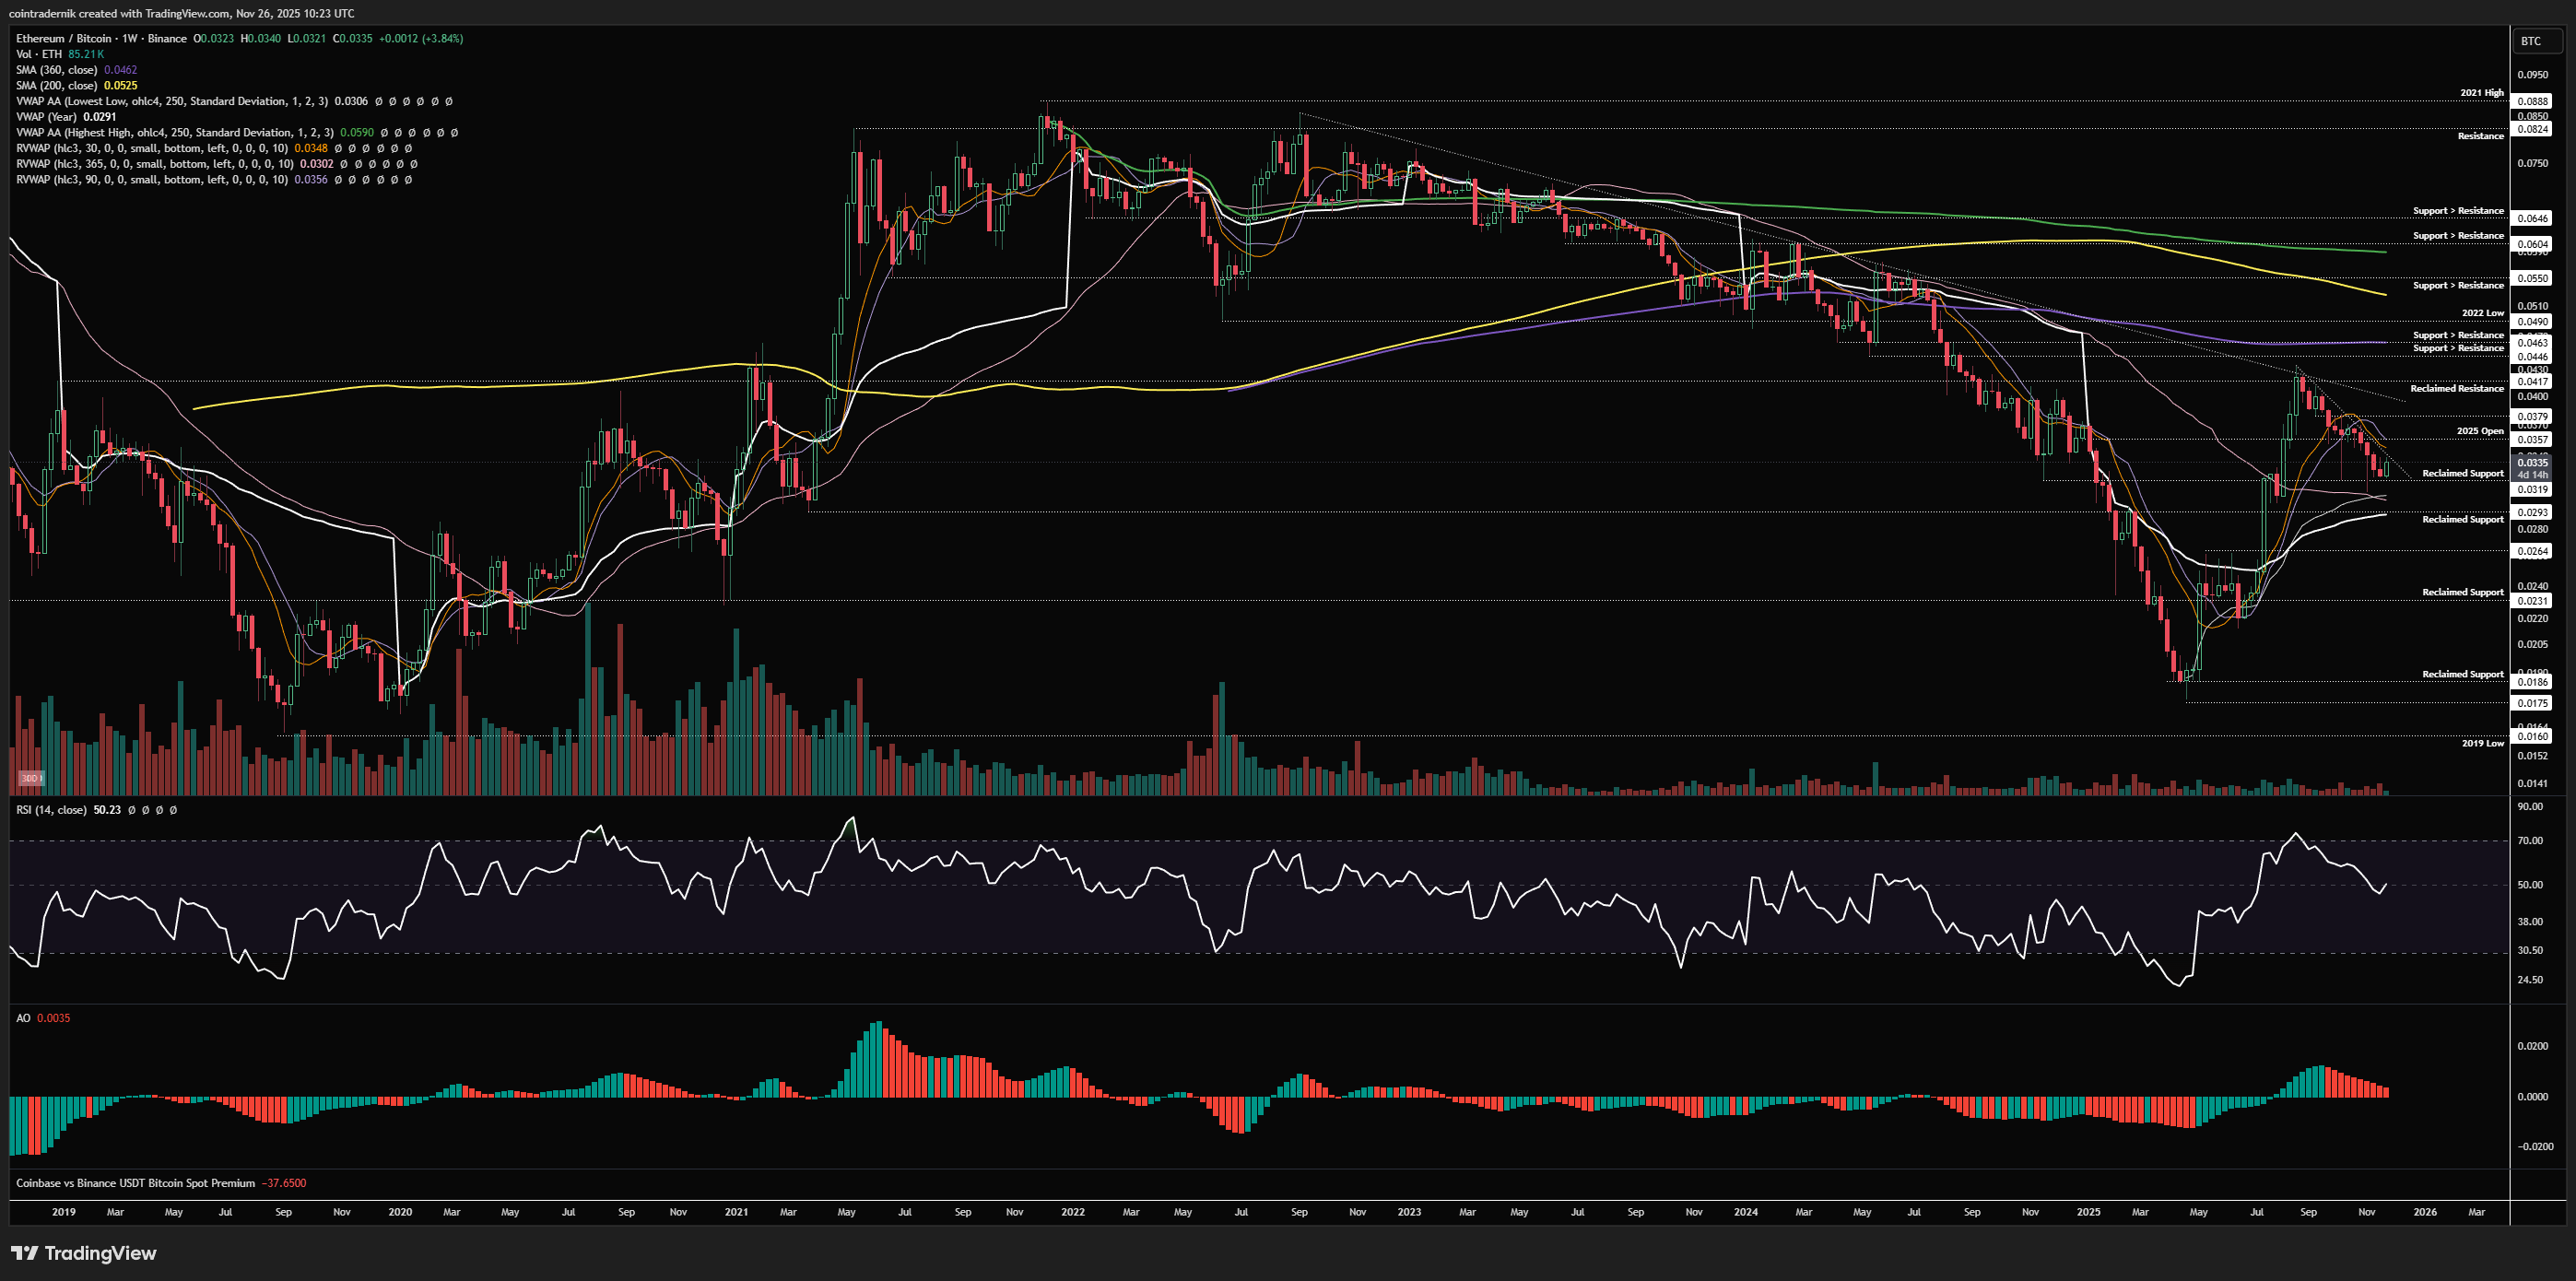
Turning to ETH/BTC, we can see that things look much better here, with price holding firm above all the key support levels, with momentum reset and supportive of continuation higher and with weekly structure still bullish. What we're looking for here is a breakout and close above trendline resistance from the 0.043 high, followed by the yearly open at 0.0357 acting as support, which would lead to another attempt at a breakout beyond 0.0417. This is bullish until proven otherwise, which in this case would be a loss of 0.0293, where all of this structure looks broken and a near-full retrace looks more probable. Acceptance back above 0.0357, in my opinion, leads to 0.055 in Q1 2026.
Daily:
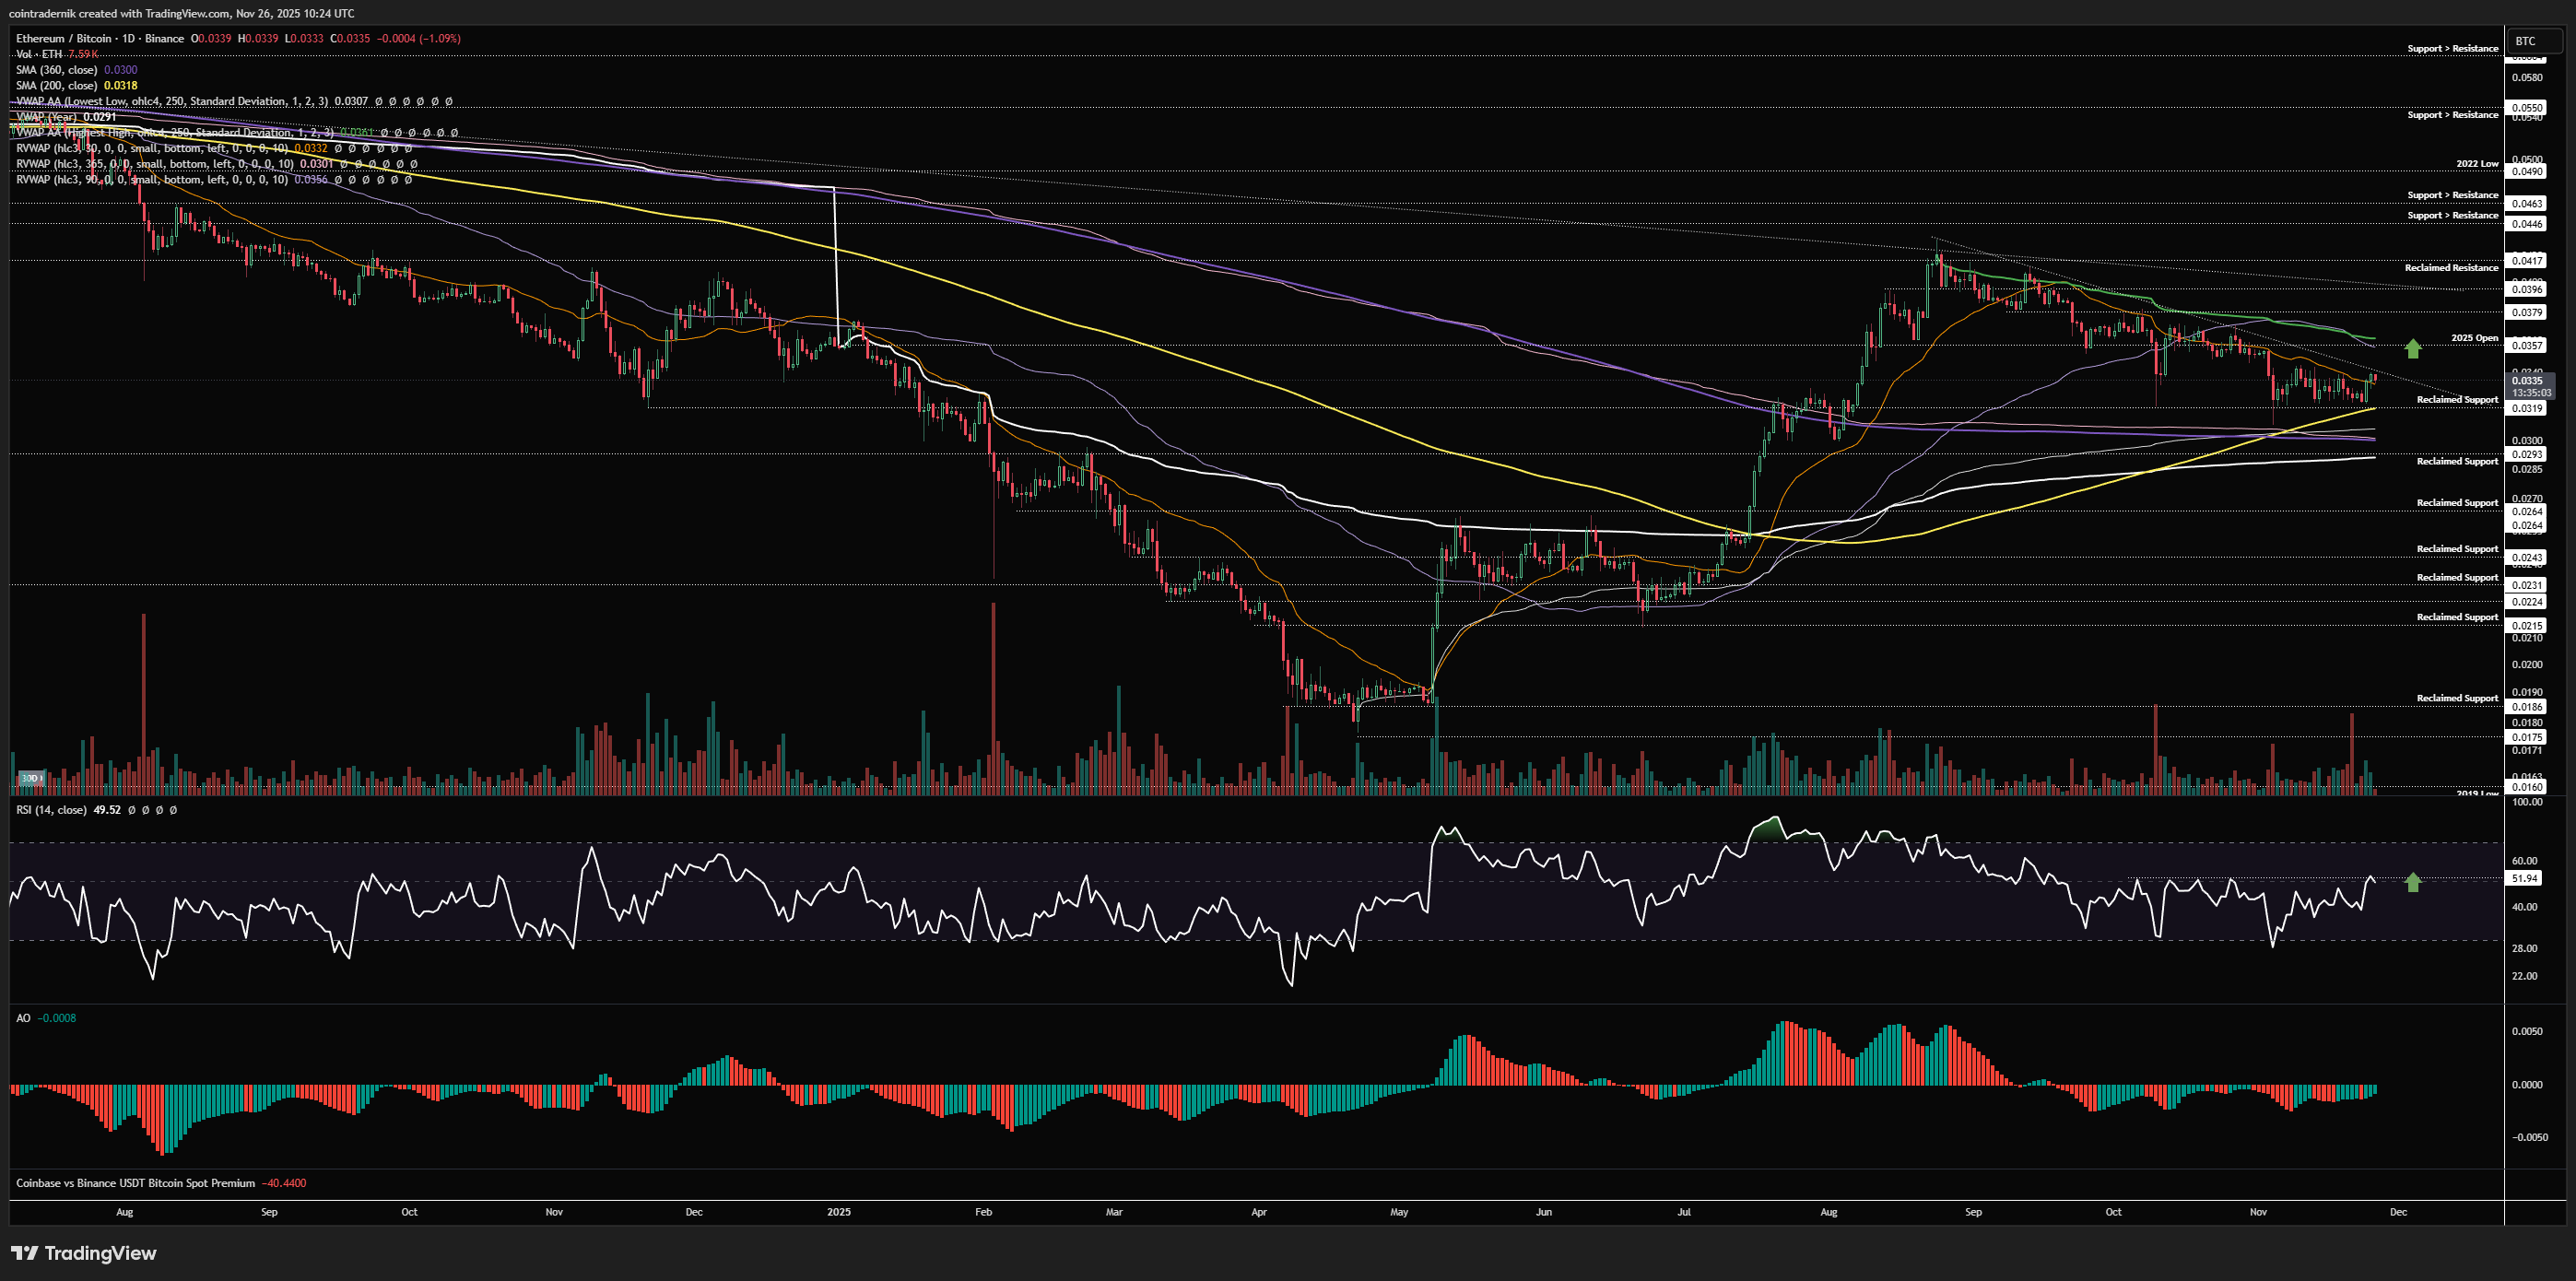
Dropping into the daily, we can see how the yearly open at 0.0357 is confluent with the anchored VWAP from the yearly high and the 90d rolling VWAP, hence a reclaim of this level as support is a big deal for ETH/BTC. Right now, we're consolidating above reclaimed support at 0.0319 and the 200dMA, but price keeps getting slapped down by trendline resistance and the 30d rolling VWAP. We do have momentum exhaustion to the downside here and RSI looks ready for a pop back above 50. A trendline breakout with daily RSI above 50, followed by a yearly open reclaim with RSI holding above 50 and AO flipping green would be a great sign for the next leg higher beginning for ETH/BTC. 0.0293 is the line in the sand here, below which it all looks atrocious.
Receive the latest updates directly to your inbox

Price: $99.45
Weekly:
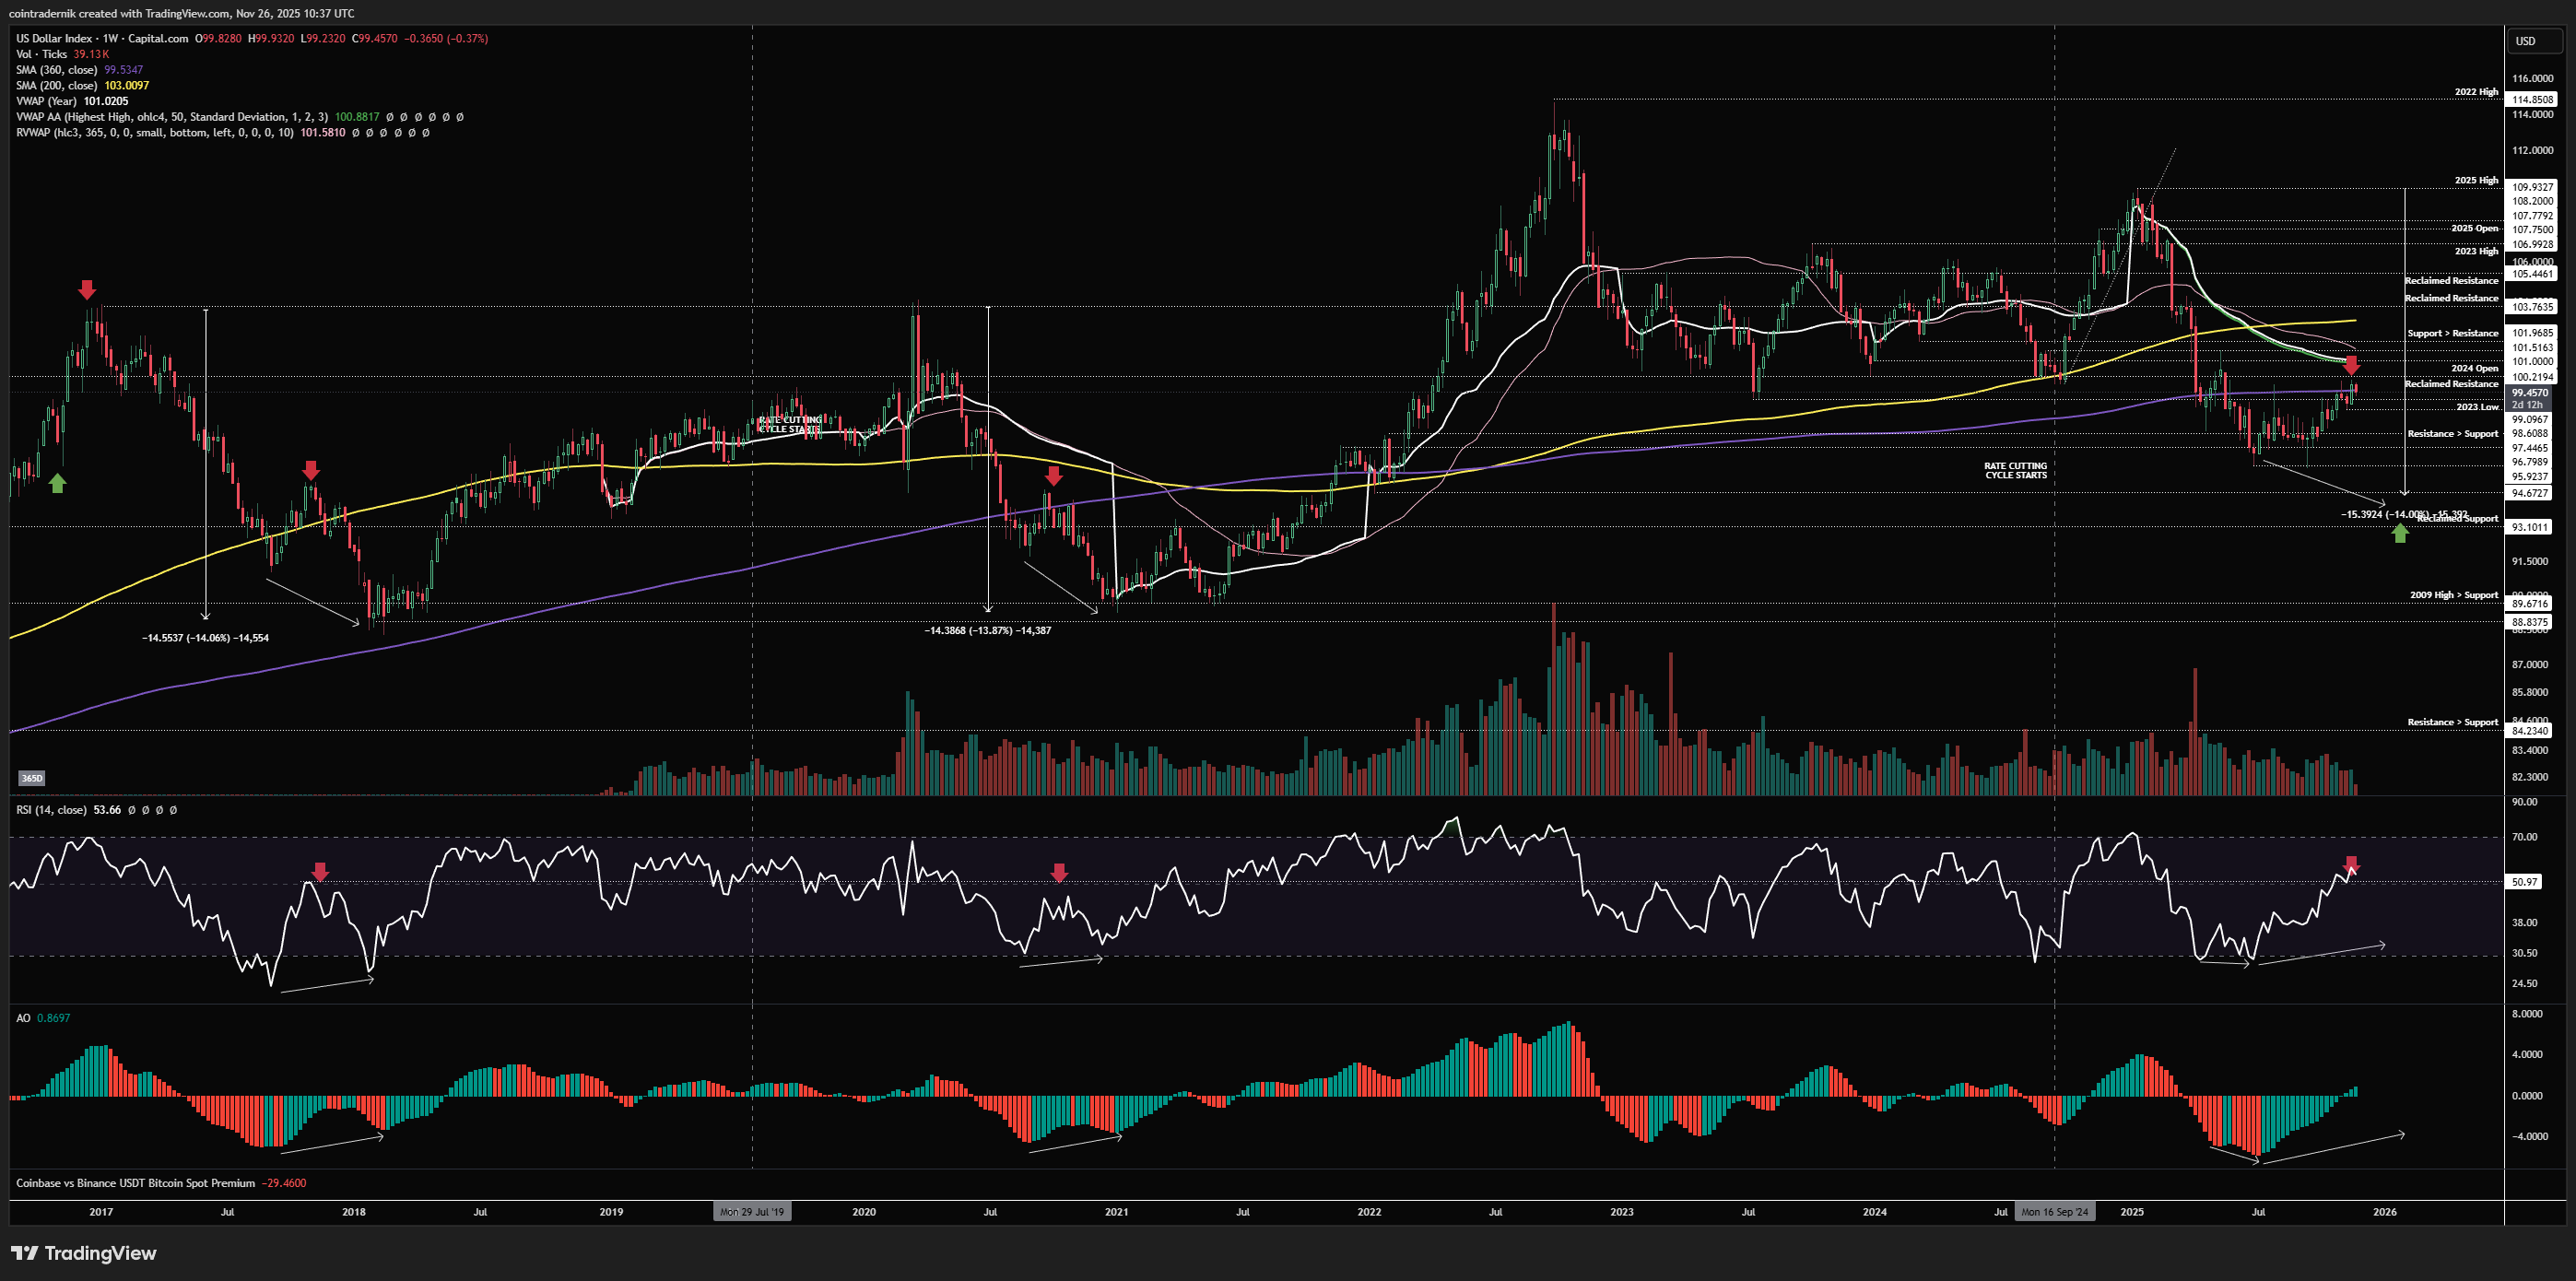
Beginning with the weekly for the Dollar Index, we can see that last week saw price close strong into the highs, but DXY remained capped below 100. Early price-action this week has seen it reject below that key resistance and trade lower though remaining above local support at 99 and within the prior weekly range. My view on the Dollar remains unchanged, where I continue to expect the formation of a swing-high below the 101 level and below key VWAPs that leads to a return to the bottom of the range at 96 at the least, though likely one leg lower into the zone between 93-94.7. And the invalidation of this view remains acceptance above 101. What we are now looking for as price rejects here below 100 is a weekly close below last week's low, confirming the move higher as a bull trap and opening up a momentum shift as weekly RSI breaks back below 50. If we see this, I think we trade into 96 by year-end and then mark out a major low in Q1.
Daily:

Looking at the daily, we can see some momentum exhaustion into the highs here across RSI and AO, which is exactly what we expected as price swept the 99.87 swing-high into resistance below 100.2. We have since turned lower but daily structure remains bullish and price is supported by the 30d rolling VWAP and trendline support, above which we have formed higher-lows since October. We want to see this support fail as price moves below the Nov open and a daily close below 99.1, which should lead to a retest of the prior swing-low at 98.6. A break and close below this key swing-low turns daily structure bearish, which if accompanied by a momentum breakdown below 50 on daily RSI should confirm a trend shift with a bearish bias back towards range lows at 96. If we mark out a higher-low here and push back above last week's high, the major retest is in sight at 101, where I do expect DXY to be capped.
Price: $4160
Weekly:

Beginning with the weekly view for Gold, we can see that price is finding support above $3925 and despite the rejection at $4245 a couple of weeks ago has now reclaimed the monthly VWAP and $4059 and is pushing for the retest of that level this week. Weekly momentum and structure remain bullish, with no signs of higher timeframe trend exhaustion. As mentioned a couple of weeks ago, I expect that the bulk of the downside was over but that we would now chop sideways for a while with $4245 holding as a lower-high. As we now approach that level, with momentum looking the way it does, I think there's a chance we can close above that $4245 high (not necessarily this week) and that would invalidate the neutral view on Gold and flip back towards a bullish bias, as we would have the all-time high weekly close with momentum supportive of price discovery. If we reject at $4245, the neutral view remains and I would expect continuation sideways with the potential for a run of the lows before the next leg higher begins.
Daily:

Looking at the daily, we can see the lower-high I had marked out and now I have seen this triangle-esque pattern all over my feed, with everyone in eager anticipation of the breakout to new highs. Generally, I would expect to see a false breakout before the real move, so one way to look at this would be a rejection around trendline resistance that leads to a false breakdown below trendline support, followed by continuation higher. We kind of had a similar pattern in April that ultimately still just led to further consolidation before the breakout in August. Nonetheless, if we can flip $4245 into support on the daily, that would be a promising sign for early resolution of this range to the upside, where we should expect price discovery beyond $4384 to follow. We are currently above the anchored VWAP from all-time highs and the monthly VWAP, so I don't really like shorts here. If we wicked above $4245 and rejected, I might look for intraweek shorts on Gold miners.
Price: $6789
Weekly:
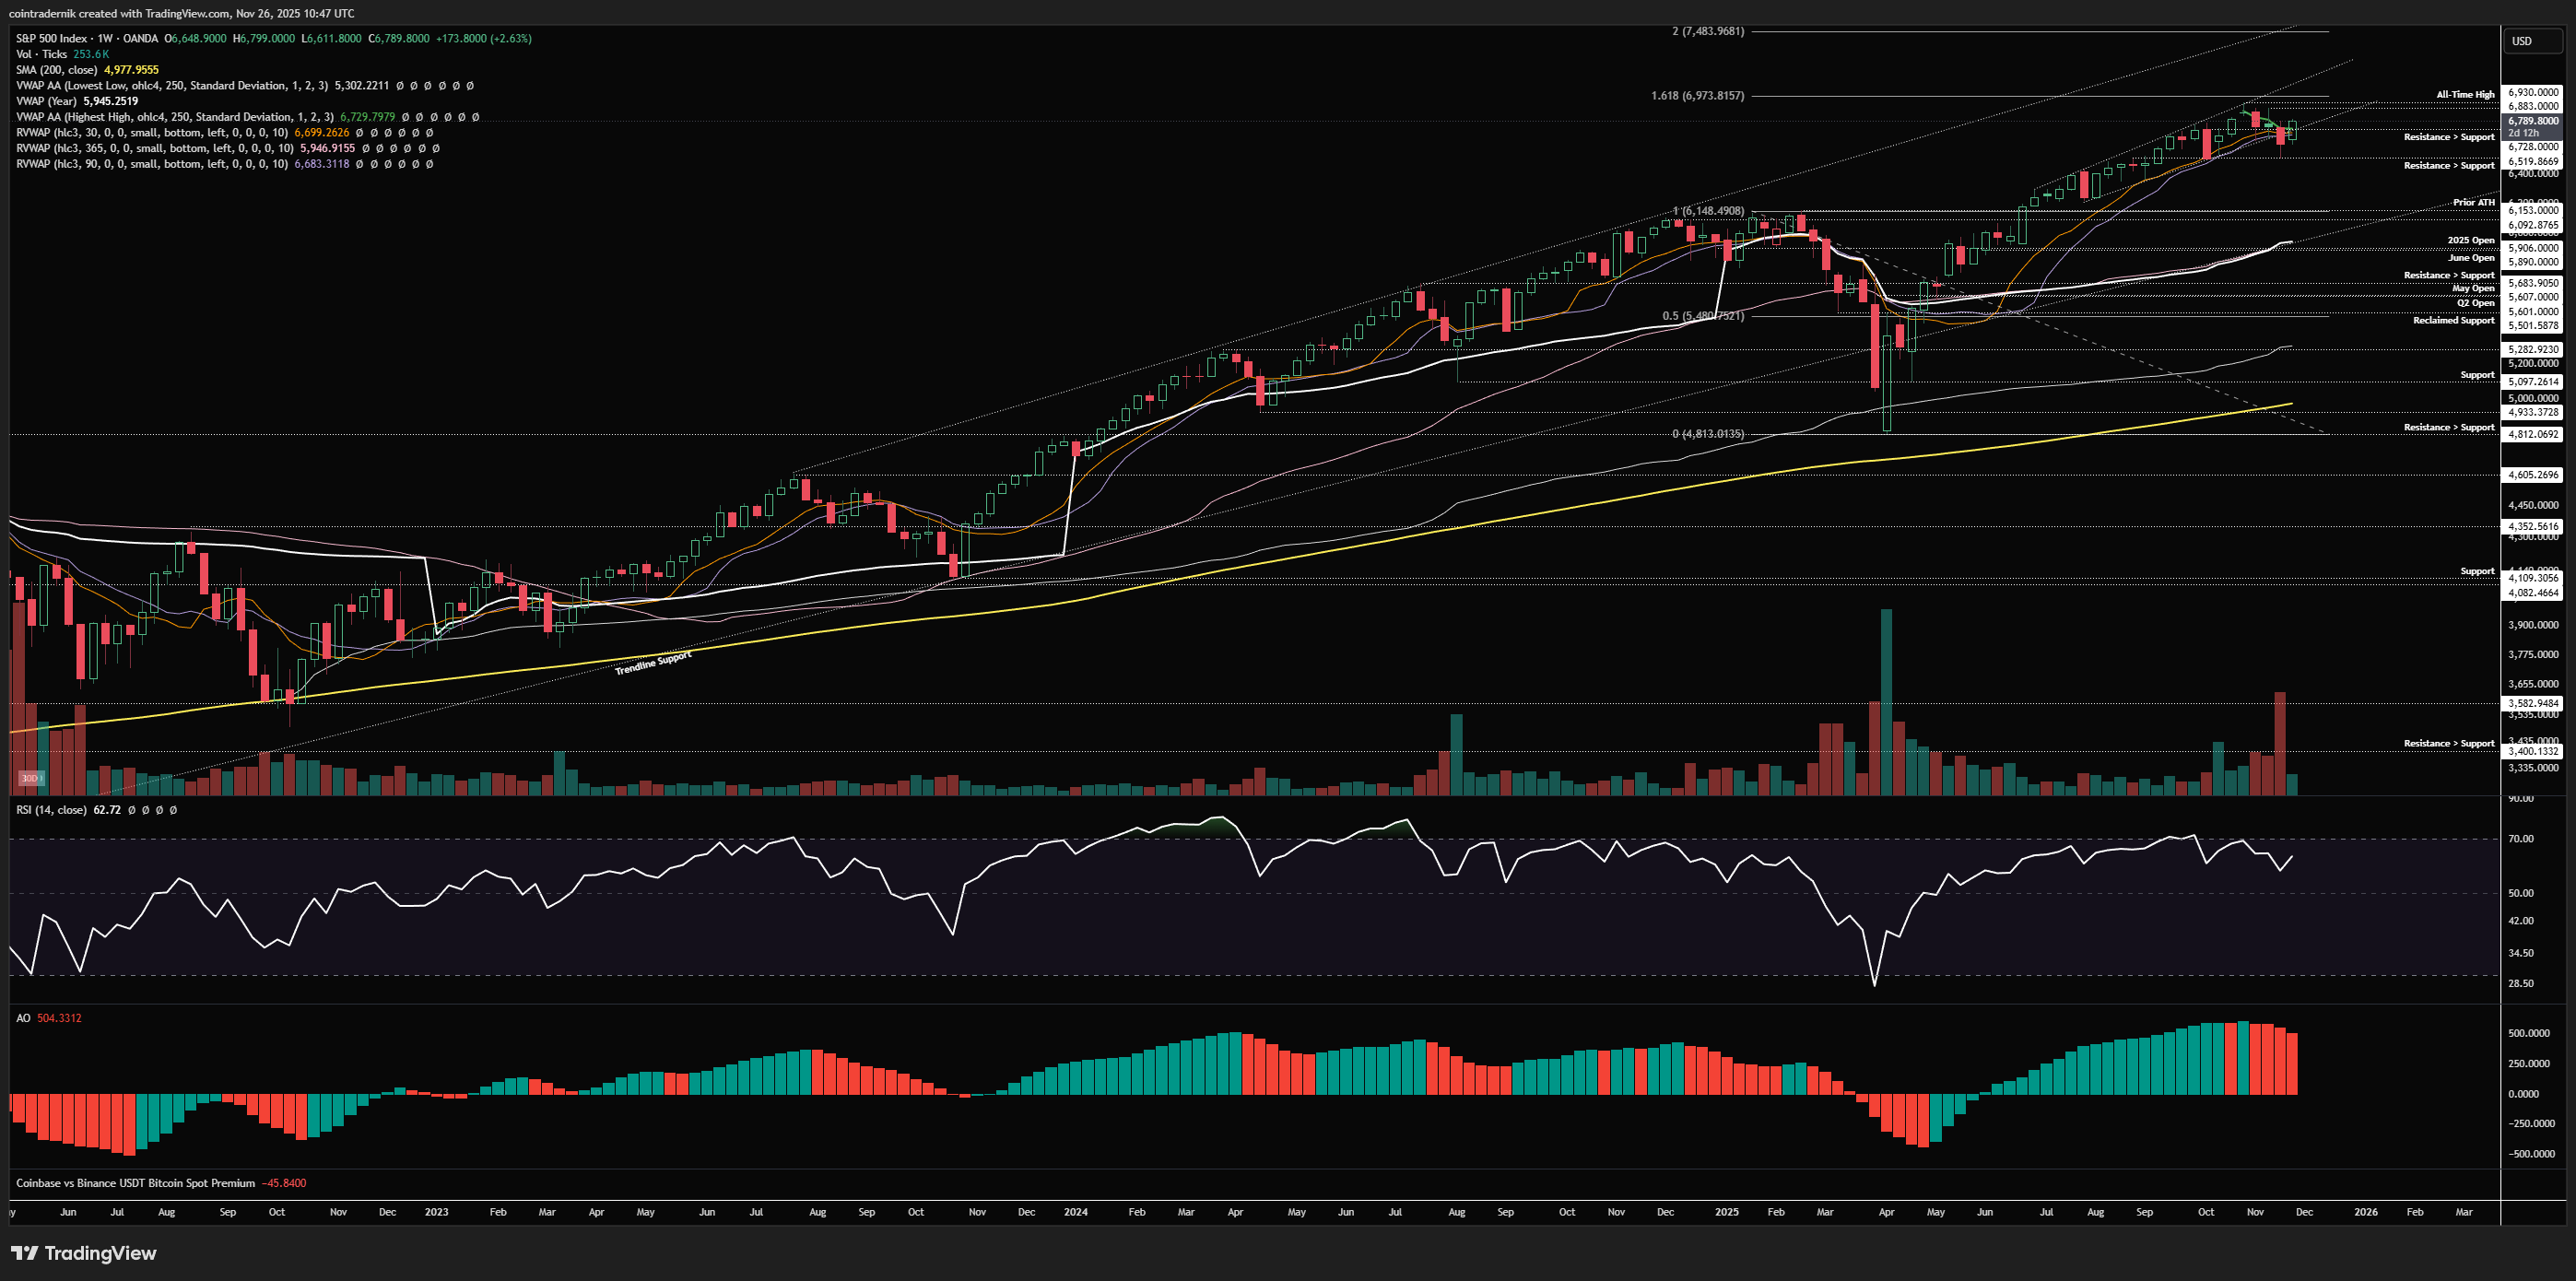
Looking at SPX on the weekly, I mentioned last week that I did not want to see a weekly close below 6520, and price wicked below that level and bounced to close firmly above it. We then gapped up marginally on Sunday night and the bid since then has been relentless, retracing the entire dump from the open at $6728 last week, back above that prior resistance level, as well as back above the anchored VWAP from all-time highs, with price-action mid-week seeing SPX at $6789. We have a shorter week into the monthly close because of Thanksgiving and I think there is a non-zero chance we close November green, despite all of the chaos. Either way, if we can close this week and this month above that anchored VWAP from the highs at $6730, reclaiming key support above last week's high, it is really hard to see the move into $6520 last week as anything but a massive bear trap. Now, rejection today and a couple of red days can change this view, as we would then have taken out last week' high into the anchored VWAP from all-time highs, deviated above it and then rejected to close back below it. That would look much more bearish, and I would very likely cut levered equity exposure at that point as it would be hard to spin that as a second bear trap. Weekly / monthly close above $6730 is very bullish and people will fade this all the way back to new highs in that case.
Daily:
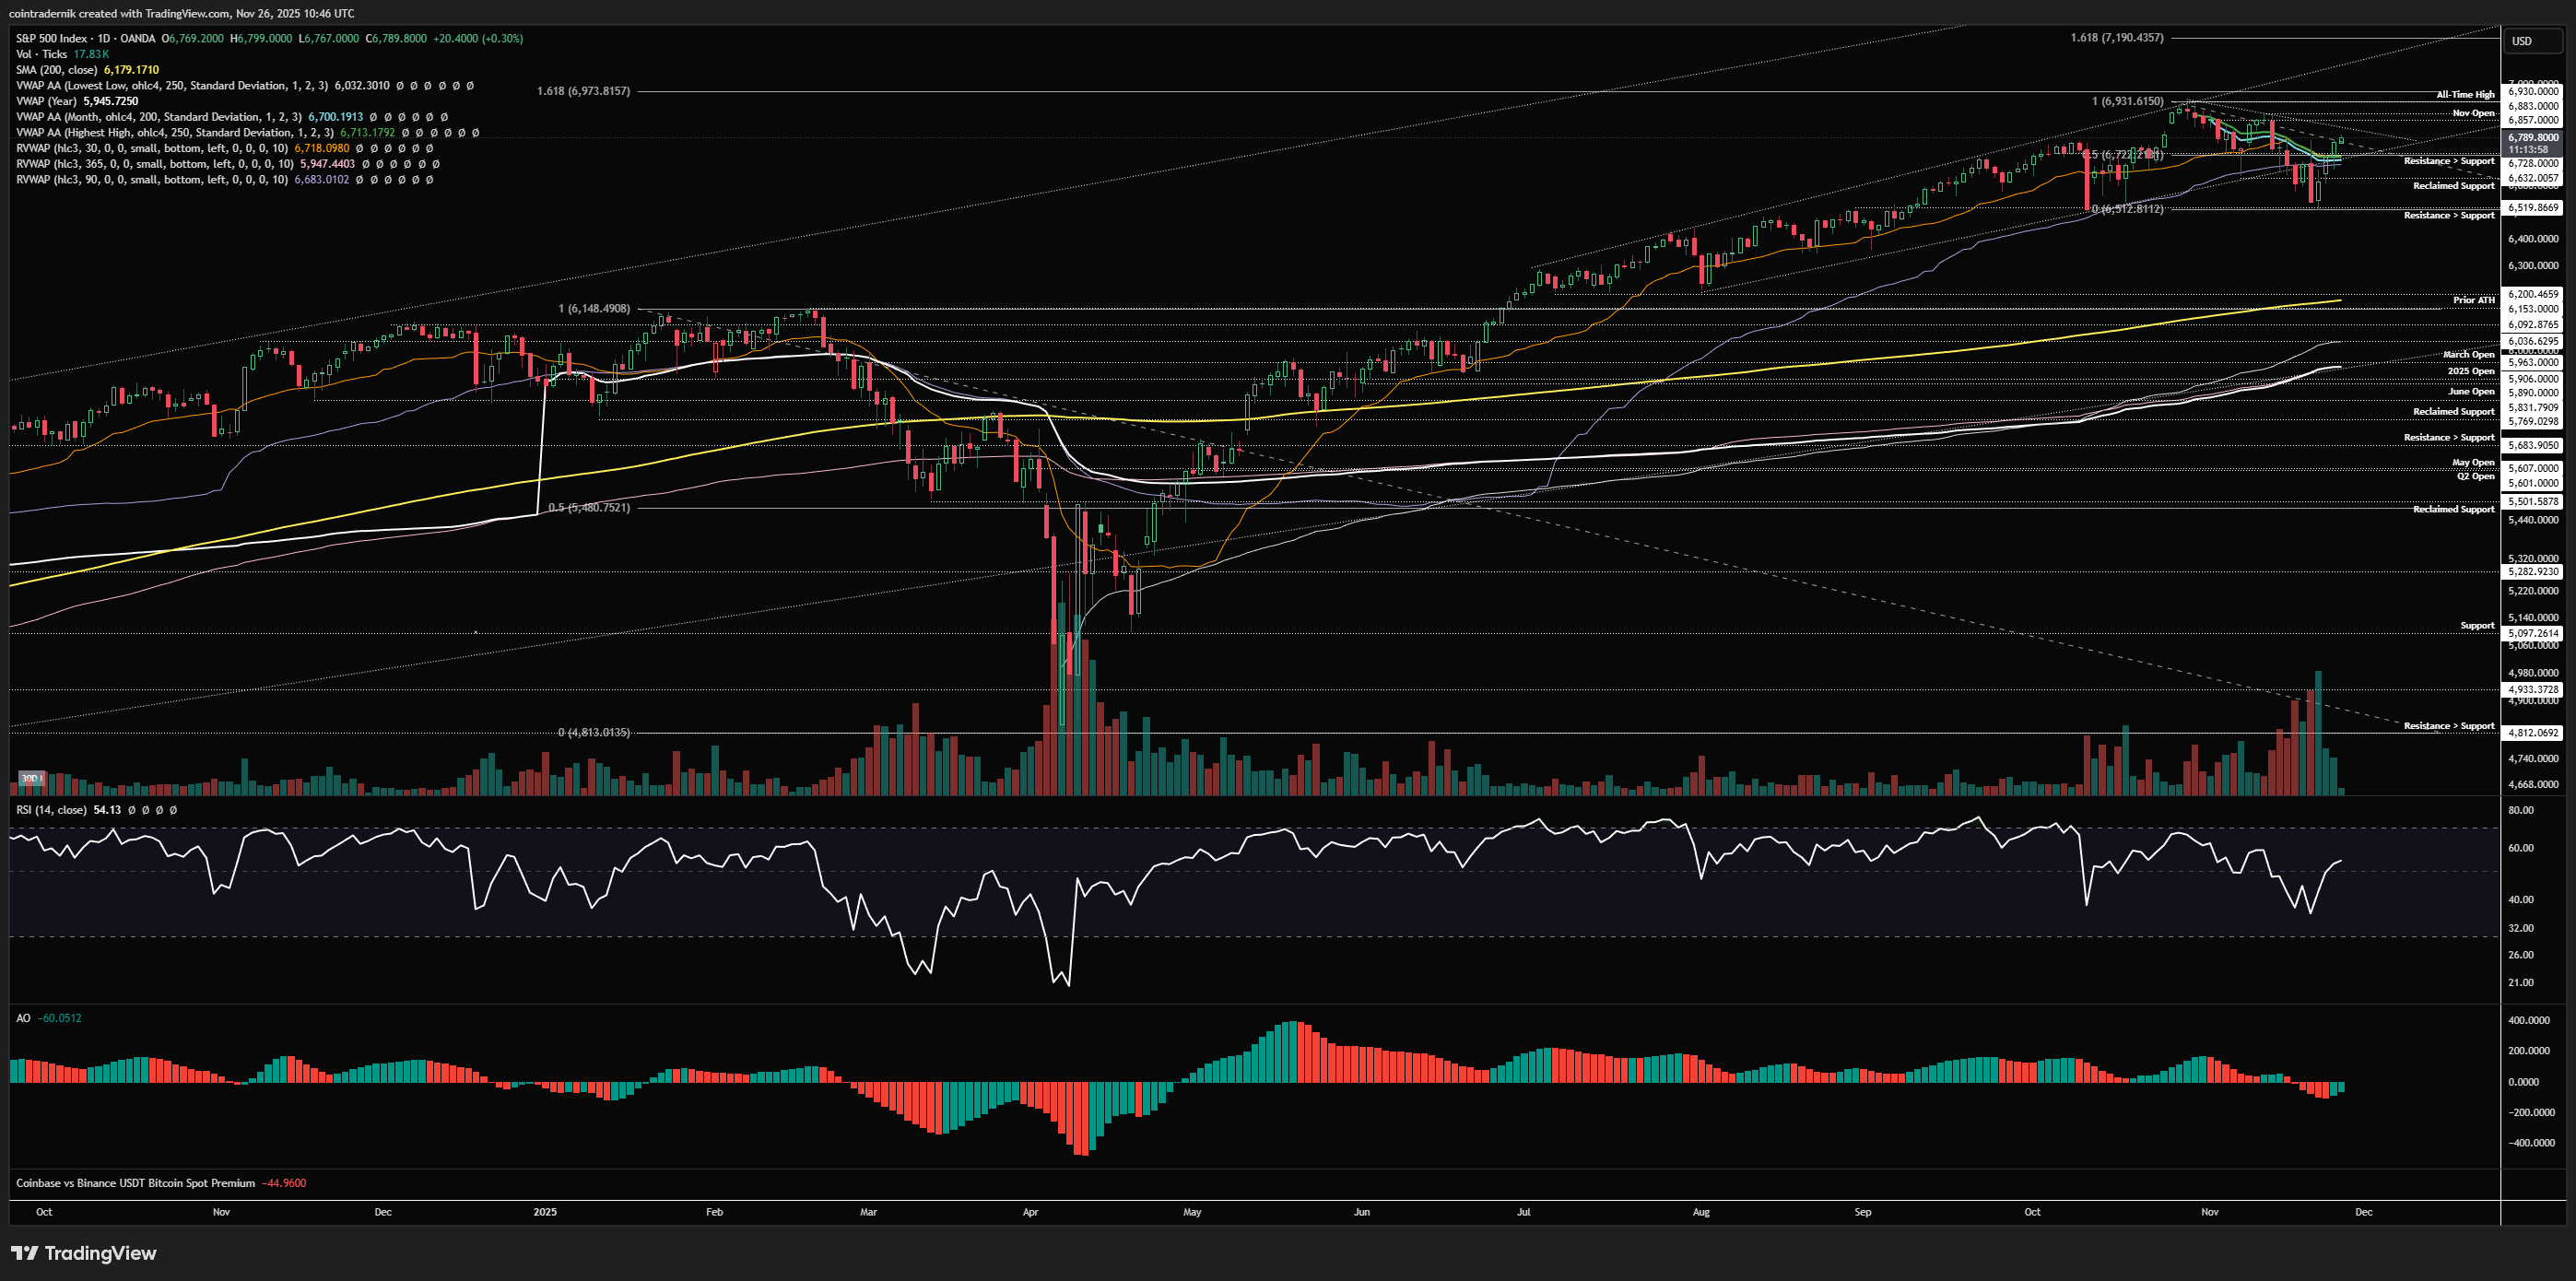
Finally, looking at the daily, we can see how much volume was traded into that low last week, as price rejected the breakdown below the October 10th low and instead v-reversed off it, with price closing back above the 90d rolling VWAP, monthly VWAP and anchored VWAP from all-time highs within three sessions. We remain below trendline resistance from the all-time high, but that is literally the only resistance left on the chart, with the Nov open above that at $6857. As mentioned above, if we continue to hold above this cluster of reclaimed support at $6730, it is very hard to make a bearish case. In fact, if we close up near that Nov open I would look at a dip into $6730 as an opportunity to add in early Dec. This only looks bearish again if we re-flip $6730 into resistance, at which point I would cut exposure and it would also more broadly look terrible for risk over the subsequent weeks, as back below $6520 we would then expect a much deeper correction to ensure, potentially back towards $6200. Right now though, this very much looks like a massive bear trap below key supports and trendlines followed by an instant v-reversal, trapping shorts below support and forcing those that sold the lows to chase into year-end.
I hope you've found some value in the read this week!
And if you've not already signed up for Ostium, please do so and test out some of the recent updates, including:
Sign up here (you don't have to use my ref link, of course): https://ostium.app/trade?from=CL&to=USD&ref=CTNIK

.avif)