

Market Outlook #53
September 29, 2025
-
12
min read


This blog references an opinion and is for entertainment and informational purposes only. It is not intended to be investment advice. Seek a duly licensed professional for investment advice.
In this 53rd Market Outlook here at Ostium Research, we'll be taking a look at the week ahead in markets, focusing specifically on price-action, positioning and event risk for Bitcoin, Ethereum, DXY and SPX. I will also have a longer, top-down Q4 Outlook available next Monday.
Firstly, let's take a look at the calendar for the very busy week ahead, although it is important to note that there is a high probability the US data from Thursday onwards is delayed due to government shutdown:
MONDAY: VARIOUS FED SPEECHES
TUESDAY: RBA INTEREST RATE DECISION: (CONSENSUS 3.6% VS PREVIOUS 3.6%)
TUESDAY: ECB PRESIDENT LAGARDE SPEECH
TUESDAY: US CHICAGO PMI (SEP): (CONSENSUS 40 VS PREVIOUS 41.5)
TUESDAY: US JOLTS JOB OPENINGS (AUG): (CONSENSUS 7.1M VS PREVIOUS 7.181M)
WEDNESDAY: US ADP EMPLOYMENT CHANGE (SEP): (CONSENSUS 30K VS PREVIOUS 54K)
WEDNESDAY: US ISM MANUFACTURING PMI (SEP): (CONSENSUS 49.2 VS PREVIOUS 48.7)
THURSDAY: US FACTORY ORDERS (MOM) (AUG): (CONSENSUS 0.1% VS PREVIOUS -1.3%)
THURSDAY: US INITIAL JOBLESS CLAIMS: (CONSENSUS 220K VS PREVIOUS 218K)
FRIDAY: BOJ GOVERNOR UEDA SPEECH
FRIDAY: US NONFARM PAYROLLS (SEP): (CONSENSUS 39K VS PREVIOUS 22K)
FRIDAY: US ISM SERVICES PMI (SEP): (CONSENSUS 52 VS PREVIOUS 52)
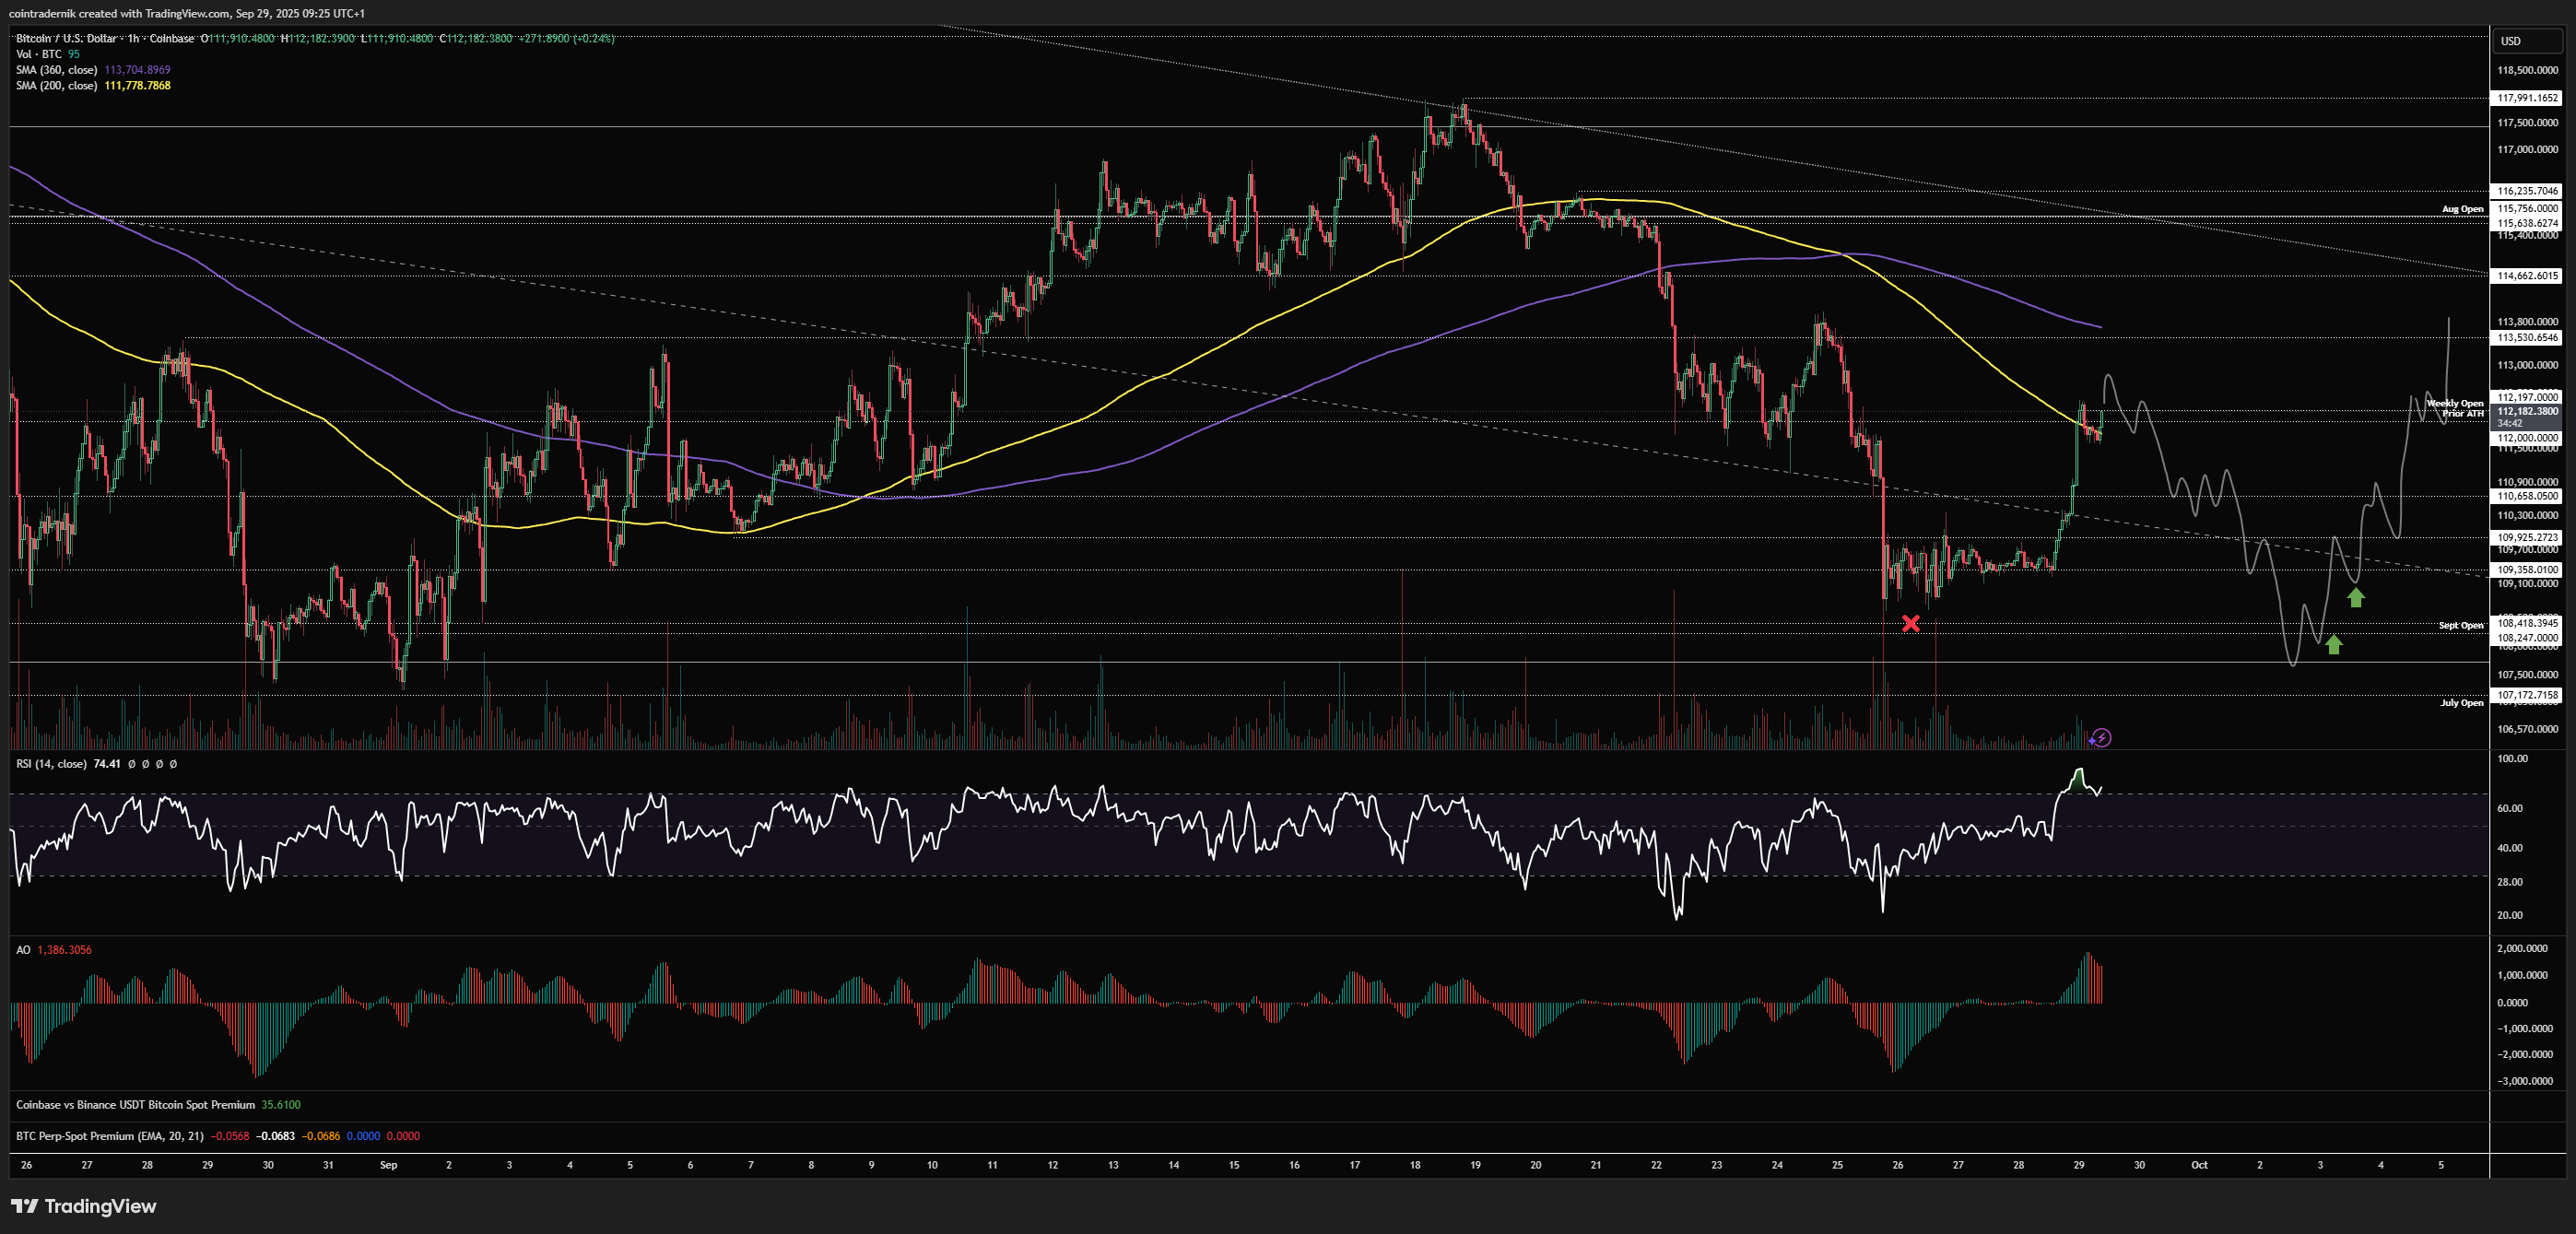
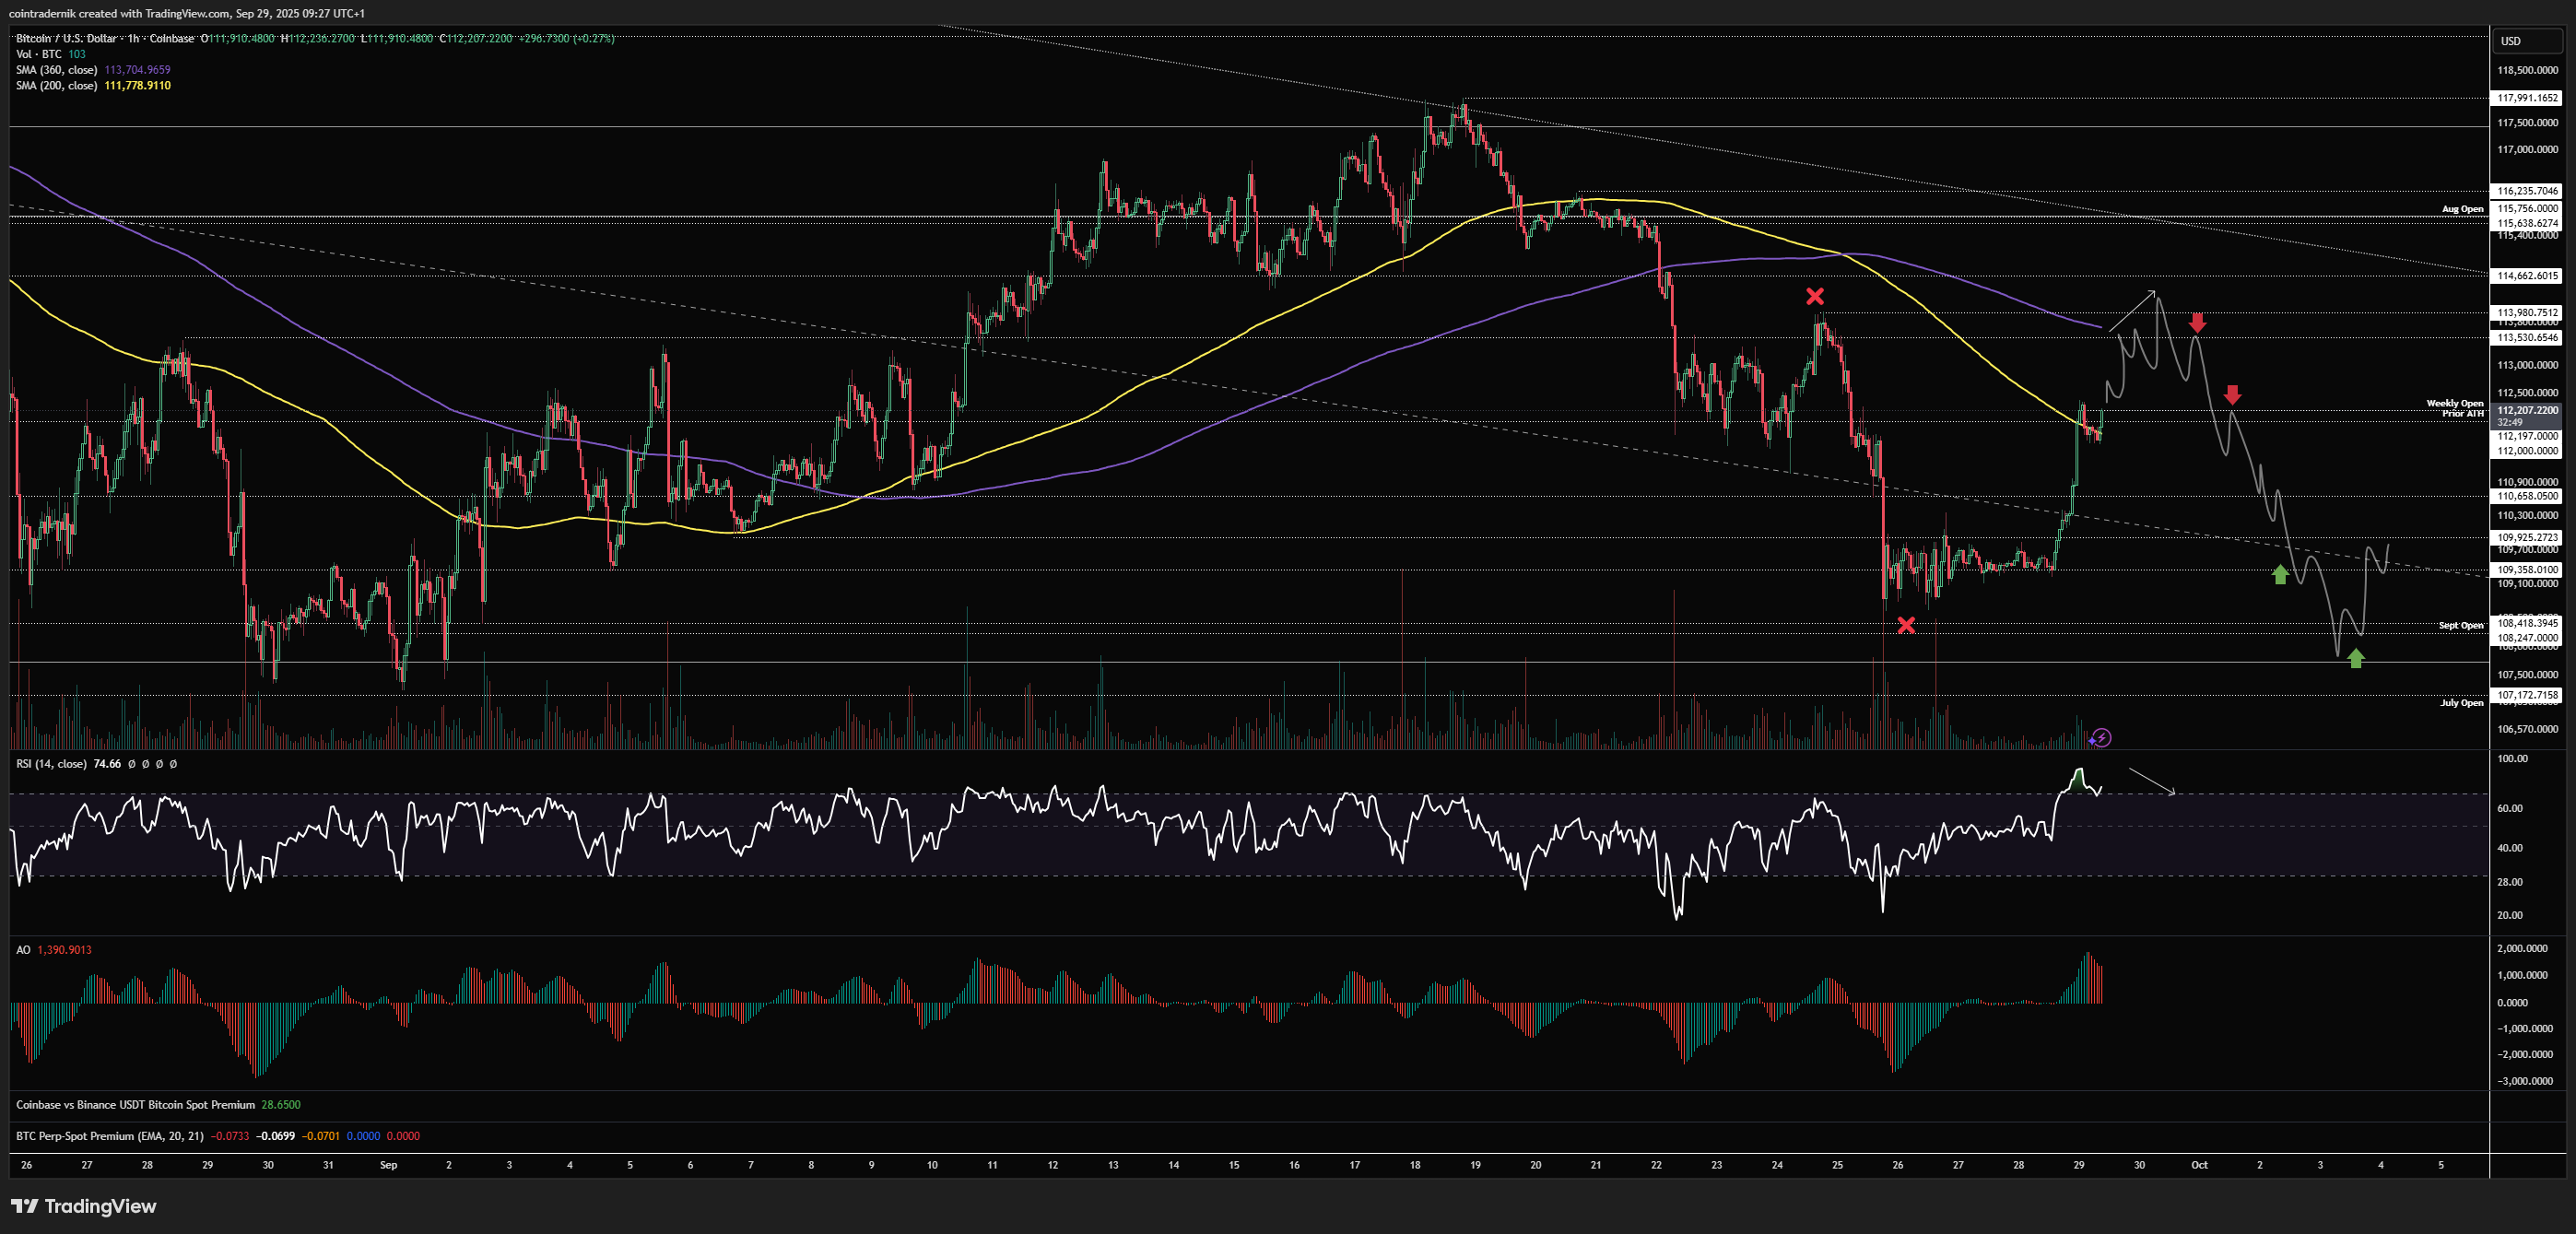
Now, let's dig into asset-specific price-action for the week ahead, looking firstly at Bitcoin:
Price: $112,124
Weekly:
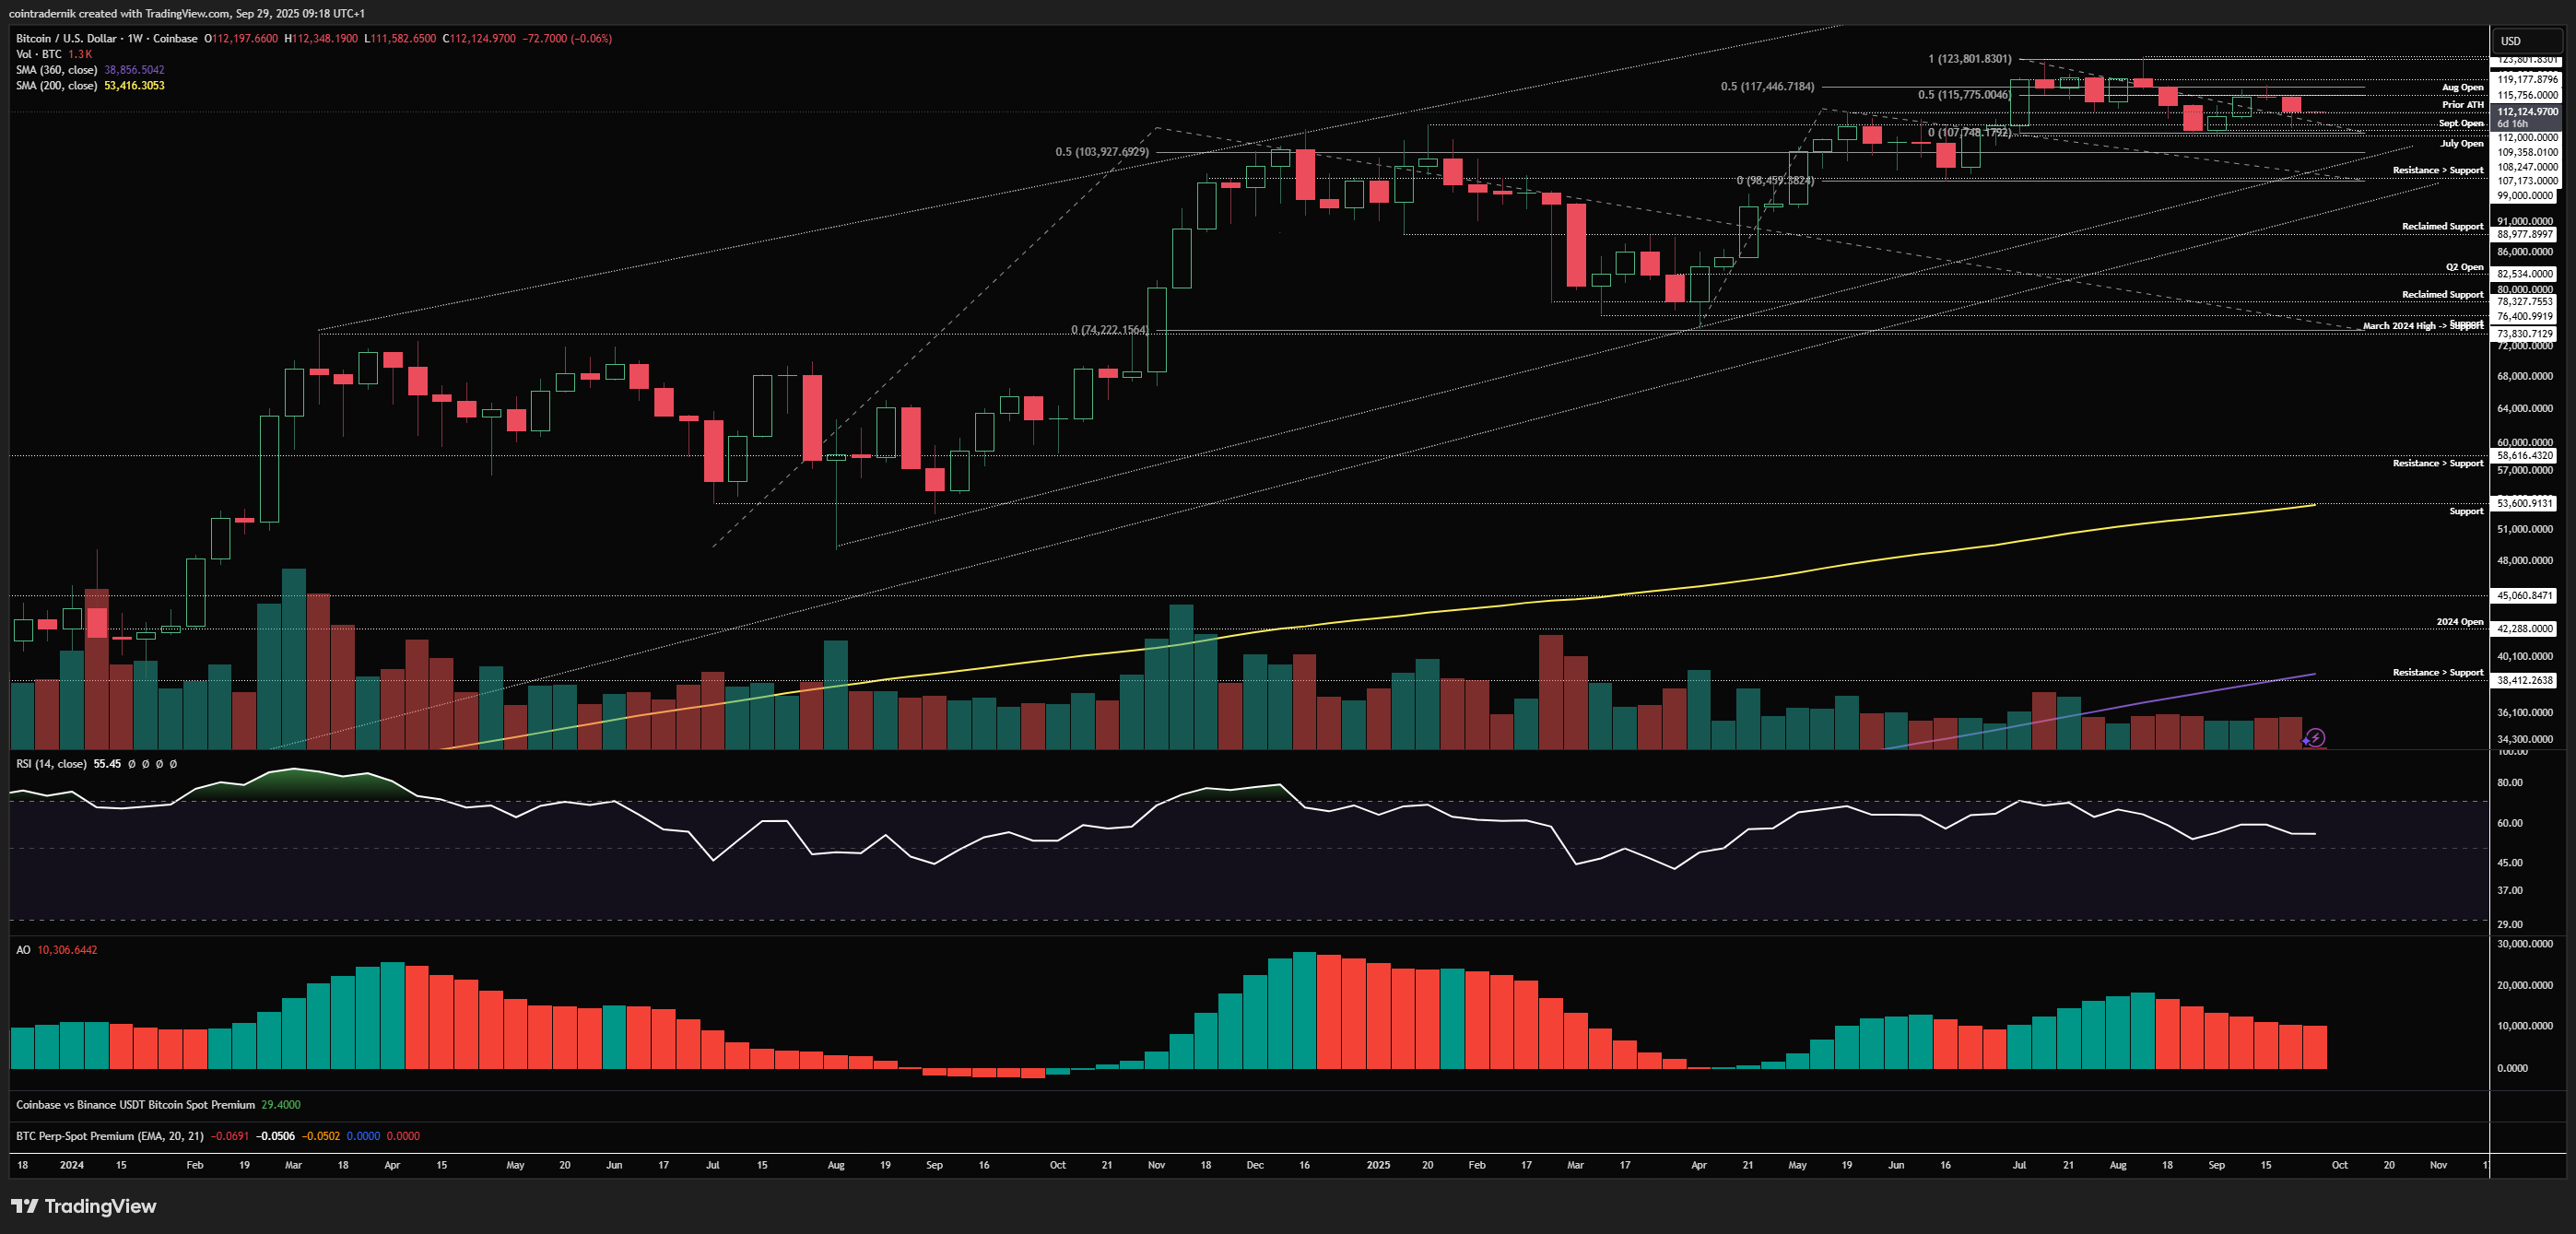
Beginning with the weekly, we can see that price rejected off the August open last week right at the weekly open and sold off towards the September open, above which it marked a low and bounced to close back at $112.2k. Weekly momentum is still supportive of higher prices and I believe we are now emerging from the window of weakness I had marked out from Friday 20th Sept. I do still believe there could be volatility this week, given we have the quarterly close and October open, a mass of macro data, a potential government shutdown and general weakness that has been common in the first week of each month of late. As such, I think any dip you get this week is one you want to look at as an opportunity for longs for the remainder of Q4, as despite the concerns about either the 'cycle top' already being in or forming in October, I explicitly do not believe this to be the case and think there are tailwinds into mid-Dec. If we run last week's low and then reclaim on the lower timeframes, that could be the October low forming early; and even a dump below $107k to clear out that low this week would not surprise me, but I would reiterate you should not get bear-holed. Unless we lose $99k on a weekly close, nothing here looks mid-term bearish to me.
Daily:
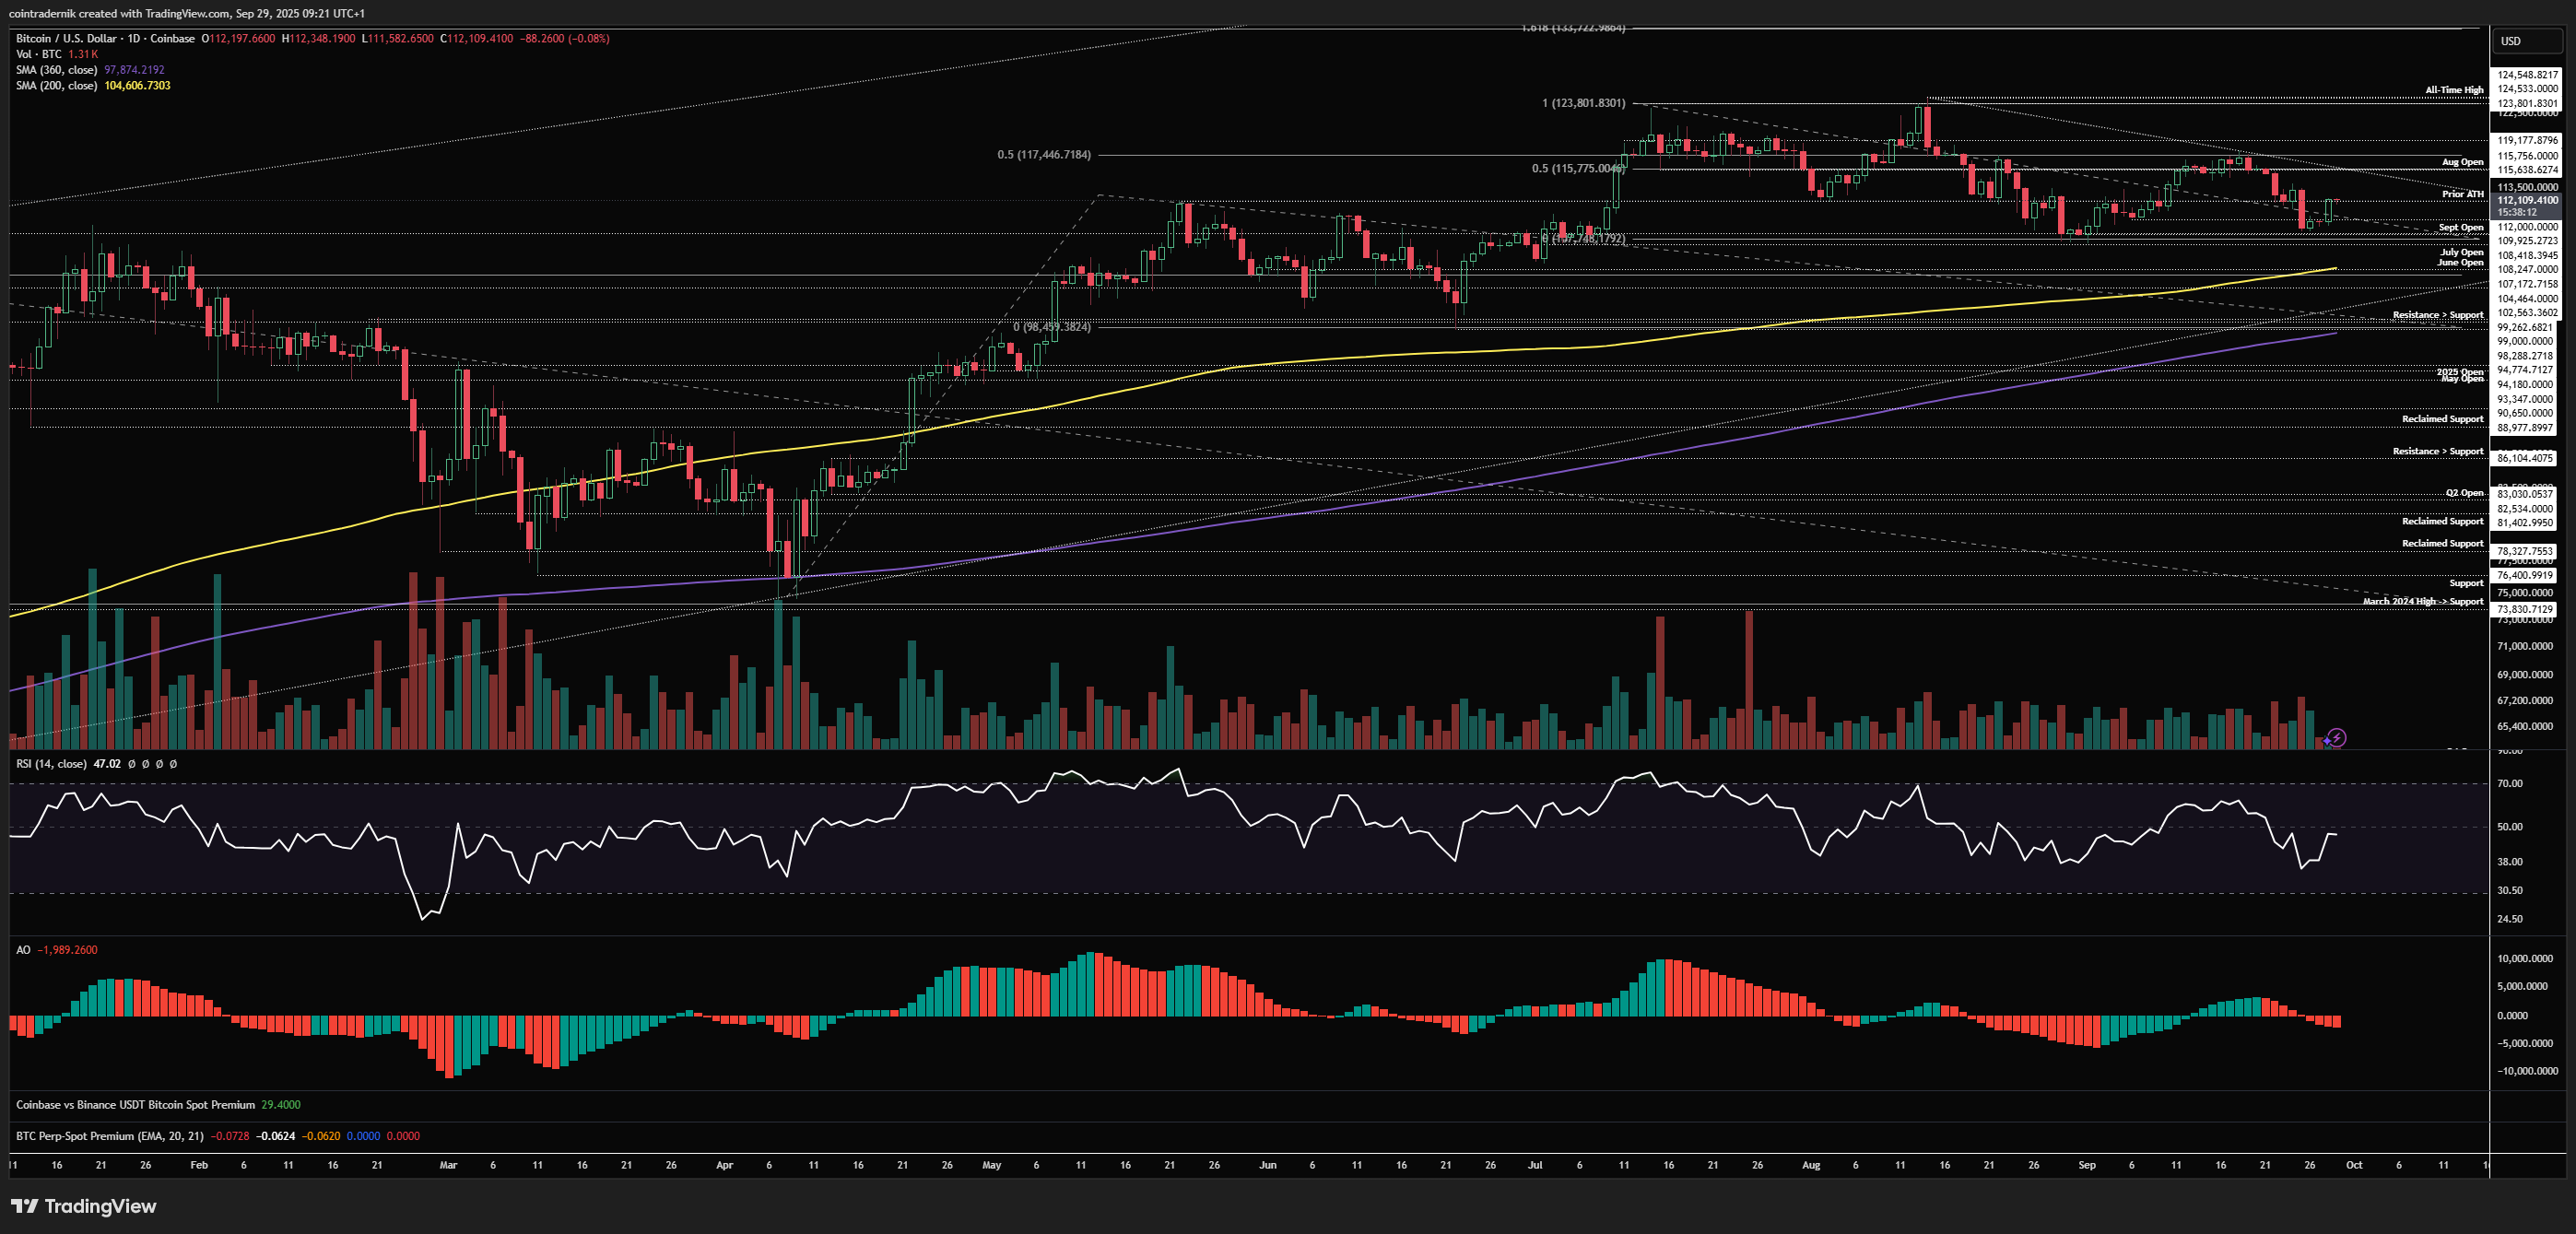
Turning to the daily, we can see that price dumped hard off that August open through $112k prior highs into $108.5k, flattening out above the September open and holding above the prior swing low at $107k. Whilst this formation of a higher-low is nice, I'm not particularly keen on how last week's low formed to be confident in it being the bottom; nonetheless, if we do now push higher off this low through the rest of this week to close back above the August open and trendline resistance up near $115.7k, I think it is very unlikely you see $107k-$108k retested in October to be honest. The opportunity for those lows to be cleaned up should be over the next 5-7 days, in my view, where a push below the September open should be viewed as an opportunity to long for new all-time highs, with invalidation on a close below the 360-day moving average, currently at $97.9k, below which we have not closed since March 2023, for reference. I think the lowest we see this week is the 200dMA at $104.6k on a major flush of the lows, but I am leaning more towards a shallow run of last week's low before higher prices, to be honest.
As such, looking at setups for the week, the long setup is basically as outlined above, where any dip between now and the weekend is where I am expecting the formation of an October low, with a run of last week's low being a nice spot for an entry, though I would add below the July open and ladder into the 200dMA, with the invalidation as stated above. If we do not get this deep a pullback and instead form a higher-low above last week's low post-Oct 1st, then you could jump in back above the weekly open at $112.2k with that low as your invalidation:
The short side for me here evolves into the long side (so you could take both sides of this trade if it plays out), but would require a sharper rally into the quarterly close tomorrow, taking out the $114k high into Oct 1st, then looking to fade any bearish divergence and subsequent breakdown, adding below the weekly open and looking for at least $110k, if not $108.5k into the weekend, where again you could look to cover and play the long side as outlined above:
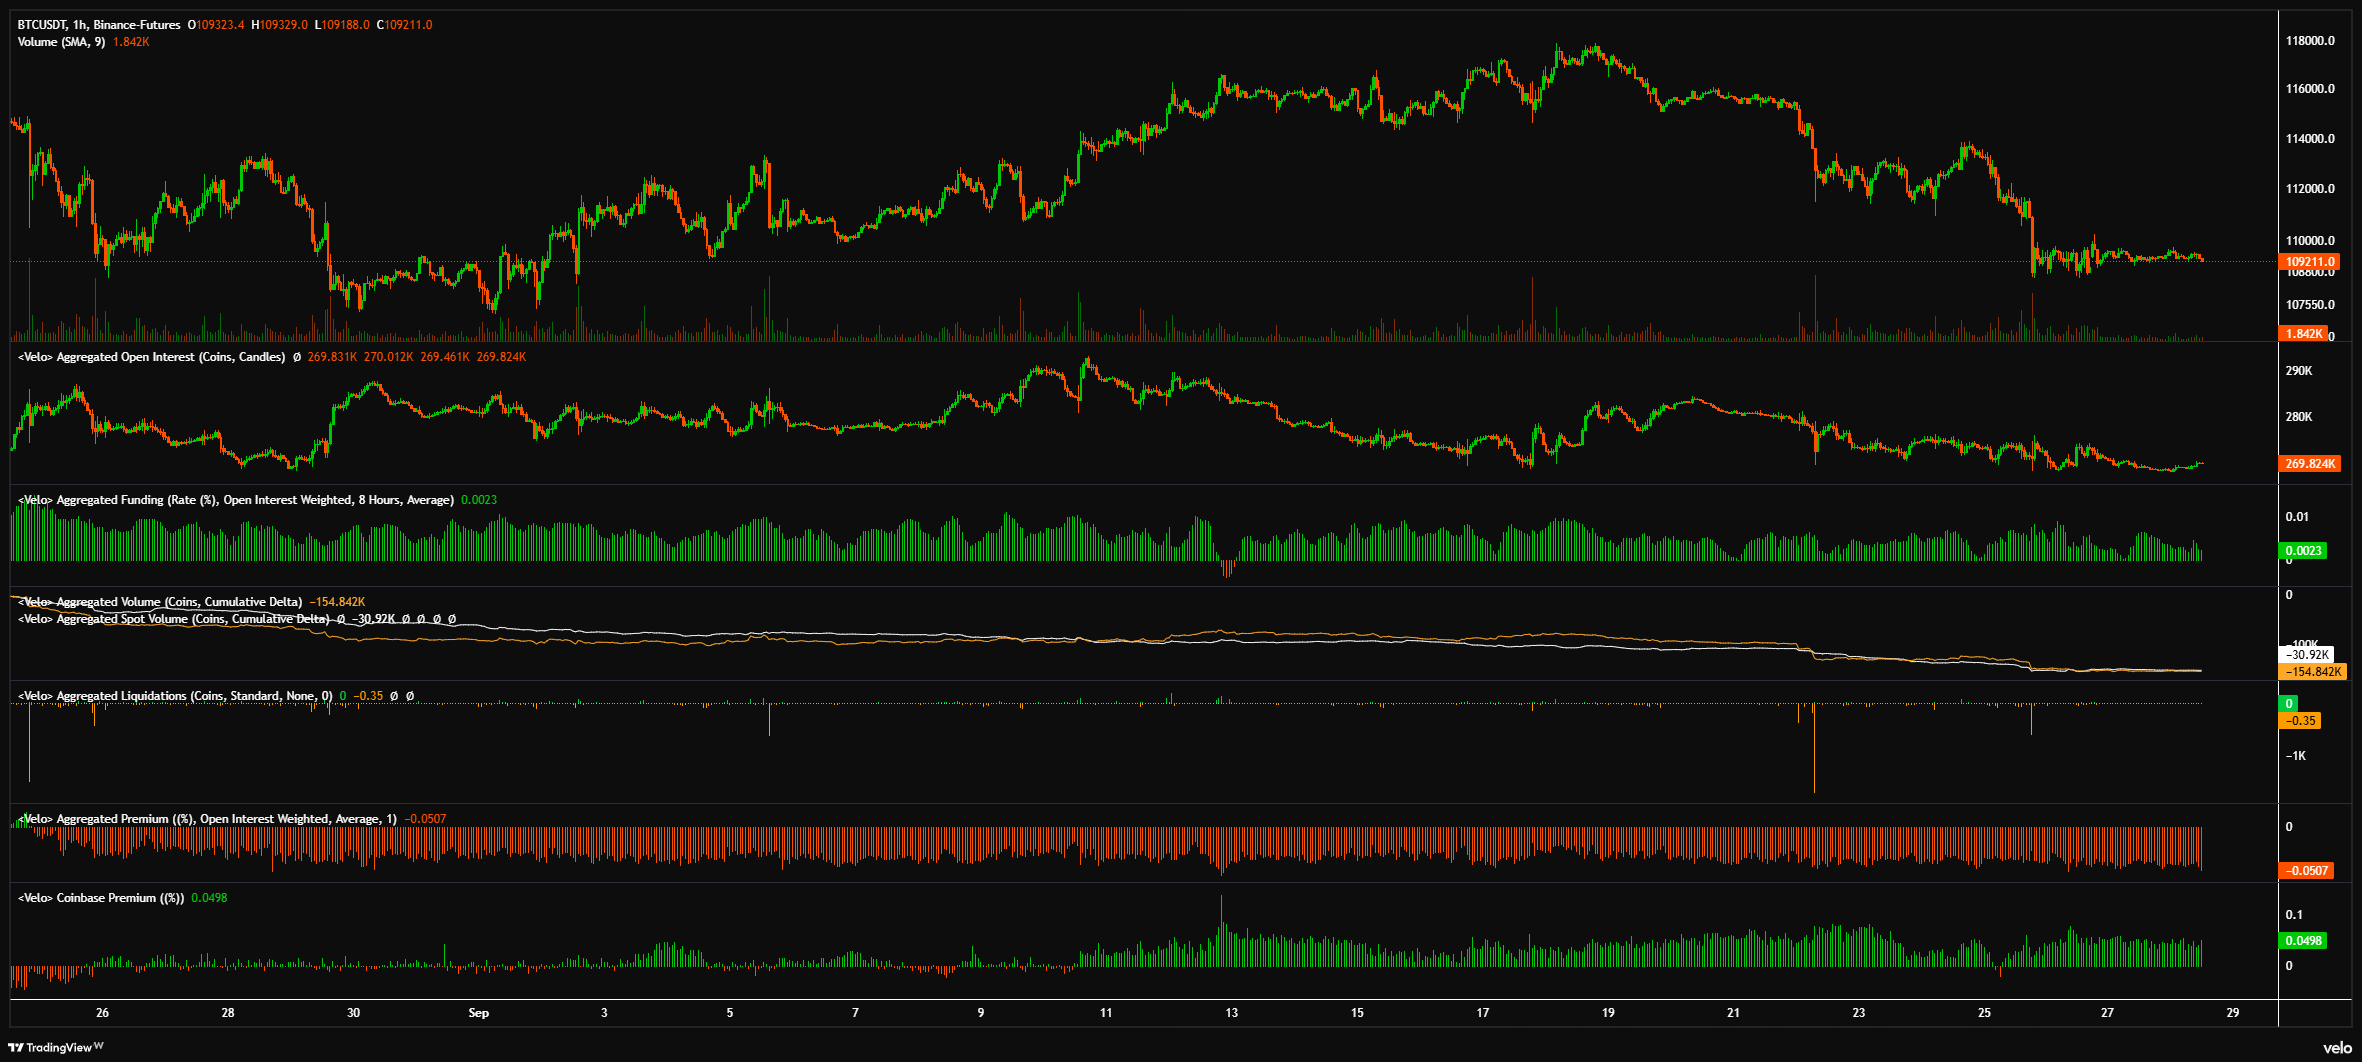
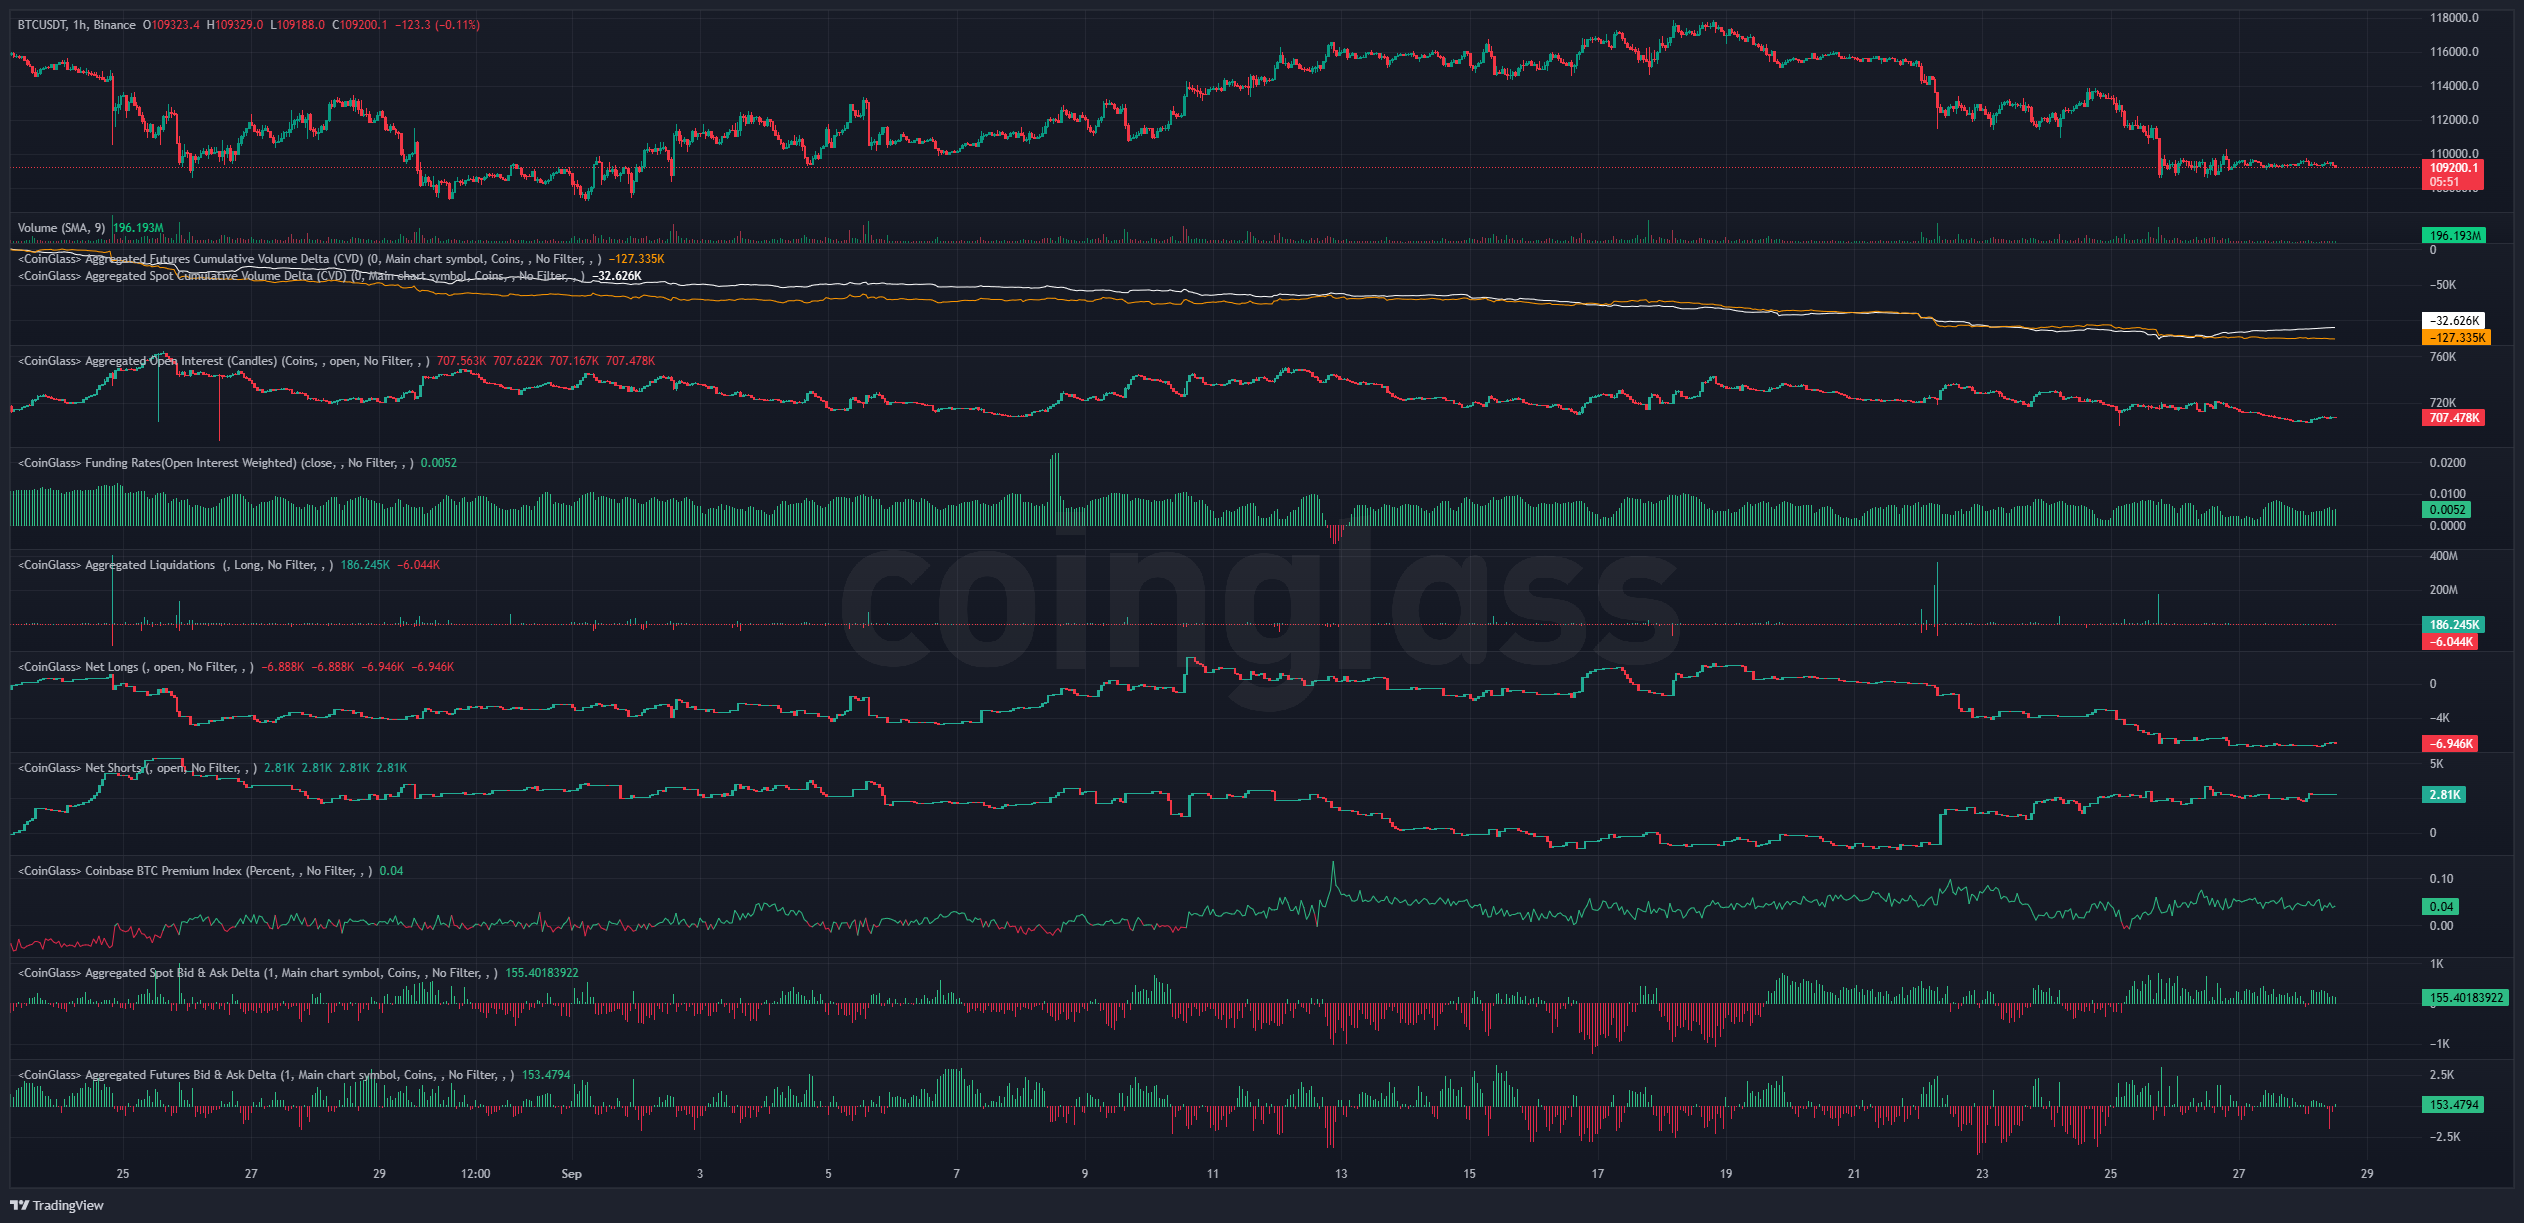
And here's a snapshot of positioning across Velo and CoinGlass:
And here's 3-month annualized basis:

And Bitcoin OI vs Altcoin OI:
.png)
And finally some of the expected 1-week and 1-month liquidation levels:
-2025-09-28_12_55_05.png)
-2025-09-28_12_54_35.png)
Price: $4126
ETH/USD
Weekly:
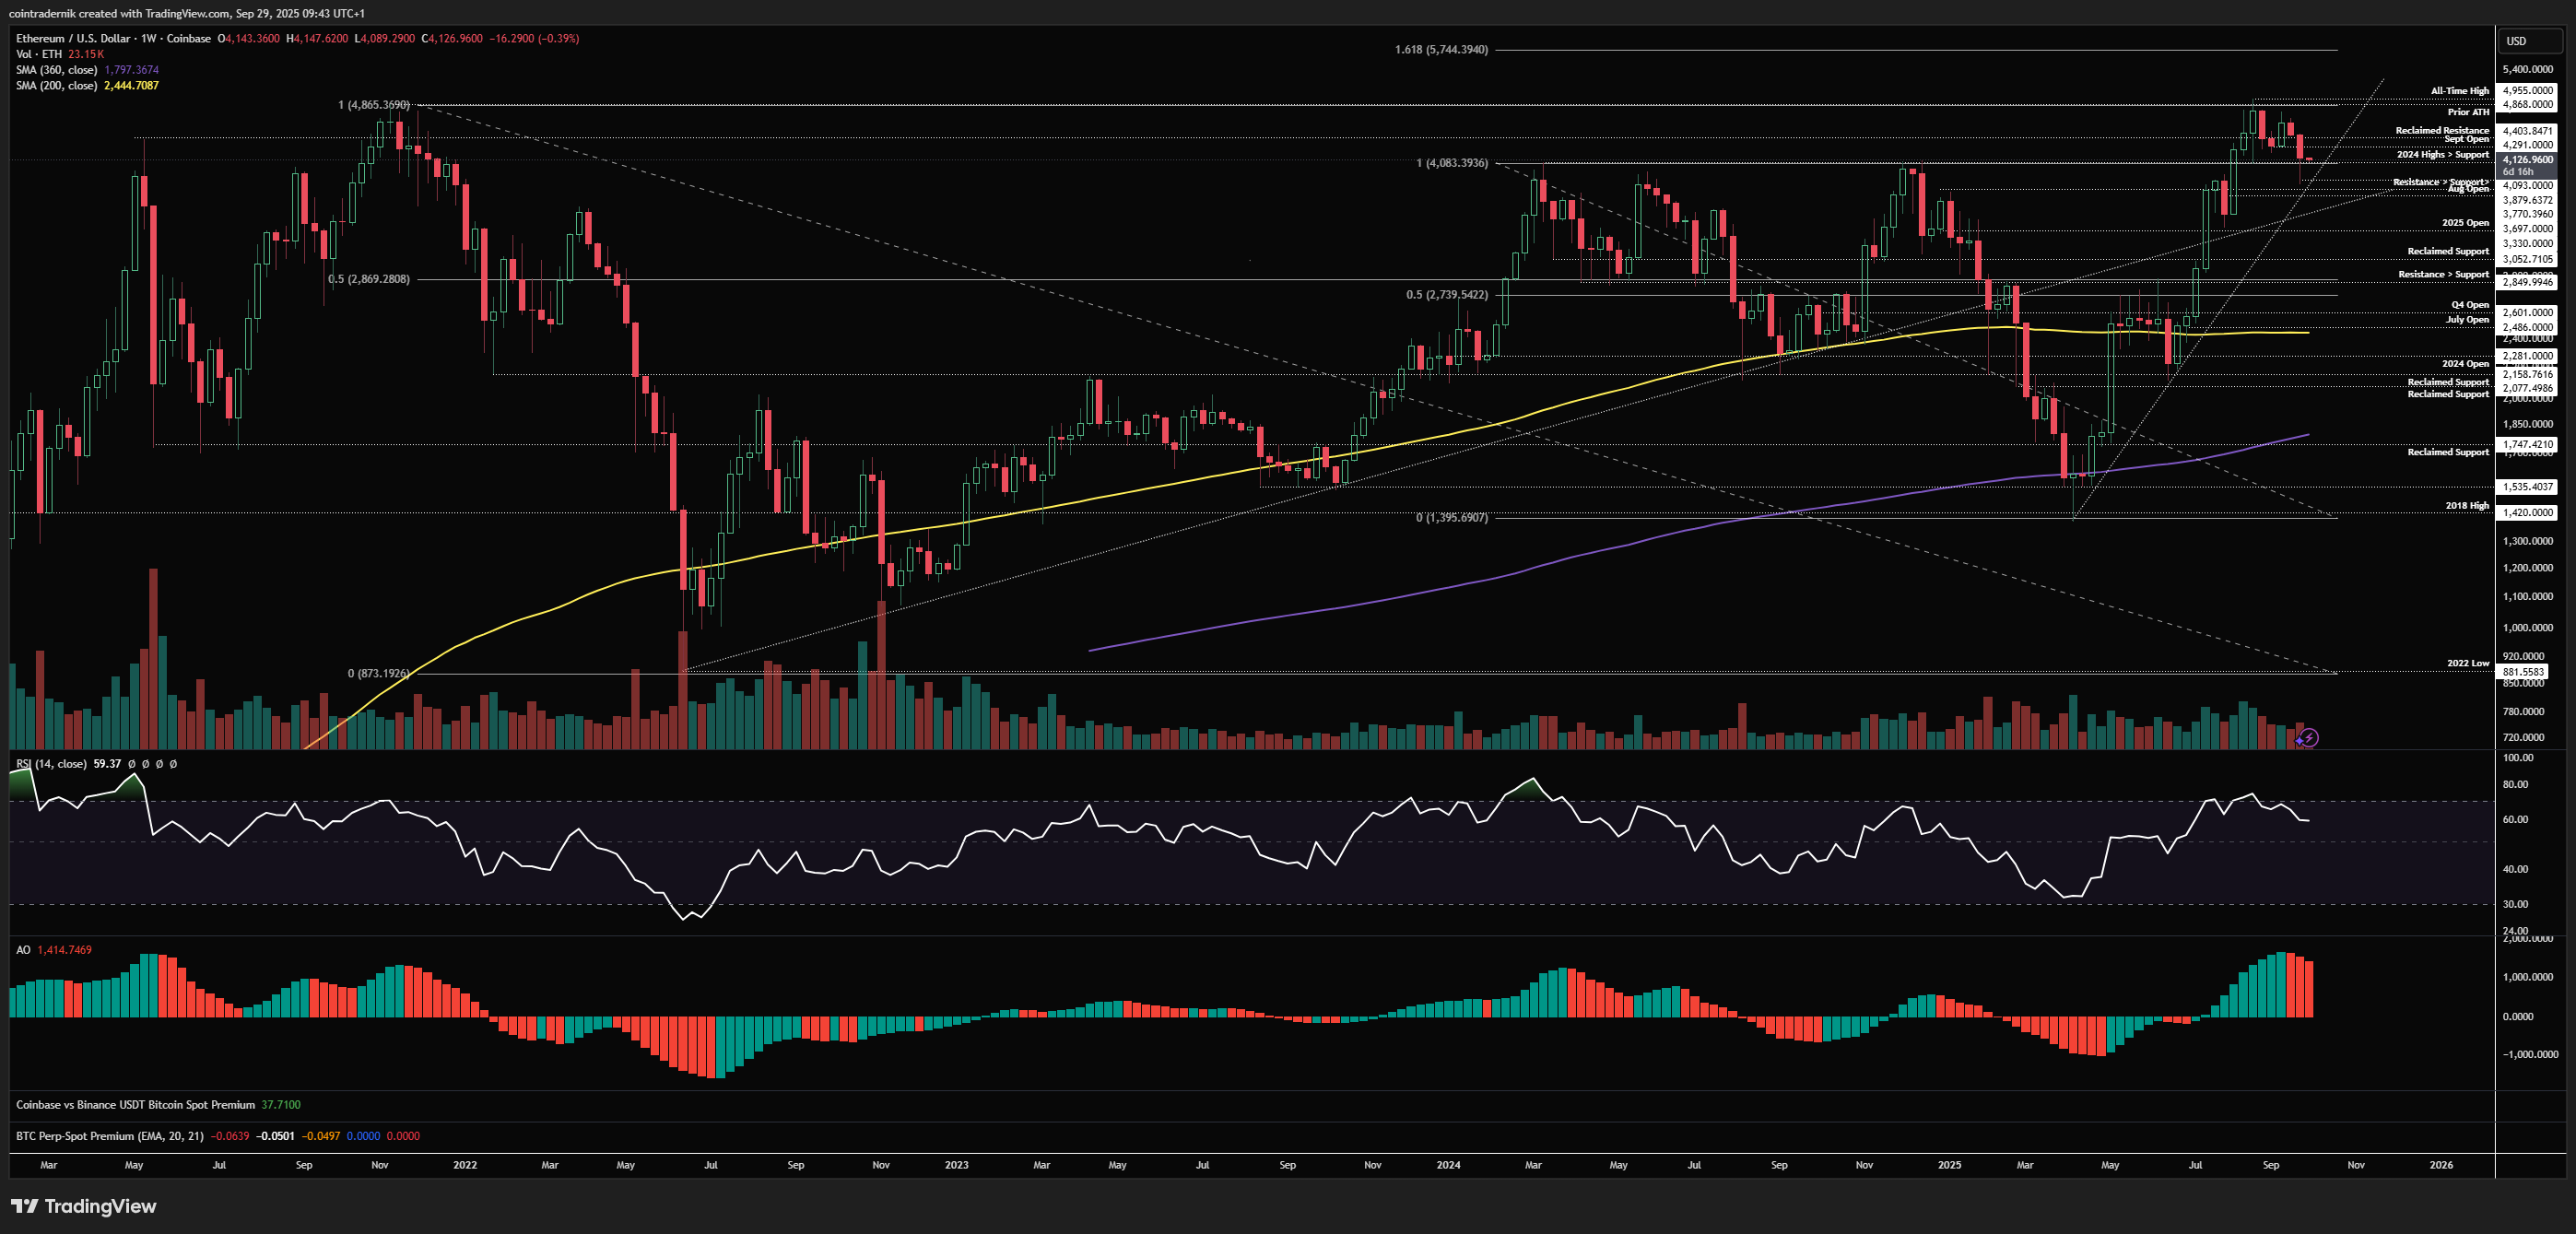
Beginning with the weekly for ETH/USD, we can see that priced wicked below that multi-year resistance turned support at $4093 last week, having sold off from the weekly open, culminating in a large liquidation event that pushed price as low at $3880, holding above trendline support from the yearly lows. Price then bounced off that level above the August open to close back above $4093. Now, if this was the fakeout move I highlighted last week, then we should now protect that low, and whilst we may well sweep it (depending on how BTC plays out), we absolutely should be closing this week above $4093 again. If we go into the second week of October back above the September open at $4291, that would be super bullish for the rest of October, in my view, where I would expect a breakout beyond all-time highs to follow. If we close below $4090 this week, things look a bit more bearish short-term, and we likely take out last week's low more convincingly and push towards $3770, where if we can get a bid it would open up that deeper retracement into the yearly open again before I expect we push for another high. In my mind, if bears cannot get this convincingly below last week's low into next week, the Q4 lows are in.
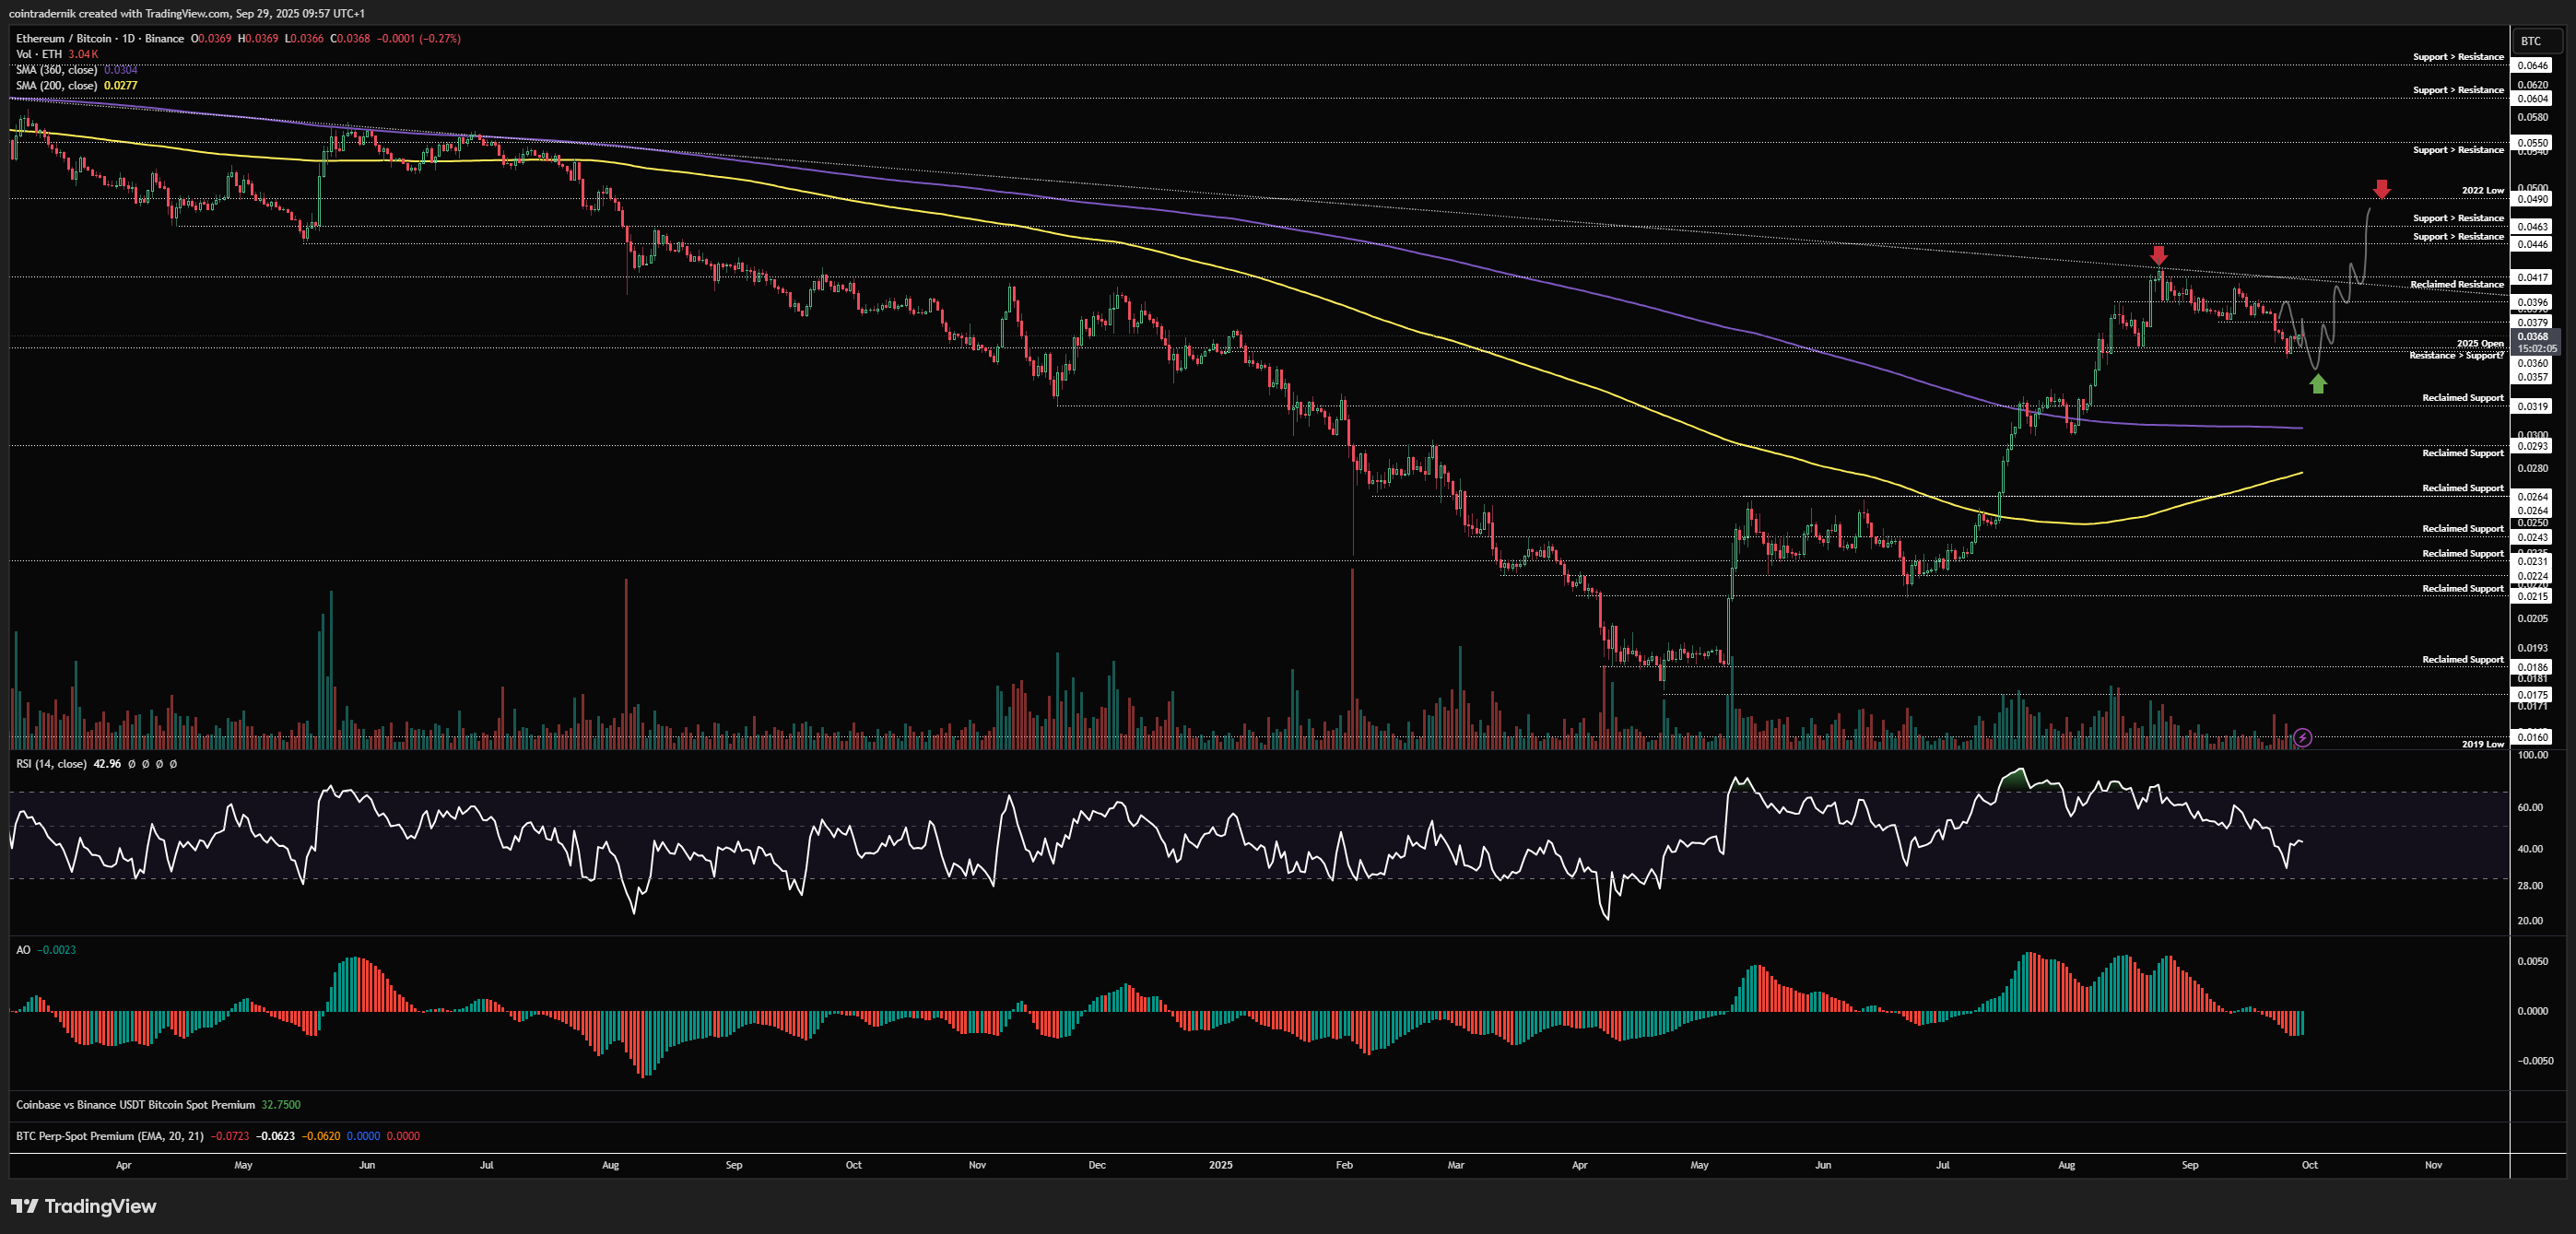
Daily:
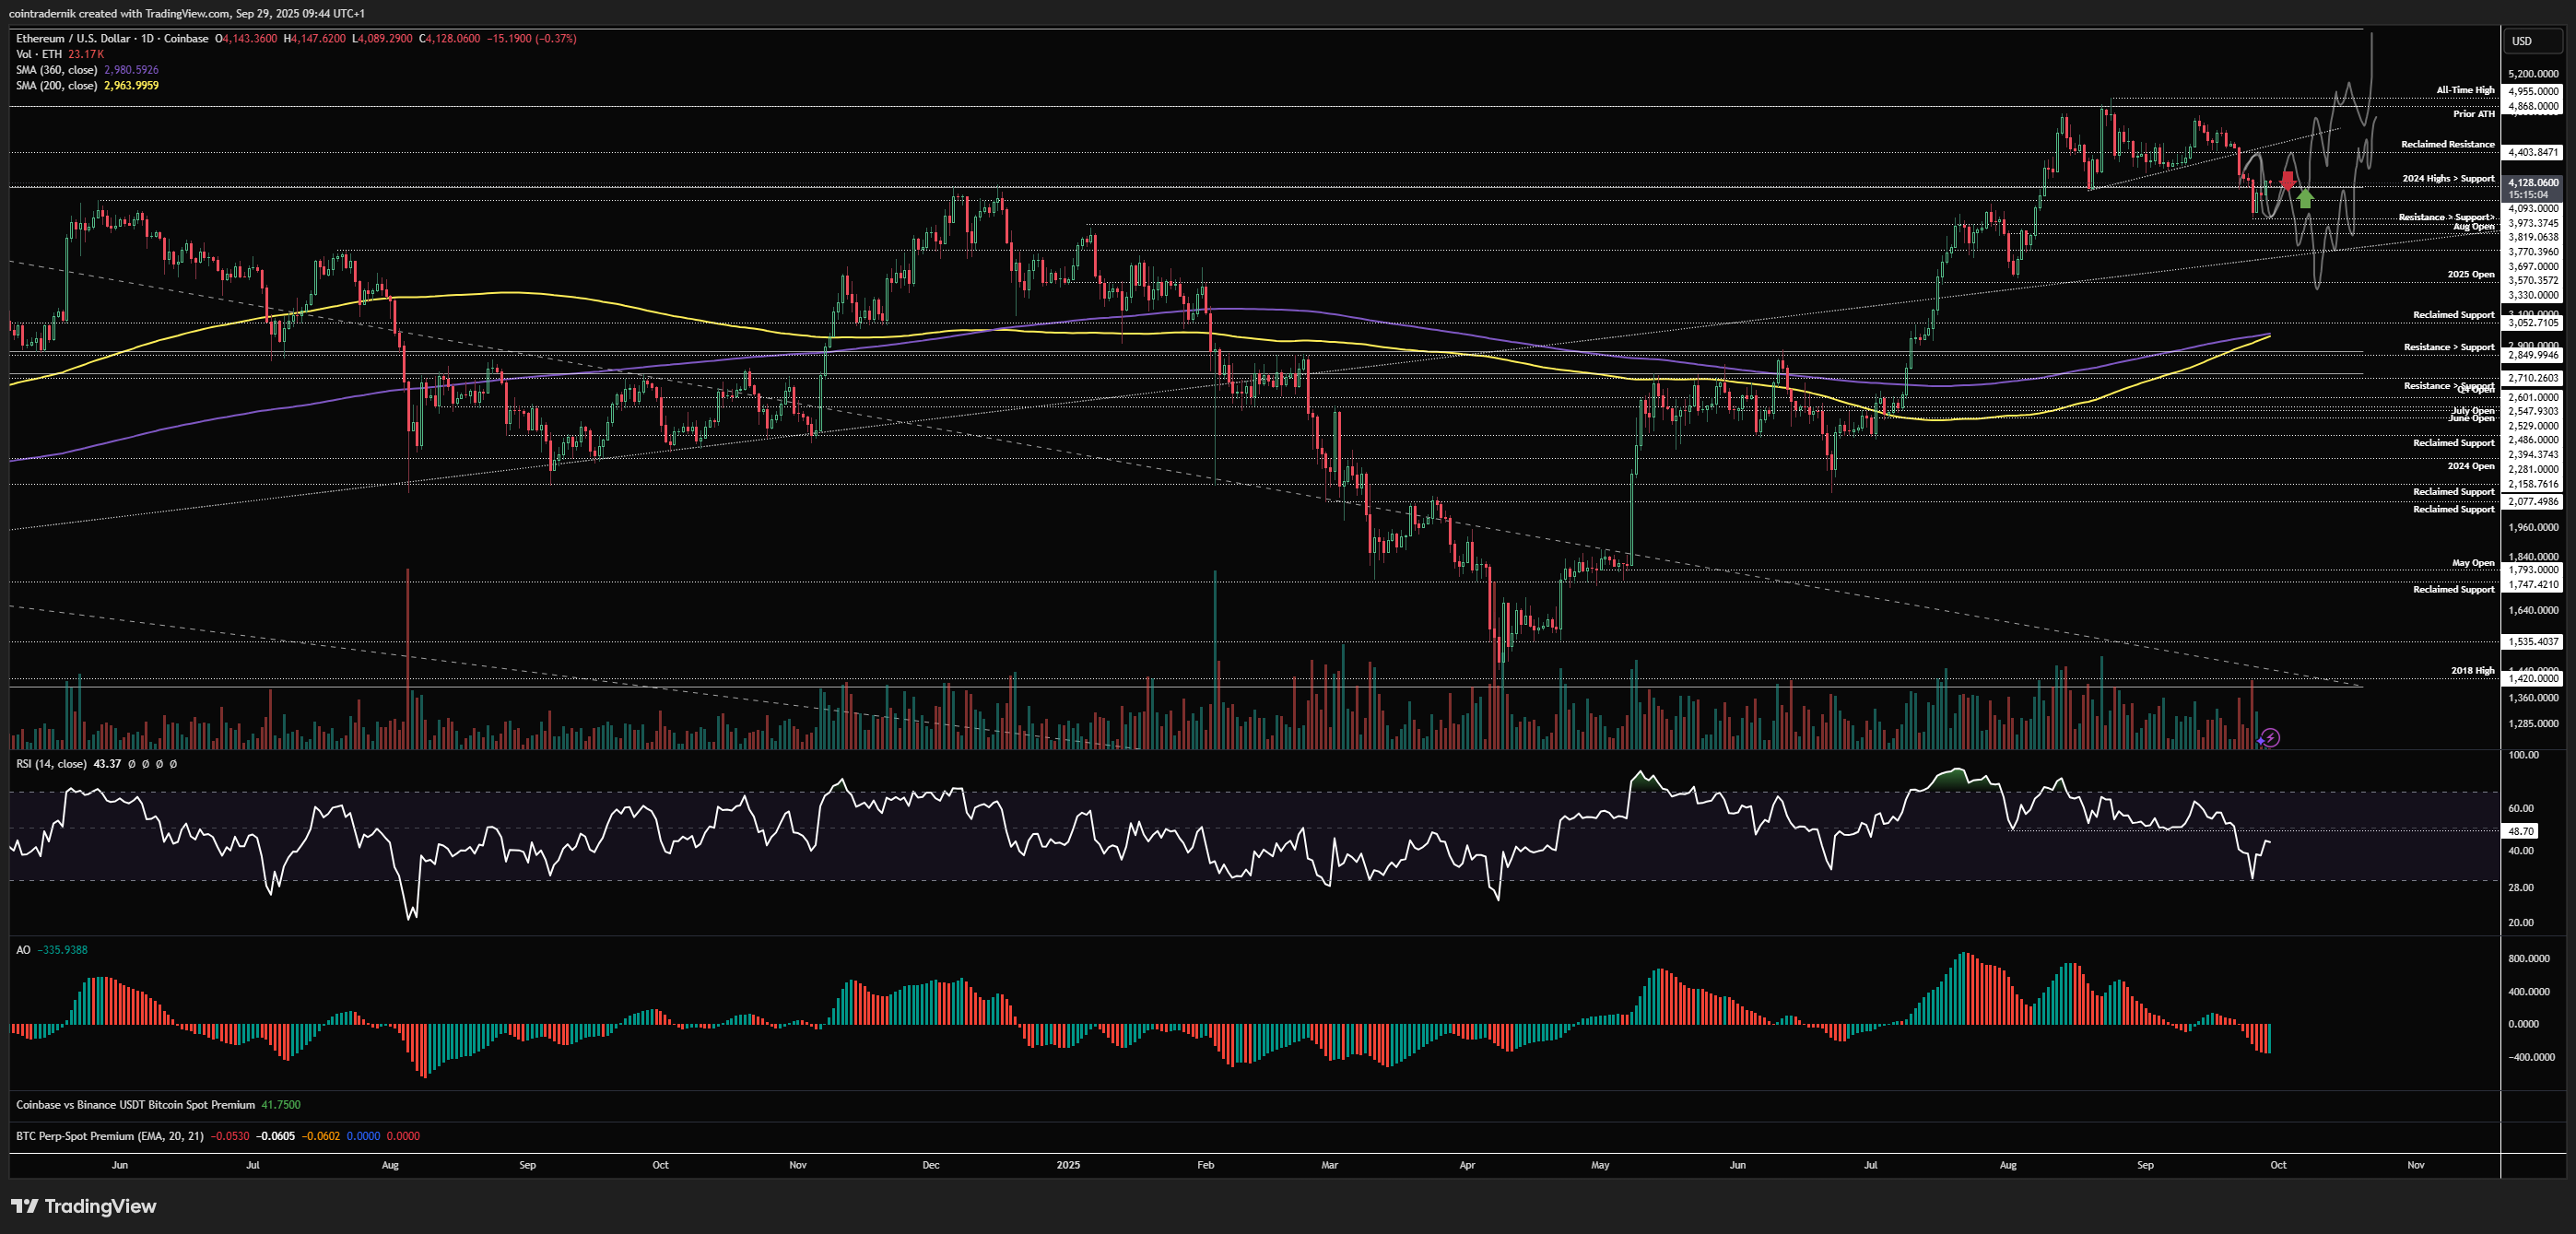
Looking at the daily, this is exactly how we expected part one of both trajectories to play out last week, as support below the trendline got decimated and the push below $4090 liquidated a lot of longs. Daily RSI broke below 50, above which it had held during the entire consolidation range. We are now right at the point where we will see whether this was the bear trap or the beginning of the larger move lower. If we reject below 50 on daily RSI this week, forming a lower-high here and then closing the daily below last week's low into the weekly close, that's not looking great, and I would expect a very sharp and violent move lower from there into $3330 before a major low can form. I give this about a 20% probability at present. My base case is that even if we sweep last week's low, we find a lot of demand and price closes the week back above $4093, then pushing into $4400 and subsequently forming a higher-low back inside that range from which we push towards all-time highs and beyond into November.
ETH/BTC
Weekly:
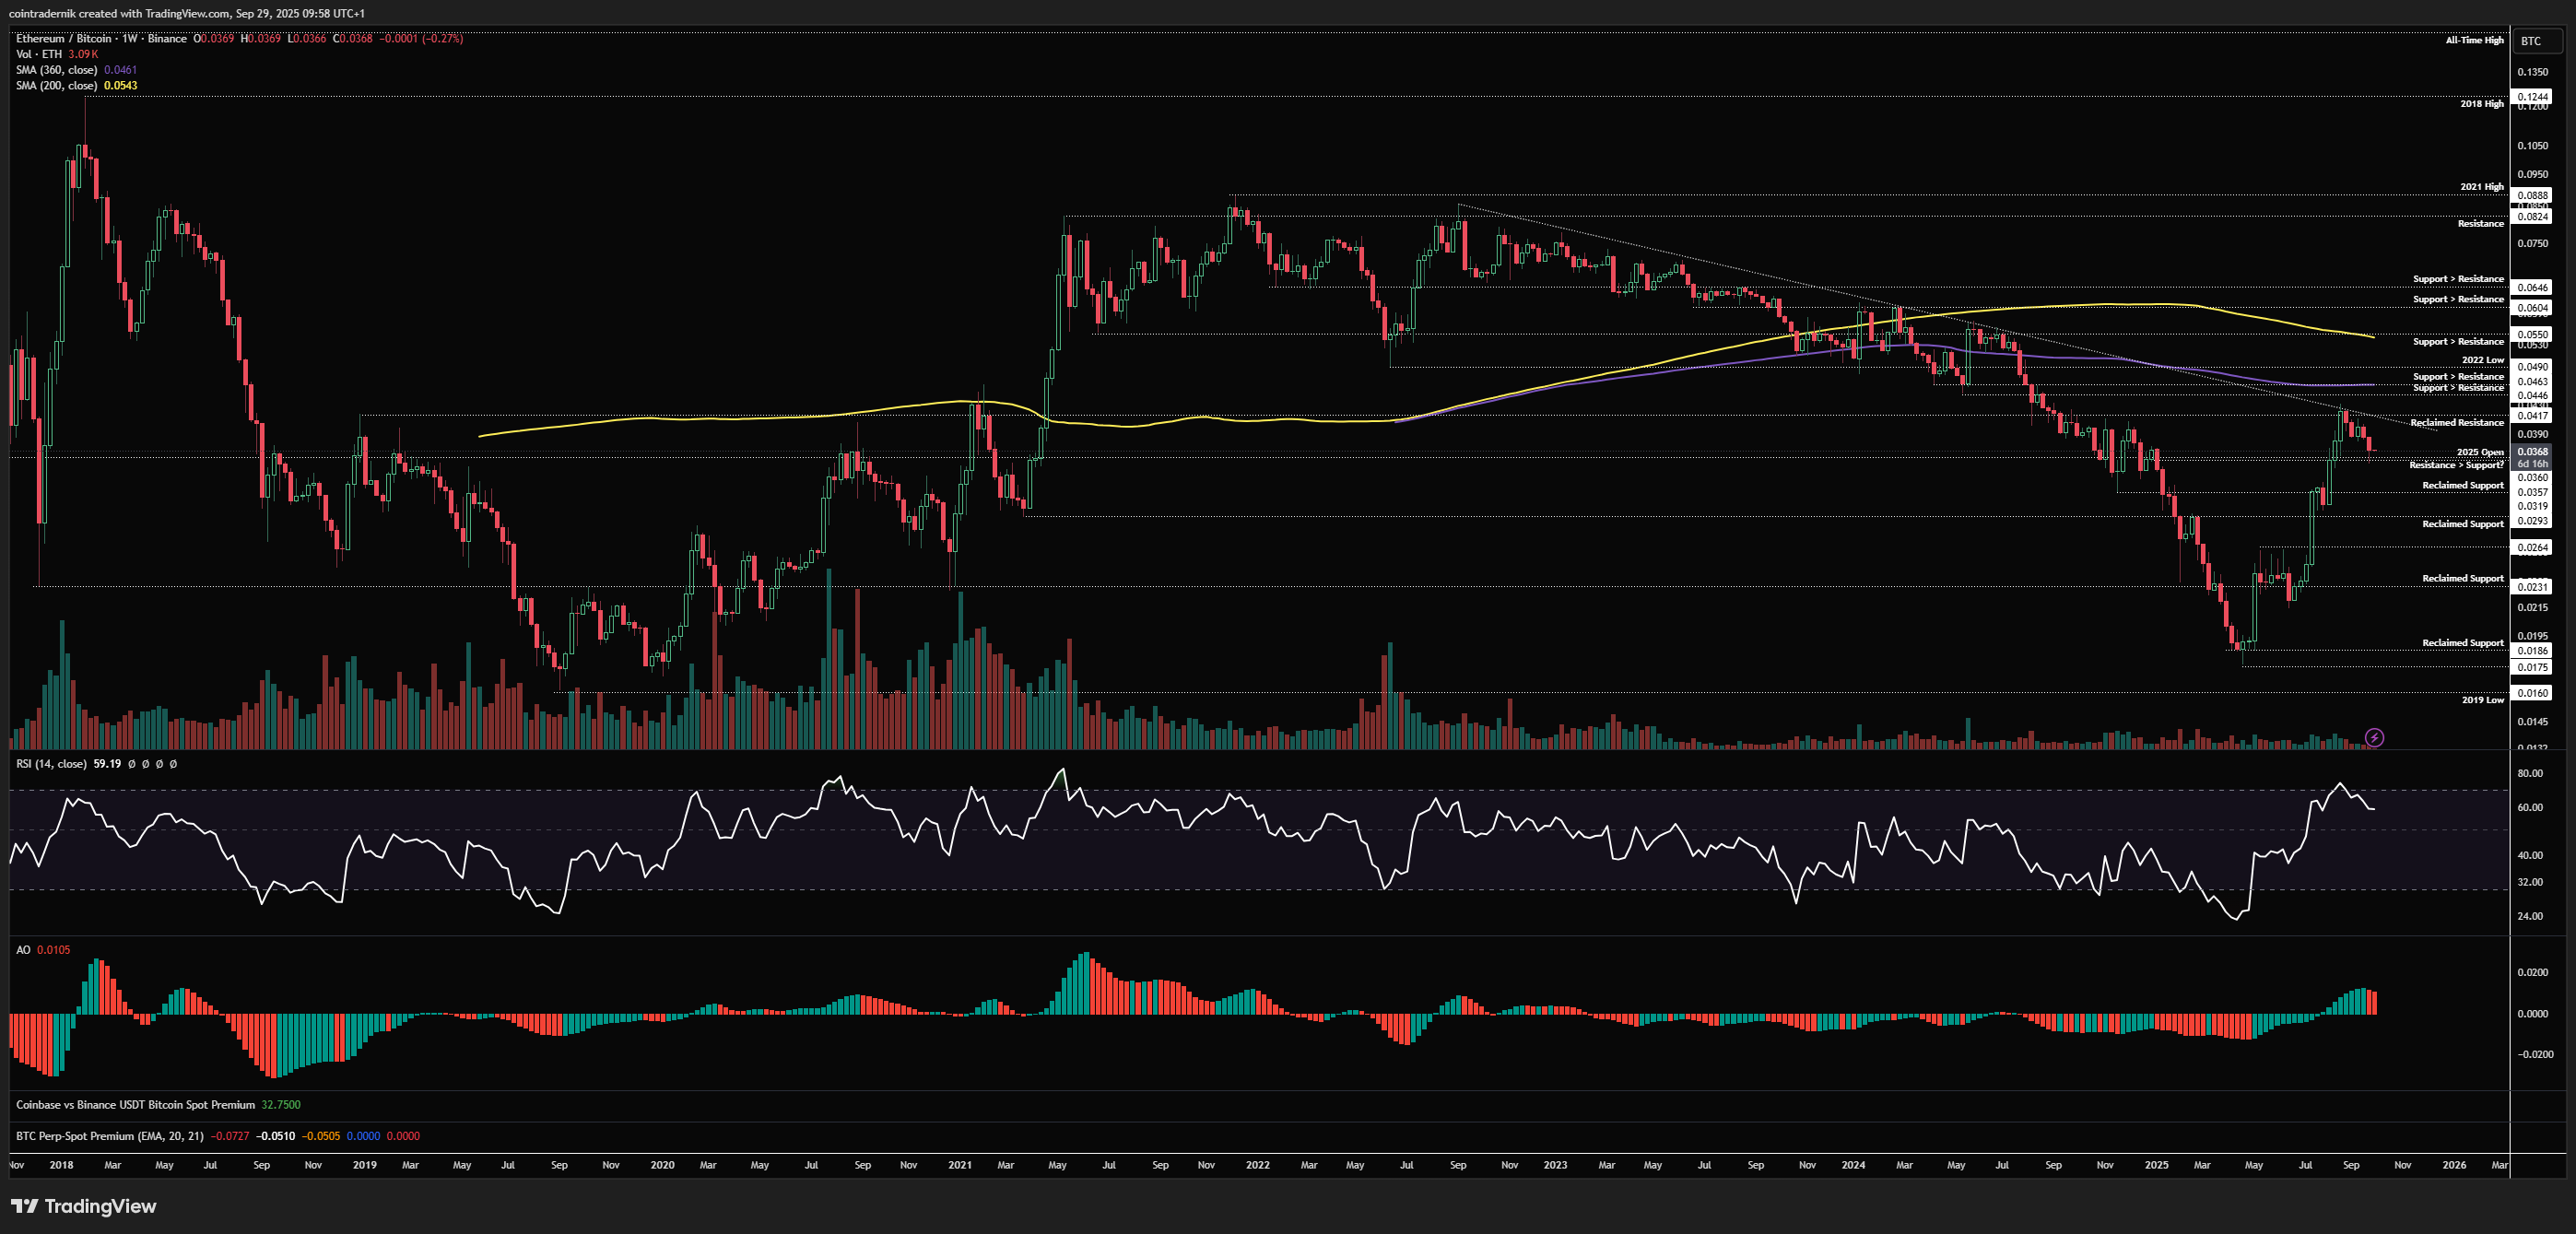
Beginning with the weekly for ETH/BTC, we can see that price moved lower into the yearly open as anticipated last week, but weekly structure and momentum remain bullish. We could yet see another push lower here this week into next before a major low forms, but I do think we are close to that occurring here, where the expectation remains that the next attempt at a trendline breakout is successful. From that point, I would expect continuation higher ultimately towards the 200wMA at 0.055 over the coming months. A weekly close below the yearly open here leads to a deeper pullback towards 0.032, but this would still be bullish mid-term in my view; only if we close the weekly back below 0.0294 does this structure look cooked.
Daily:
Looking at the daily, we can see how this has been playing out since last week, and I still think we can take out last week's low and perhaps form some bullish divergence into that range between 0.032 and 0.036 before the low is in; nonetheless, I think we're close and if we have already put in the swing-low, we should see 0.038 reclaimed as support this week into next week and 0.036 defended hard on any subsequent pullback, where we would then see that multi-year trendline retest. I think we're basically playing out that consolidation between May and late June except this time with more firmly bullish higher timeframe structure and momentum and with price above its two key long-term MAs.
Receive the latest updates directly to your inbox

Price: $97.52
Weekly:
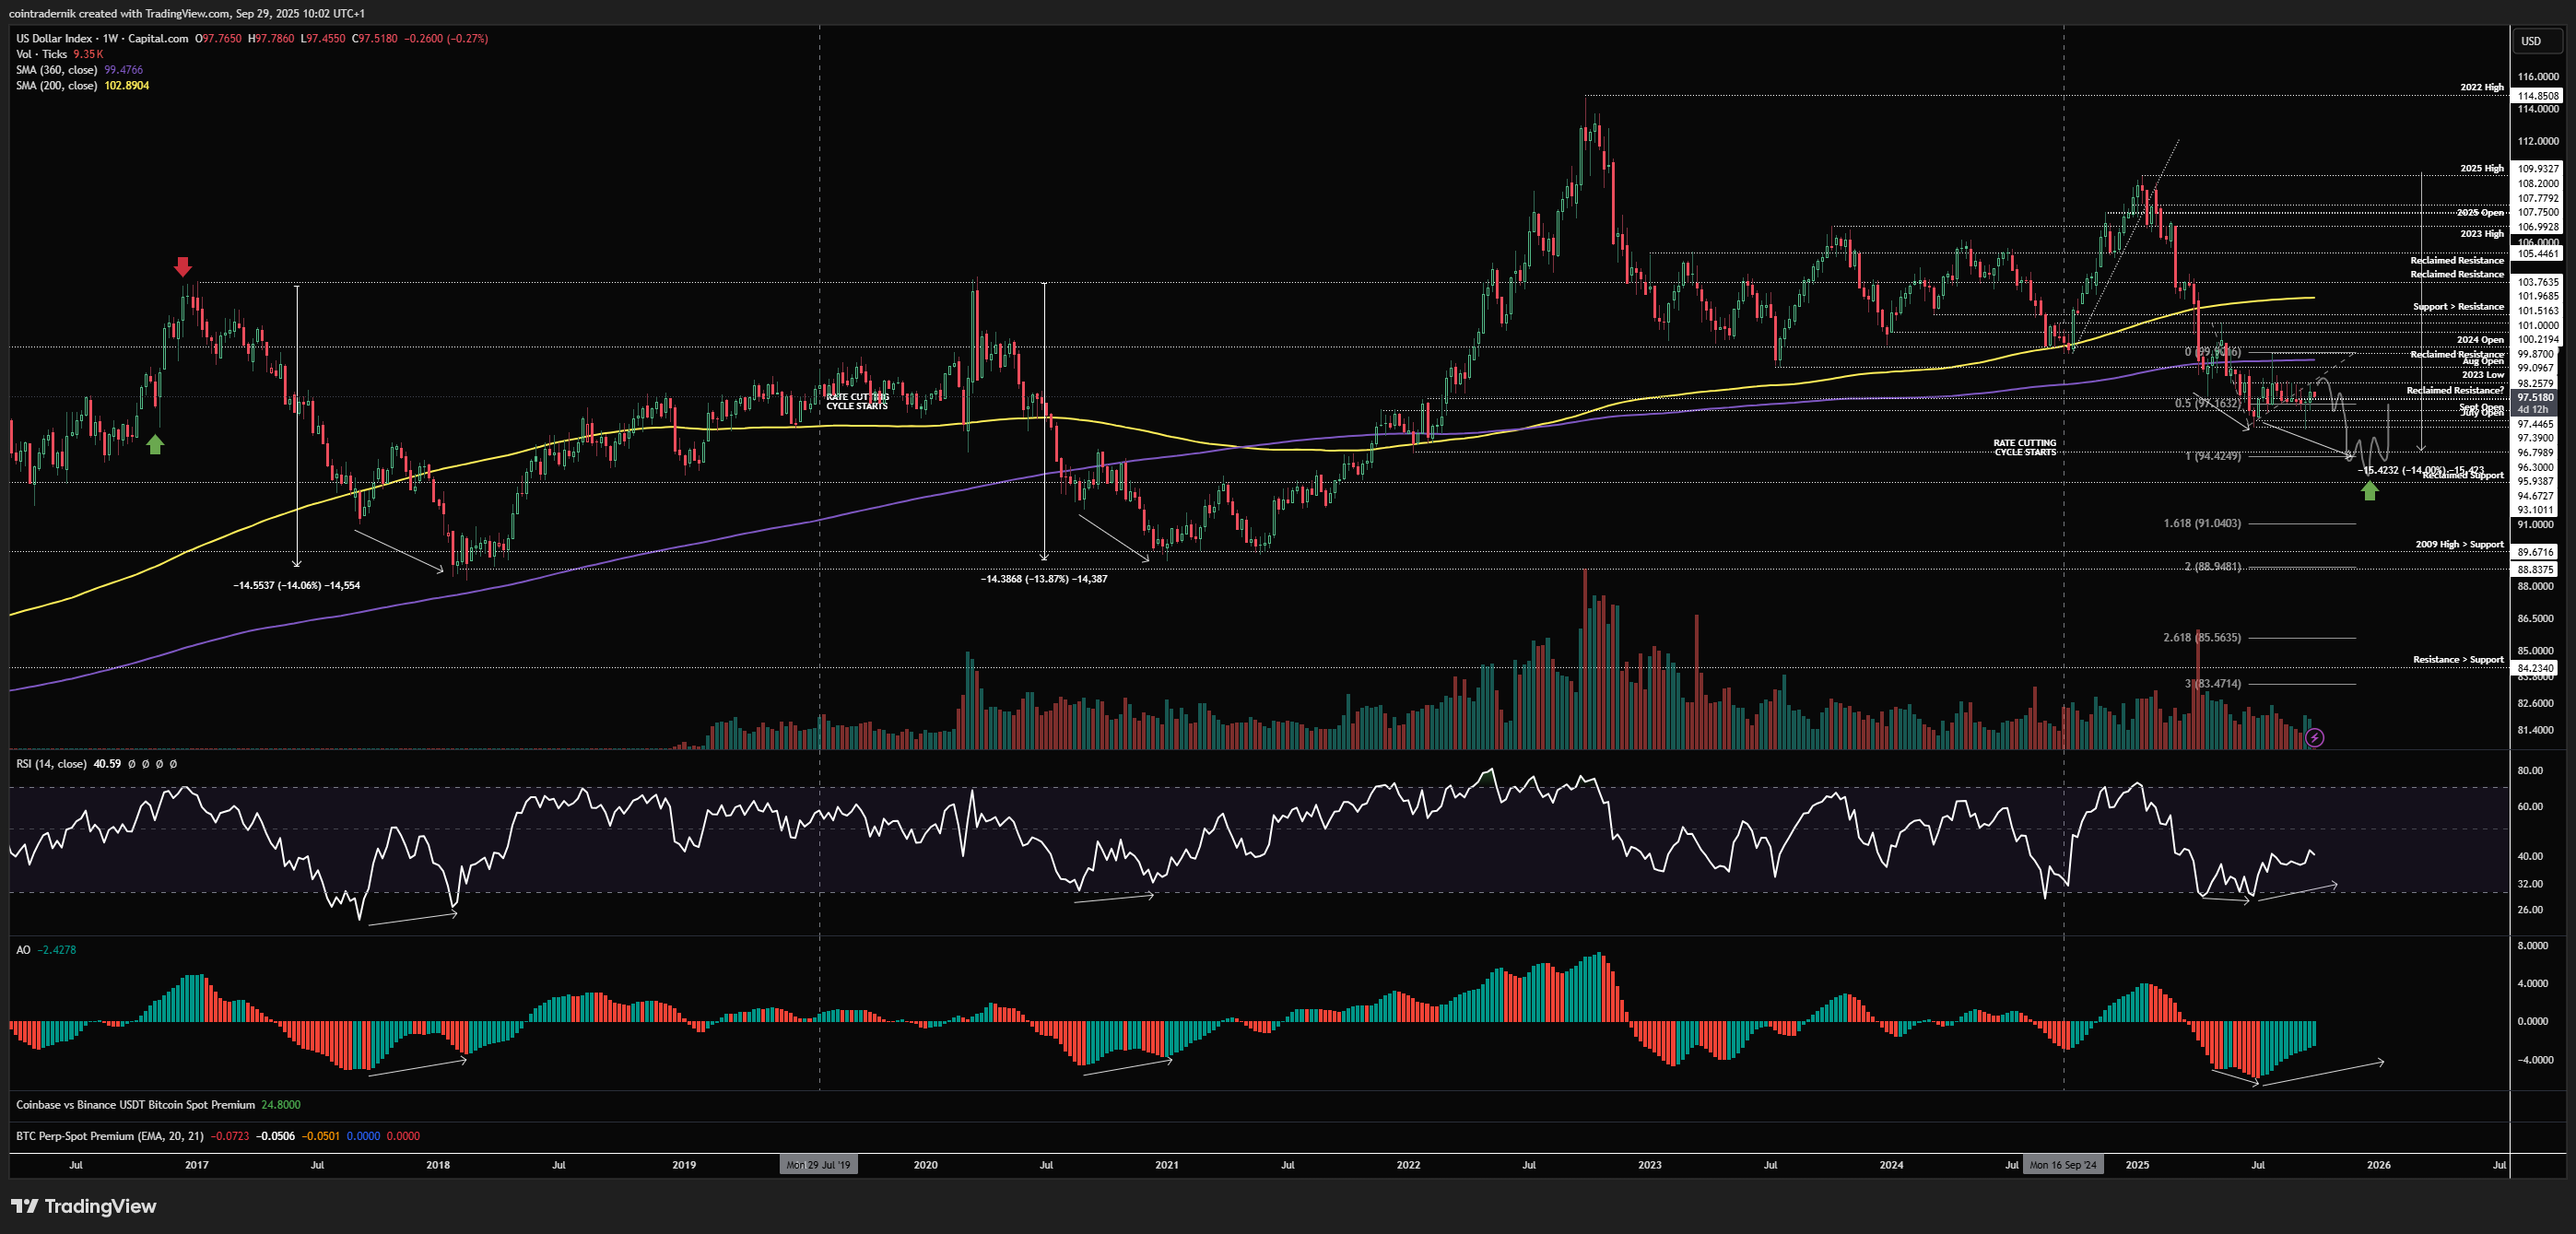
Beginning with the weekly for DXY, we continue to trade within this broader range above the July lows, having wicked below the low, bounced and then pushed higher, with last week retesting 98.3 as resistance. This was the post-FOMC Dollar bid I was expecting but I do think this upside will be short-lived, with 99 as the highest I am expecting DXY to push towards, though more likely a sweep of last week's highs before continuation lower. The target is 93 some time in Q4. Invalidation for this broader view remains acceptance back inside the multi-year range support turned resistance at ~100.
Daily:
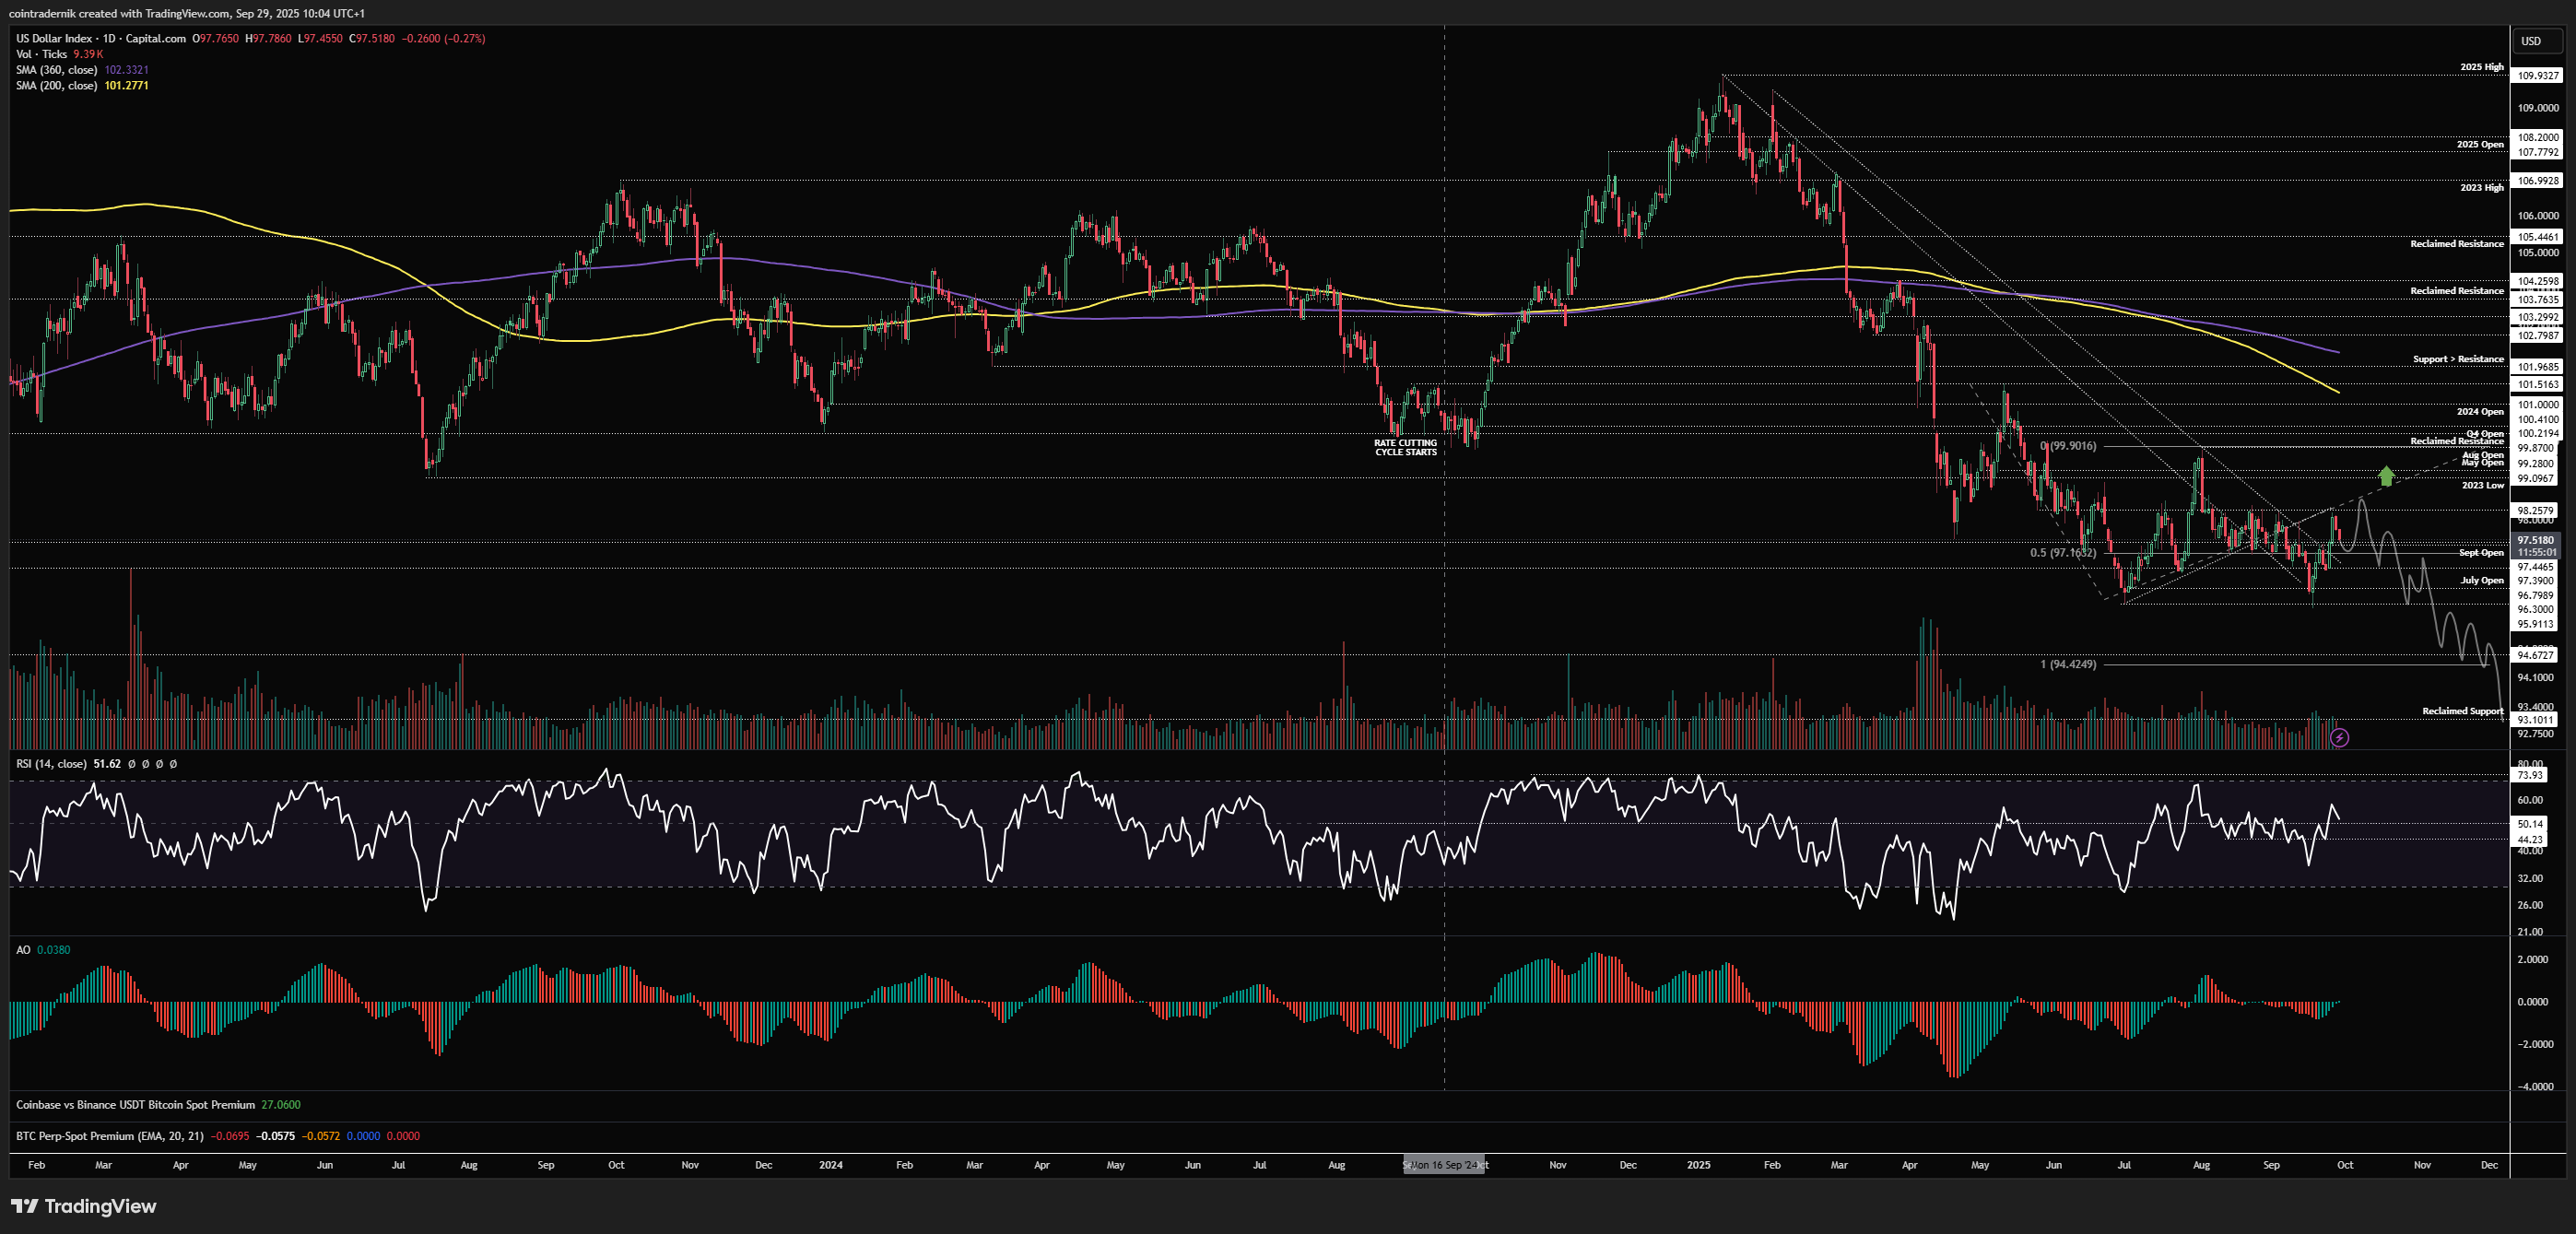
Dropping into the daily, we can see that there has been some decent momentum on the most recent push higher, taking daily RSI back above that 50 pivot. I think this can fuel another push through last week's high to take out the cluster of highs at 98.3 before acting as a bull trap (as long as we hold above 97.4 this week), where any subsequent move below the Sept open with daily RSI back below 50 = confirmation of the next leg lower through 96 towards 93. If we don't get that pop higher first and simply break lower from here, we want to see 96.8 flipped into resistance as the low that preceded this last push into 98.25, where below that level it is very probable we run 95.9 and beyond.
Price: $6687
Weekly:
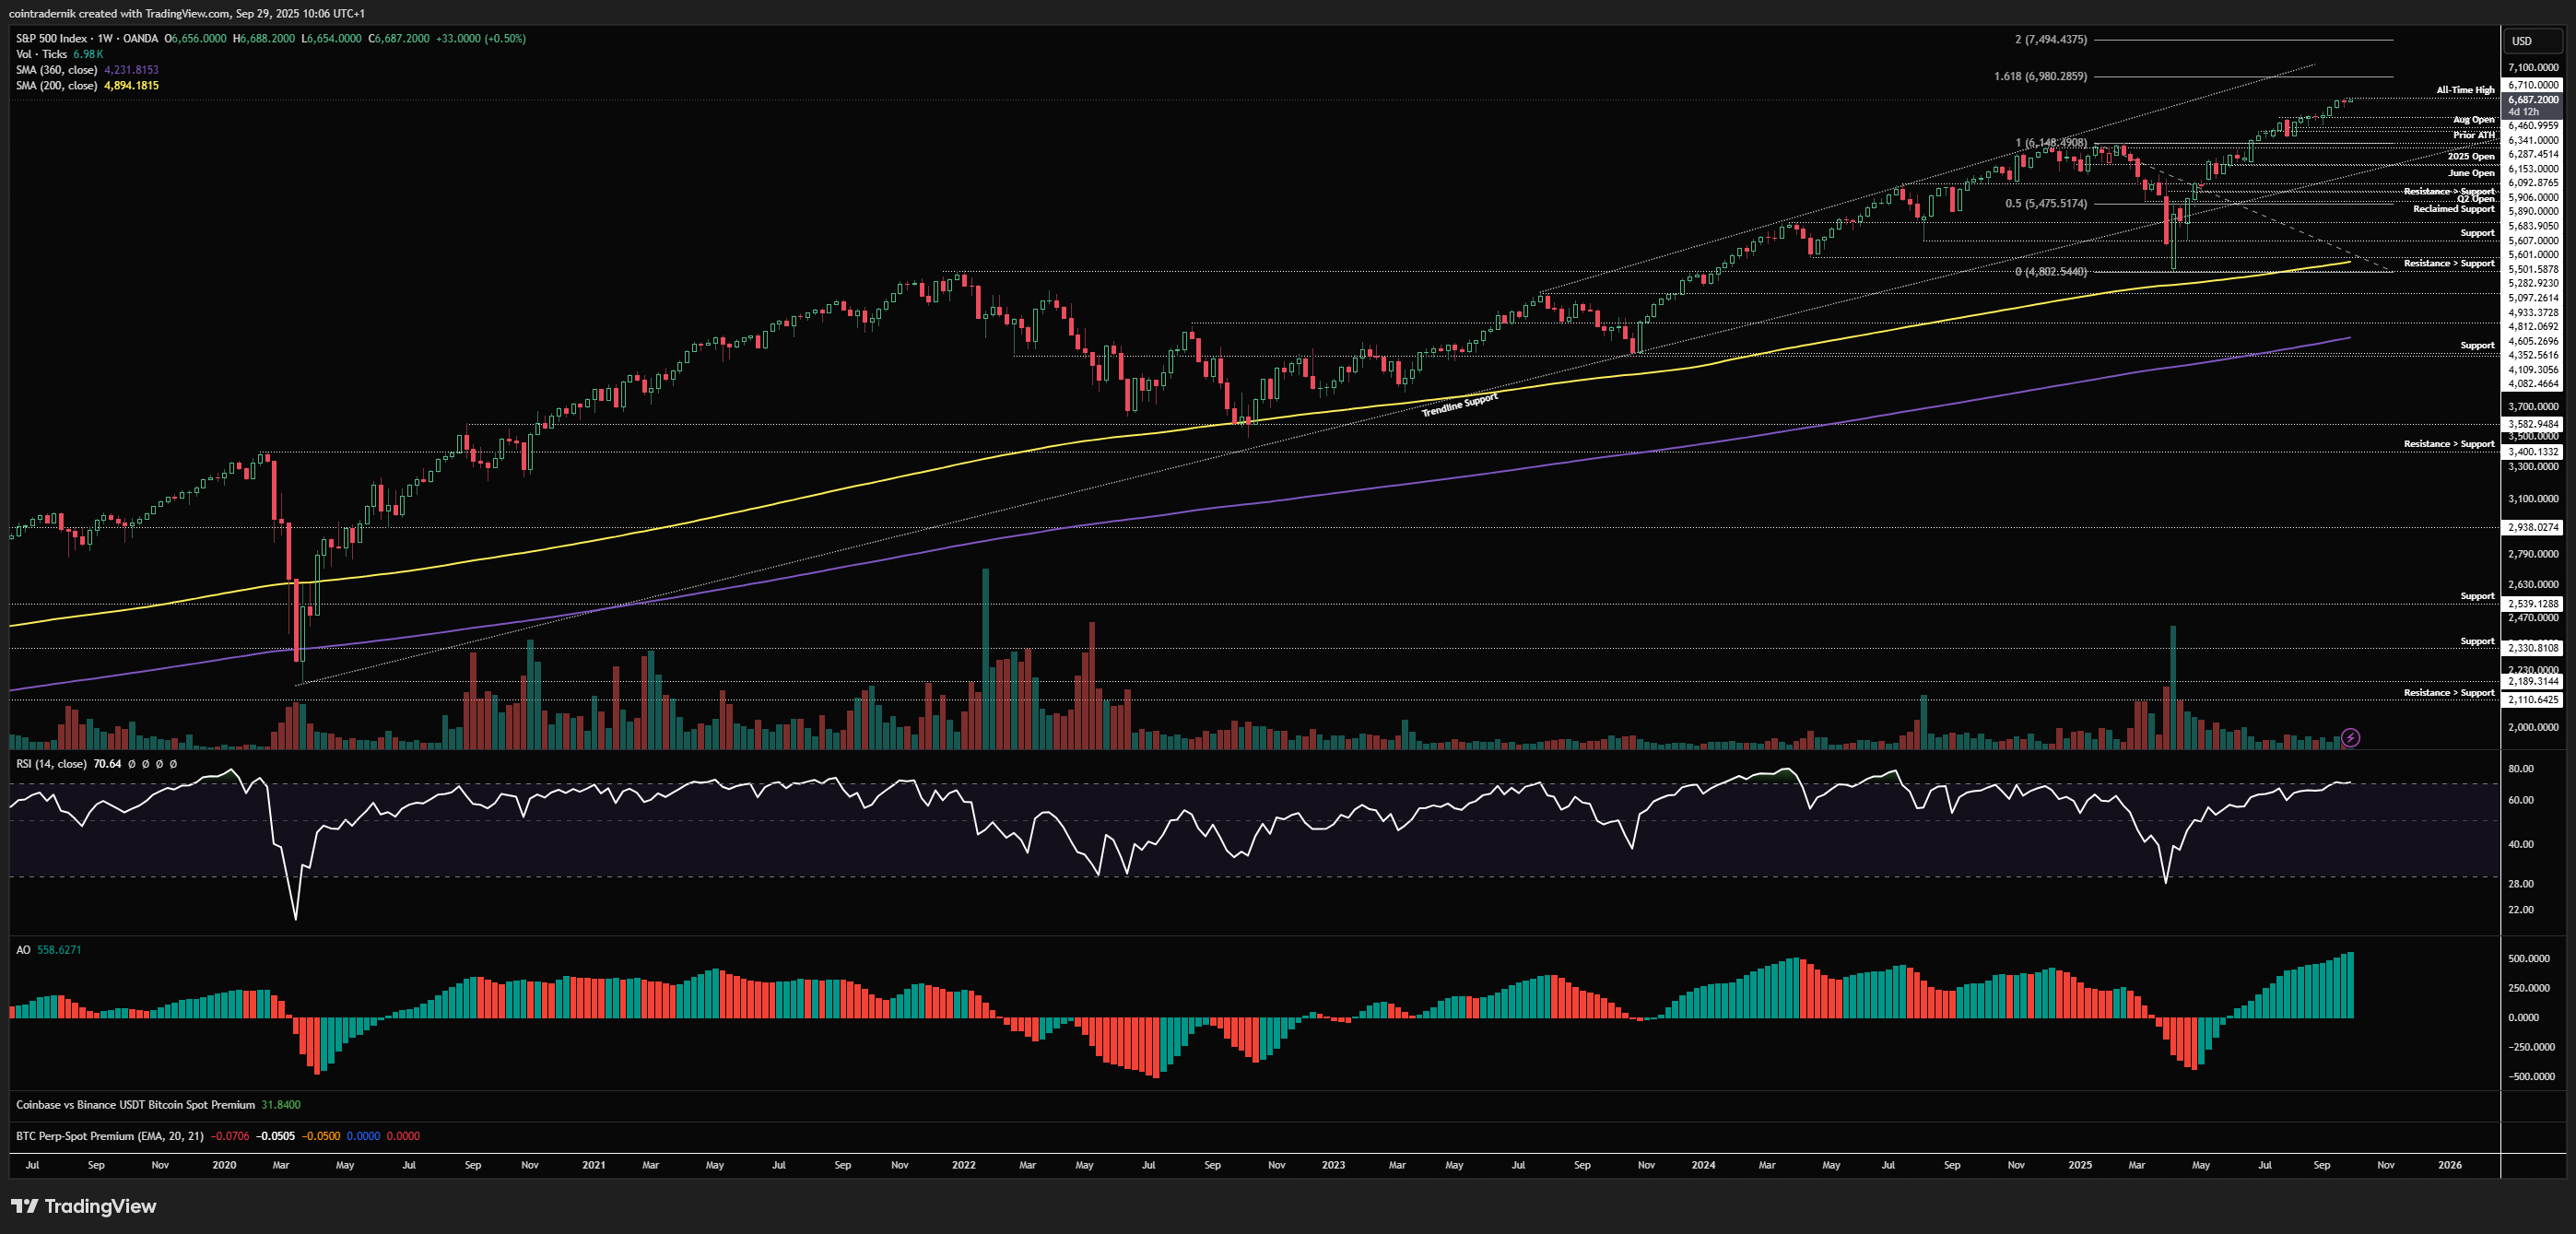
Last week saw price reject at $6710 and push lower, pushing into $6580 before closing the week back near $6656, closing the first red candle in a few weeks. Nonetheless, early trading this week has seen us push higher with this ever-resilient bid, and there is a decent chance we take out the high at $6710 before another attempt at downside. I do think October will be a little choppier for equities than it will for crypto but I am expecting a strong Q4 across the board, so dips should continue to be viewed as opportunities to add. If we break below last week's low this week, I think we shoot for $6460 to the downside before pushing higher from there. If instead we close above last week's high, we continue to grind higher towards that big $7000 figure until we see lower timeframe exhaustion.
Daily:
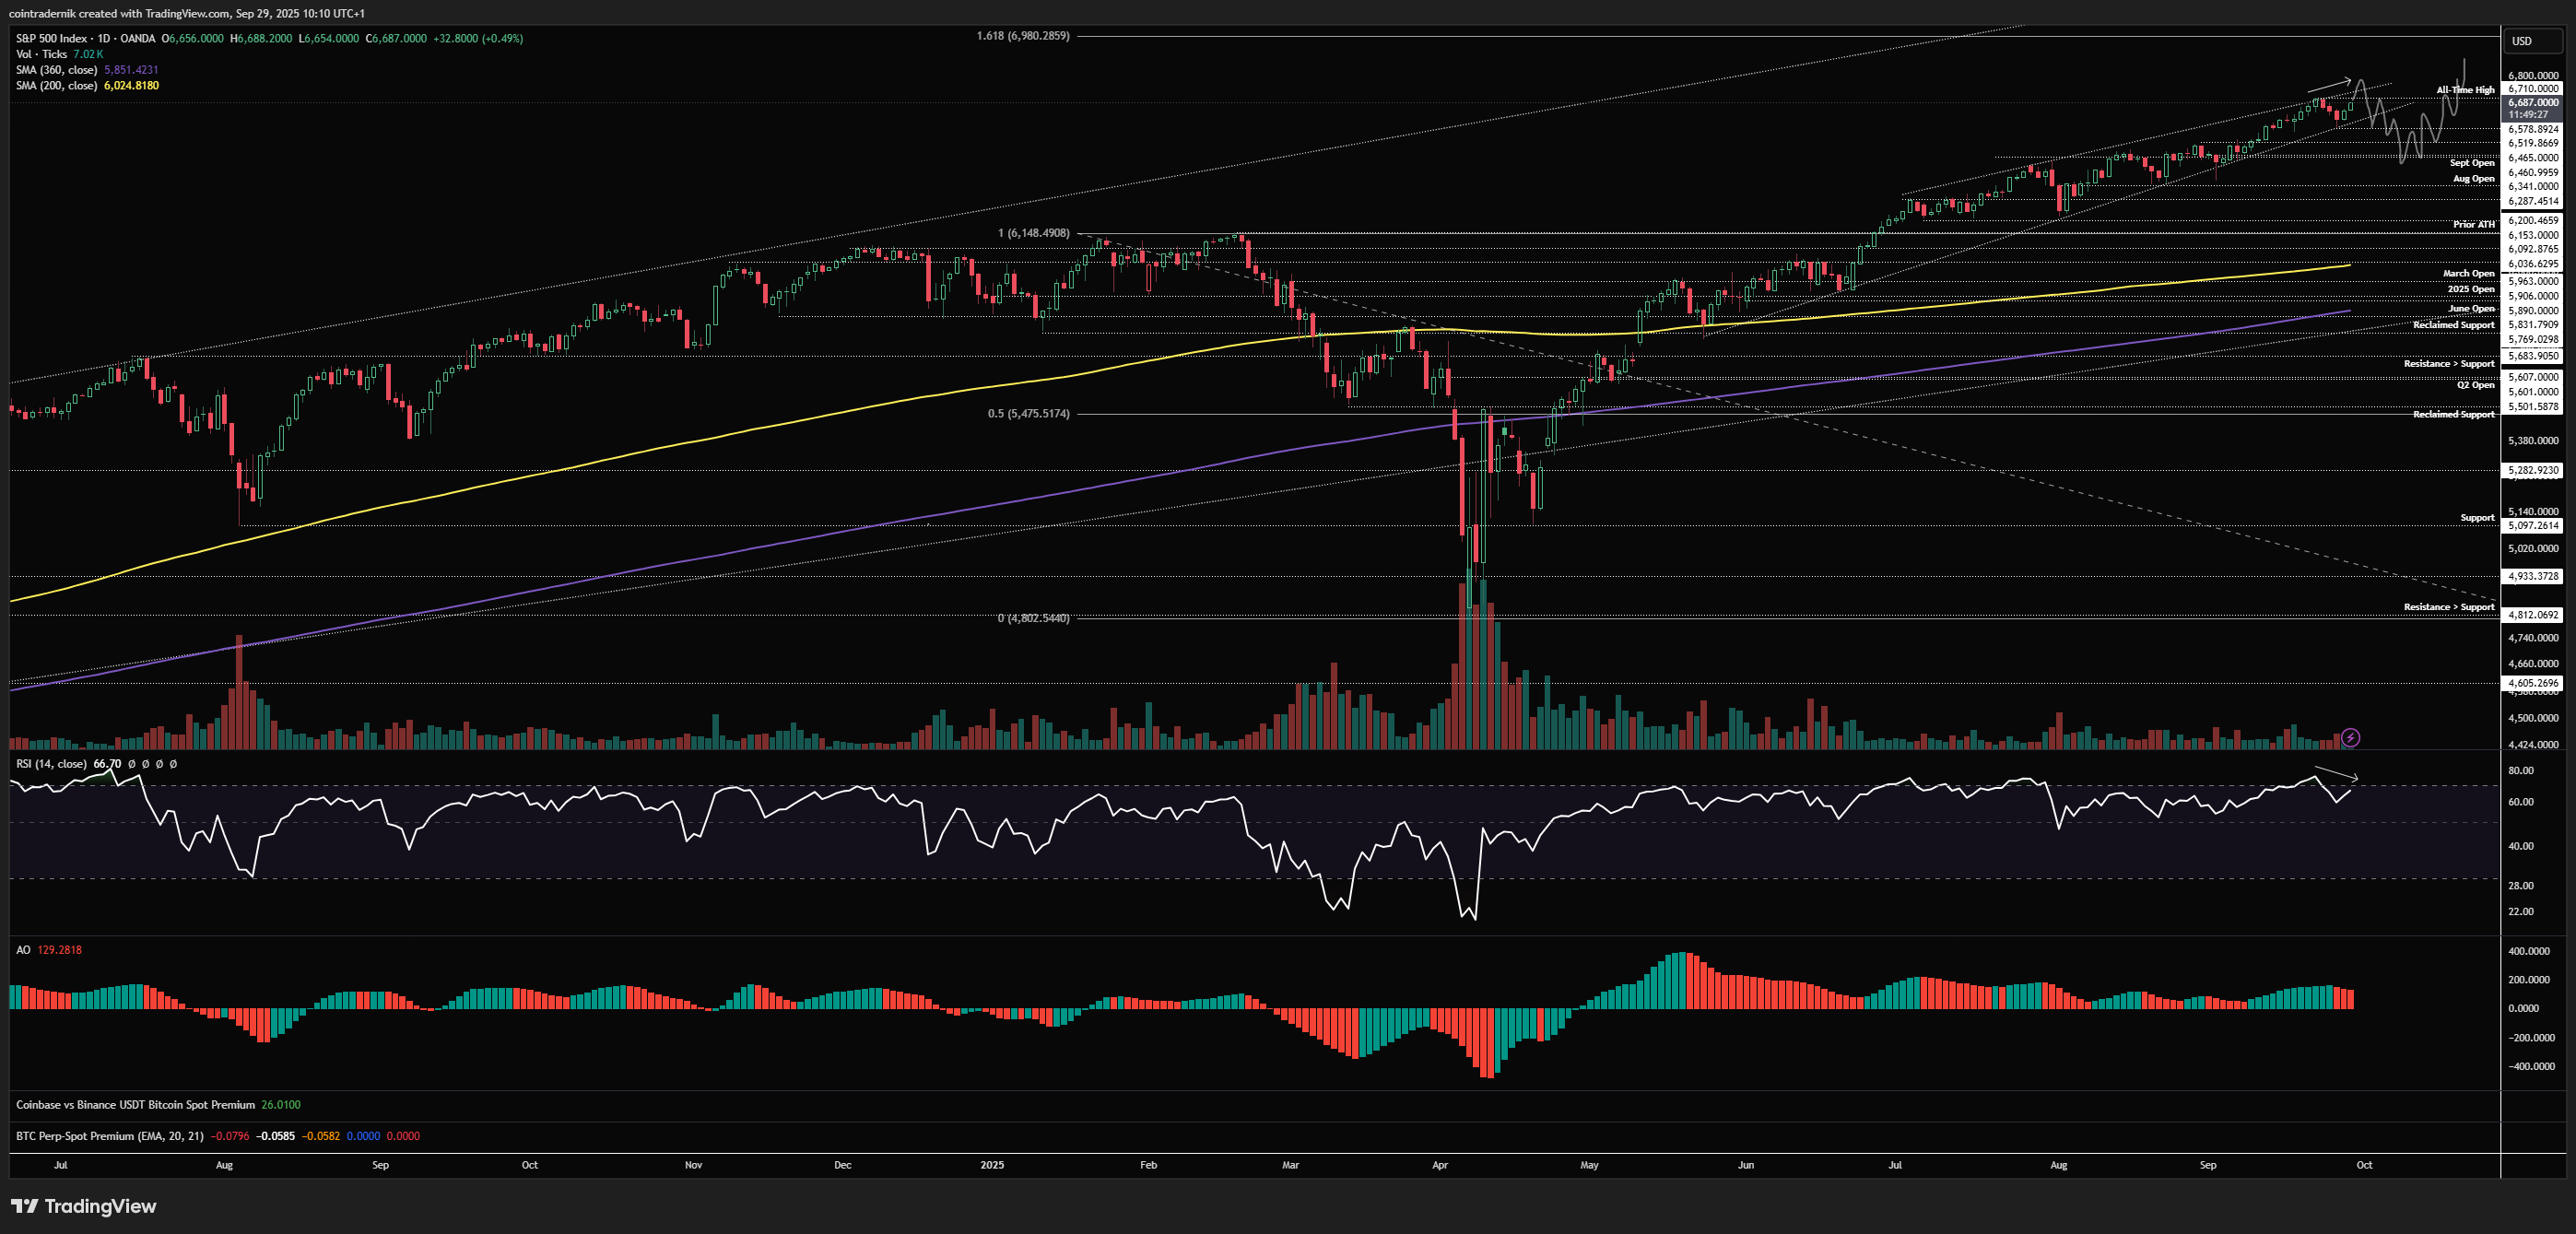
Looking at the daily, price pushed into trendline support as anticipated but has bounced harder than anticipated so far, opening up the opportunity for some bearish divergence right into all-time highs here as October begins. If we confirm this and then break back below $6710, that would be a nice setup for a push towards at least $6520, taking out the Sept FOMC lows, with a possibility for a push lower into the Sept open at $6465. Anything below last week's low is an opportunity to be laddering in bids for Q4 strength in my opinion. If we close above $6710 and don't form momentum exhaustion, with momentum breaking fresh highs, this setup is invalidated and we likely just continue to have shallow 2% pullbacks as we push higher until we do form some valid momentum exhaustion.
I hope you've found some value in the read this week!
And if you've not already signed up for Ostium, please do so and test out some of the recent updates, including:
Sign up here (you don't have to use my ref link, of course): https://ostium.app/trade?from=CL&to=USD&ref=CTNIK

.avif)