

Market Outlook #82
May 5, 2026
-
12
min read


This blog references an opinion and is for entertainment and informational purposes only. It is not intended to be investment advice. Seek a duly licensed professional for investment advice.
In this 82nd edition of the Market Outlook here at Ostium Insights, we'll be taking a look at the week ahead in markets, looking at price-action, positioning and event risk for NDX, Brent Crude, USDJPY, Copper and Bitcoin. These are all assets that my macro regime model is long for the duration of May.
Trade and earn double points this week on BTC, ETH, NDX, XAU and SOL at Ostium: https://ostium.app/trade?from=CL&to=USD&ref=CTNIK
Let's first take a look at the relatively busy week on the data front, with growth data today and payrolls closing out the week:
TUESDAY: ECB PRESIDENT LAGARDE SPEECH
TUESDAY: US S&P GLOBAL COMPOSITE PMI (APR): (CONSENSUS 52 VS PREVIOUS 52)
TUESDAY: US ISM SERVICES PMI (APR): (CONSENSUS 53.7 VS PREVIOUS 54)
TUESDAY: VARIOUS FED SPEECHES
WEDNESDAY: US ADP EMPLOYMENT CHANGE (APR): (CONSENSUS 99K VS PREVIOUS 62K)
WEDNESDAY: VARIOUS FED SPEECHES
THURSDAY: US INITIAL JOBLESS CLAIMS: (CONSENSUS 205K VS PREVIOUS 189K)
THURSDAY: VARIOUS FED SPEECHES
FRIDAY: US NONFARM PAYROLLS (APR): (CONSENSUS 60K VS PREVIOUS 178K)
Now, let's dig into asset-specific price-action for the week ahead, looking firstly at NDX:
Price: $27,824
Weekly:

If we begin by looking at NDX on the weekly timeframe, following my last Outlook a couple of weeks ago we have continued higher, finding support above prior all-time highs and pushing right into the confluence of fib resistance levels I had marked out at ~$27,850, where price is sat at present. This has been an historic 5-week reversal off the March 30th lows, and we are now sat right around 2 standard deviations from the 365d rolling VWAP. Acceptance above this $27,850 area this week would open up a local blow-off top, in my view, towards ~$29,000, where channel resistance and the 3 std dev band are sat. Whilst I say 'local blow off', I do not mean a multi-month top, but merely the peak of this multi-week run, from which we are more likely to see profit-taking, a small pullback and some consolidation. If we reject here instead of accept above the level, I would expect to see price sweep last week's low and return towards that $26.3k prior all-time high over subsequent weeks, marking out a higher-low before continuing higher. There are zero signs of exhaustion on the higher timeframes and those expect another major (15%+) drawdown from here near-term are, in my opinion, likely to be left sidelined.
Daily:

Turning now to the daily, we can see that price continues to grind higher, but, most interestingly, is not forming bearish trend exhaustion as the rally extends. Once we closed the daily above prior all-time highs, price has not looked back and instead has ripped, consolidated and then ripped again for a couple of weeks. We are now pressing right up into that confluence of fibs but acceptance above here will make it much more probable that we just continue to leg higher for the coming weeks. As mentioned, there is no weekly or daily momentum exhaustion, so anyone who continues to attempt to short this should await either a structural breakdown (lower-high and lower-low) or await some divergences to form and price to push lower from there. If we do reject here, I would actually prefer to look for perp longs at the 30d rolling VWAP near prior all-time highs rather than look for shorts, to be honest, because I don't really see much weakness here at present from a price-action POV. FWIW, my macro regime model is remaining long NDX in May.
Price: $112.85
Weekly:
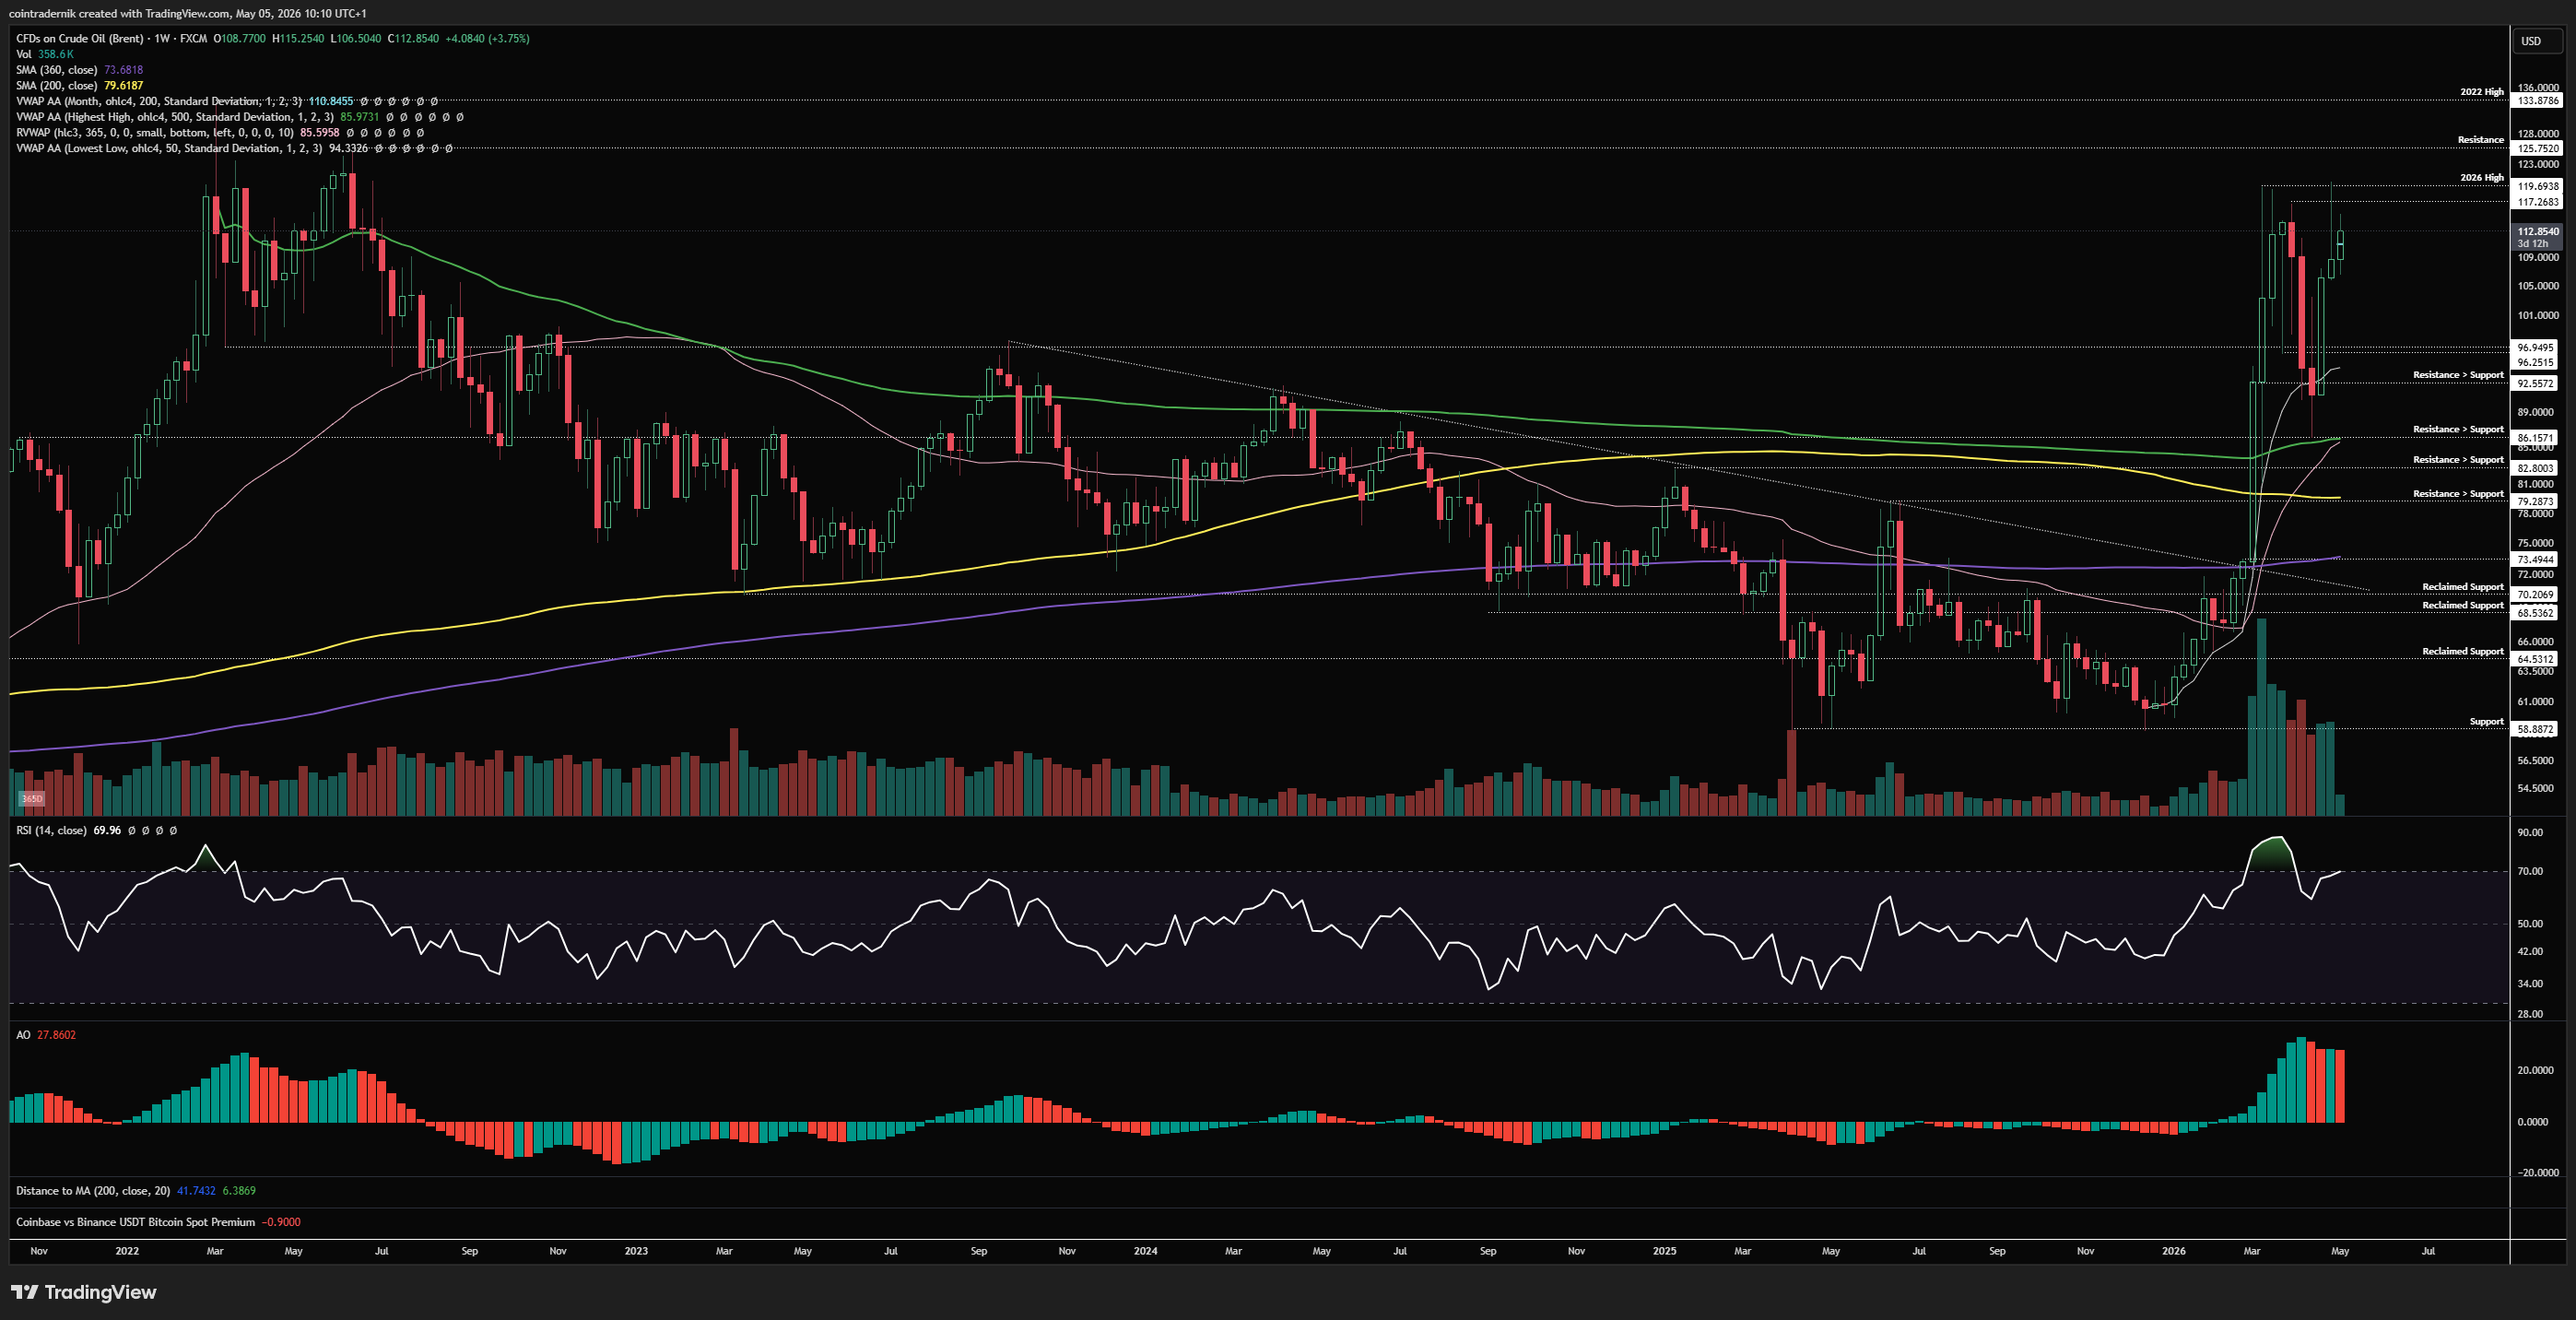
Beginning with the weekly view for Brent Crude, we can see that price bounced hard off that anchored VWAP from the 2022 highs, marking a low at $86 and bouncing to close back above the anchored VWAP from the yearly lows immediately. Price continued to rip from there back above resistance at $97, pushing firmly back towards the upper quintile of the range. We are now sat below yearly resistance between $117-$119, with last week rejecting at the yearly highs. I continue to personally expect that we remain range-bound near-term rather than see a sustained breakout beyond $120, but fwiw my macro regime model is long Brent Crude in May, so we shall see whether we get that long-awaited breakout or not. If we do see a weekly close above $120, there are a couple of things to pay attention to: weekly bearish divergence into historical resistance above that at $125; or continued momentum that takes us through the 2022 highs at $133.88. In the former case, we would see price close above $120, form a lower-high on weekly RSI, then await validation of this with a weekly close back below $119 (and some sort of lower timeframe breakdown) before looking for high-probability shorts. In the latter scenario, it's tough to be looking for longs up here from a discretionary POV because of where you'd be looking at your invalidation to come in, which is technically much lower and therefore compresses your R/R on this timeframe. From a systematic POV, long Brent is just one small portion of May's positioning for my regime models.
Daily:
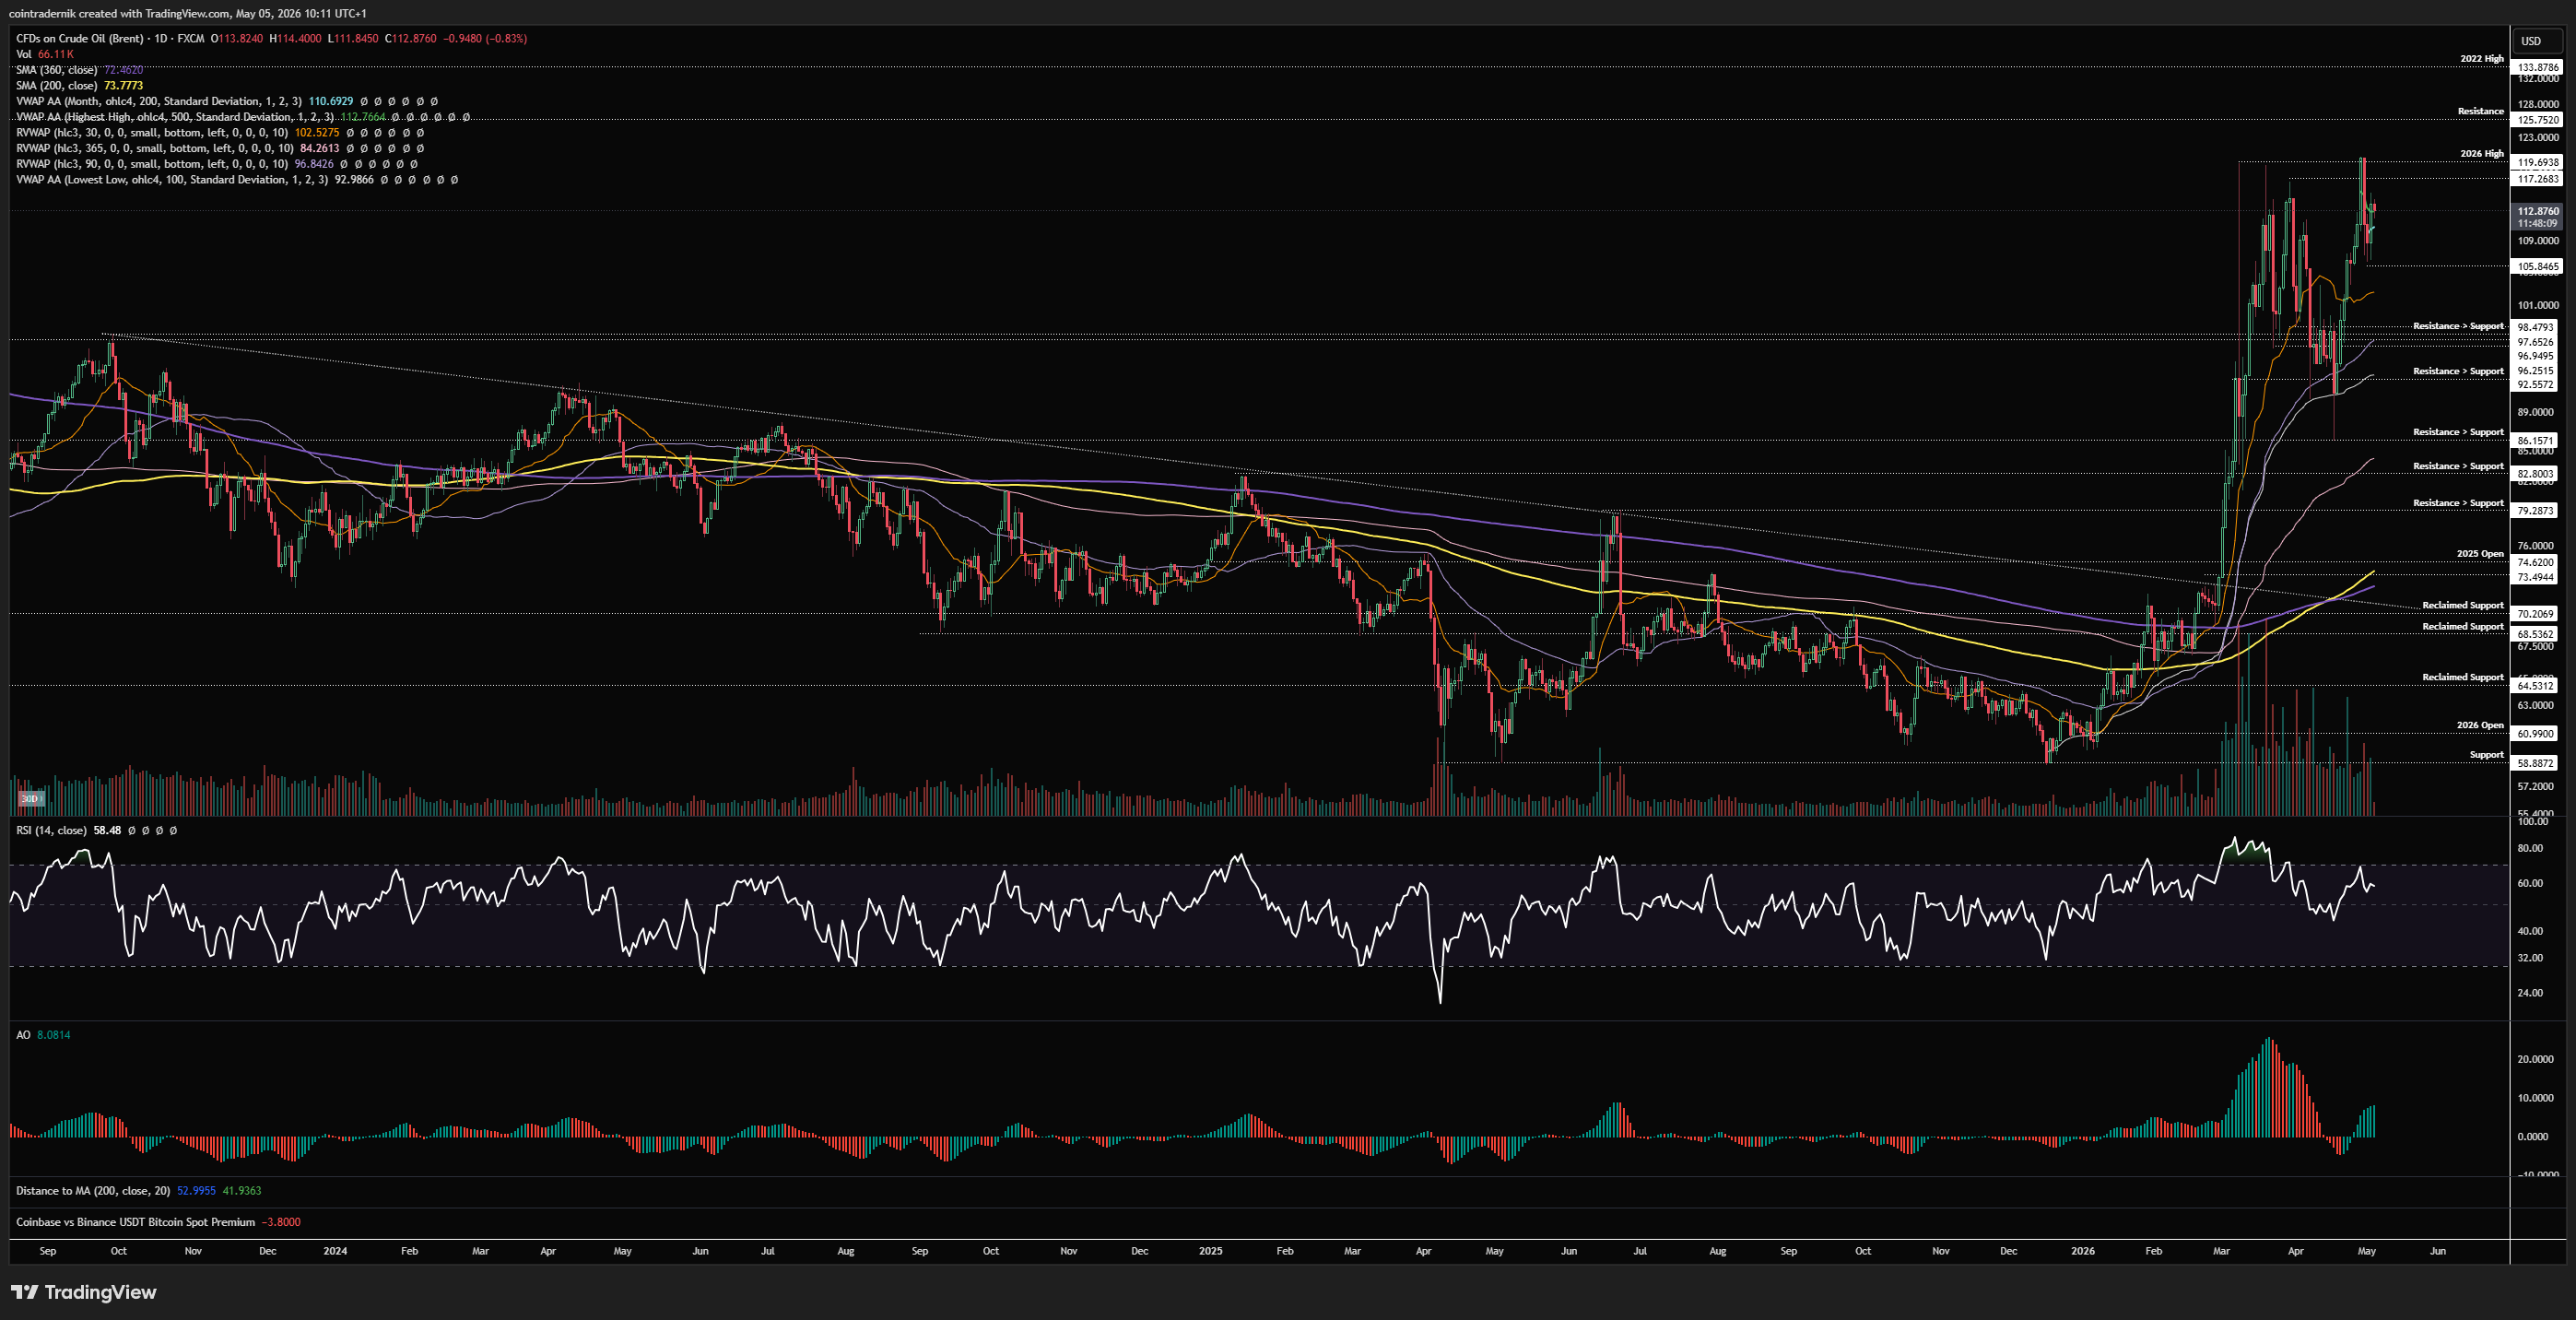
Turning now to the daily, we can see that we did close the daily above the 2026 highs, marginally, before rejecting the very next day and trapping breakout longs in a nasty way, but price has since formed a higher-low. We remain below that overhead resistance between $117-$120, and should this area hold as a lower-high this week and price break and close back below $105, I would expect to see continuation through towards the 90d rolling VWAP and major support cluster at $96-$98 again. If, instead, price holds this higher-low and close above $120, I would expect to see $125 tagged pretty swiftly, with only the 2022 high above that. As mentioned above, it is really hard to pick an isolated long setup up here because you've got $5 of upside into the next level of resistance but your stops have to be so wide, particularly with headline risk. I think long energy stocks or commodities more broadly as part of an inflationary regime seems higher R/R here.
Price: 157.48
Weekly:

Beginning with the weekly, we can see that price wicked above the yearly highs last week, sweeping multiple untapped highs from the choppy consolidation range of the past month, before rejecting on intervention headlines, breaking back below the 30d and 90d rolling VWAP and tagging 155.8, before bouncing to close closer to 156.8, right around the yearly open. Early price-action this week has seen last week's low hold as support and price push higher from 155.8, now rallying back through the yearly open and the 2025 open, into the 90d rolling VWAP as support turned resistance. My regime model is long a small position in USD/JPY and I would say the technicals back that up, given we remain in a strong uptrend with higher-lows respected and above the anchored VWAP from the Apr 2025 tariff lows. If we are simply marking out another higher-low within that long-term uptrend here, we should continue to see that trendline respected and the pair hold above 50 on weekly RSI, leading to continuation back into major resistance at 159. That's where I think the most risk lies in the continuation picture and where we could conceivably see the formation of a major lower-high now that multi-year resistance has been deviated and rejected. Longs down here; shorts up near 159; and longs back above 160.2.
Daily:

Now, dropping into the daily, we can see that price has turned daily structure bearish following the break and close below recent swing-lows, but obviously the higher timeframe structure remains bullish as outlined above. The 200dMA is also sat right around that year-long trendline below, and I would expect downside to be capped around that 154.5 area short-term, where the higher R/R longs would be found. For now, if you're looking for a long entry, I think an intraday dip back into yearly open could be a good bid with invalidation below last week's low and TP1 at the 30d rolling VWAP, where I think we would have to start looking for signs of local exhaustion to flip short. In my view, being short down here is extremely poor R/R even if the higher timeframe trend does end up turning, and we should have an opportunity to play that from several hundred pips higher if so.
Quick one: if you're enjoying the read and want to make the most of the setups shared, you can earn double points all this week on BTC, ETH, NDX, XAU and SOL at Ostium: https://ostium.app/trade?from=CL&to=USD&ref=CTNIK
Receive the latest updates directly to your inbox

Price: $5.98
Weekly:

Turning to another asset that my regime model is very keen on for May, if we look at the weekly timeframe for Copper, we can see that where the anchored VWAP from all-time highs had previously acted as resistance, price is now flipping it into support here right around the 2025 highs, having closed well above it several weeks ago. This looks like a textbook breakout and retest above key levels for me, from which we can expect acceptance above $6.20 resistance - at long last. If we do close above that area over the next week or two, I think we rip higher towards the yearly highs and beyond. Given the weekly structure, momentum and macro backdrop here, it is difficult to see a mid-term bearish case for Copper. The price-action invalidation of a bullish view would be a wick above $6.20 and a massive rejection and close back below the yearly open at $5.75, which would be weak and suggestive of lower. That said, until we are flipping that 365d rolling VWAP and trendline support into resistance below $5.40, the structure here will remain bullish. Long and strong.
Daily:
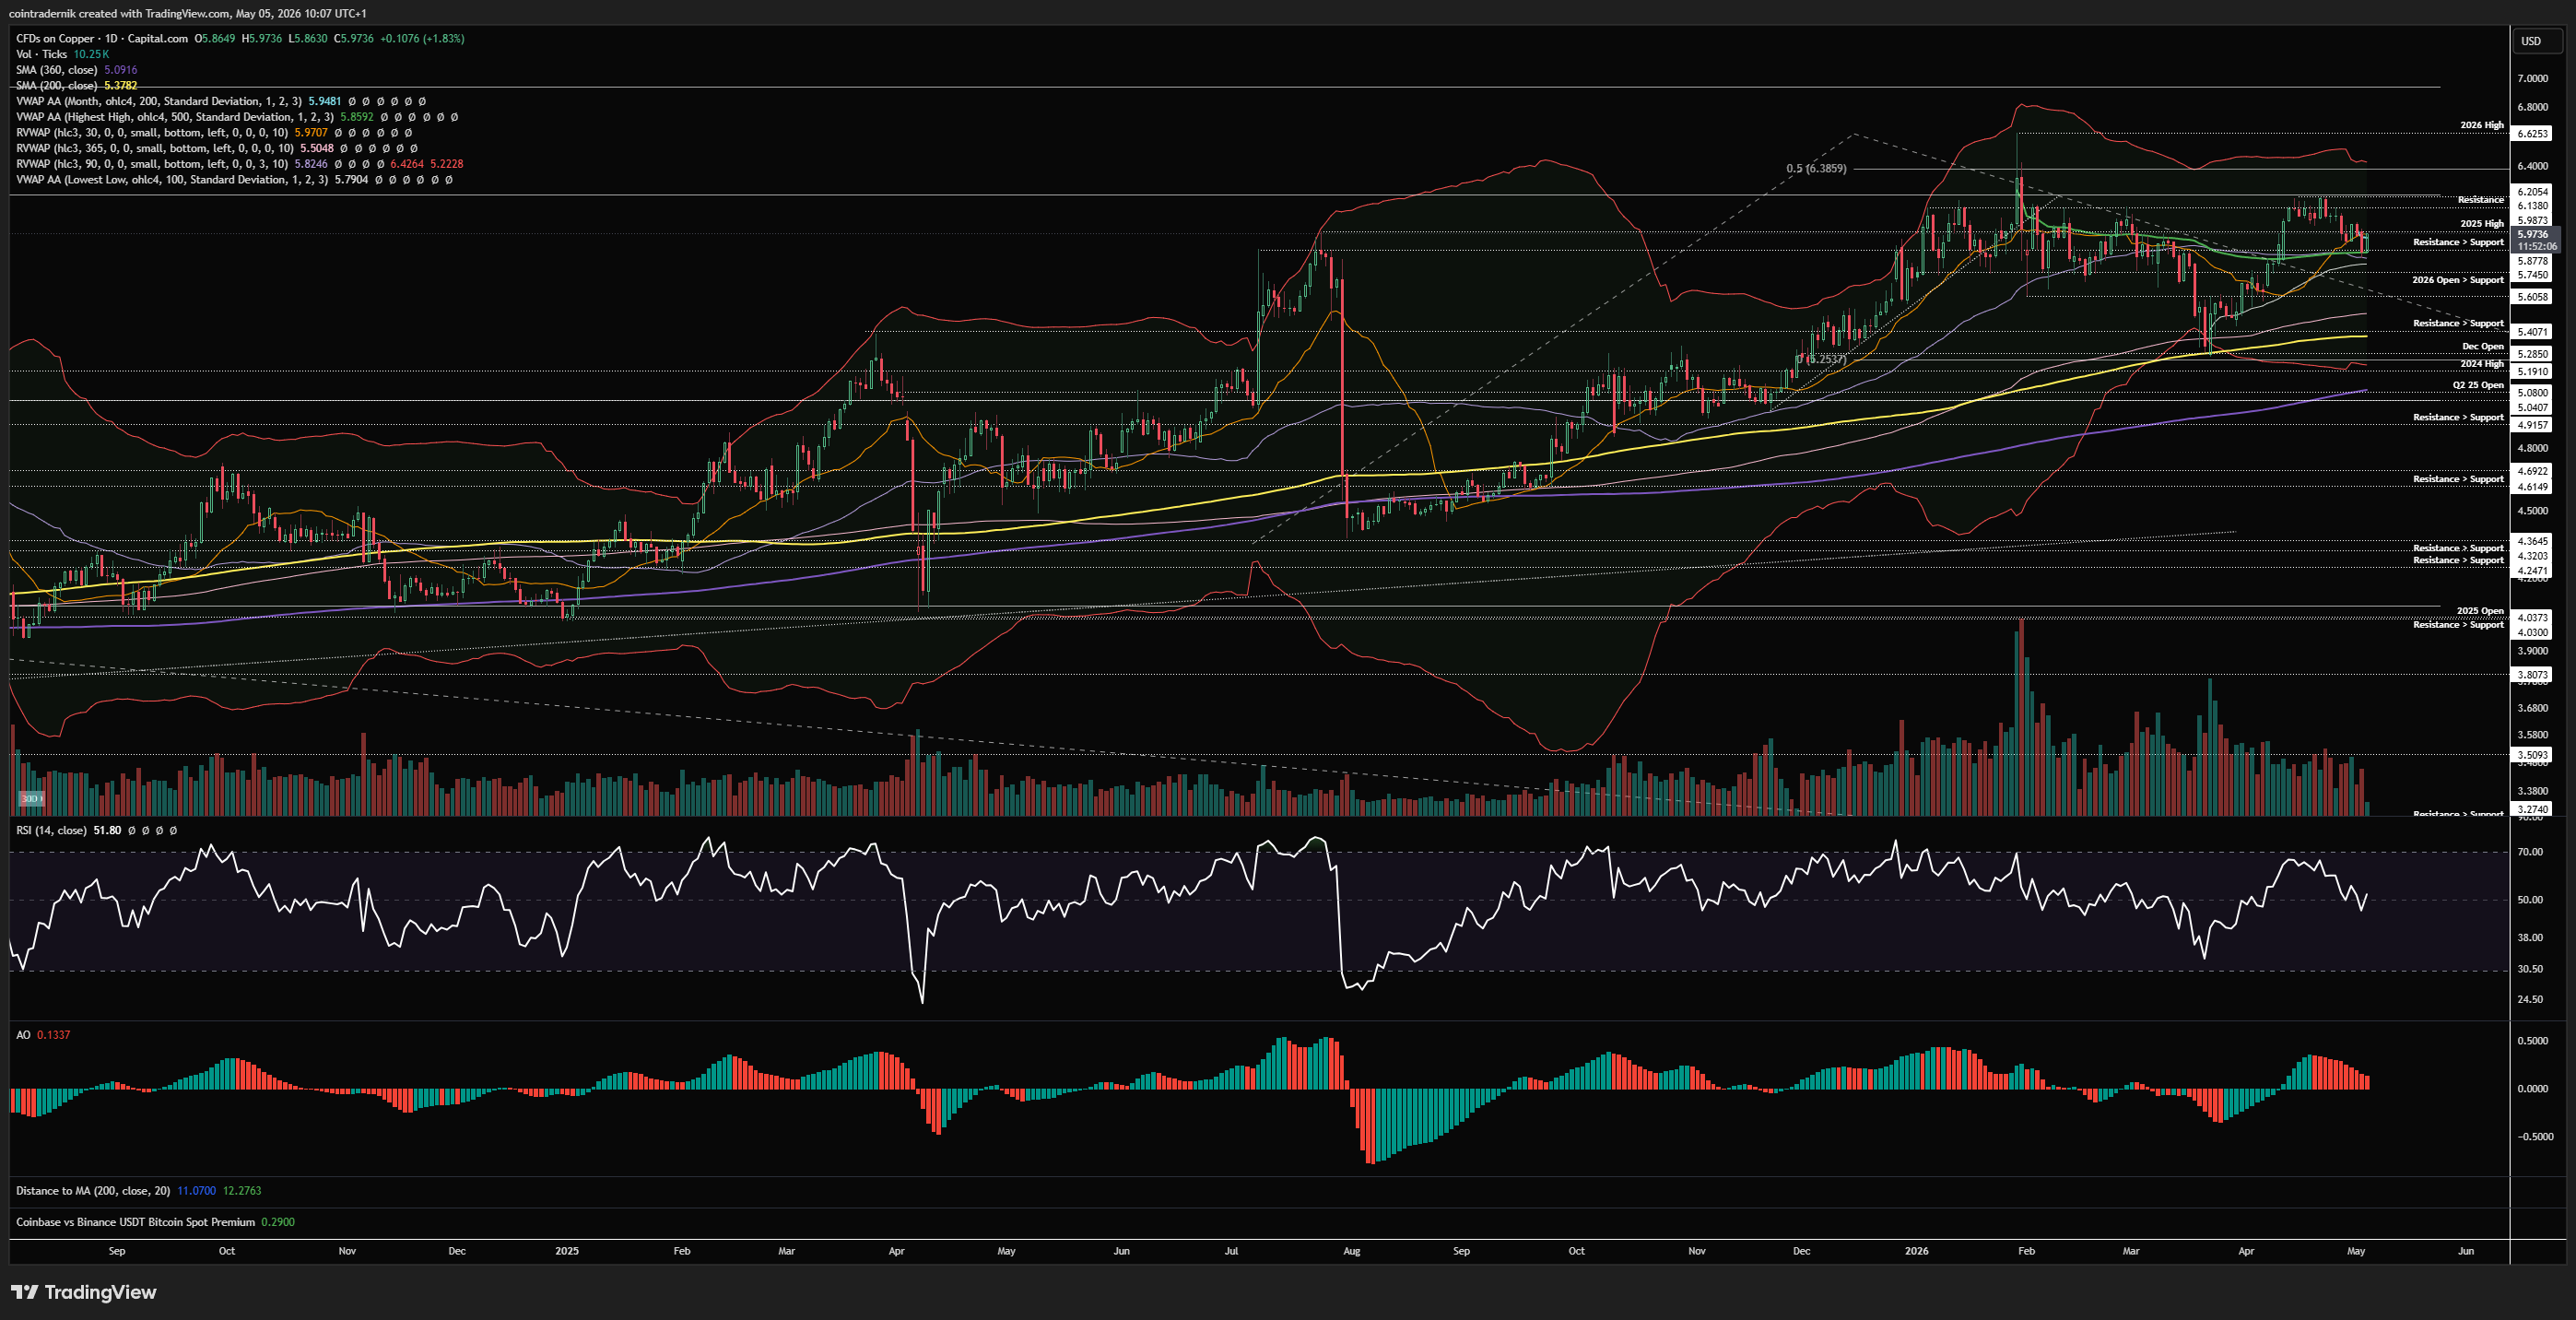
Turning now to the daily, we can see how price is sat right at that 50 print on daily RSI after resetting from recent consolidation, with price holding support above the anchored VWAP from the March lows and that anchored VWAP from the all-time highs as confluence. We want to see a swing-low form here into next week and a strong move higher off this support through $6.20 resistance, where the $6.40 area becomes the next and final minor resistance before new highs, right at the 3 std dev upper band of the 90d rolling VWAP. If we flip this local area into resistance below $5.75, I will cut my discretionary longs but obviously allow my systematic macro model to do its thing. It seems to be very keen on Copper into June...
Price: $80,667
Weekly:

If we begin by looking at BTC/USD on the weekly, we can see that price closed the weekly above trendline resistance from all-time highs, retested it as support last week and has bounced early this week, pushing off the weekly open near $78.5k through some minor resistance at $80.5k towards the big boss - the anchored VWAP from all-time highs. Every prior bear market has been over once we have closed a week above the anchored VWAP from the all-time high - and I do not expect this time to be different. However, this is precisely where I expect sellers to step in, between $83k-$84k on the first test, and price to move lower from there to form a higher-low above the $70k area. In my view, until we flip $70k back into resistance, I am treating this very much as the low is in at $60k. So, the paths ahead assuming we do not flip $70k back into resistance are as follows: a higher-low above that area over the next couple of weeks, followed by continuation higher above $84k towards the 365d rolling VWAP at $92.5k, which will almost certainly see some resistance and consolidation; or price overshoots entirely this anchored VWAP on the first test and pushes immediately towards $92k in May, then looking to form a higher-low in June above $83k. Let's see how this next couple of weeks plays out.
Daily:

Finally, dropping into the daily, we can see that momentum remains bullish with zero signs of exhaustion as of yet, though this could of course become apparent as we push into that $83.7k confluence of resistance. Daily structure is firmly bullish with higher-highs and higher-lows, with the latter forming at prior resistance levels, and price holding above the 30d rolling VWAP and the anchored VWAP from the April lows. I do think if you were bearish at $65k but are getting bullish as we push towards $84k, you're doing it a little wrong, and if you are sidelined either await rejection at $84k and then look for the next pullback towards that 30d rolling VWAP to begin scaling in (and potentially look for shorts at $84k if we get the setup: momentum exhaustion + ltf breakdown); or wait for a weekly close above $84k and then buy the first pullback into that level with invalidation on consecutive weekly closes back below it, but with the TP then being new all-time highs, as long as that may take. Exciting times ahead for Bitcoin once we have cleared $84k, in my view.
I hope you've found some value in the read this week - please RT, share, engage etc. if so!
And if you've not already signed up for Ostium, please do so and test out some of the recent updates, including:
Sign up here (you don't have to use my ref link, of course): https://ostium.app/trade?from=CL&to=USD&ref=CTNIK

.avif)