

Market Outlook #77 - Forward Guidance
March 16, 2026
-
12
min read


This blog references an opinion and is for entertainment and informational purposes only. It is not intended to be investment advice. Seek a duly licensed professional for investment advice.
In this special Forward Guidance edition of the 77th Market Outlook here at Ostium Insights, we'll be taking a look at the week ahead in markets, looking at price-action, positioning and event risk for Gold, US Oil, SPX, NDX and EUR/USD.
Now, let's take a look at perhaps the most stacked calendar from a global central bank POV in a very long time, with no less than 7 interest rate decisions between now and Friday's close:
MONDAY: US NY EMPIRE STATE MANUFACTURING INDEX (MAR): (CONSENSUS 3.8 VS PREVIOUS 7.1)
MONDAY: US INDUSTRIAL PRODUCTION (MOM) (FEB): (CONSENSUS 0.2% VS PREVIOUS 0.7%)
TUESDAY: RBA INTEREST RATE DECISION: (CONSENSUS 4.1% VS PREVIOUS 3.85%)
WEDNESDAY: US PRODUCER PRICE INDEX EX FOOD AND ENERGY (YOY) (FEB): (CONSENSUS N/A VS PREVIOUS 3.6%)
WEDNESDAY: BOC INTEREST RATE DECISION: (CONSENSUS 2.25% VS PREVIOUS 2.25%)
WEDNESDAY: FED INTEREST RATE DECISION: (CONSENSUS 3.75% VS PREVIOUS 3.75%)
THURSDAY: BOJ INTEREST RATE DECISION: (CONSENSUS 0.75% VS PREVIOUS 0.75%)
THURSDAY: SNB INTEREST RATE DECISION: (CONSENSUS 0% VS PREVIOUS 0%)
THURSDAY: BOE INTEREST RATE DECISION: (CONSENSUS 3.75% VS PREVIOUS 3.75%)
THURSDAY: US INITIAL JOBLESS CLAIMS: (CONSENSUS 211K VS PREVIOUS 213K)
THURSDAY: US PHILLY FED MANUFACTURING SURVEY (MAR): (CONSENSUS 15 VS PREVIOUS 16.3)
THURSDAY: ECB INTEREST RATE DECISION: (CONSENSUS 2.15% VS PREVIOUS 2.15%)
Now, let's dig into asset-specific price-action for the week ahead, looking firstly at Gold:
Price: $5012
Weekly:
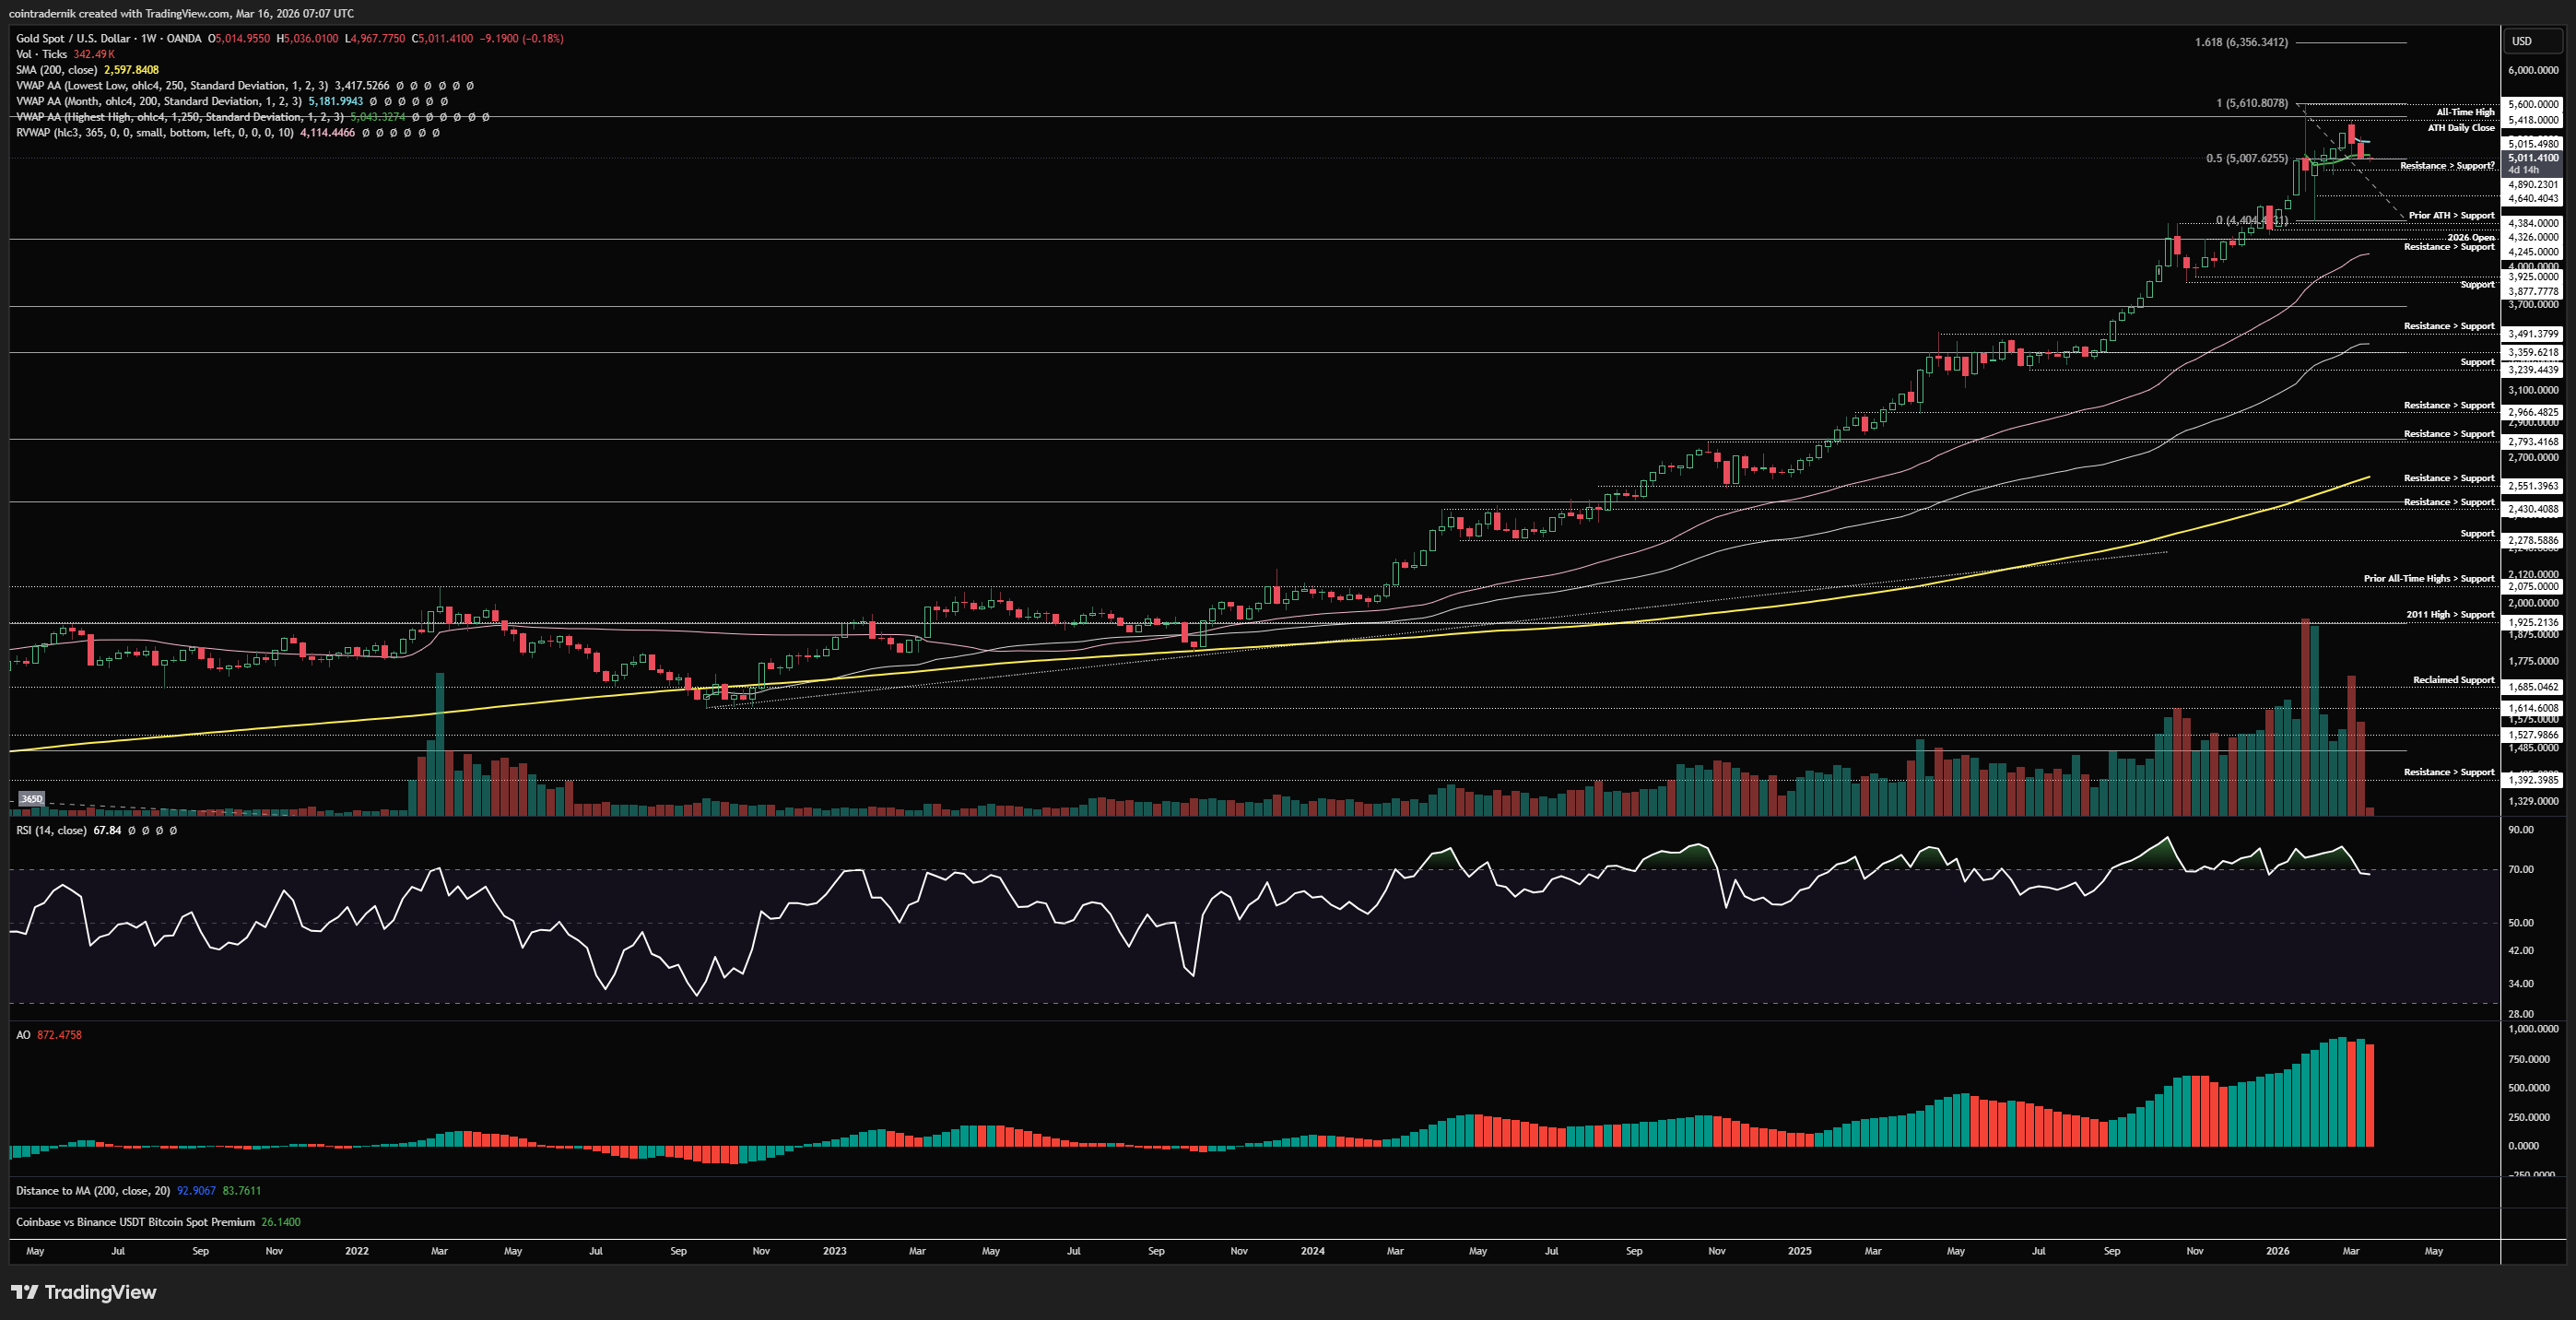
If we begin by looking at Gold on the weekly timeframe, we can see that last week saw continuation lower following its rejection at the ATH daily close of $5418 the prior week, with price rejecting at the monthly VWAP around $5200 early last week and pushing back into resistance turned support at $5000, around which it closed. Weekly momentum and structure are still bullish here, but a lower-high formation below that all-time high followed by a loss of this anchored VWAP from the ATH at ~$5000 is not looking particularly promising for short-term upside. Really, if you are of the view that Gold breaks out again here soon, you would need to see $5000 hold as resistance turned support and then break and lose back above last week's high. If we start flipping $5000 back into resistance this week, I'd look towards the lower timeframes for short entries back towards $4640 as TP1, followed by $4400 as TP2. Acceptance back above the March VWAP = $5420 gets taken out and above that it is very likely we take out the $5600 high.
Daily:
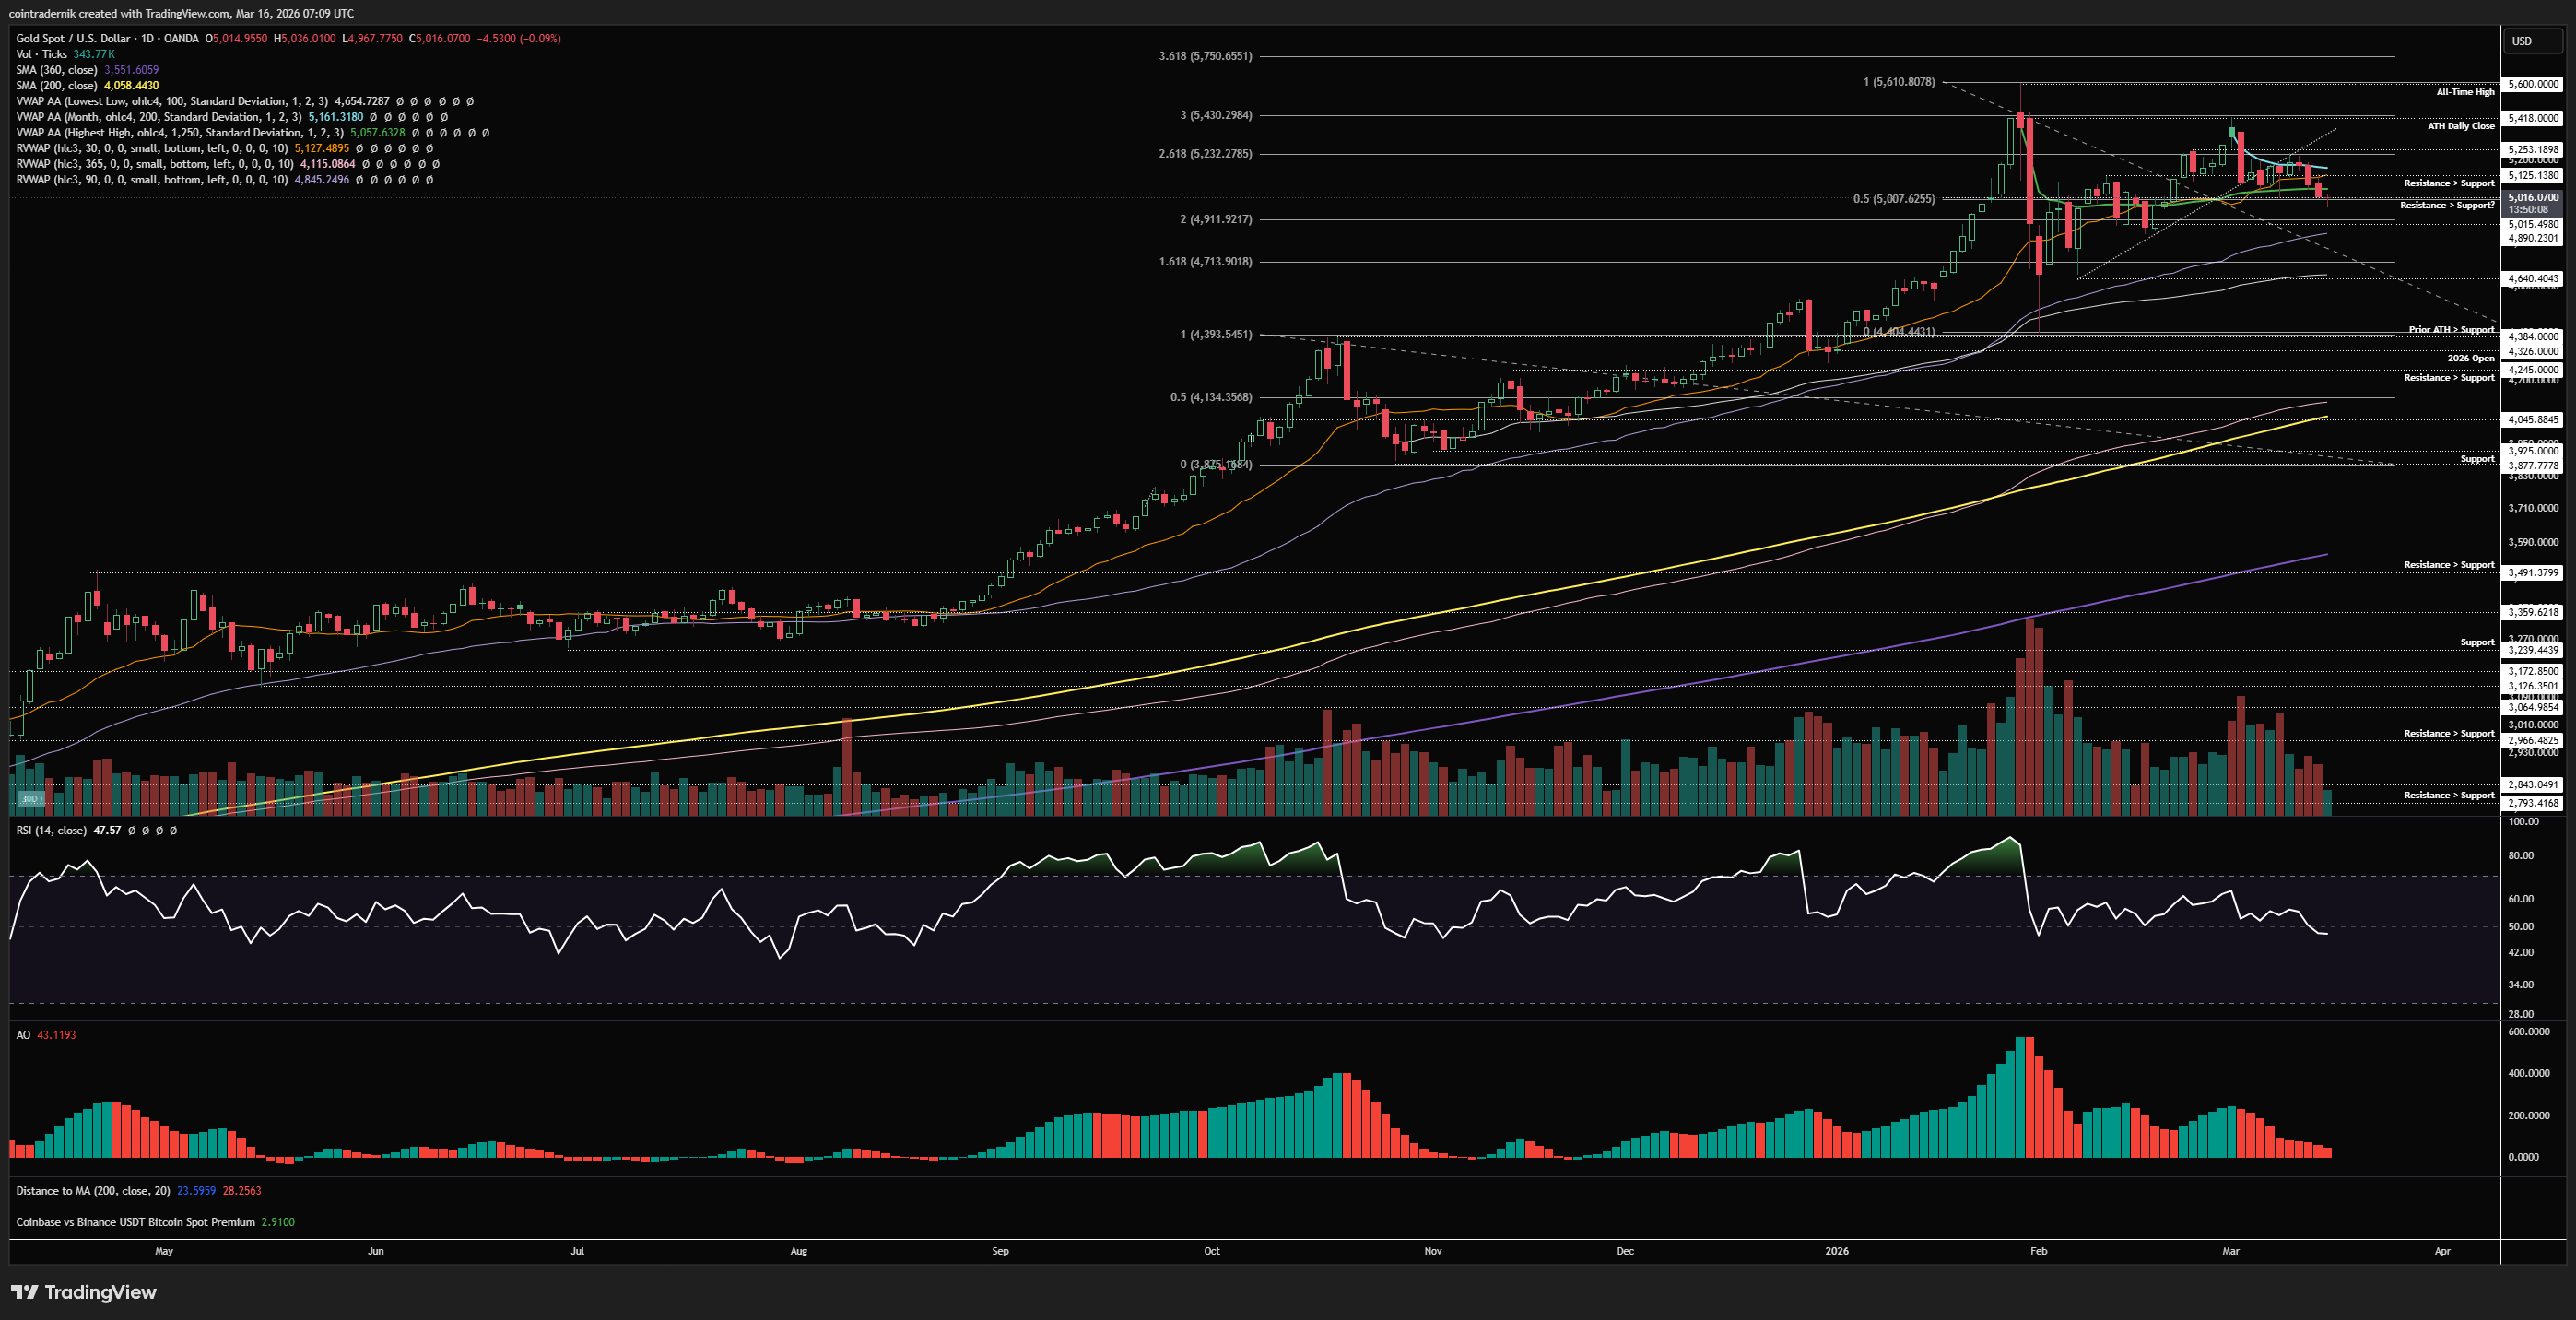
If we turn now to the daily, we can see that price has basically just moved from the bottom quintile of the capitulation range back into the top quintile, rejected at $5400and then returned to the mid-range, which is confluent with the anchored VWAP from all-time highs. We have broken local trendline support and put in another lower-high below the March VWAP, from which price is now breaking lower and is sat below that anchored VWAP and the 30d rolling VWAP. Really, this is where bulls need to show up and mark out a swing-low at the mid-range, where any break and close back above $5250 would open up high probability longs towards $5420 and beyond. If not, and we move lower here early this week, I would look to short $5000ish on a pullback into that level with invalidation above $5250 and $4640 as the first TP1, as outlined above. Depending on how price reacts around that level, if and when we get there, then that could be the next major swing-low formation; if not, it's going to sweep the capitulation low below $4400 and we will be range-bound for many more months to come.
Price: $99.26
Weekly:
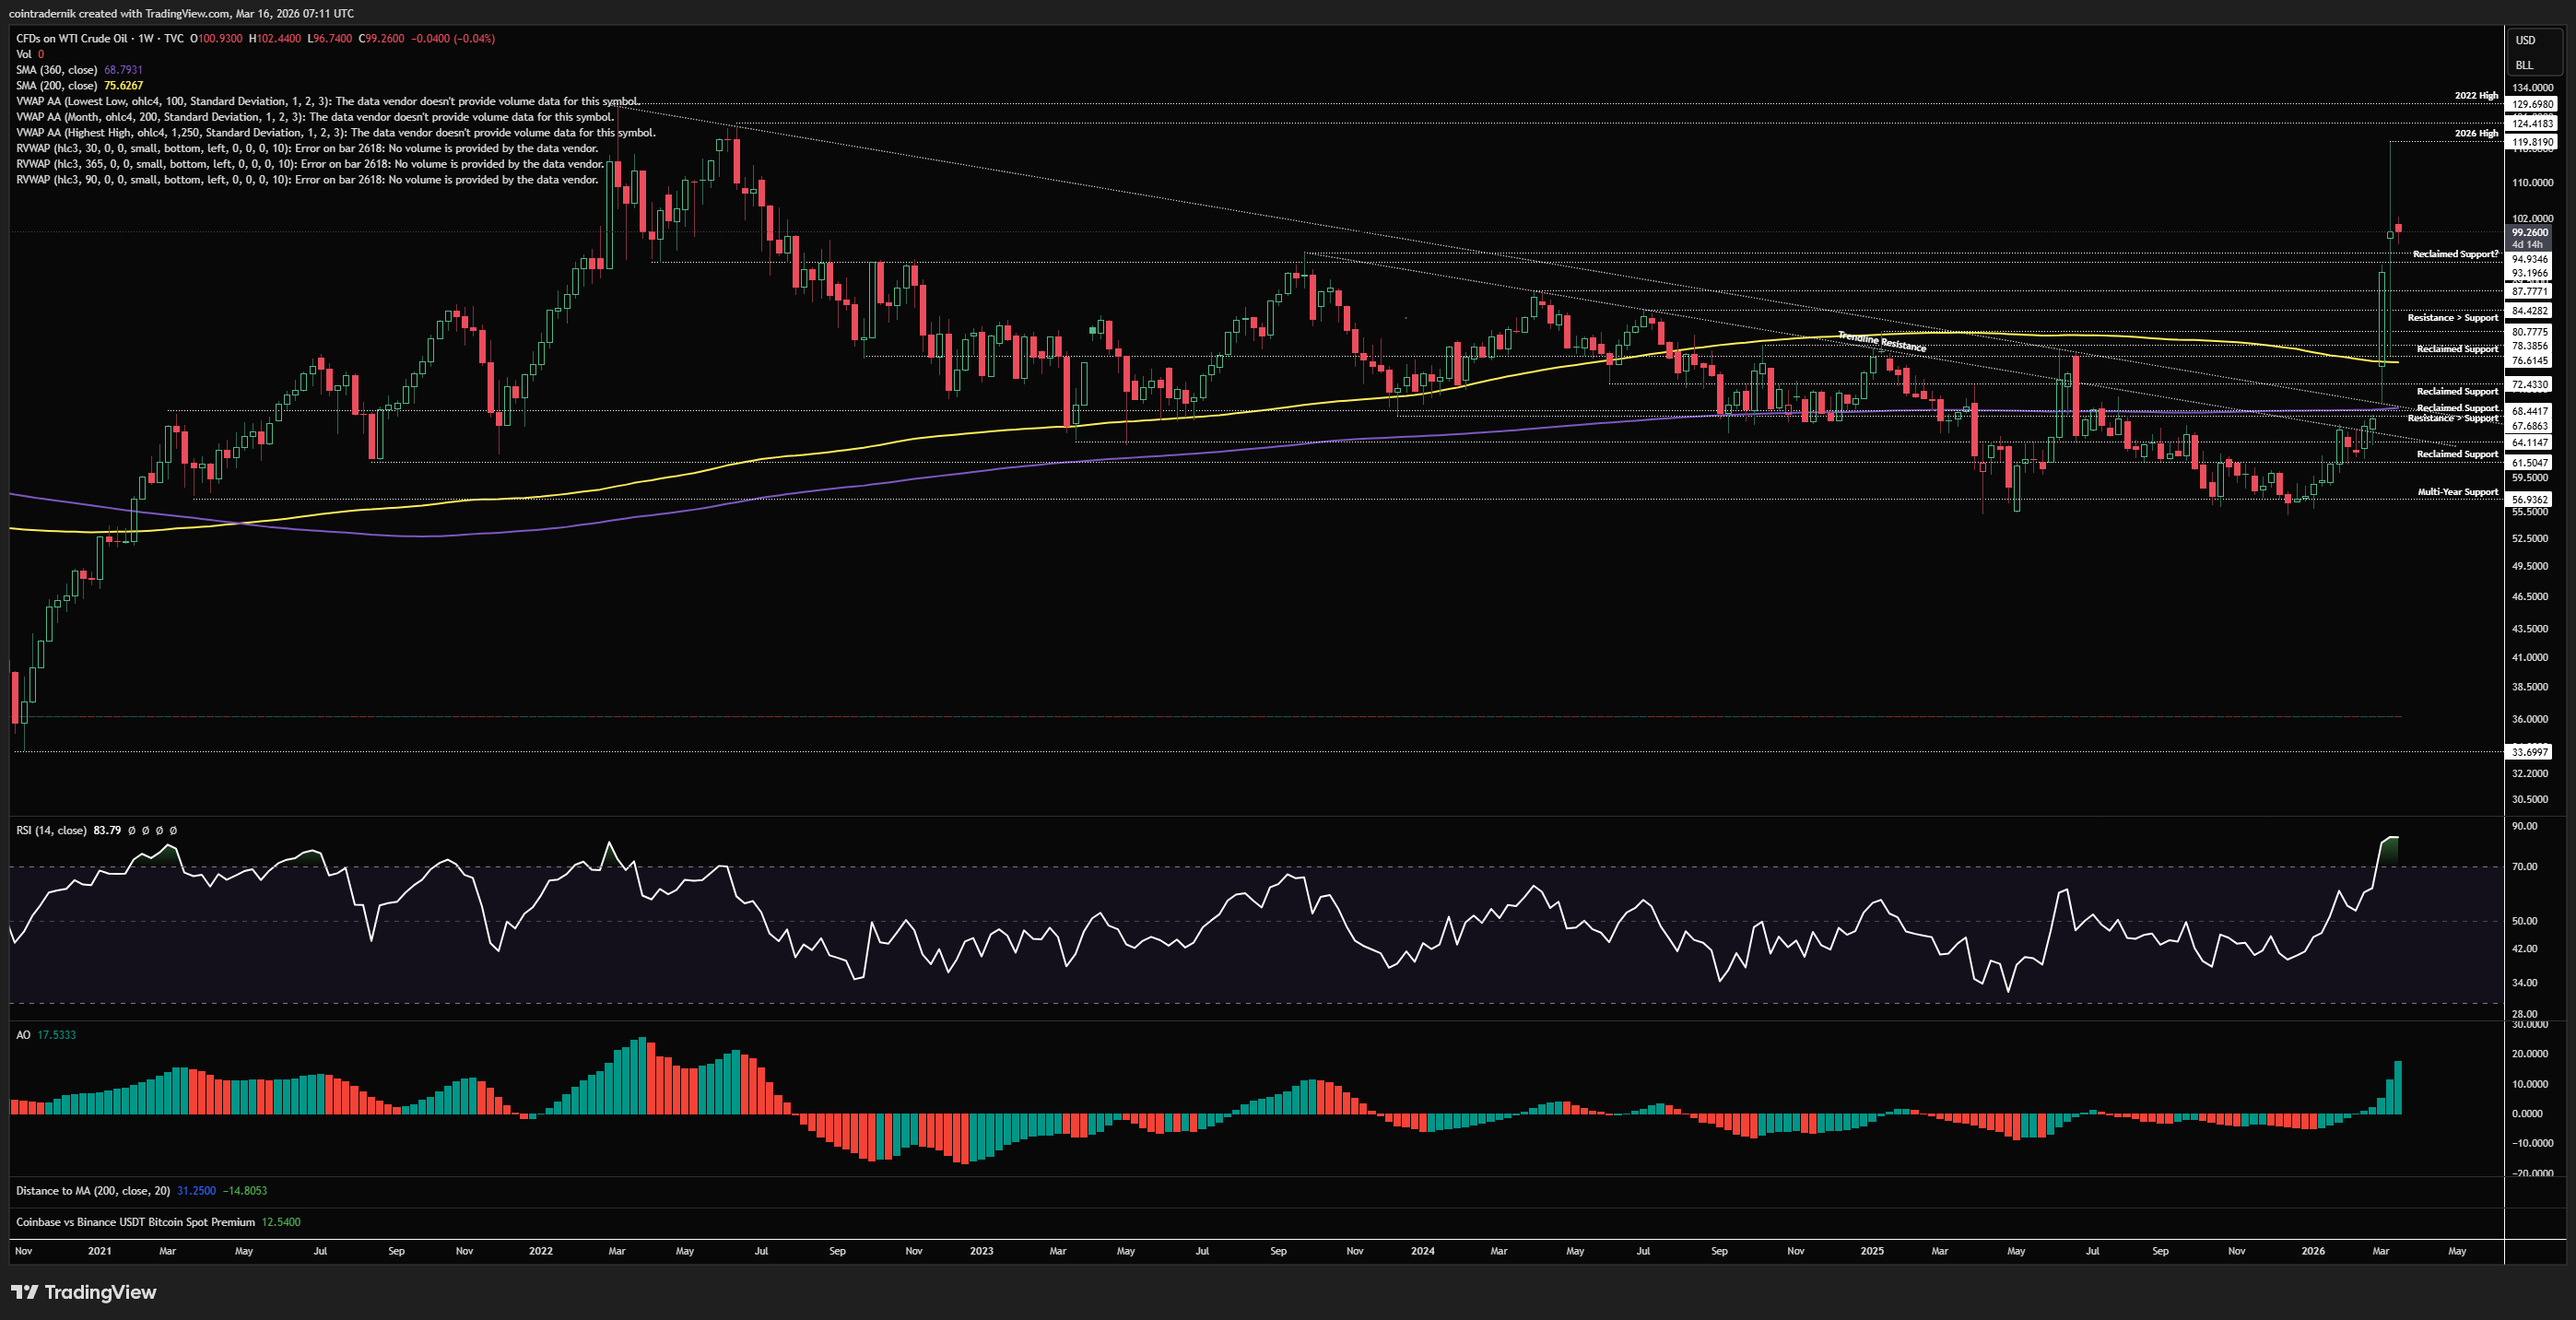
Beginning with the weekly timeframe for US Oil, we can see that last week continued on from the prior weekly volatility, pushing Oil vol to its highest level since Covid. Price opened at $98 above all major resistance levels below the 2022 highs, ran up into $120 and rejected hard, selling off back towards the 200wMA at $75, above which - in last week's Outlook - I highlighted the highest R/R setup for the week ahead: namely, to be long $77 expecting the weekly open at $98 to be retested. Well, we got almost precisely that, with no small amount of volatility in between, and price closed last week back above $95 and right around that $100 mark, where it has opened this week. As also mentioned last week, once we retested $98, I was looking for a pop above and then a rejection to begin looking for shorts back towards $77, as I expect we will remain trapped in this very large two-week range for a couple more weeks at least. This morning, we are above that $98 level but I would like to see a bit more of a spike higher into the $10x area and then a subsequent breakdown on the lower timeframes to look for that short trigger. A weekly close this week back below $95 would very much look like the local highs are in and a breakout beyond $130 in the near-term would seem unlikely. If instead we accept above $95 this week and close the week in the $100+ region, then I think we start to fill in that upper wick and retest the major resistance cluster at the 2022 highs.
Daily:
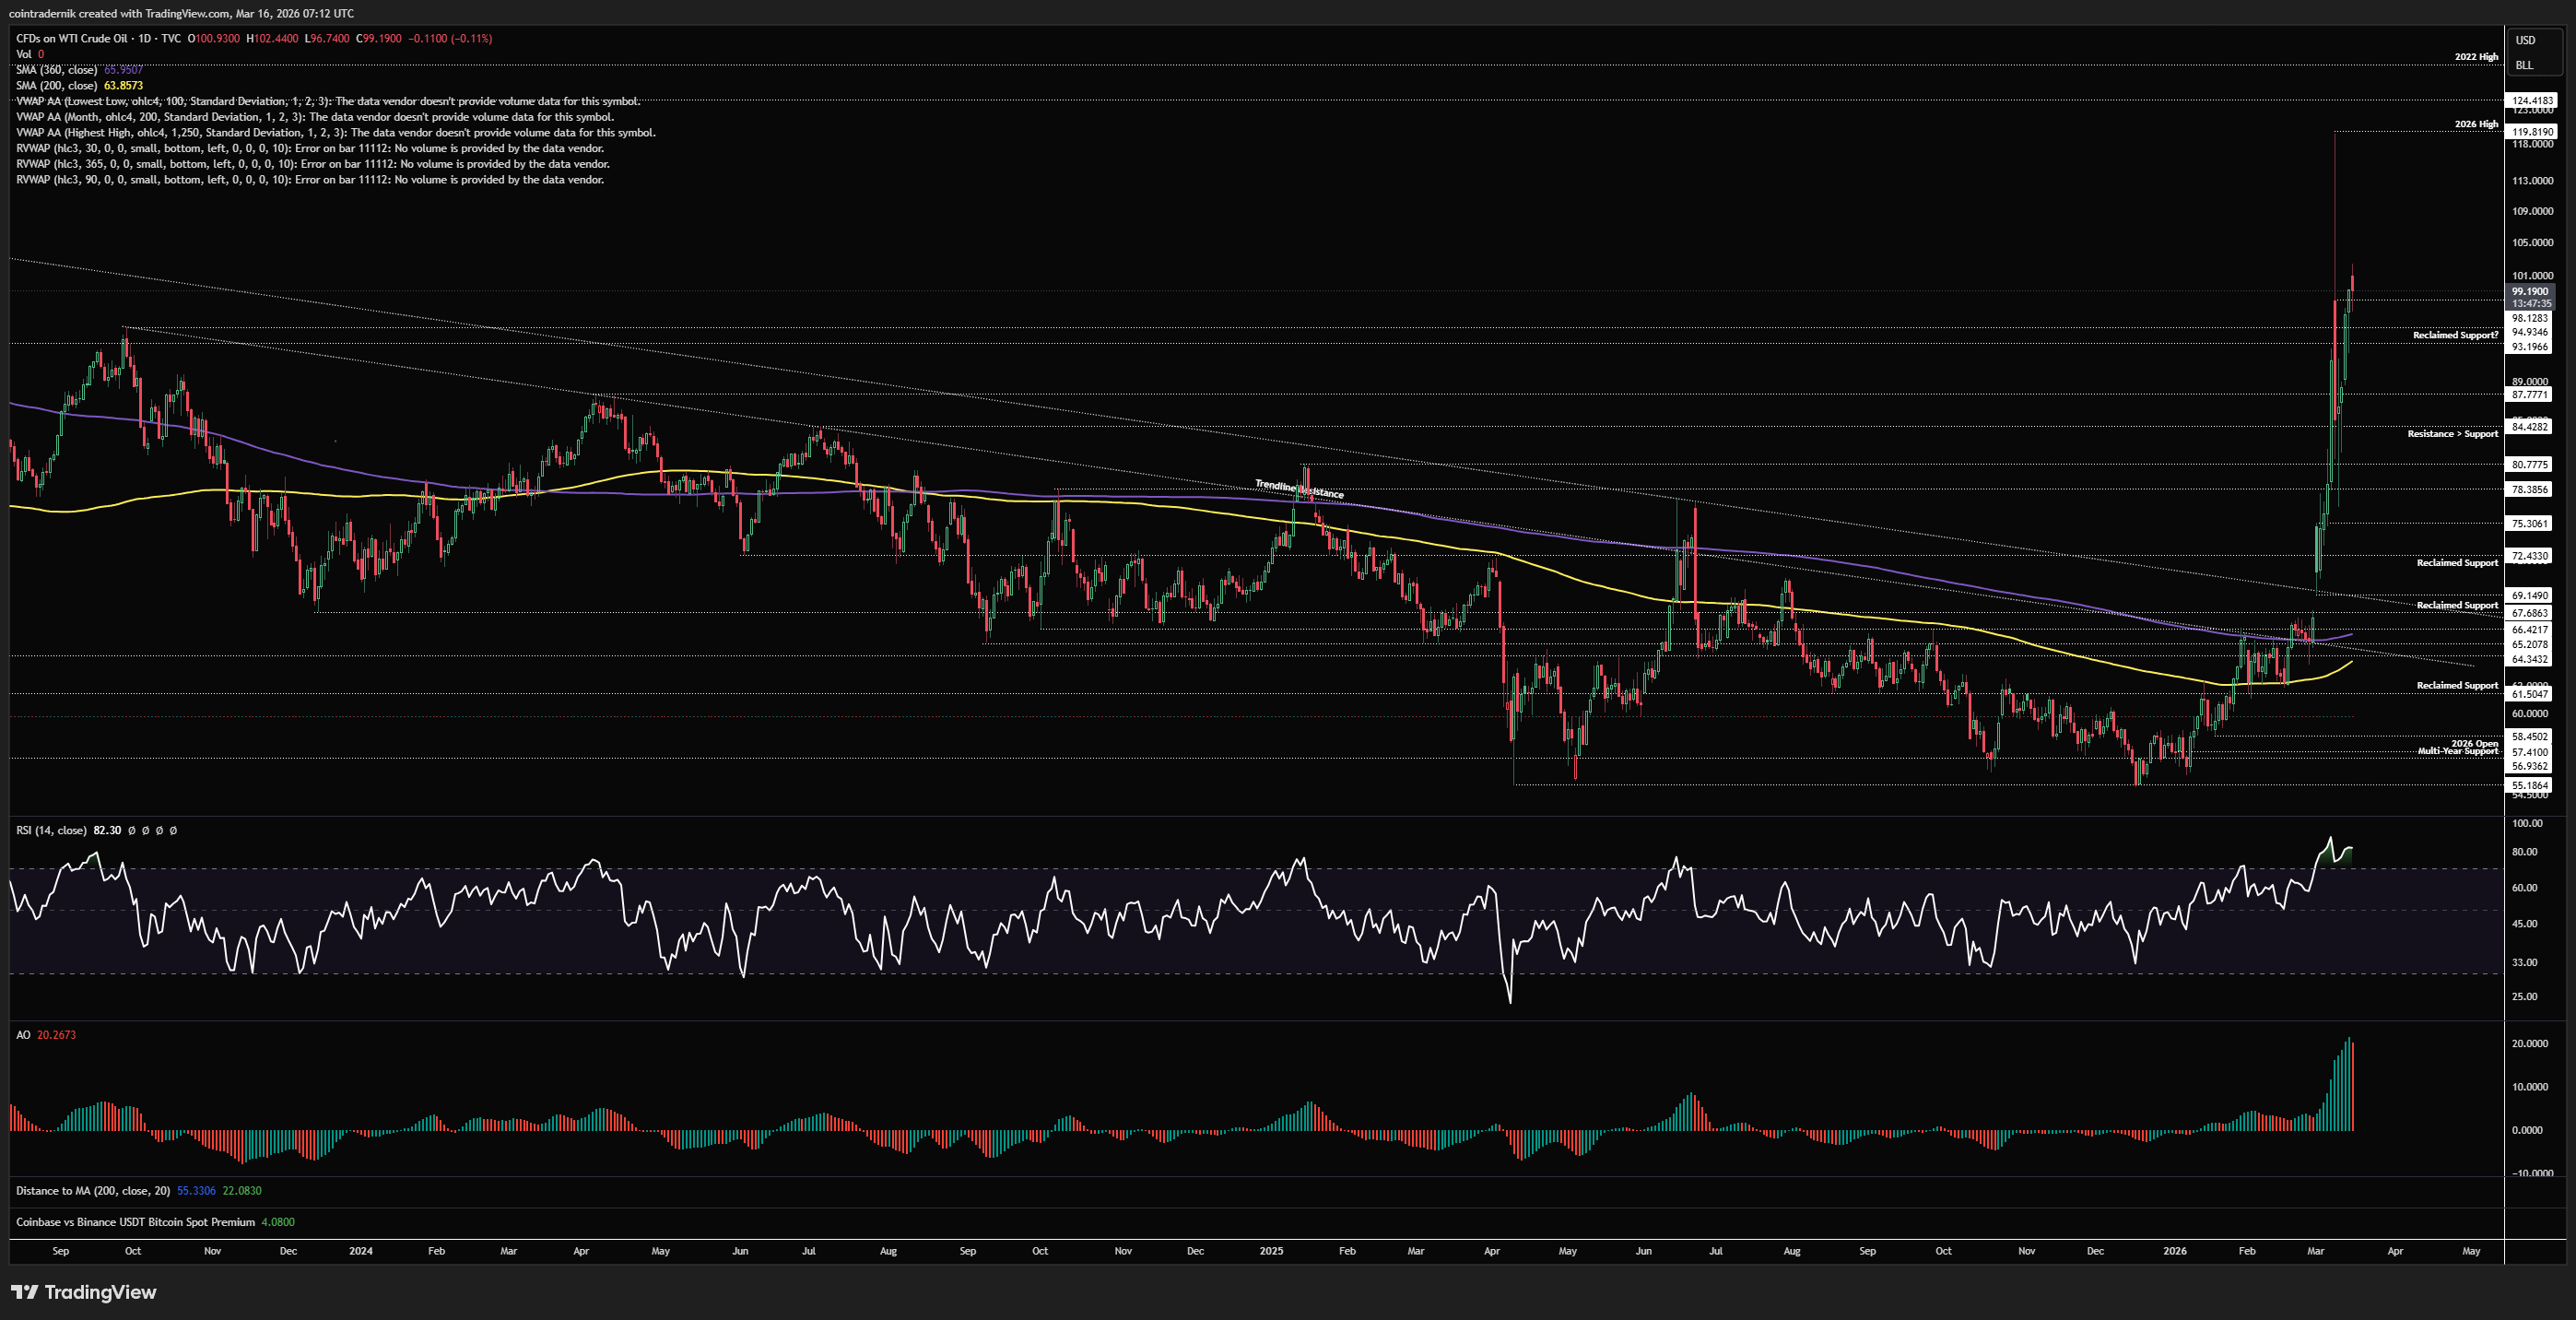
Dropping into the daily, we can see that price found support between $75-$78 as anticipated and v-reversed the weekly open sell-off into $93, where I covered the second half of my long last week. We then continued to squeeze up into the weekly close, with price now flipping $95 into support. We do have the early makings of some bearish divergence here alongside the historic Oil volatility, but that alone means very little given how headline-driven this market is. What would be interesting with regards to Oil would be Hormuz headline escalation that fails to mark out a higher-high in prices, whilst this bearish momentum divergence is forming with OVZ at 120. In that scenario, I think you have a very good case to exit WTI exposure and look for a better entry. For the short trigger, I would want to see a strong rejection from $100+ and price to flip $95 back into resistance, then look to short the next intraday pullback towards that level with invalidation above the weekly high, looking for price to trade back towards the bottom quintile of this range, somewhere between $78-81 as a potential higher-low. In any case, I think news failure is what you're looking for in order for longs to stop being favourable - and I think you should not be entering longs above $100 in the same way you should not have been shorting into the hole below $80.
Receive the latest updates directly to your inbox

Price: $6670
Weekly:
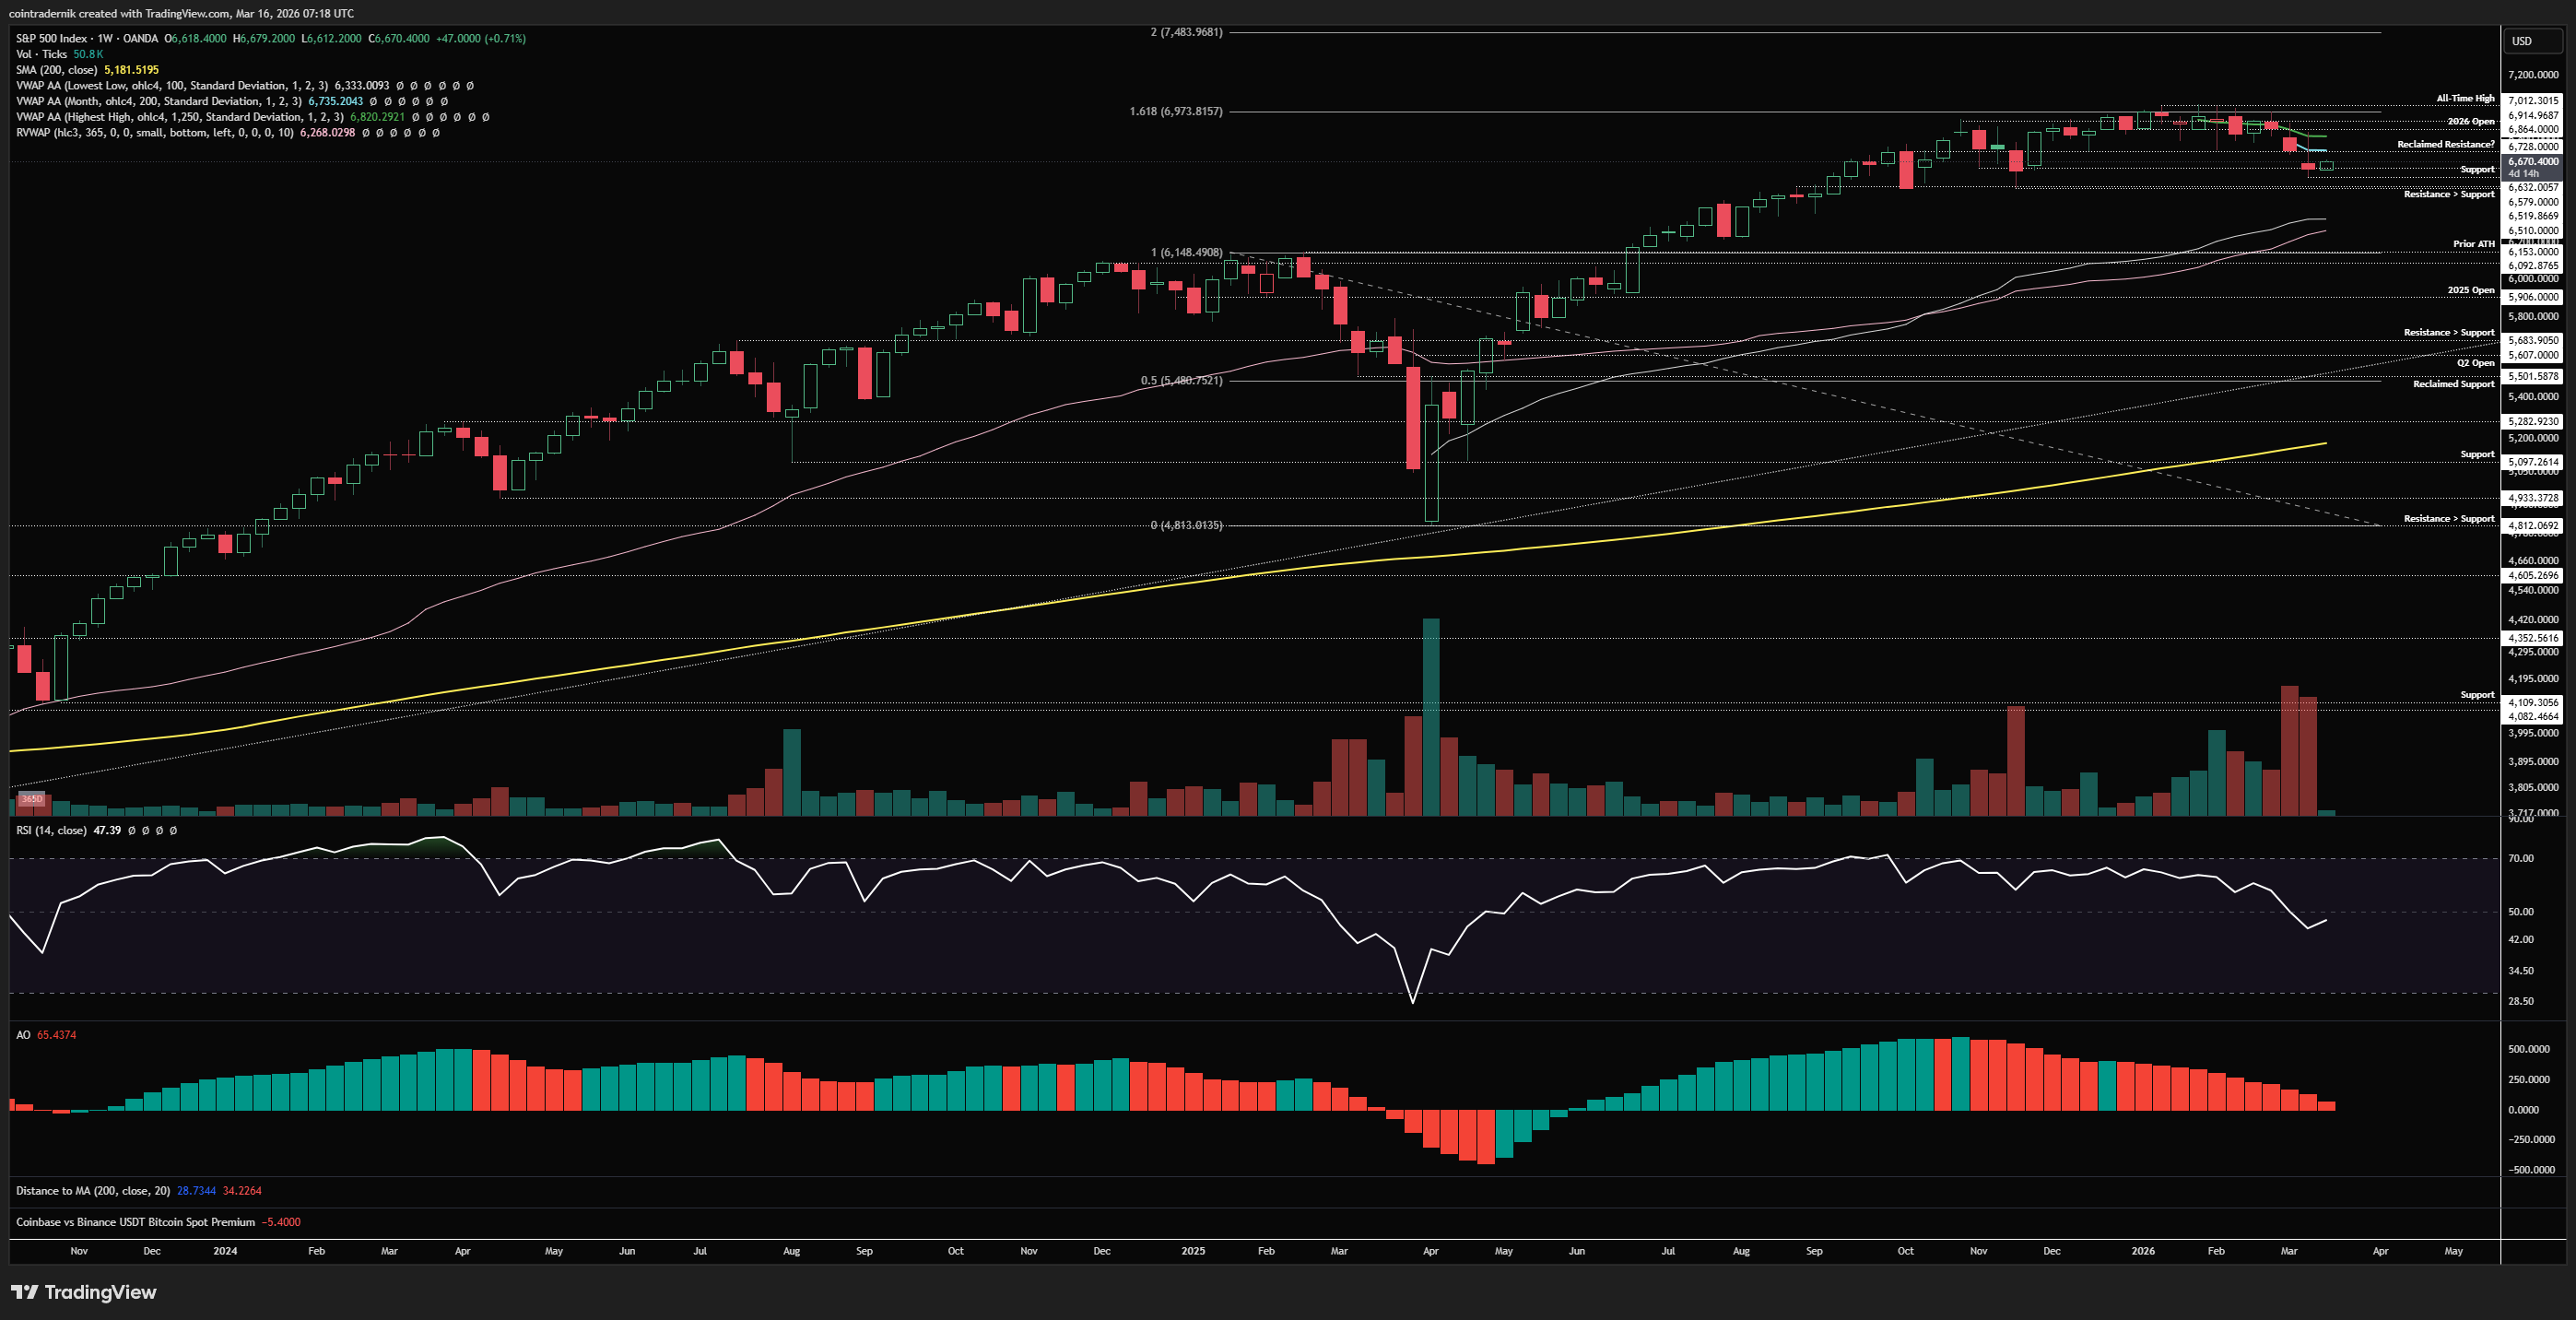
Beginning with the weekly for SPX, we can see that price has been range-bound between $6500ish and $6900ish for the bulk of the past five months at this point, with deviations above and below. We rejected above $7000 earlier this year and have been trading back towards the bottom of the range since, with rallies being capped by the anchored VWAP from that high. The same occurred last week, with price rejecting above $6800 and closing the week marginally below the weekly open, right at key local support at $6630. This is the last support level before we trade into the bottom of the range between $6510-$6520; if we can hold $6630 this week, it is very likely we take out $6500 and perhaps we get the major washout in positioning below that level, with the anchored VWAP from the April 2025 crash and the 365d rolling VWAP between $6260-$6330 as the range of interest if $6500 fails to hold. If we wick below $6500 and reclaim it, I think there's a good chance shorts get baited into a failed breakdown and that marks the low. If price holds $6630 early this, that would be a strong signal, in my view, for some relief here into next week, and I'd be looking at the anchored VWAP at $6820 as the cap for that rally - acceptance above that anchored VWAP on a weekly timeframe and I think we rip through all-time highs and continue higher. $6820 is naturally where you'd be looking for local signs of exhaustion if you want to chance a short - but, as many who have tried this past few months can attest to, shorting the index has been extremely difficult and unfruitful. This is also in some sense what drives the danger in attempting to short the range breakdown should we get it: months of consecutive failed attempts at capturing downside can condition participants to feel bearish FOMO if and when the break comes; then you short into the hole below $6500, price reclaims the range and you start getting squeezed. Despite all of the geopolitical tensions and market-wide volatility, I just don't think naked US index shorts are the play here - if you want to short equities, perhaps look abroad.
Daily:
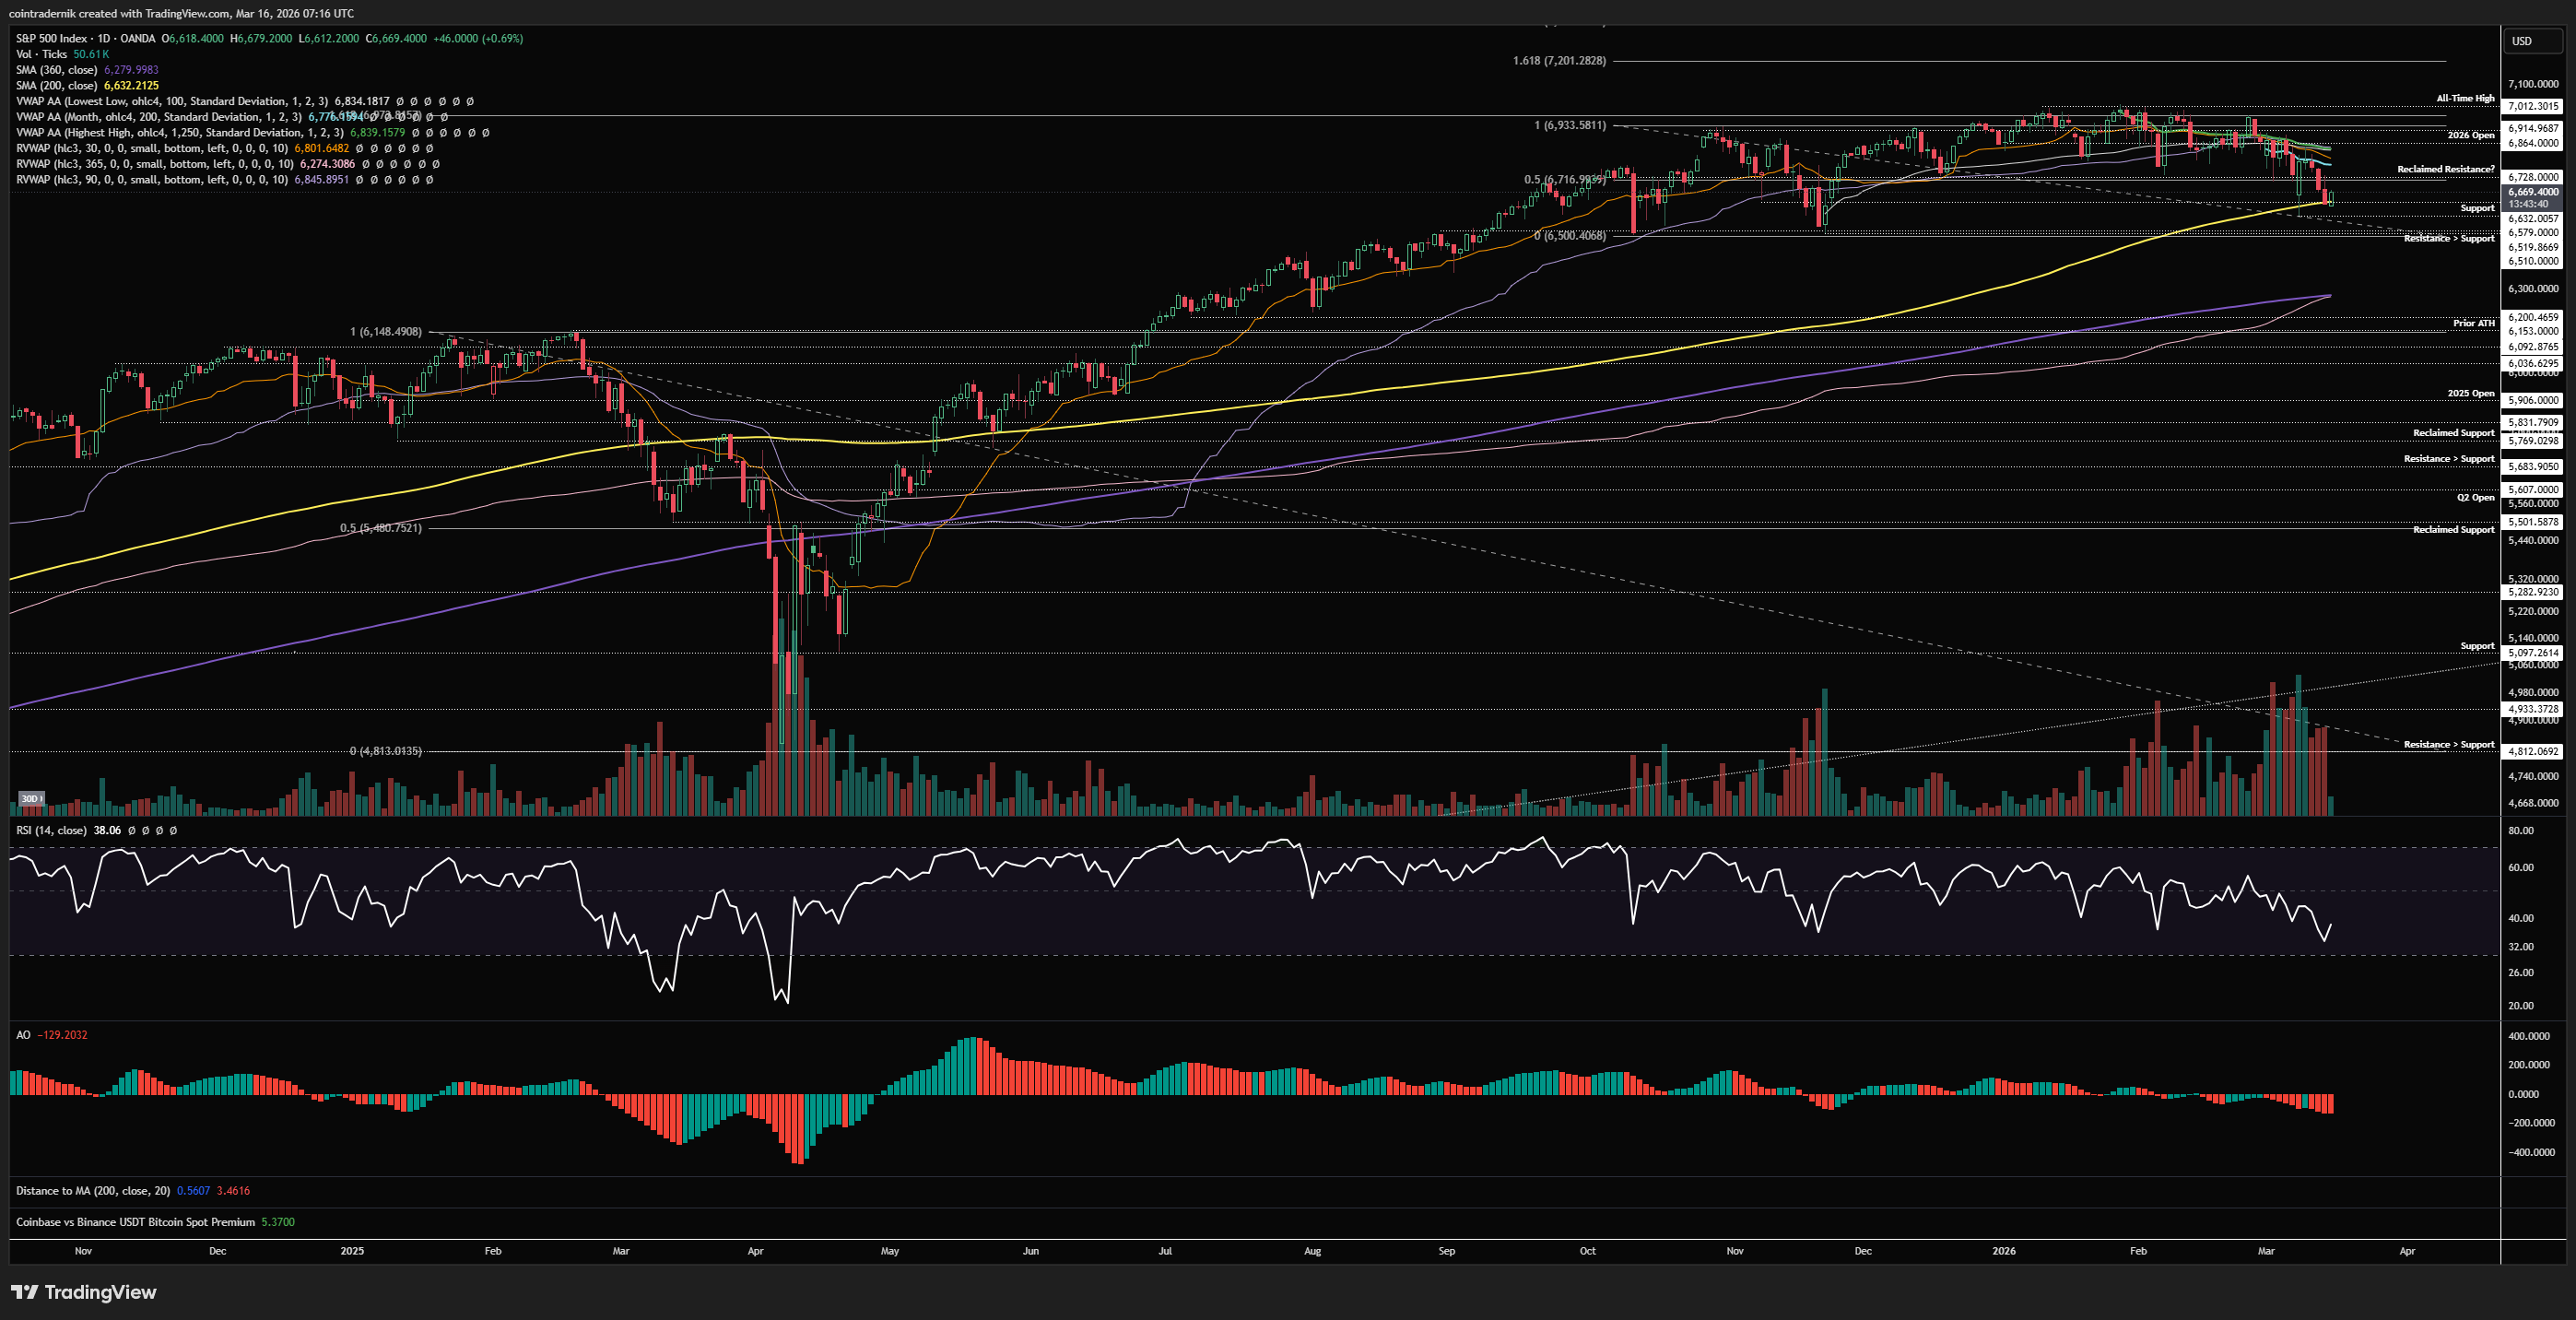
Turning to the daily, we can see that price is finding support right around the 200dMA, having wicked below it last week into $6579 and bounced, then rejected below the confluence of the 30d rolling VWAP, March VWAP and anchored VWAP from all-time highs, all of which remain well below the 2026 open. The index then sold off for three straight sessions into Friday's close marginally below that 200dMA, but has found support over the weekend to gap marginally higher, pushing back above that 200dMA early this week. Friday's low is pivotal here; acceptance below that level makes it very likely we take out the bottom of the range into $6500, as mentioned above. If we can hold Friday's low as support, I think that confluence of VWAPs into the $6770-$6800 region gets retested this week, where the reaction will be telling as to whether it is yet another lower-high before another attempt at a range breakdown; or whether price can break and close back above that region and mark out a higher-high...
Price: $24,533
Weekly:
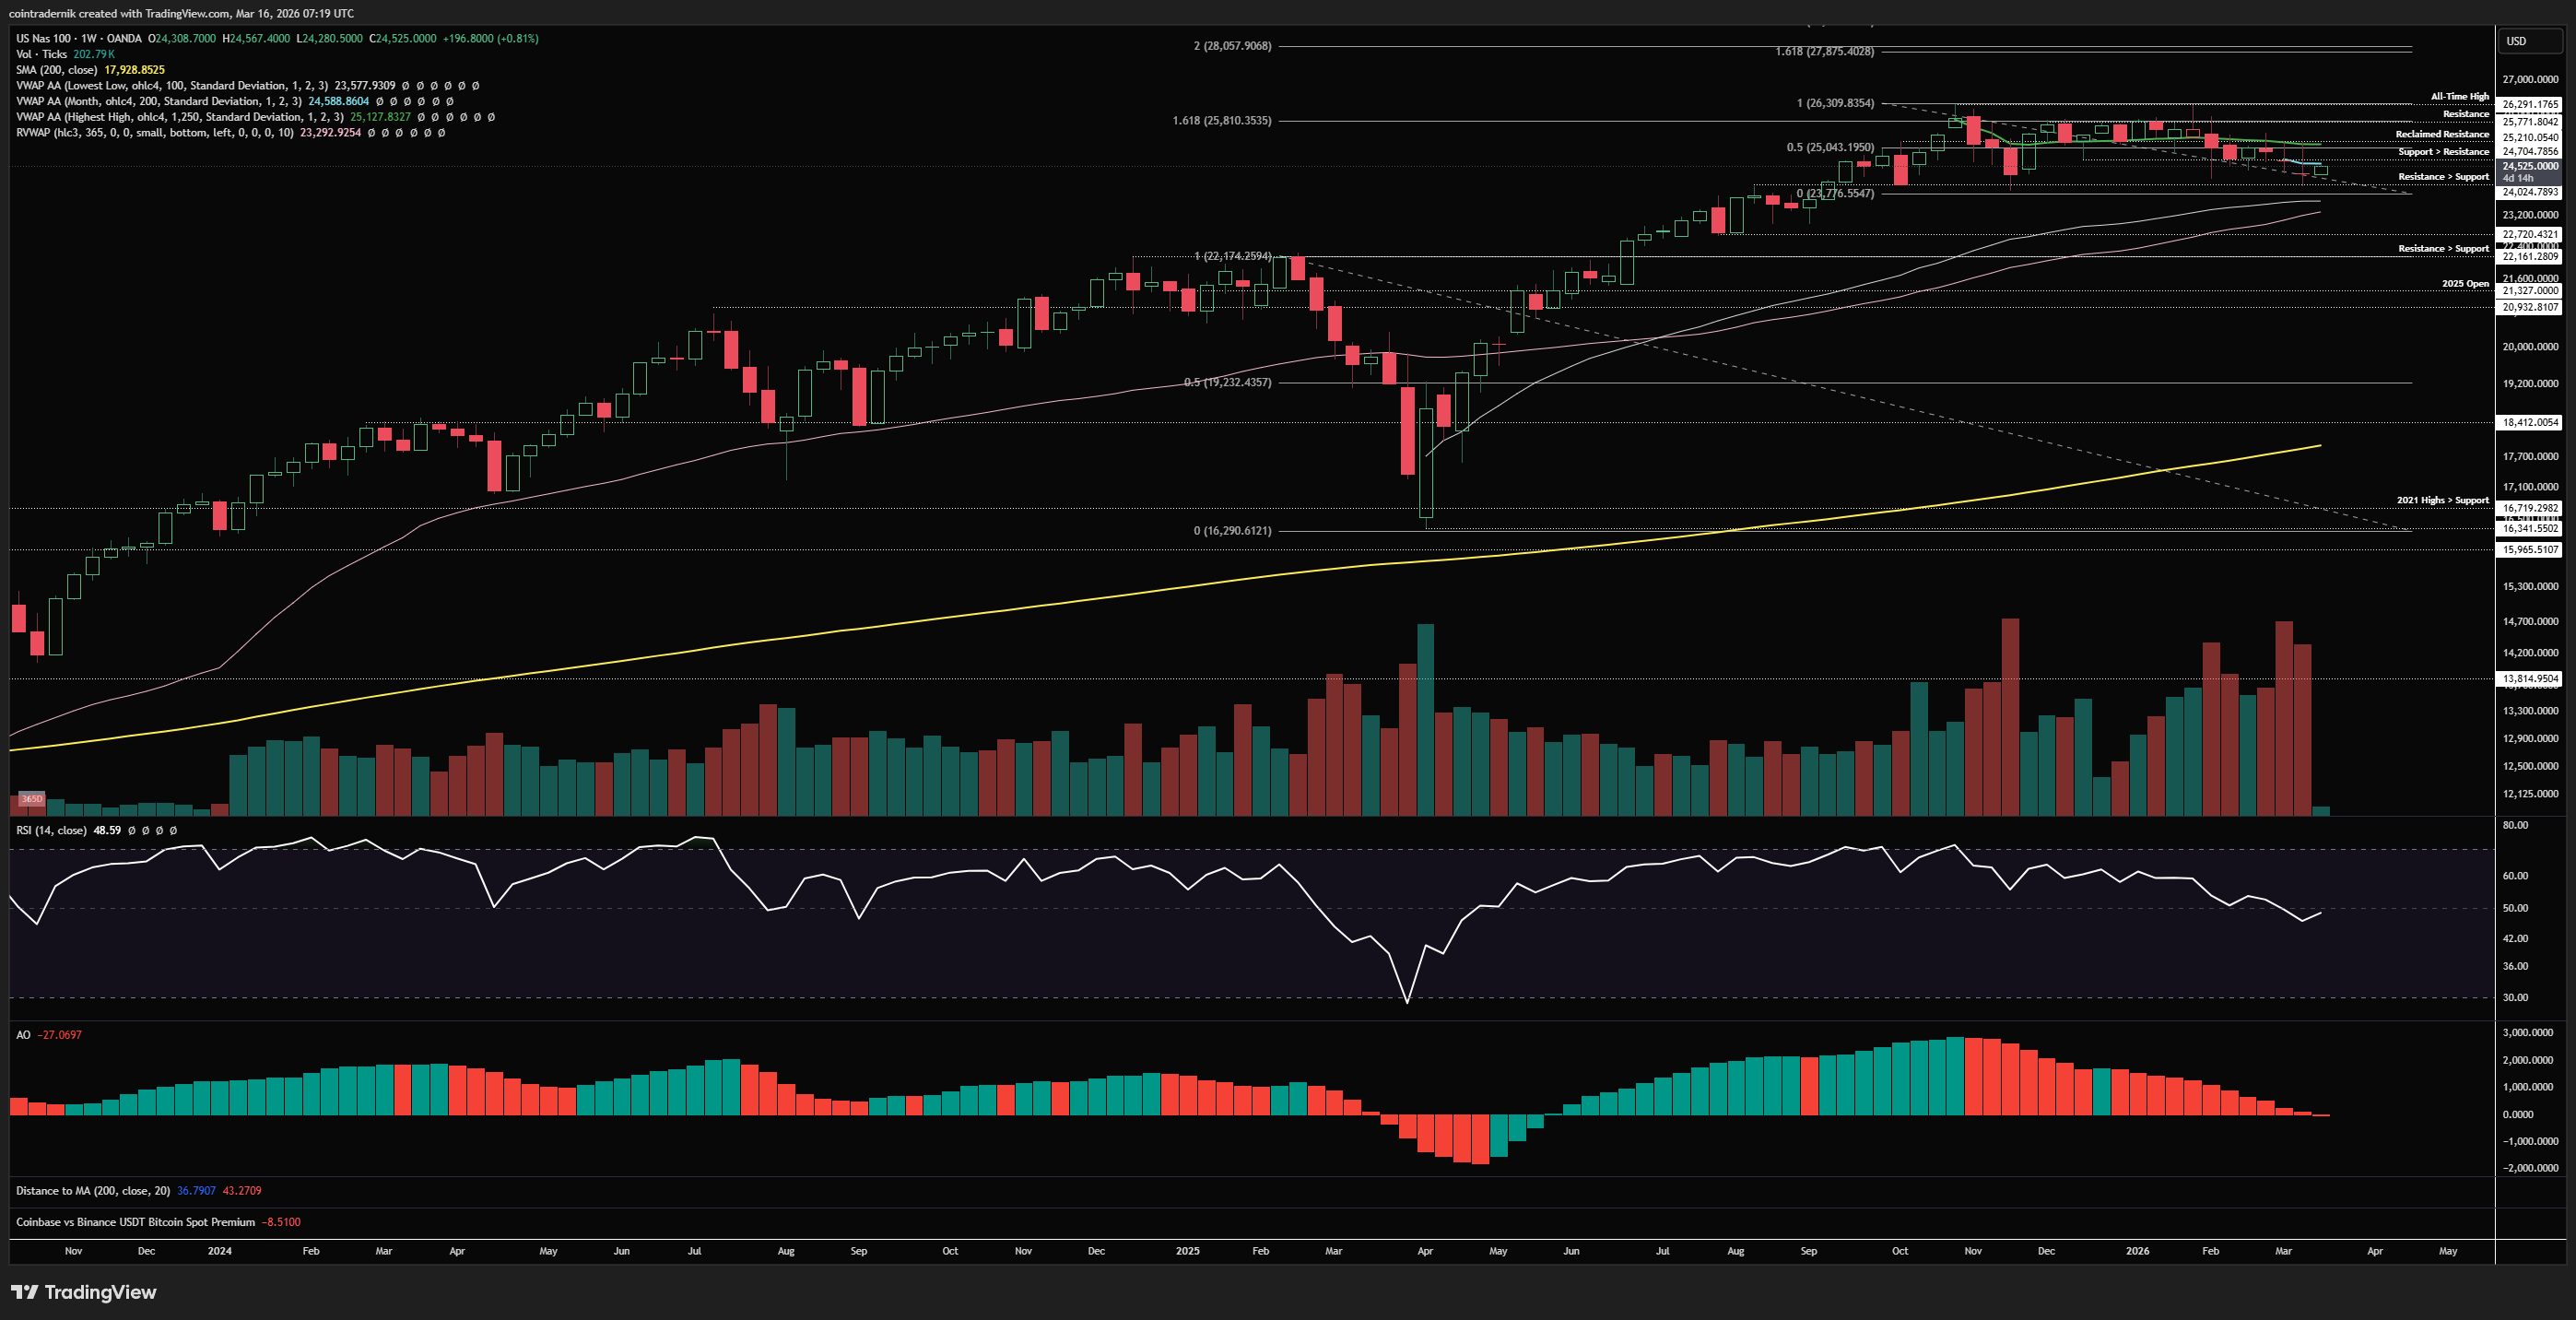
If we begin by looking at the weekly timeframe for the Nasdaq, we can see that we remain range-bound, as you would expect, with price rejecting multiple times at $25,800 as range resistance, having deviated above that level twice to form a double top at the $26,300 all-time highs. We broke and closed back below the anchored VWAP from the all-time high a couple of months ago, retested range support above $24,000 and have since been chopping in that bottom half of the range, capped by the VWAP and mid-range above $25,000 and support by $24,000. We are also - unlike SPX - not far off that anchored VWAP from the April crash low and the 365d rolling VWAP, both of which are sat marginally below range support. If we do break below $24,000, I think that confluence of VWAPs would be where you ladder bids on a first test, as the overeager shorts get filled below range support and then likely get squeezed. Where things actually get more bearish fir NDX is if the weekly closes below the 365d rolling VWAP at $23,300 with weekly RSI below 50 - then structure and momentum on this timeframe would both point to a retest of ~$22.000 as resistance turned support. Until the, there is quite a lot of technical support coming into view here and I think shorts are not favourable unless you get the pop higher back into $25,200ish.
Daily:
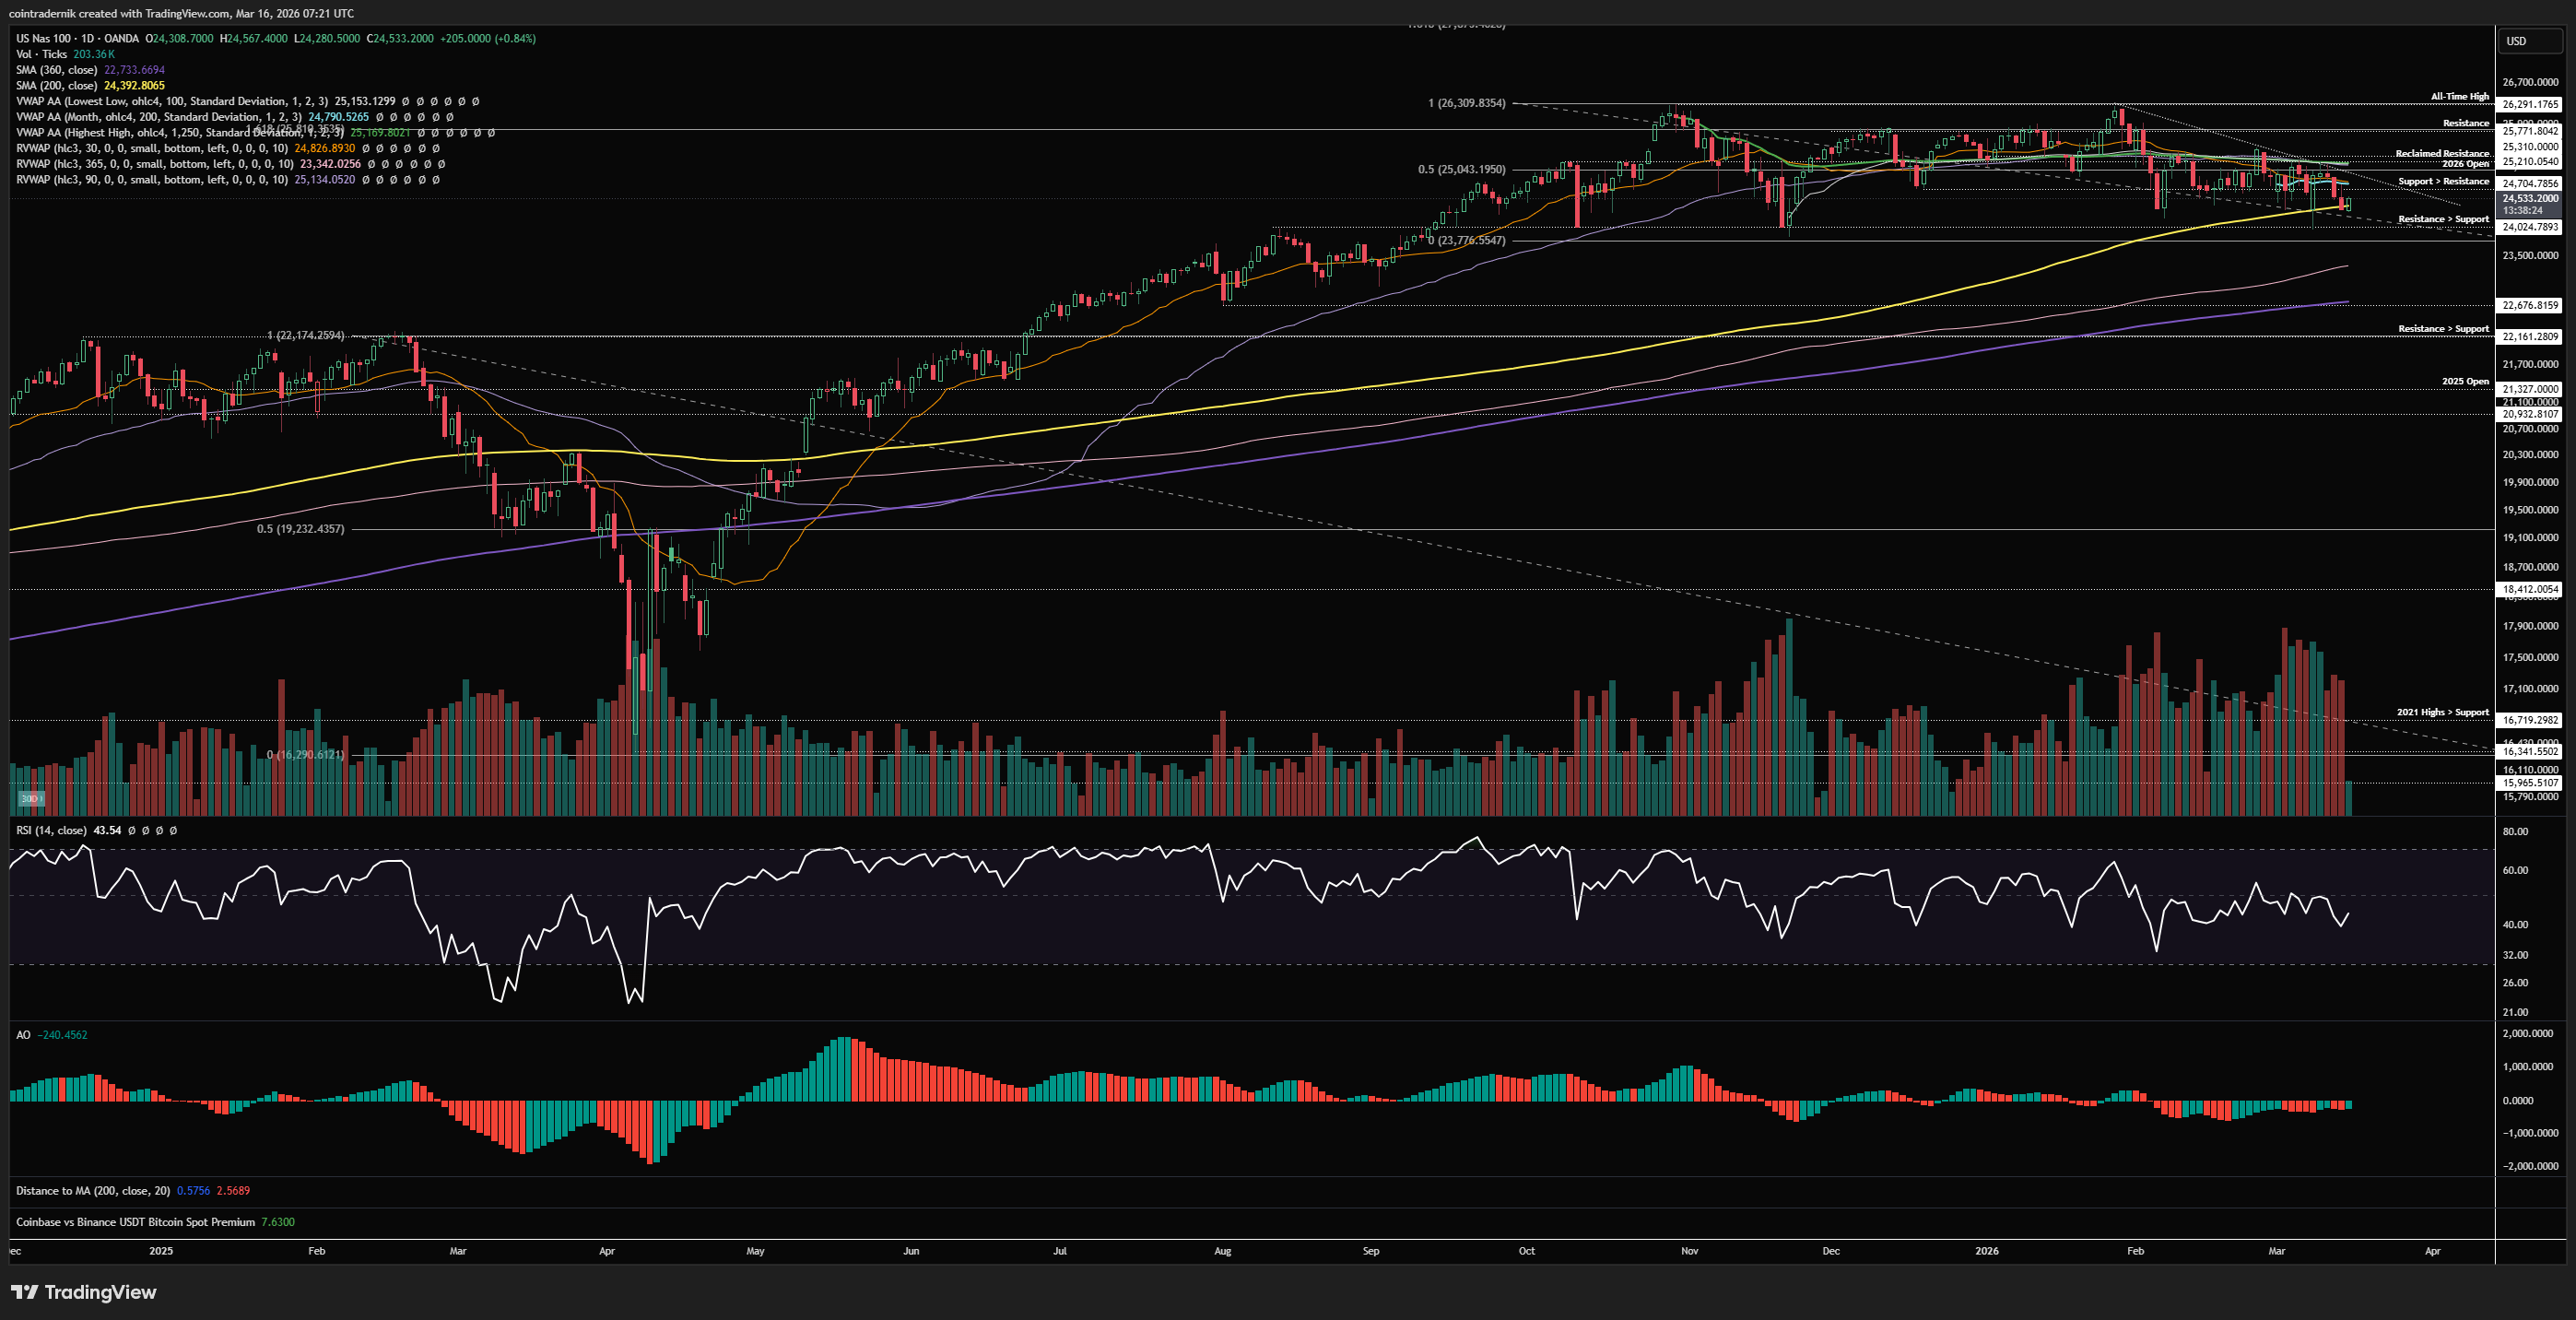
If we drop into the daily, we can see the same sort of choppy, infuriating structure as we saw on SPX, particularly over the past three weeks, with numerous fakeouts, deviations and traps on either side of the market, but with trendline resistance and the key VWAPs capping the rallies and price continuing to fail to break below range support. We did wick below the Feb low into $24,000 and bounced hard, but again price wicked higher into the anchored VWAP from all-time highs and failed again to break higher, then retracing much of the rally but marking out what is for now a higher-low as of last Friday into today's price-action. Again, holding that low is key: form a higher swing-low into all of this headline risk and it feels like local seller exhaustion and news failure, from which I would expect another attempt at the $25,200 level and a breakout. Another failure up there - which is where shorts are max R/R - would be no bueno and I would not bank on the range holding again, instead expecting that breakdown and push into the 365d rolling VWAP to follow, where I do think frustrated shorts pile in on the downside break and get blown out before any real downside is captured. Acceptance above $25,200 would be a serious shift in structure, particularly if momentum can break and close back above 50 on daily RSI, and the technical setup would then be one of a return to range highs nearer $25,800, irrespective of headlines.
Price: $1.143
Weekly:
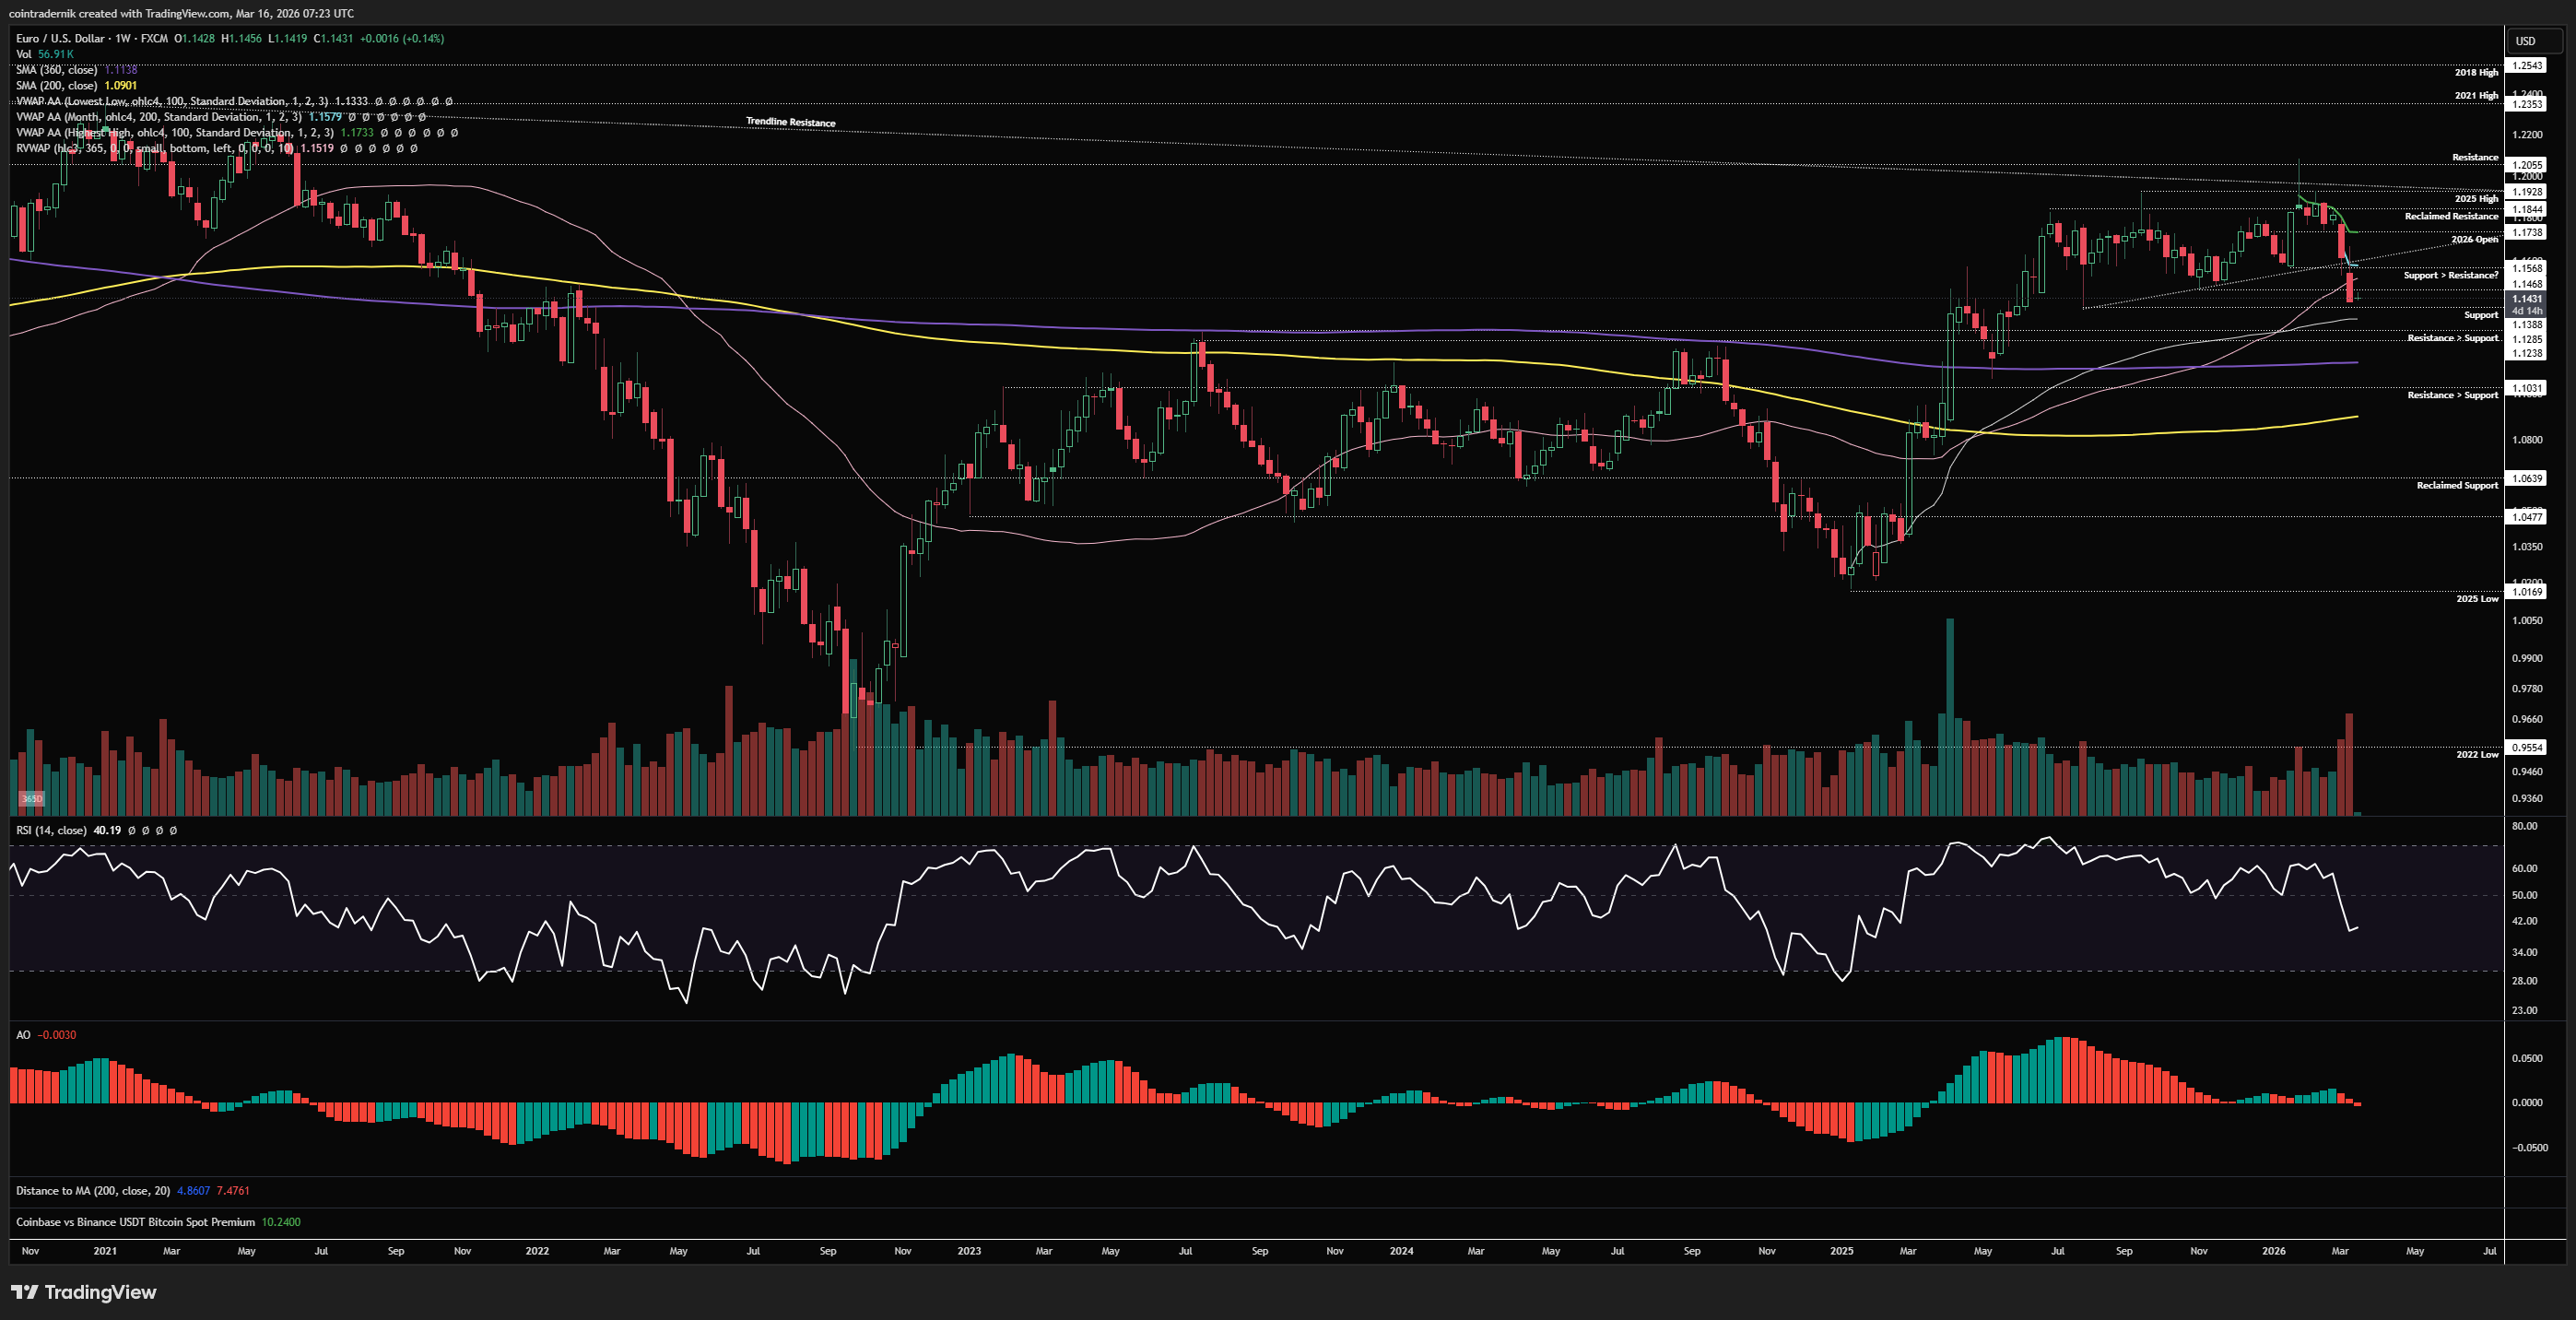
Beginning with the weekly for EUR/USD, we can see that the pair lost all momentum as it broke below the 2026 open, and my bullish Dollar pivot could not have been timed any better to be honest, having captured 300+ pips of EURUSD upside and then exited all long exposure above 1.18. We have since retraced the entire rally all the way back into the H2 2025 lows, breaking below trendline support, losing the 365d rolling VWAP and trading towards the 1.139 swing-low, above which we are currently sat. I would like to see another leg lower here into the anchored VWAP from the 2025 lows at 1.133, taking out that swing-low just below us, and if we see some lower timeframe exhaustion into that low that would be a nice spot to fill some longs again for a bounce. I do think this week has the potential for a bit of reversion given the run in Dollar strength and US yields up to this point, where if we do get that leg lower on EUR/USD today or tomorrow I would be very keen to hit the bid into FOMC. Conversely, if we don't get that leg lower but we do get the upside, I would be looking for post-FOMC shorts on EUR back above 1.157 with a very tight invalidation a weekly close back above that trendline support, above which I think a move back into the yearly open is more probable. Either way, the weekly structure is now bearish and so is momentum, so the bias should be towards selling rips; I only want the long if we get that push lower early this week.
Daily:
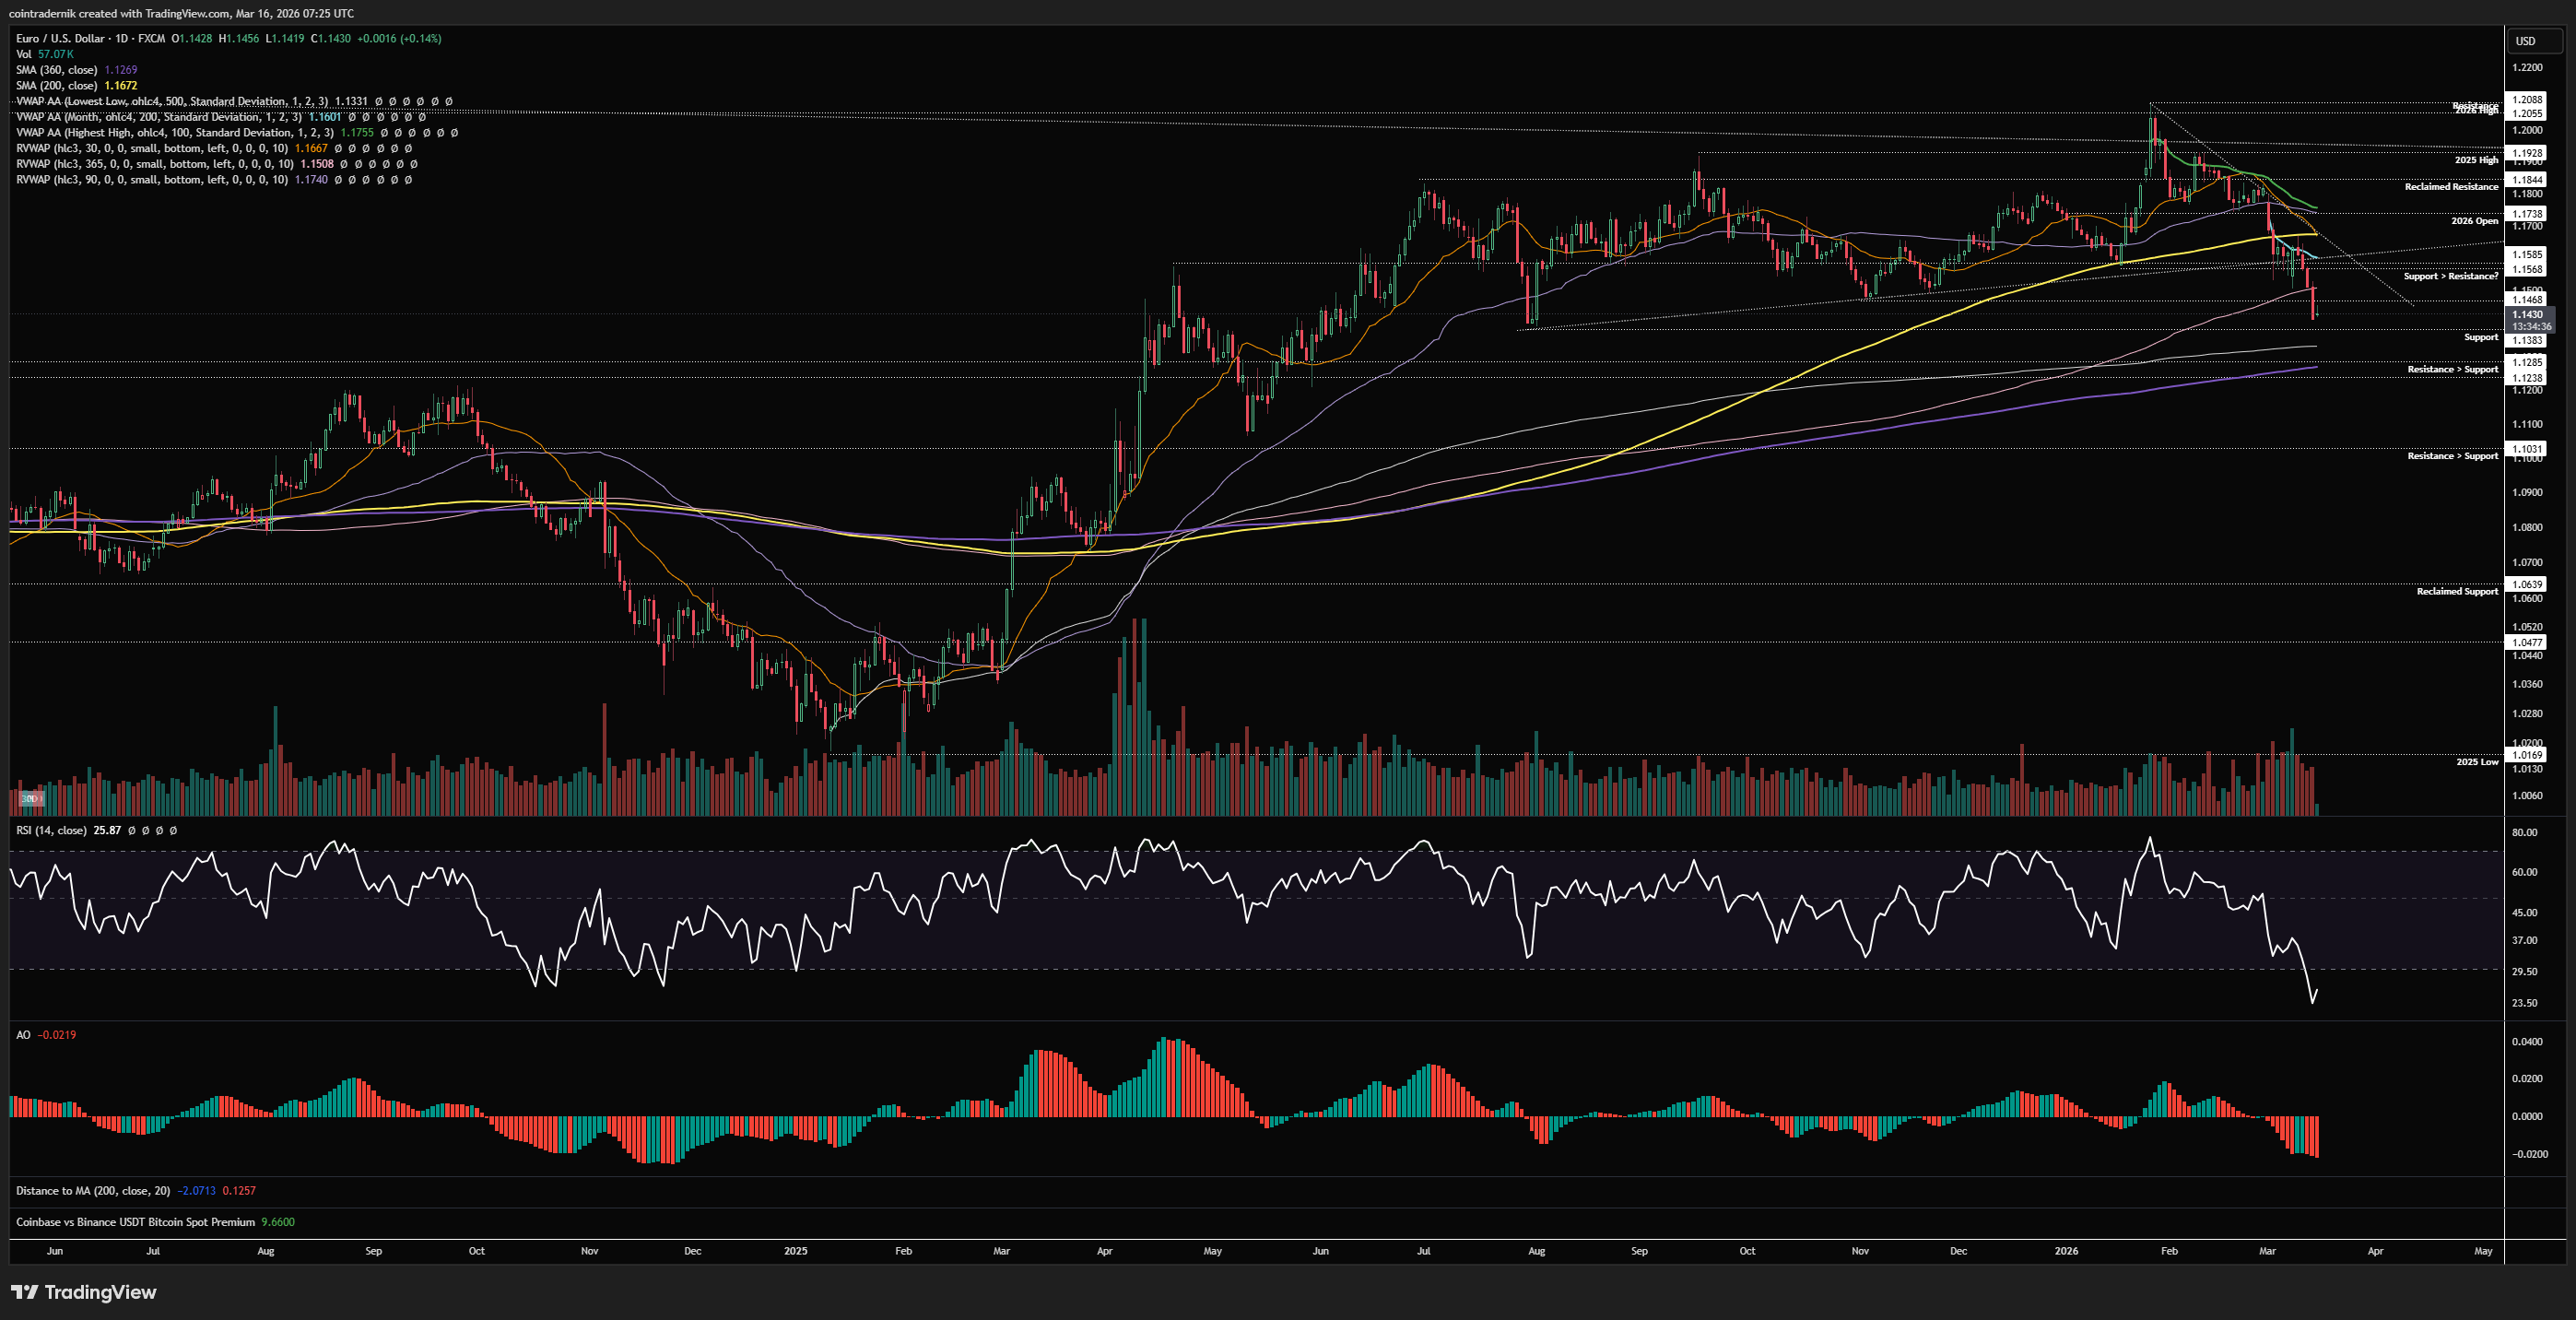
Dropping into the daily timeframe for the pair, we can see that daily structure is firmly bearish, with lower-lows and lower-highs since that run of 1.205, and momentum is extremely bearish, with daily RSI as low as Q4 2024. This is more confluence for a bit of reversion here before some further downside, and the Euro has a lot of work to do if it is to look bullish again for more than a bounce. That said, we do have that support below us, and I favour longs below 1.138 into 1.133 with a daily close below 1.123 as invalidation, given there is no real support below that level all the way back into 1.10. My expectation for the bounce is for 1.157 to hold as a lower-high and trendline resistance to continue capping price, and should we trade into that area I would look for reasons to get short. With 7 interest rate decisions in the next 5 days, there's only 3 words left to say: Big. Week. Ahead.
I hope you've found some value in the read this week - please RT, share, engage etc. if so!
And if you've not already signed up for Ostium, please do so and test out some of the recent updates, including:
Sign up here (you don't have to use my ref link, of course): https://ostium.app/trade?from=CL&to=USD&ref=CTNIK

.avif)