

Market Outlook #76 - Chokepoint
March 10, 2026
-
12
min read


This blog references an opinion and is for entertainment and informational purposes only. It is not intended to be investment advice. Seek a duly licensed professional for investment advice.
In this special Chokepoint edition of the 76th Market Outlook here at Ostium Insights, we'll be taking a look at the week ahead in markets, looking at price-action, positioning and event risk for US Oil, Silver, Gold, Copper and USDJPY.
Now, let's take a look at the relatively quiet economic calendar for the week ahead, except for Wednesday's inflation data and some growth data at the close:
TUESDAY: USD ADP EMPLOYMENT CHANGE (4-WEEK AVERAGE): (CONSENSUS N/A VS PREVIOUS 12.8K)
WEDNESDAY: US CONSUMER PRICE INDEX (YOY) (FEB): (CONSENSUS 2.4% VS PREVIOUS 2.4%)
THURSDAY: US INITIAL JOBLESS CLAIMS: (CONSENSUS 215K VS PREVIOUS 213K)
THURSDAY: FED'S BOWMAN SPEECH
FRIDAY: US CORE PERSONAL CONSUMPTION EXPENDITURES (YOY) (JAN): (CONSENSUS 3% VS PREVIOUS 3%)
FRIDAY: US DURABLE GOODS ORDERS (JAN): (CONSENSUS 0.8% VS PREVIOUS -1.4%)
FRIDAY: US GDP ANNUALIZED (Q4) (PREL.): (CONSENSUS 1.4% VS PREVIOUS 1.4%)
FRIDAY: US MICHIGAN CONSUMER SENTIMENT INDEX (MAR): (CONSENSUS 55 VS PREVIOUS 56.6)
Now, let's dig into asset-specific price-action for the week ahead, looking firstly at US Oil:
Price: $89.31
Weekly:
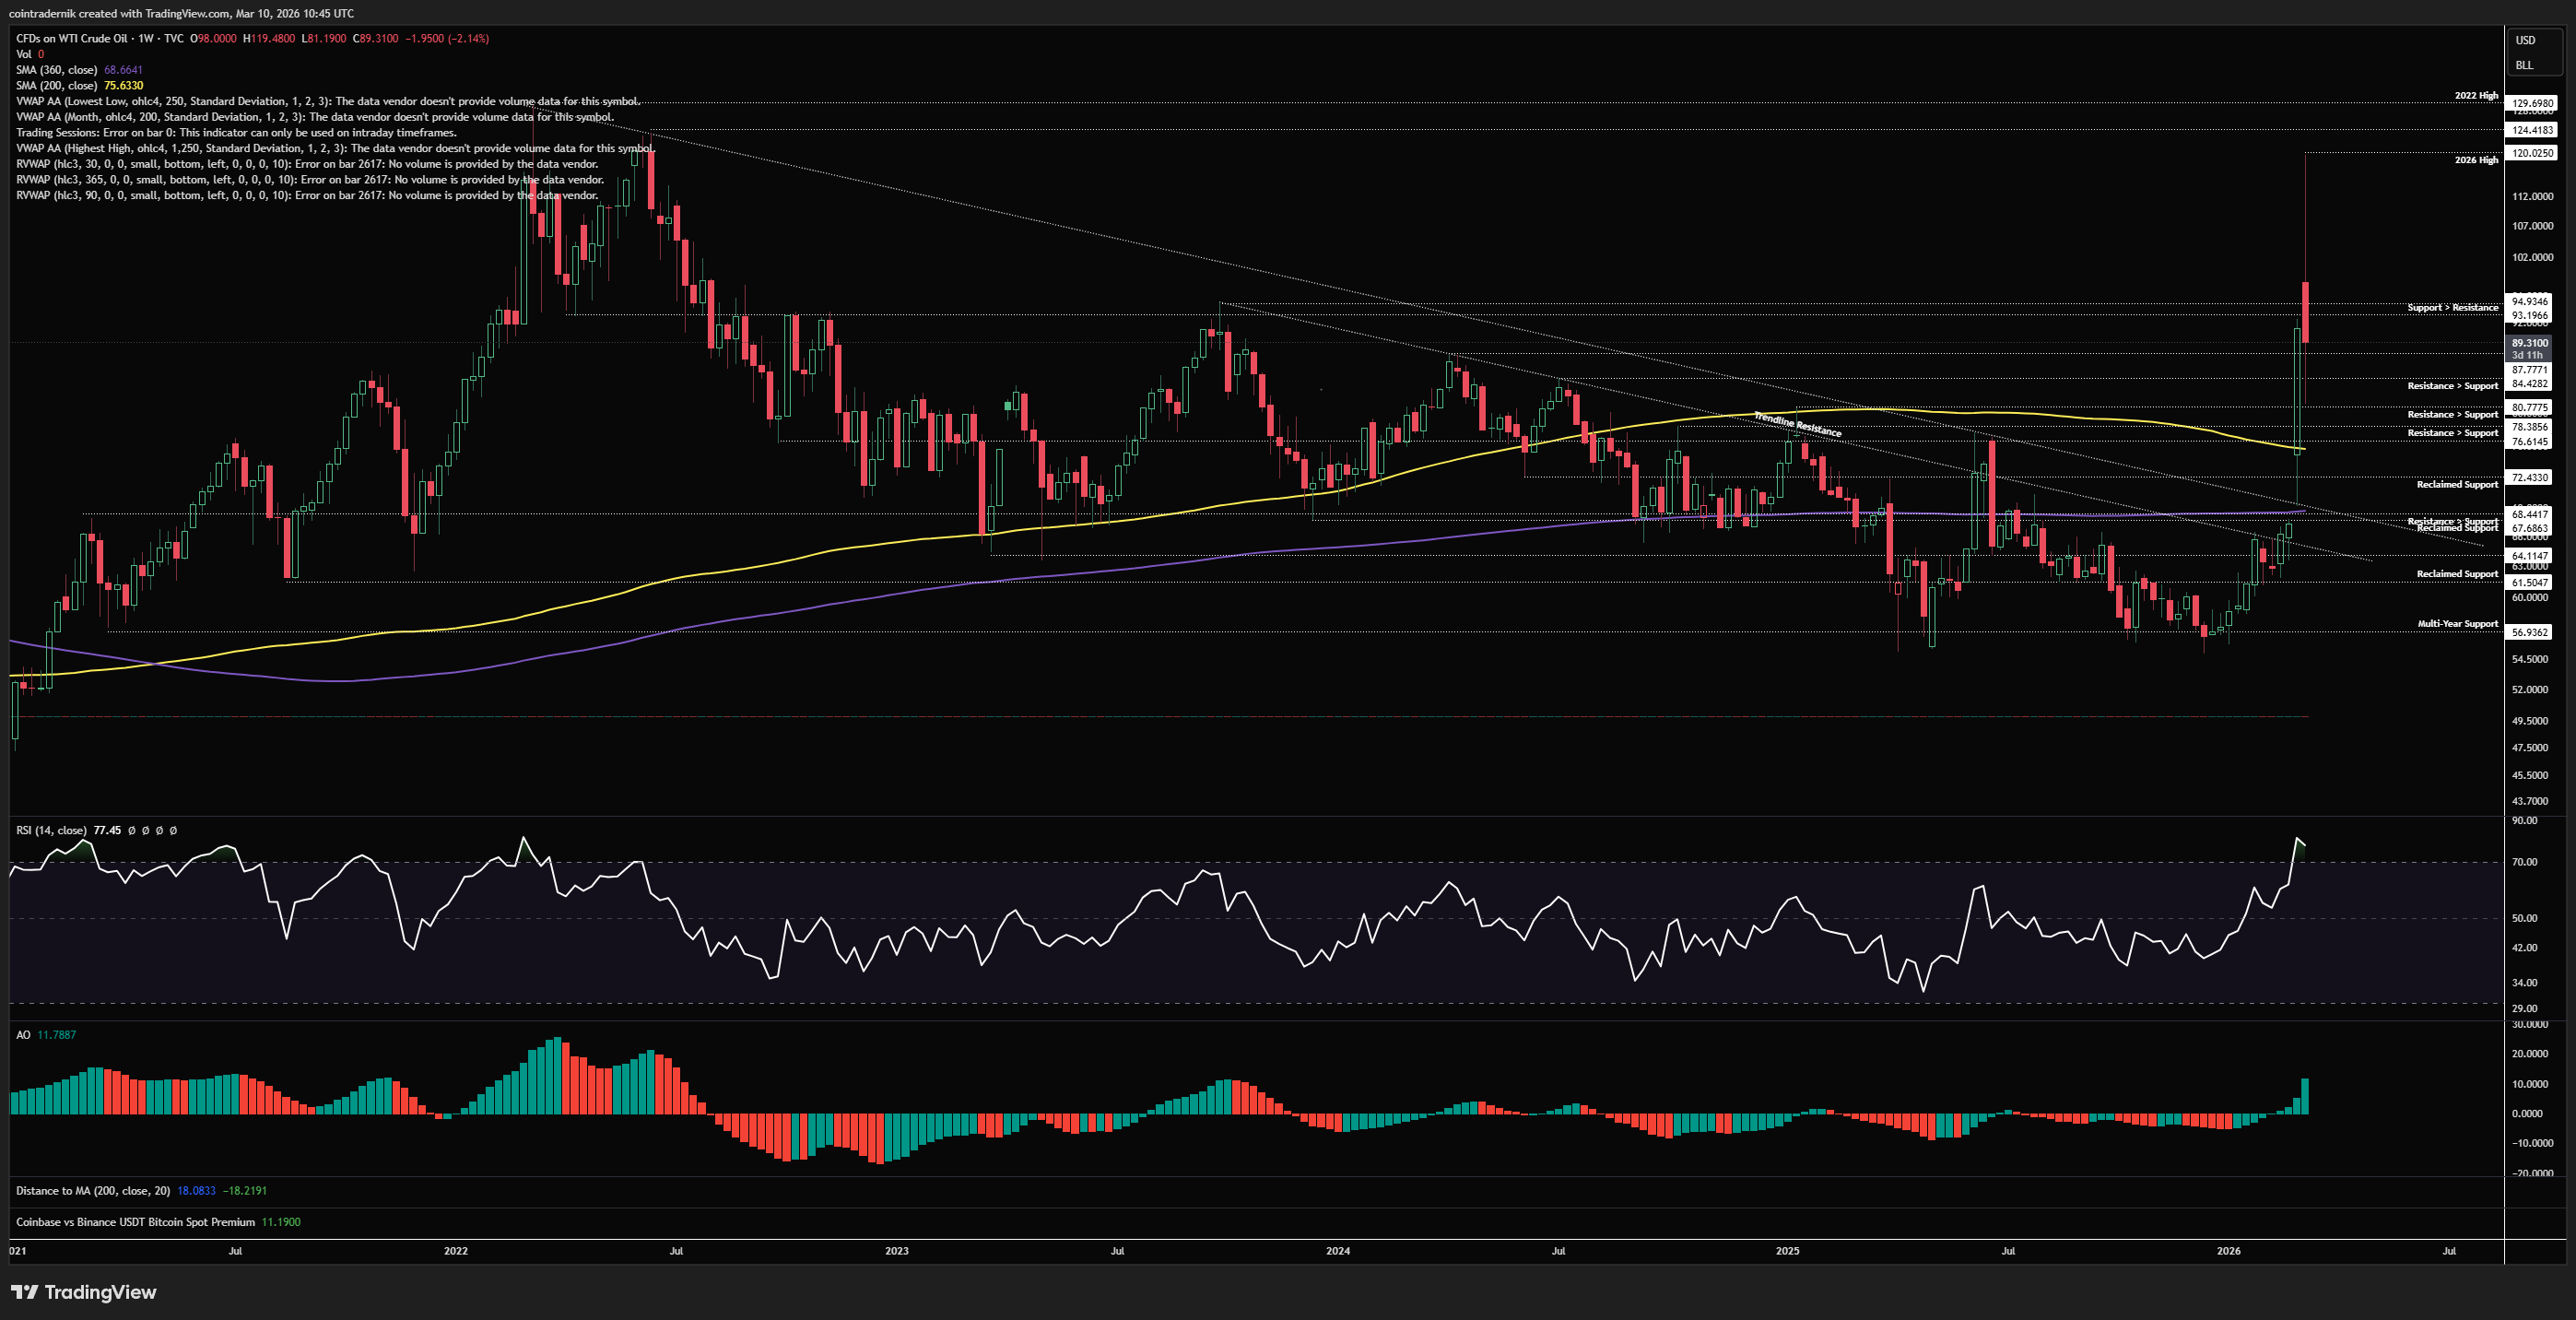
Beginning with the weekly chart for US Oil, we can see that last week was an historic week of volatility, perhaps eclipsed only marginally by the overnight action at the beginning of this week. We saw price break beyond multi-year trendline resistance, find support above that upper trendline then rally from $69 to $92 in a week, closing Friday at those weekly highs through every level of prior resistance from 2024. We then saw escalating headline over the weekend that led to a massive gap higher overnight on Sunday, with Crude tagging $120 - the highest price since the 2022 peak - having gapped straight through $94 resistance. Since, however, we have seen some coordinated efforts to calm the markets from major governments, leading to a rejection at that $120 level and an immediate reversal back below last week's close, with the weekly range currently $81 as support and $120 as resistance. In effect, we have a 2-week range of about $50, which is among the largest fortnightly ranges for Crude. We can see that technically we are a strong spot, with momentum up near the 2022 peak levels, and price holding above many major resistance turned support levels. But, much like Silver into that late Jan blow-off top, when Oil volatility is at historic highs (eclipsed only by Covid in recent years), this is not really where I would want to be betting on trend continuation in the short-term. Now, obviously - unlike Silver - Crude is more at the mercy of geopolitics and simple headlines can and will continue to swing this thing in both directions, but I would not be expecting those 2022 highs to be eclipsed in the near-term. My expectation here is that we consolidate inside this historic two-week range for some time to come and that the opportunities to trade the pair will come from longs in the bottom quartile of the range and shorts in the top quartile. For example, if we were to take out the current weekly low and retest $77 (above the 200wMA and the prior weekly open), that's a really nice area to look for longs back towards this week's open at ~$98, in my view; conversely, if we continue to bounce here and fill in part of that wick above $98, I will be looking for lower timeframe signs of exhaustion to short back towards $77. Other than that, I wouldn't really be interested in any positions in the mid-range, where we currently are.
Daily:
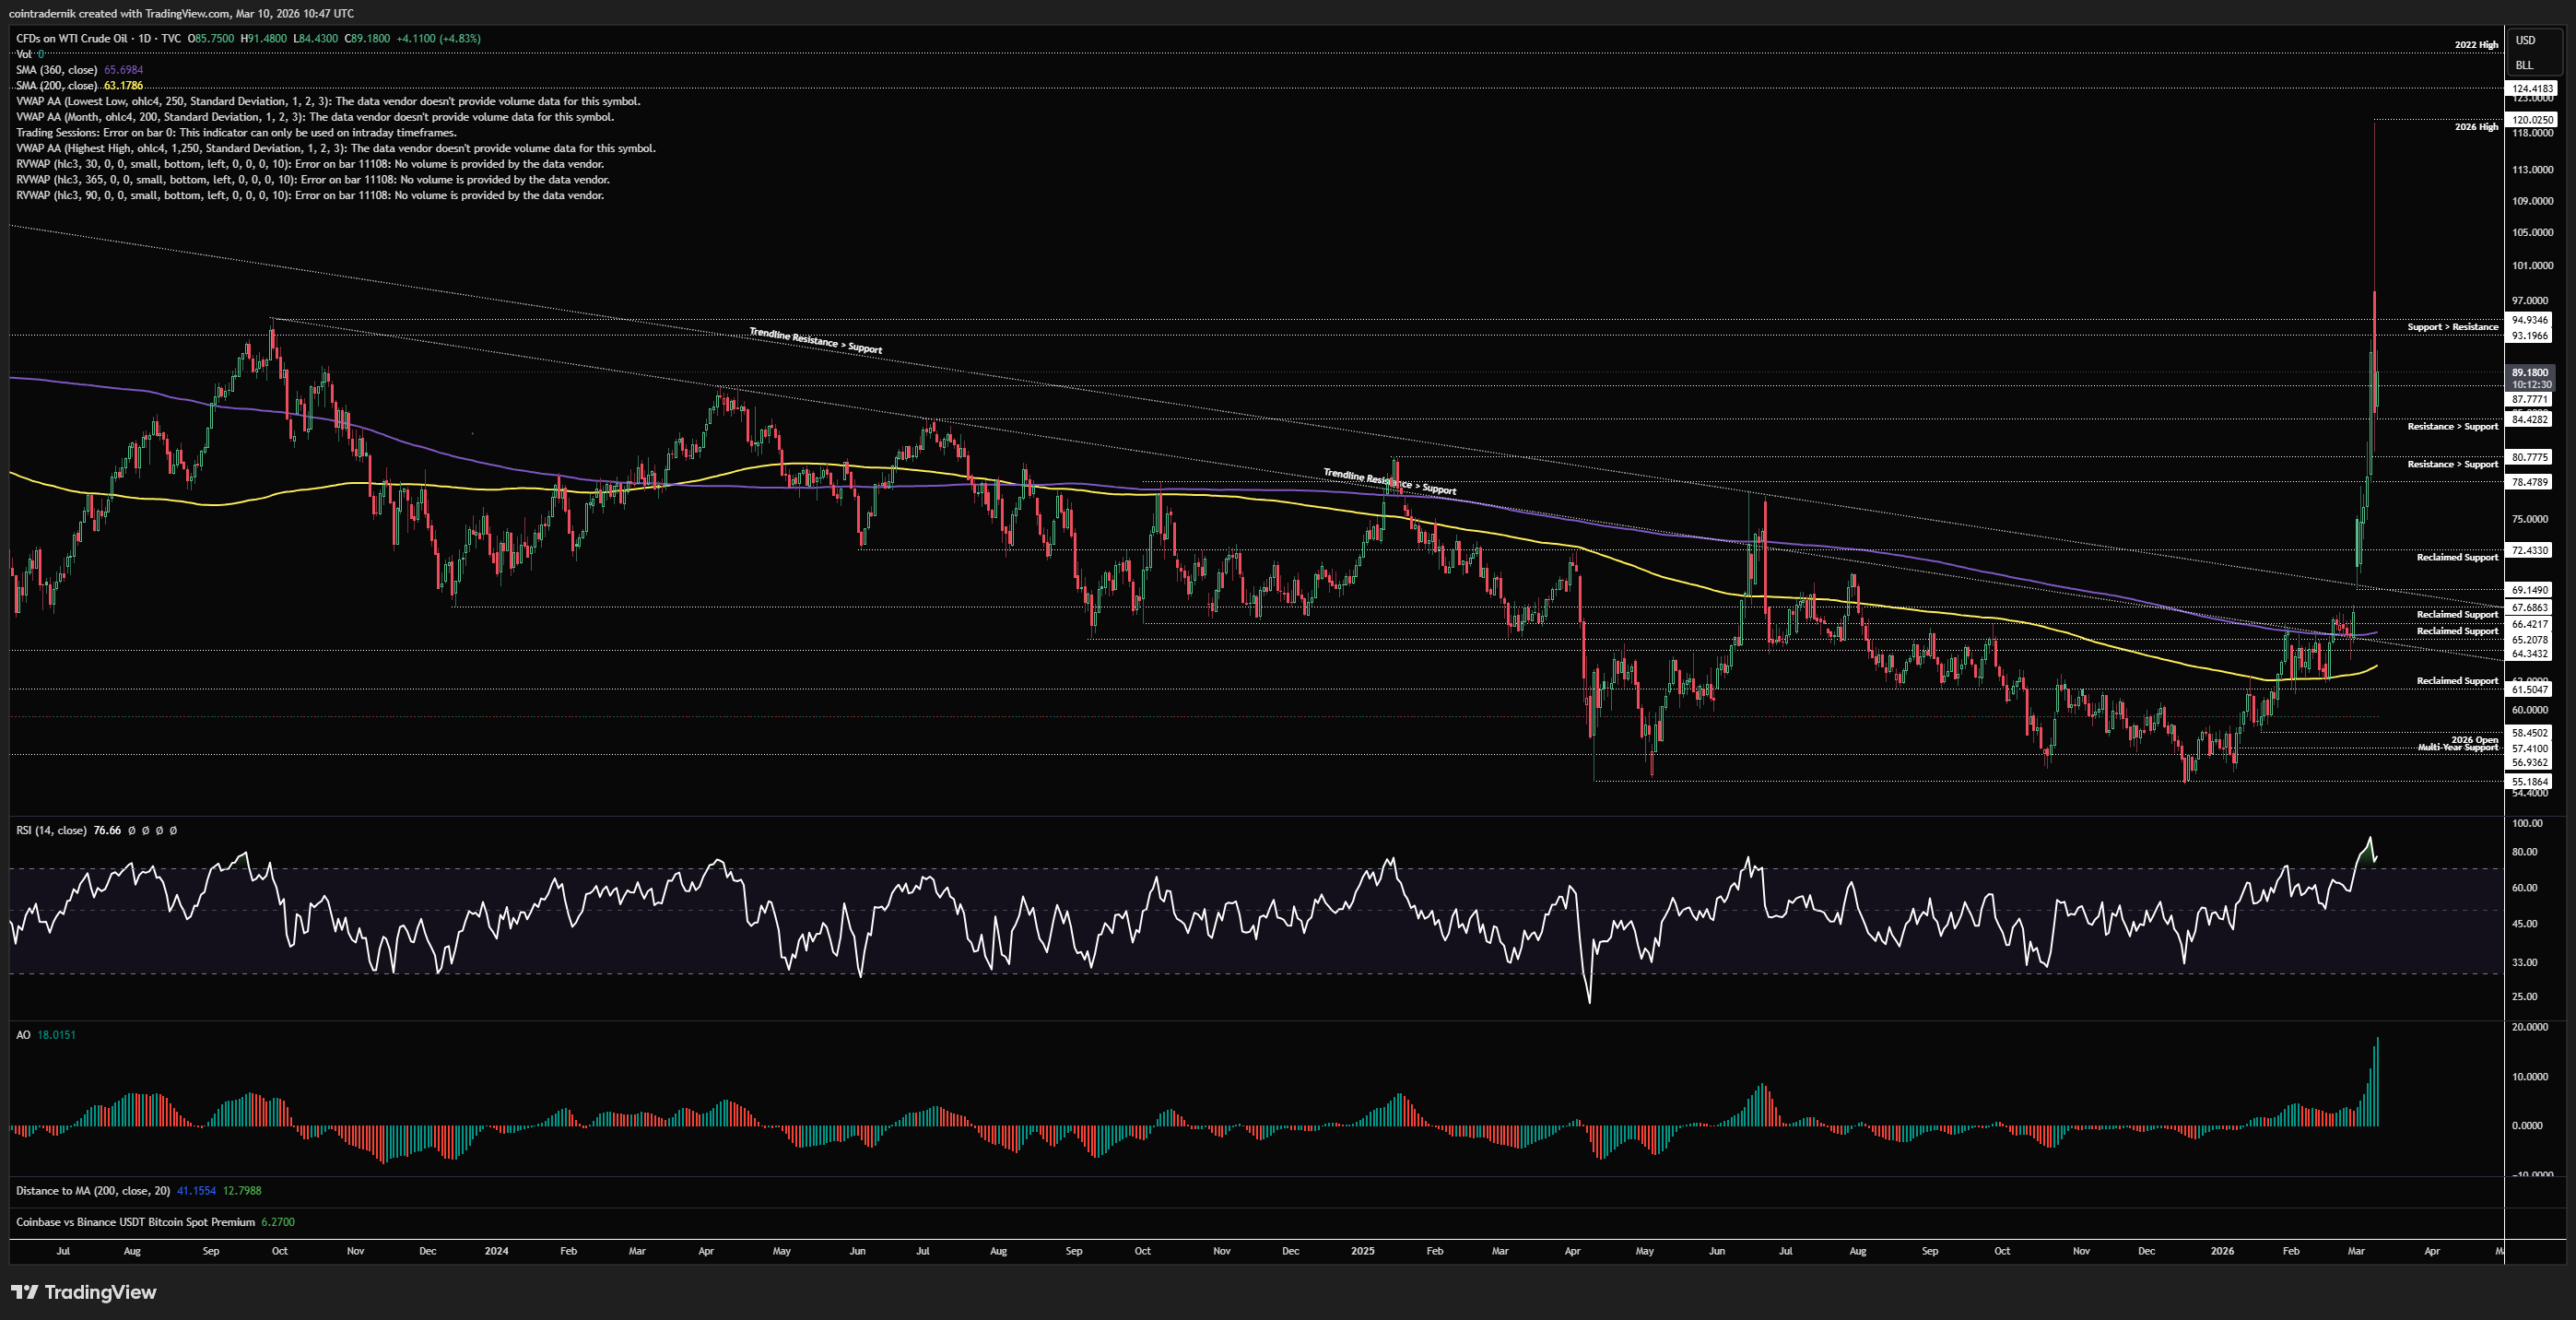
Dropping into the daily, we can see that daily structure and momentum are very bullish, and despite that scary looking rejection candle yesterday I do still think longs from a little lower would be very favourable setups. Somewhere around $77-81 over the next few days would be where I want to see some lower timeframe bullish divergences form and then I'd look to ladder some bids, with a daily close below $69 as invalidation on any long exposure. I think it is very likely we see $98 retested as resistance, and I would obviously prefer that to occur after another leg lower to make the long more favourable back into that weekly open. If, instead, we are marking out a swing-low here above $84, and we push into and above $98 over the next day or two, I would be more comfortable looking for shorts but the risk/reward just isn't as favourable from a technical POV and from a headline risk POV. Ideally, I'd want something like $105 and look to short a breakdown from there, with a daily close above whatever that high is as invalidation. No doubt we have more volatile days ahead. Let's see how this week plays out...
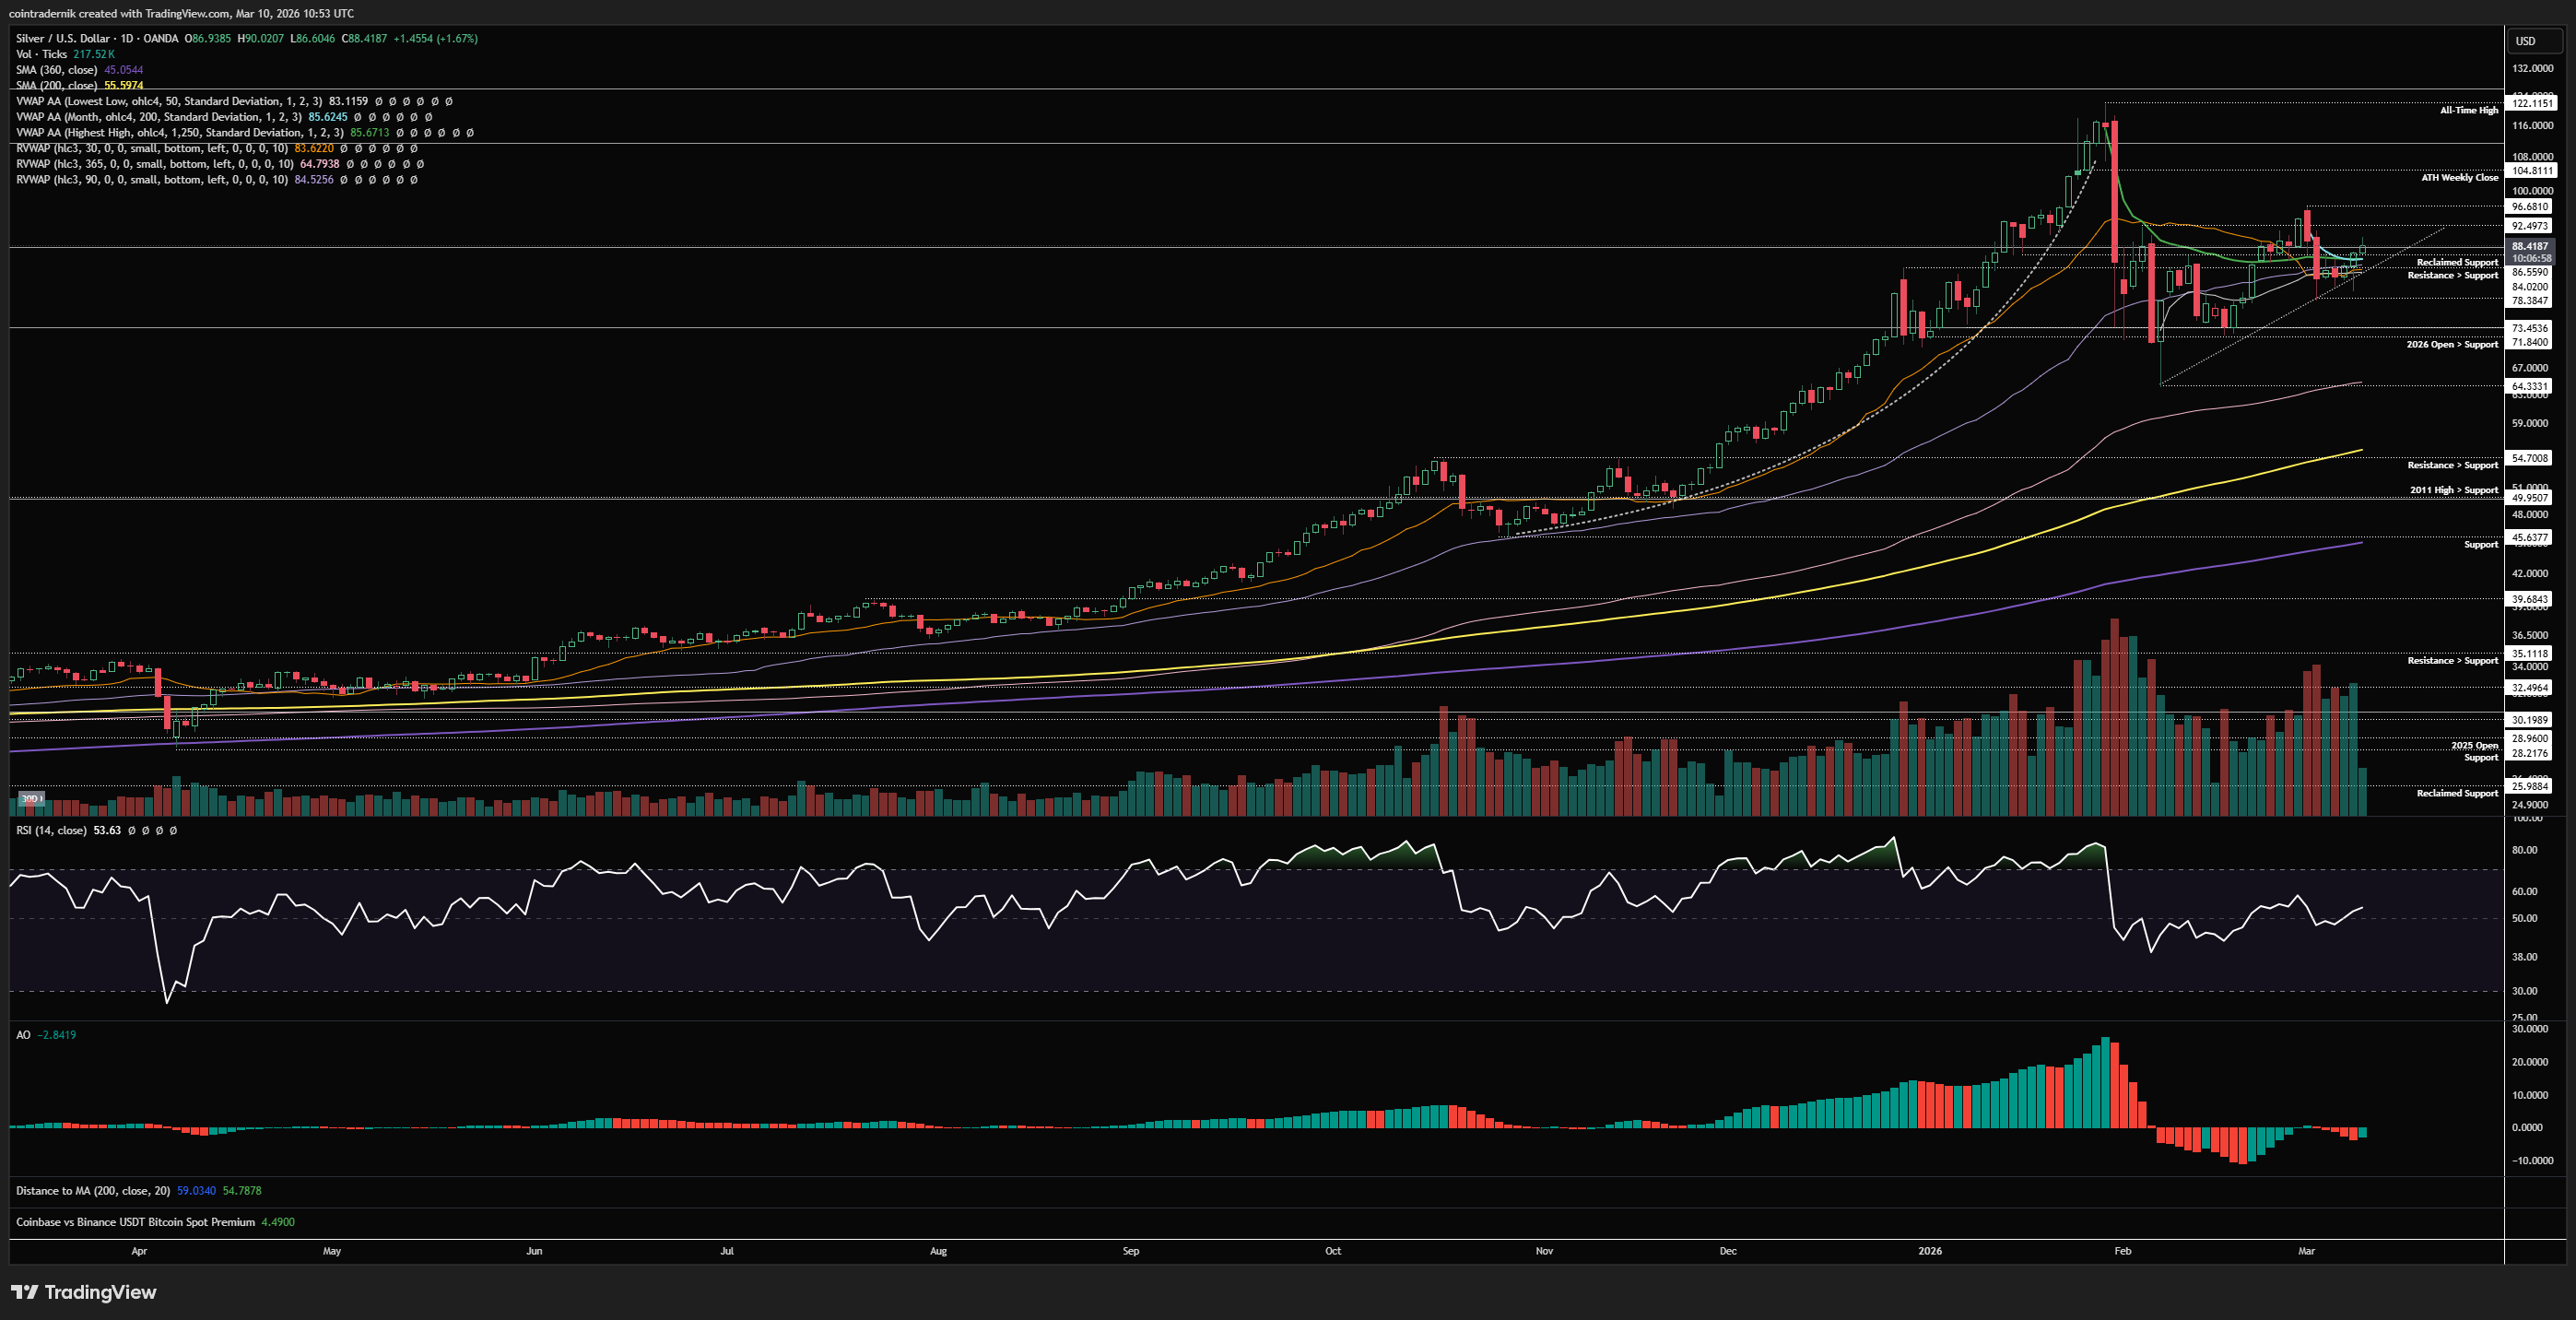
Price: $88.43
Weekly:

If we begin by looking at the weekly for Silver, we can see that price has been consolidating within the broader two-week range as anticipated, marking out some higher-lows since the bottom at $64 but rejecting at $96.68 last week to close back below the anchored VWAP from the all-time high. Weekly momentum has now reset somewhat and is holding above 50 on weekly RSI, whilst the market continues to digest the all-time high volatility of January. What bulls want to see here is the low at $78 hold and price break and close immediately back above that anchored VWAP from the highs, which is (so far) what appears to be occurring. If price can hold above $86 this week, I think you can look for longs towards $105 - the all-time high weekly close. That is where I would be very keen to look for signs of exhaustion and bearish momentum divergences, as I still expect a much longer consolidation to follow for Silver, where $105 could mark out the complacency high of this topping pattern. Naturally, the invalidation for this is quite clear: if we close a week above $105 and hold above it the subsequent week, it's extremely unlikely we're putting in a lower-high and I would expect new highs to follow. If this week sees price reject last week's high and move lower, the complacency lower-high may well already be in and I would expect a retest of the 365d rolling VWAP at $64 to follow.
Daily:
Dropping into the daily, we can see that price is holding above trendline support from the $64 low for now, with support being found at prior resistance and the cluster of MAs and VWAPs at $84; reject here early this week and break back below $84 and I think it is looking cooked short-term, where I would look for shorts back into that trendline as resistance with TP1 at $73 and TP2 at $65. If, however, we do hold here and break ack above $92.50 as resistance, I would look for an intraday pullback towards $89ish and long that with a view towards $105 being retested over the next couple of weeks, with invalidation on a daily close below $83. Not much else to add here for the time being. I do think higher is more probable than lower - at least until we retest $105.
Receive the latest updates directly to your inbox

Price: $5172
Weekly:
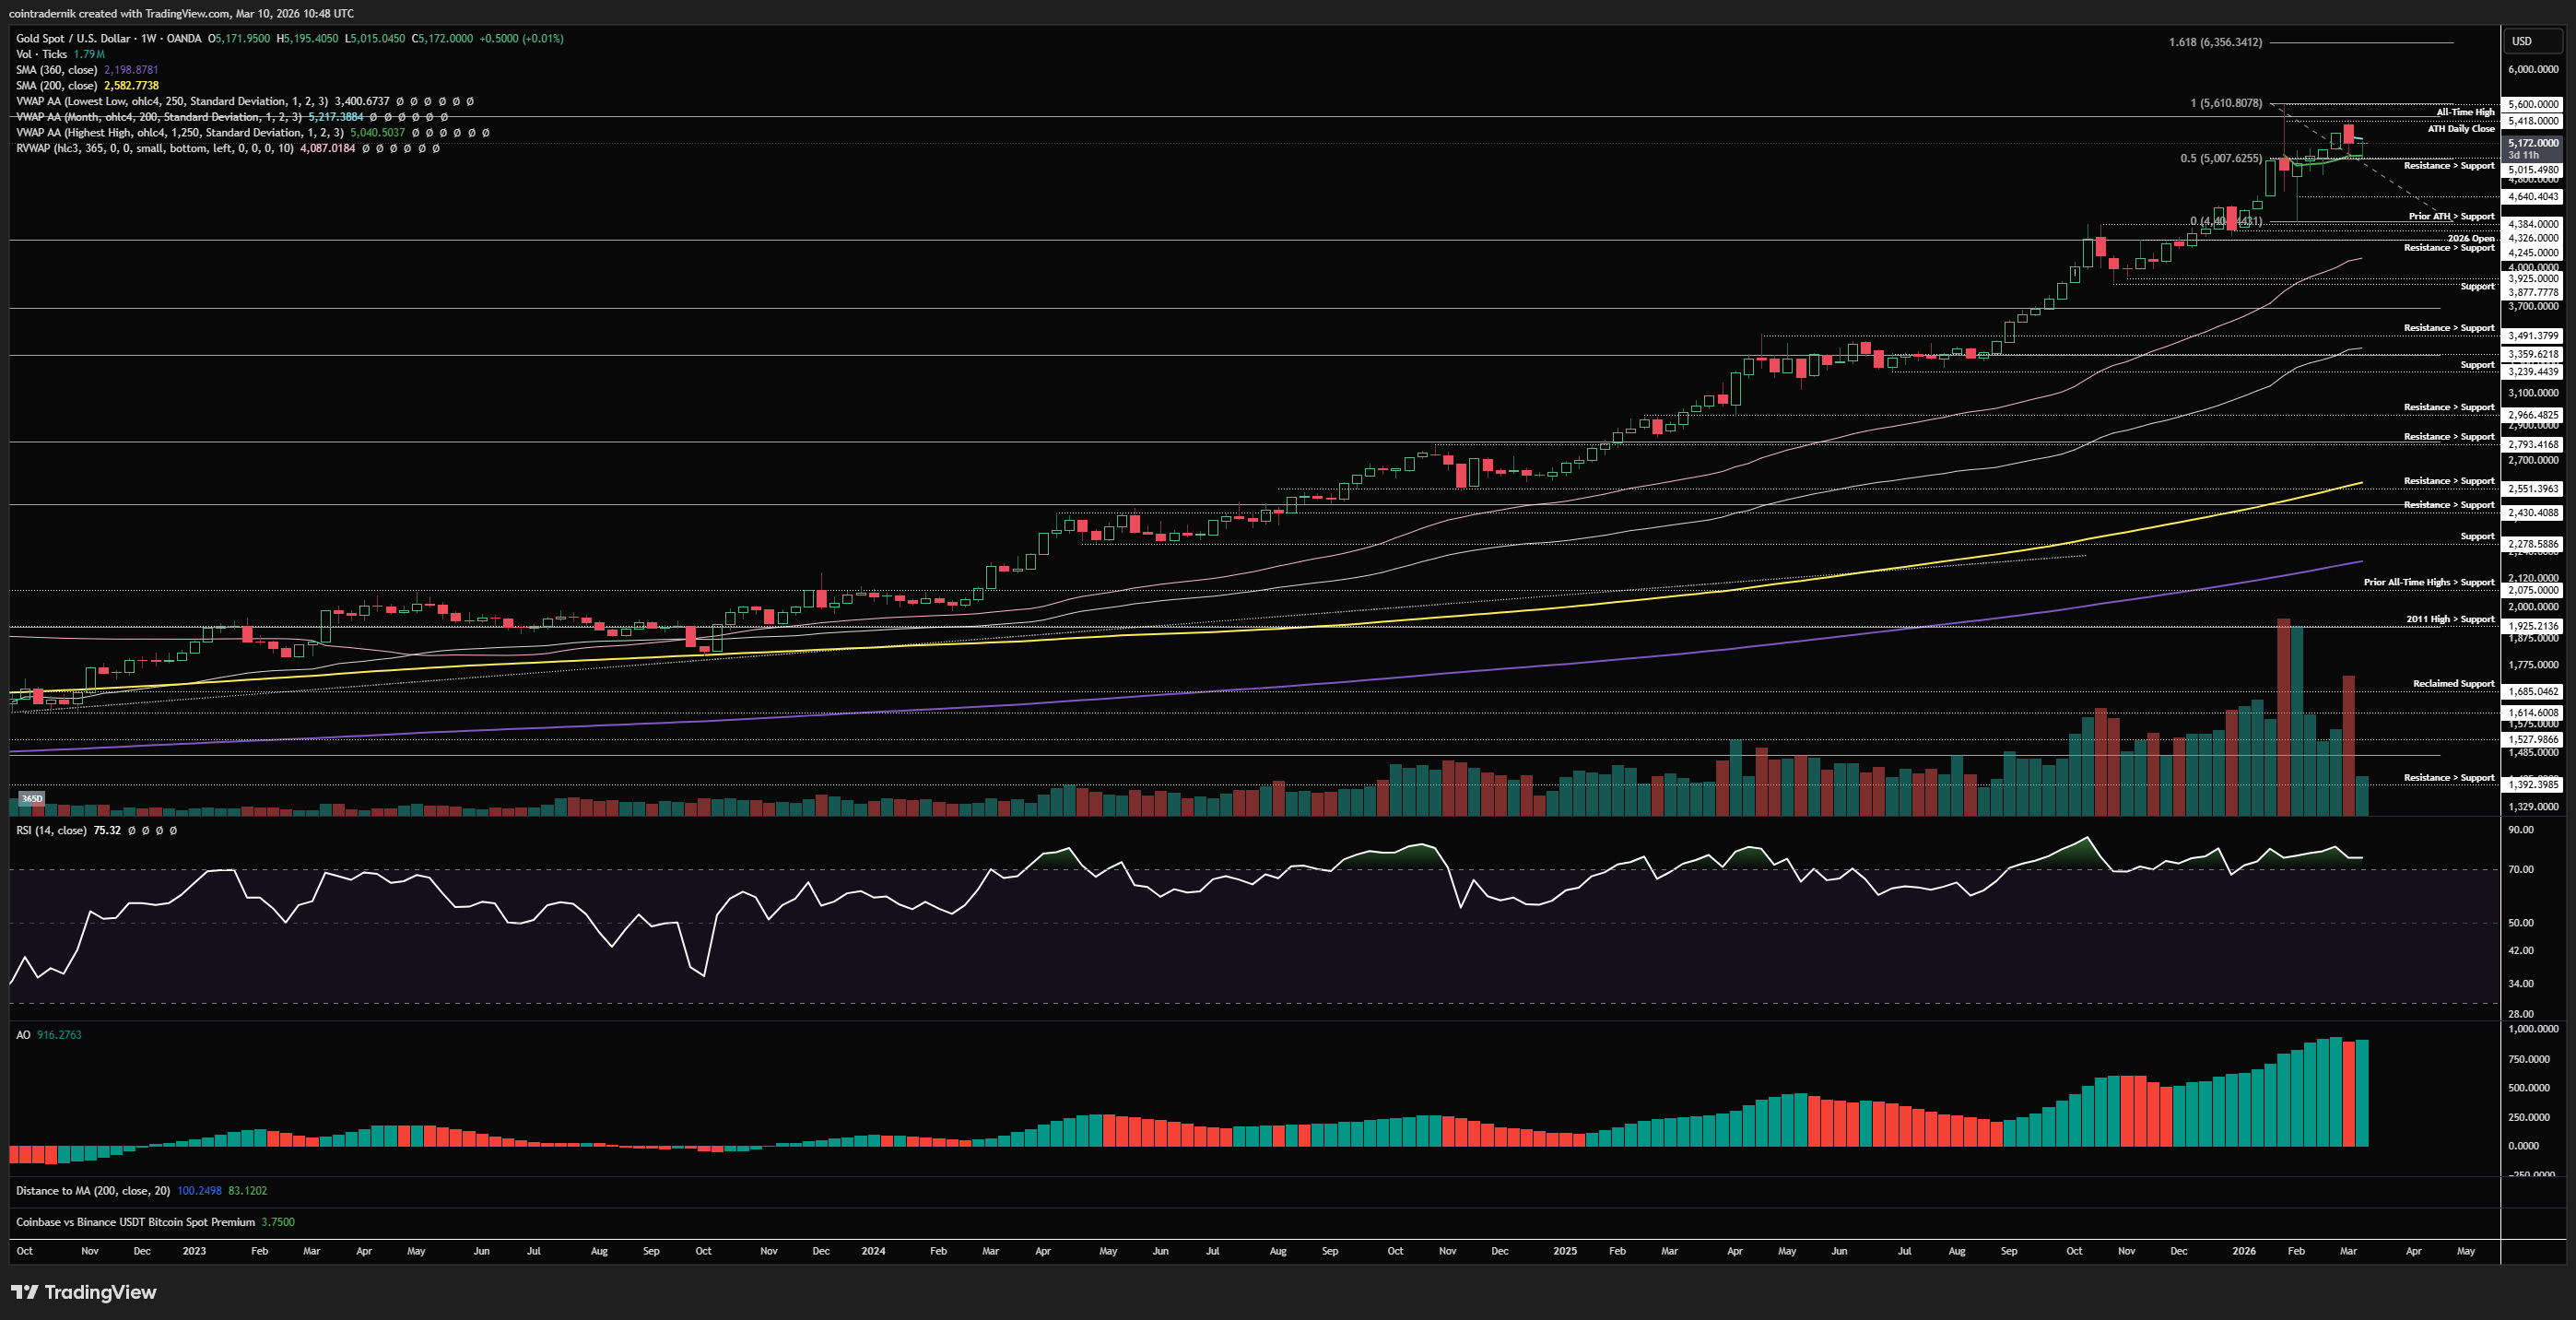
Looking at the weekly timeframe for Gold, we can see that unlike Silver it flipped its all-time high weekly close into support, confluent with that anchored VWAP from the all-time high, holding above it last week at $5015 as support and again holding above it on the retest early this week. We did reject exactly as expect last week at $5400ish, and naturally I missed my short entry and price went straight to target. Such is life. Now, given that this major cluster of resistance turned support is holding, I think it is more probable that we take out last week's high from here and potentially retest the all-time highs at $5600. I don't really like shorts unless we either wick above last week's high and break down on the lower timeframes; or we reject here below the March VWAP at $5217 and close the week below $500, in which case I think you can short every pop back towards $4400 over the coming weeks.
Daily:
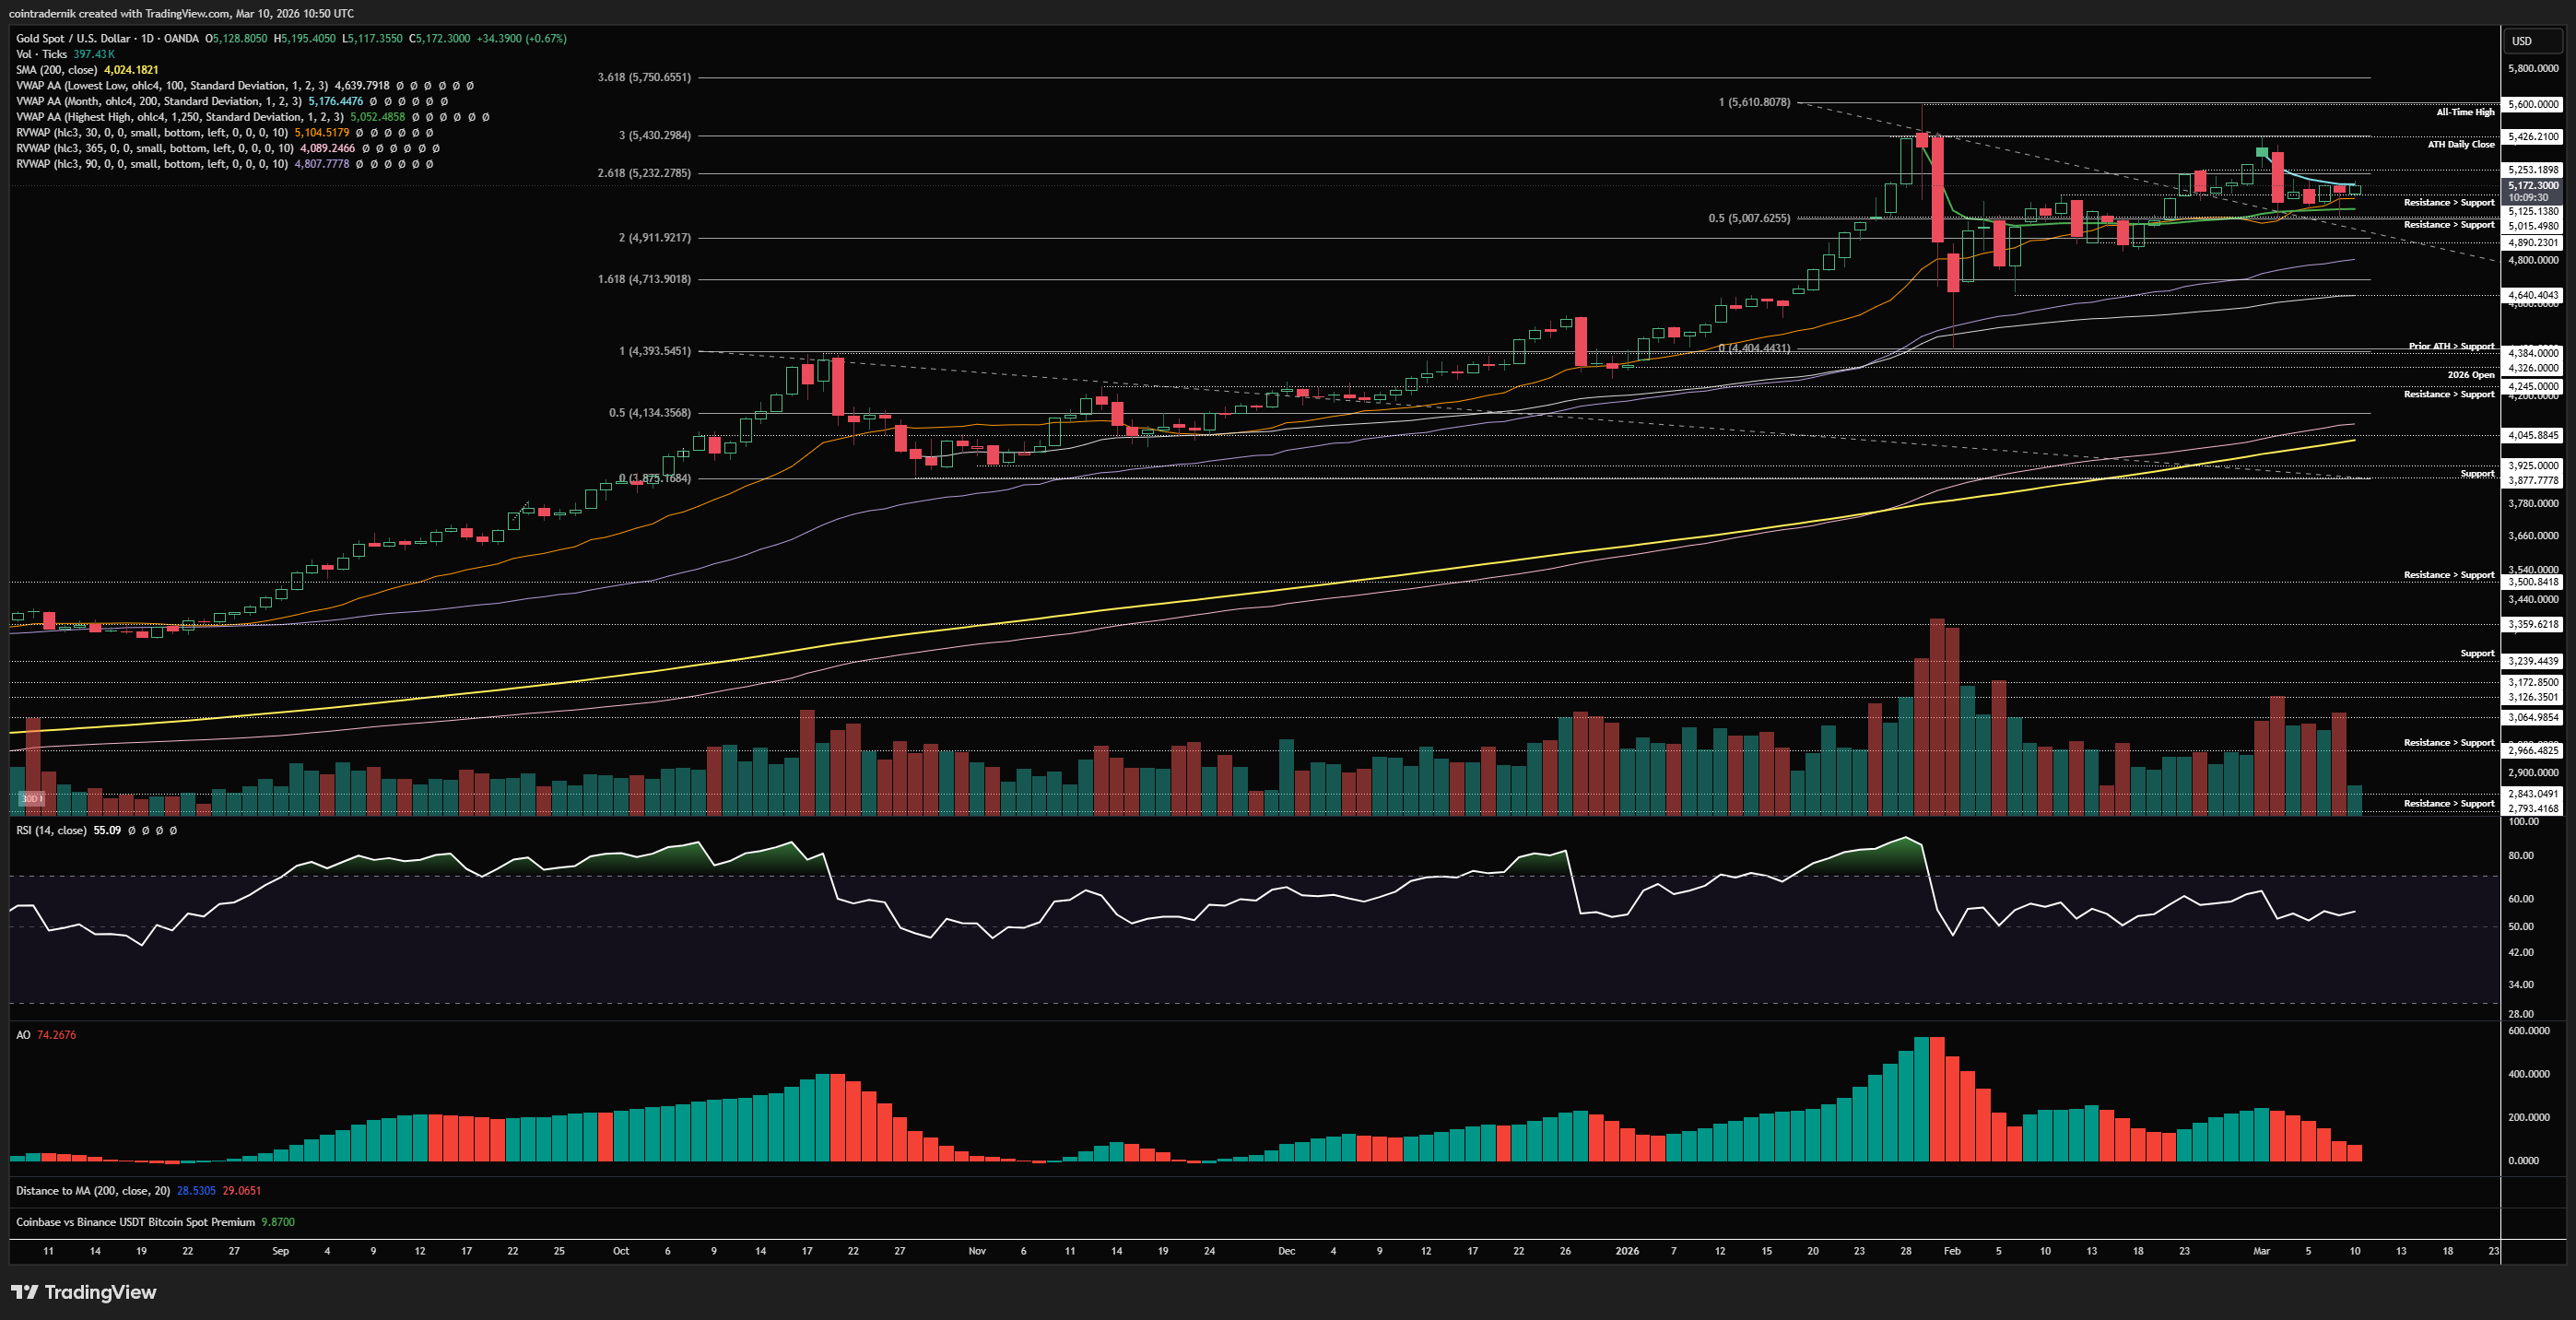
Turning now to the daily, we can see how price has been consolidating within this tightening range for a few days now, with the March VWAP as resistance and the anchored VWAP from all-time highs and the 30d rolling VWAP as support. Acceptance below $5000 would be a really nice short setup, with a daily close above the March VWAP as invalidation on that short exposure and with TP1 at $4640, followed by the $4400 retest as TP2. Conversely, acceptance above $5217 here could be nice for an aggressive long back into last week's high, but I'd want to see today close firmly above $5217 and then see how structure develops tomorrow for a tighter invalidation than $5000; I don't really want to long $52xx with such a wide stop and such a major resistance level overhead.
Price: $5.92
Weekly:

Beginning with the weekly timeframe for Copper, to be quite frank there really isn't a huge amount to update you on, with the industrial metal exhibiting a similar range-bound consolidation to that of equity indices, continuing to find support at or marginally below the yearly open and resistance at the $6 2025 high. Early price-action this week saw price wick below the 2026 open into $5.65 and find support again, holding well above the anchored VWAP from the $4.36 swing-low. I am still long Copper and Copper Miners and will only look to exit if we accept below the yearly open on Copper, where I would expect another leg lower to follow into the 365d rolling VWAP around $5.35. Until then, this is re-accumulation before continuation higher, in my view, and acceptance above $6 will be the trigger for that move through $6.60 into $7+.
Daily:
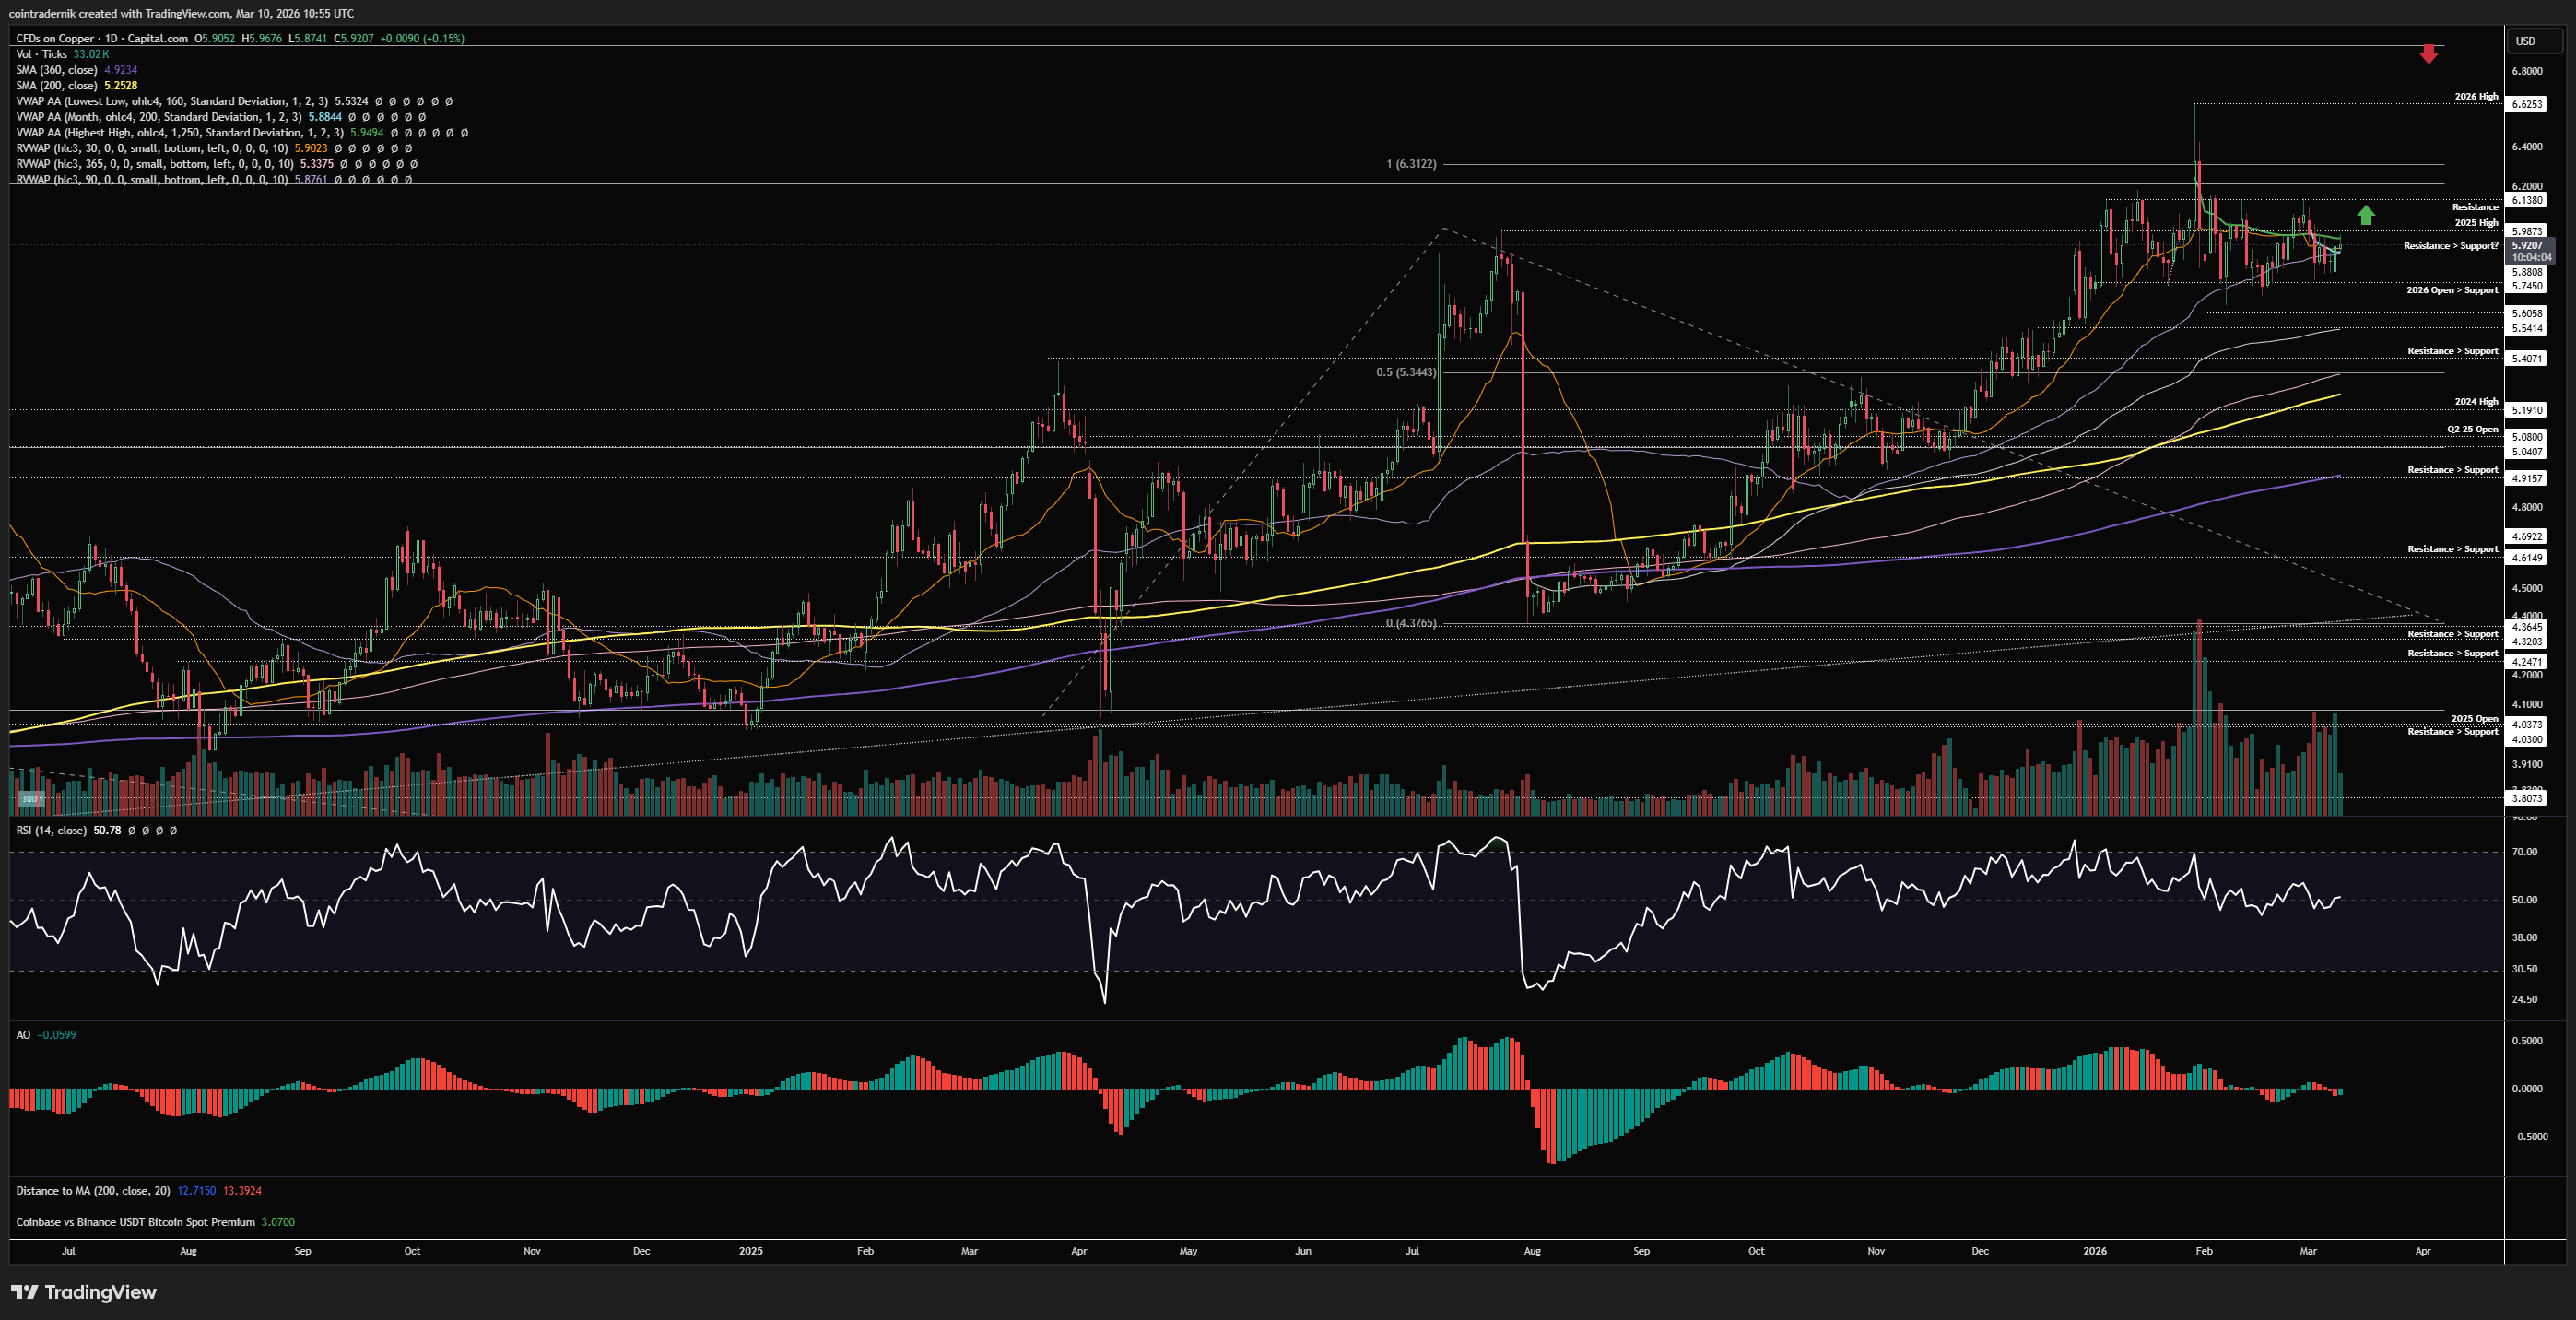
If we drop into the daily timeframe for Copper, we can see that price has been very choppy indeed but momentum is just above holding above the 50 level on daily RSI, still trading akin to that Q4 2025 environment. We wicked below the 90d rolling VWAP and 2026 open yesterday, holding above YTD lows, then bouncing to close back at daily highs, but price remains capped by the anchored VWAP from the yearly high. We did deviate above that VWAP into $6.14 but rejected a couple of weeks ago, and I would expect that the next break and close above will be 'valid' and from which we would continue through resistance towards the yearly high. Failing here again with another lower high and then closing below yesterday's low with daily RSI below 50 = I cut exposure from ~$5 and await clearer structure or a re-entry around $5.35.
Price: 157.78
Weekly:
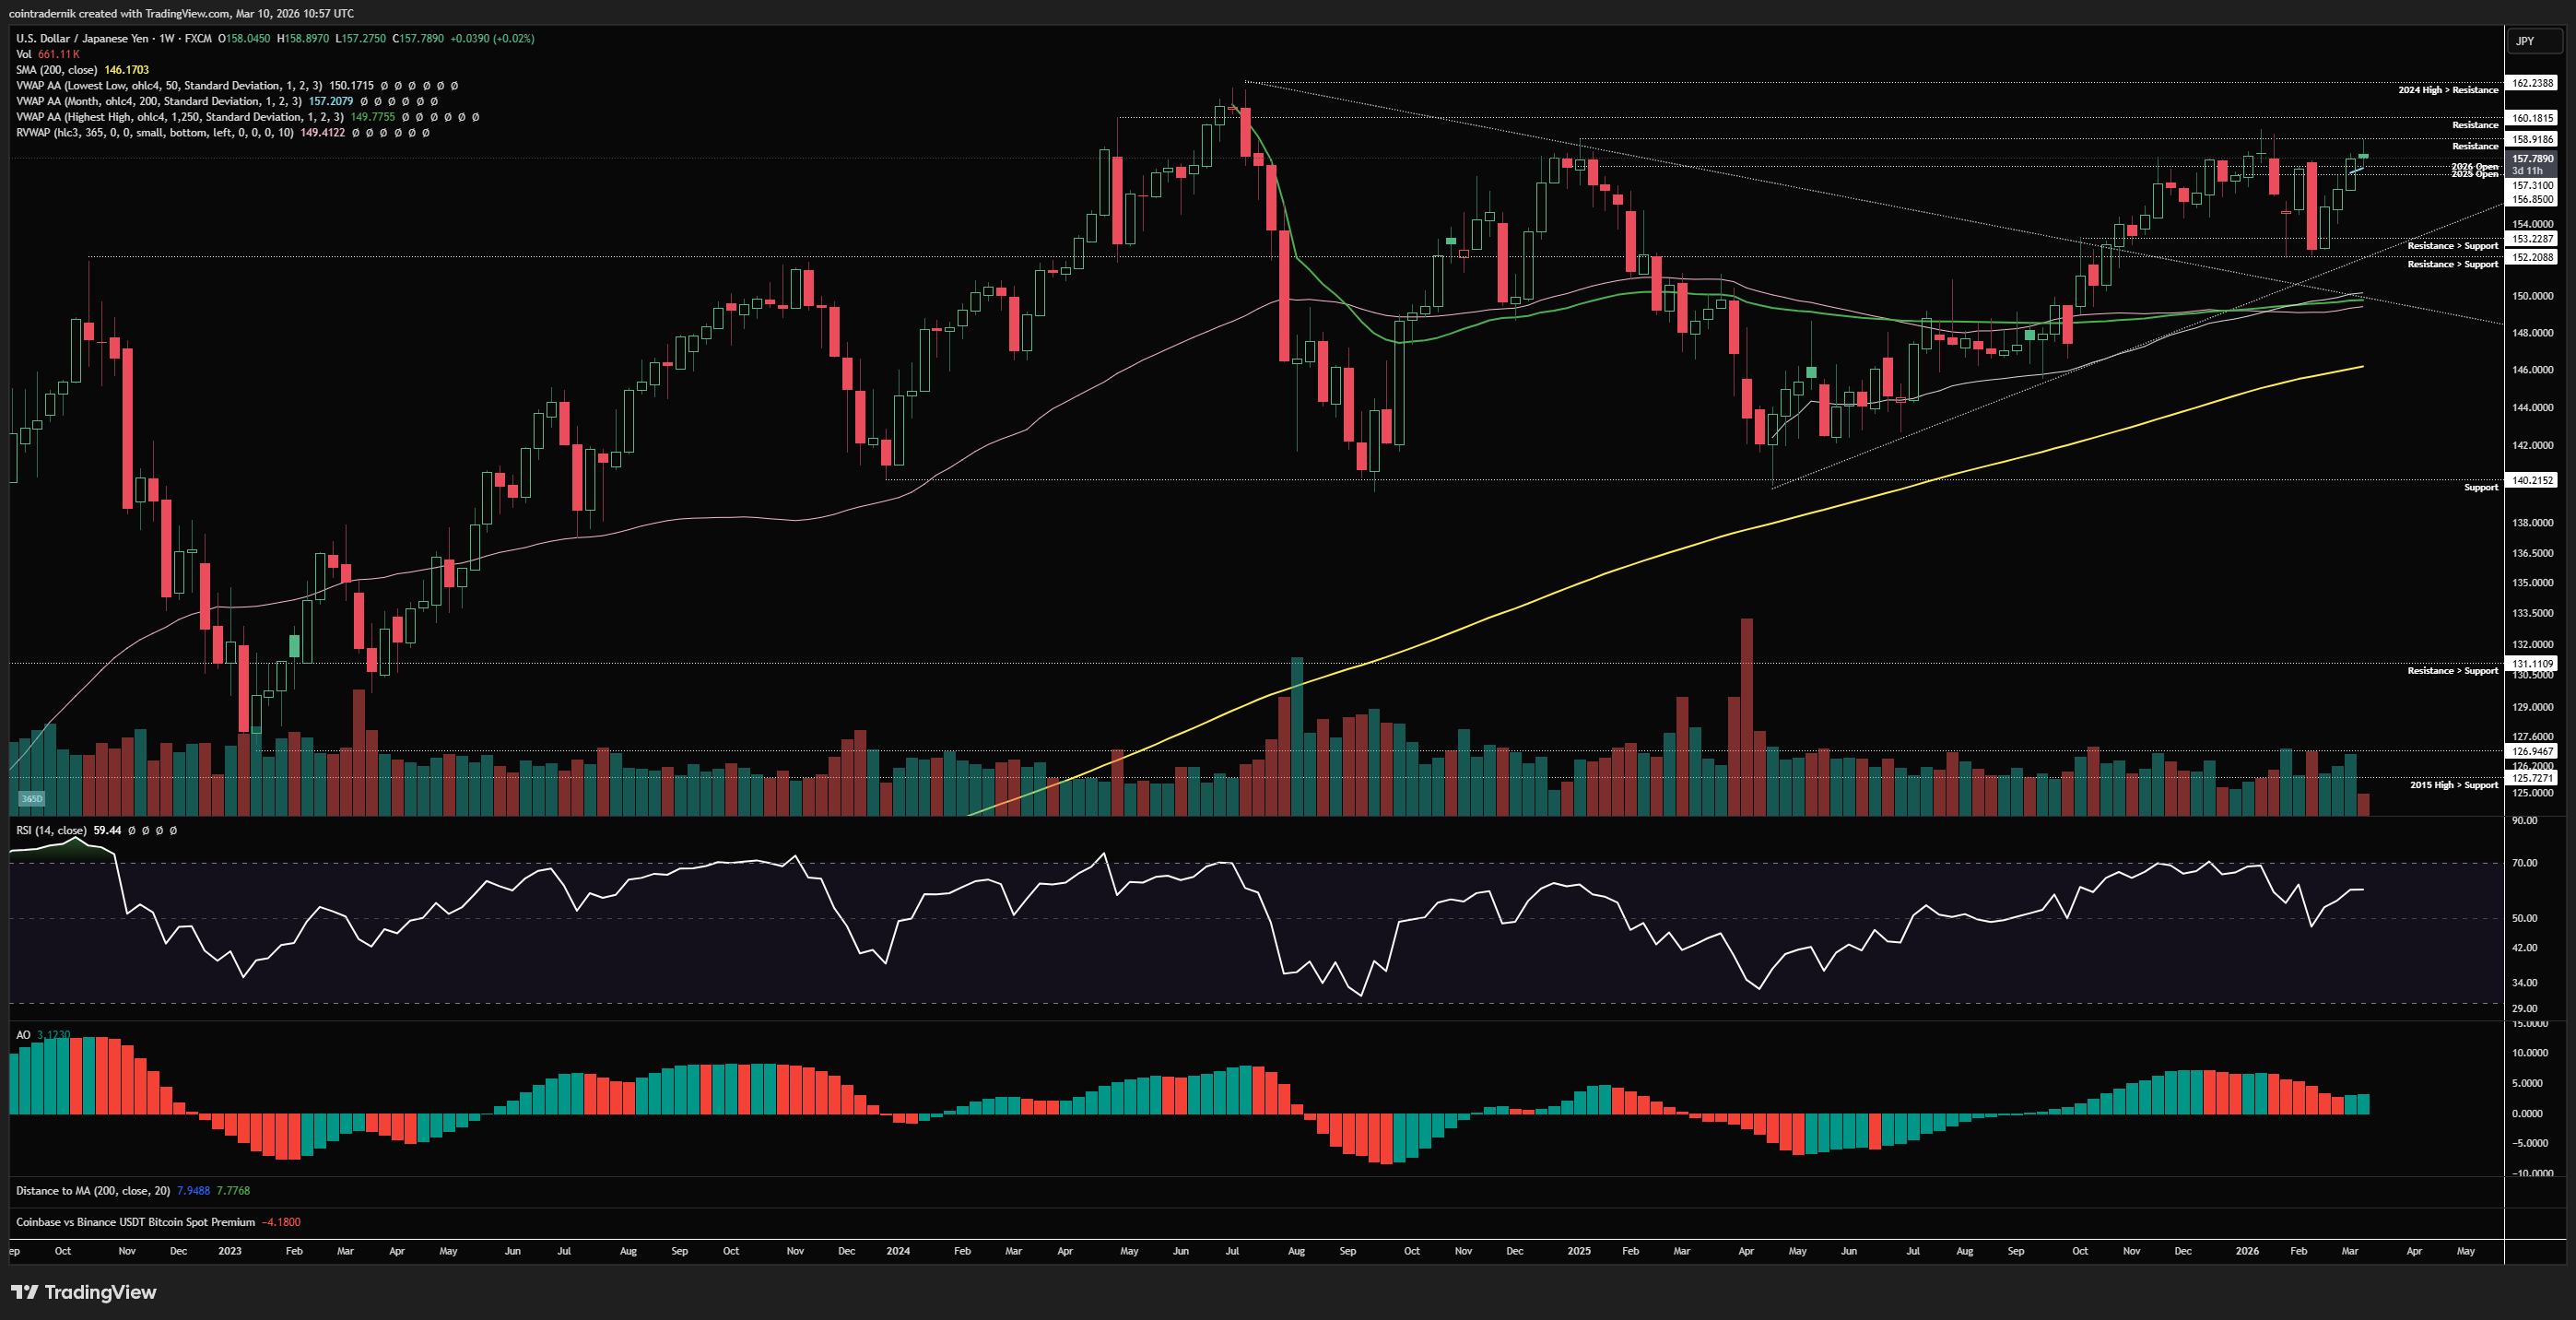
Beginning with the weekly timeframe for the Yen, we can see that price bounced exactly where it needed to at that 152.20 double bottom and v-reversed the entire sell-off, pushing through the 2025 and 2026 yearly opens last week to close above the March VWAP at 157.20. We have since pushed into resistance at 158.9 and rejected, now consolidating between the reclaimed support and yearly open and that overhead resistance. Given the strength of the bounce off that support area not once but twice and with price making fresh highs above the high that preceded the sell-off, I think some combination of chop and higher is much more probable than another sell-off and continuation through 152 here. For the time being, I do expect we just chop around frustrating both sides of the market as price is capped by multi-year resistance at 160 and holds above trendline resistance and the 152.2-153.2 range support. If we reject here and close back below 156.9, I'd look for shorts back towards 153.2, but not expect much less than that. However, if we hold above this reclaimed cluster below and can push through 160, I think trend continuation becomes much more probable, first into that 2024 high at 162.2 and then through that. Short-term, however, sideways is most probable in my view.
Daily:
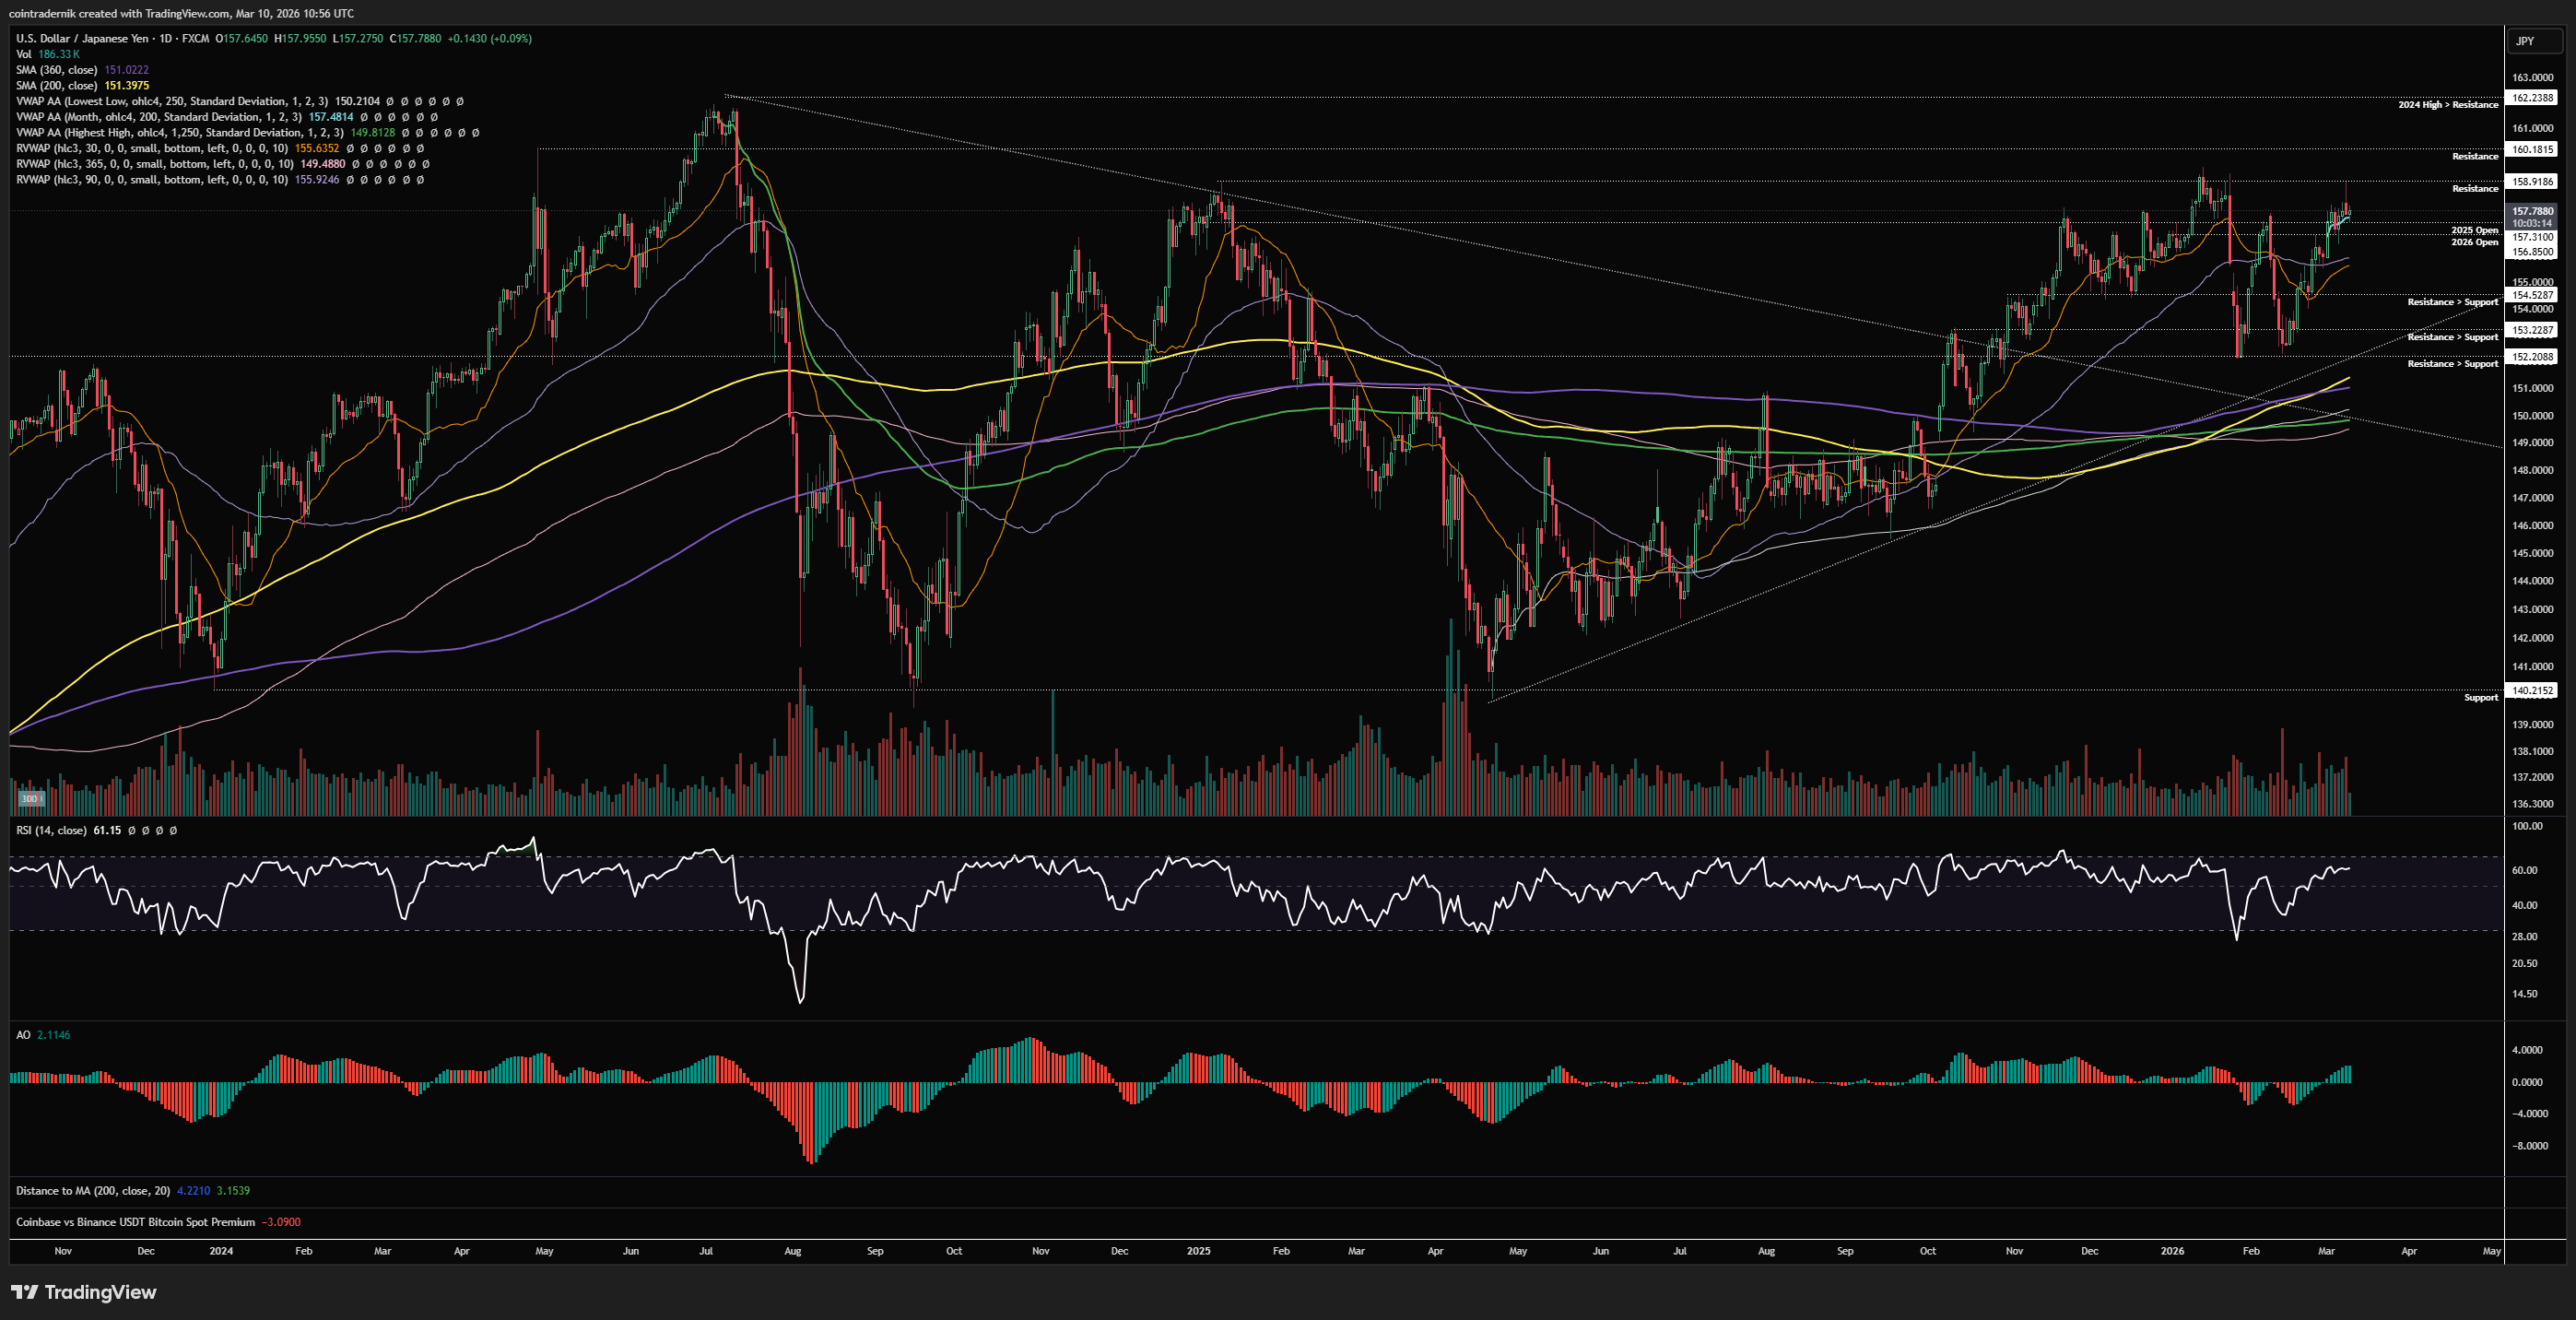
Finally, dropping into the daily timeframe, we can see that daily structure is now bullish following the higher-low and higher-high but we are now rejecting at multi-year resistance. This is a no trade zone for me on the yen, and I would really want to see this rejection lead to a break and close below 156.85 to even entertain another short back into range lows given this market structure and the clear reluctance for price to lose 152. If we break and close above 158.9 on this timeframe, I think we retest 160.18 and that's probably where you can look for some buyer exhaustion to occur on the lower timeframes to fade it back towards the monthly VWAP. I just would not be looking to play either side right here as I think there's a very high chance you get chopped apart over the next couple of weeks.
I hope you've found some value in the read this week - please RT, share, engage etc. if so!
And if you've not already signed up for Ostium, please do so and test out some of the recent updates, including:
Sign up here (you don't have to use my ref link, of course): https://ostium.app/trade?from=CL&to=USD&ref=CTNIK

.avif)