

Market Outlook #72 - Crypto Reckoning
February 9, 2026
-
12
min read


This blog references an opinion and is for entertainment and informational purposes only. It is not intended to be investment advice. Seek a duly licensed professional for investment advice.
In this special edition of the 72nd Market Outlook here at Ostium Insights, we'll be taking a look at the week ahead in markets, focusing primarily on crypto, looking at price-action, positioning and event risk for BTC, MSTR, GLXY, COIN and HOOD.
Now, let's take a look at the relatively busy week ahead, full of speeches and some key growth, inflation & labour market data, including the delayed Nonfarm Payrolls:
MONDAY: ECB PRESIDENT LAGARDE SPEECH
MONDAY: VARIOUS FED SPEECHES
TUESDAY: VARIOUS FED SPEECHES
TUESDAY: US RETAIL SALES (DEC): (CONSENSUS 0.5% VS PREVIOUS 0.6%)
WEDNESDAY: US NONFARM PAYROLLS (JAN): (CONSENSUS 70K VS PREVIOUS 50K)
WEDNESDAY: VARIOUS FED SPEECHES
THURSDAY: US INITIAL JOBLESS CLAIMS: (CONSENSUS 235K VS PREVIOUS 231K)
FRIDAY: VARIOUS FED SPEECHES
FRIDAY: US CONSUMER PRICE INDEX (YOY) (JAN): (CONSENSUS 2.5% VS PREVIOUS 2.7%)
Now, let's dig into asset-specific price-action for the week ahead, looking firstly at Bitcoin:
Price: $70,433
Weekly:
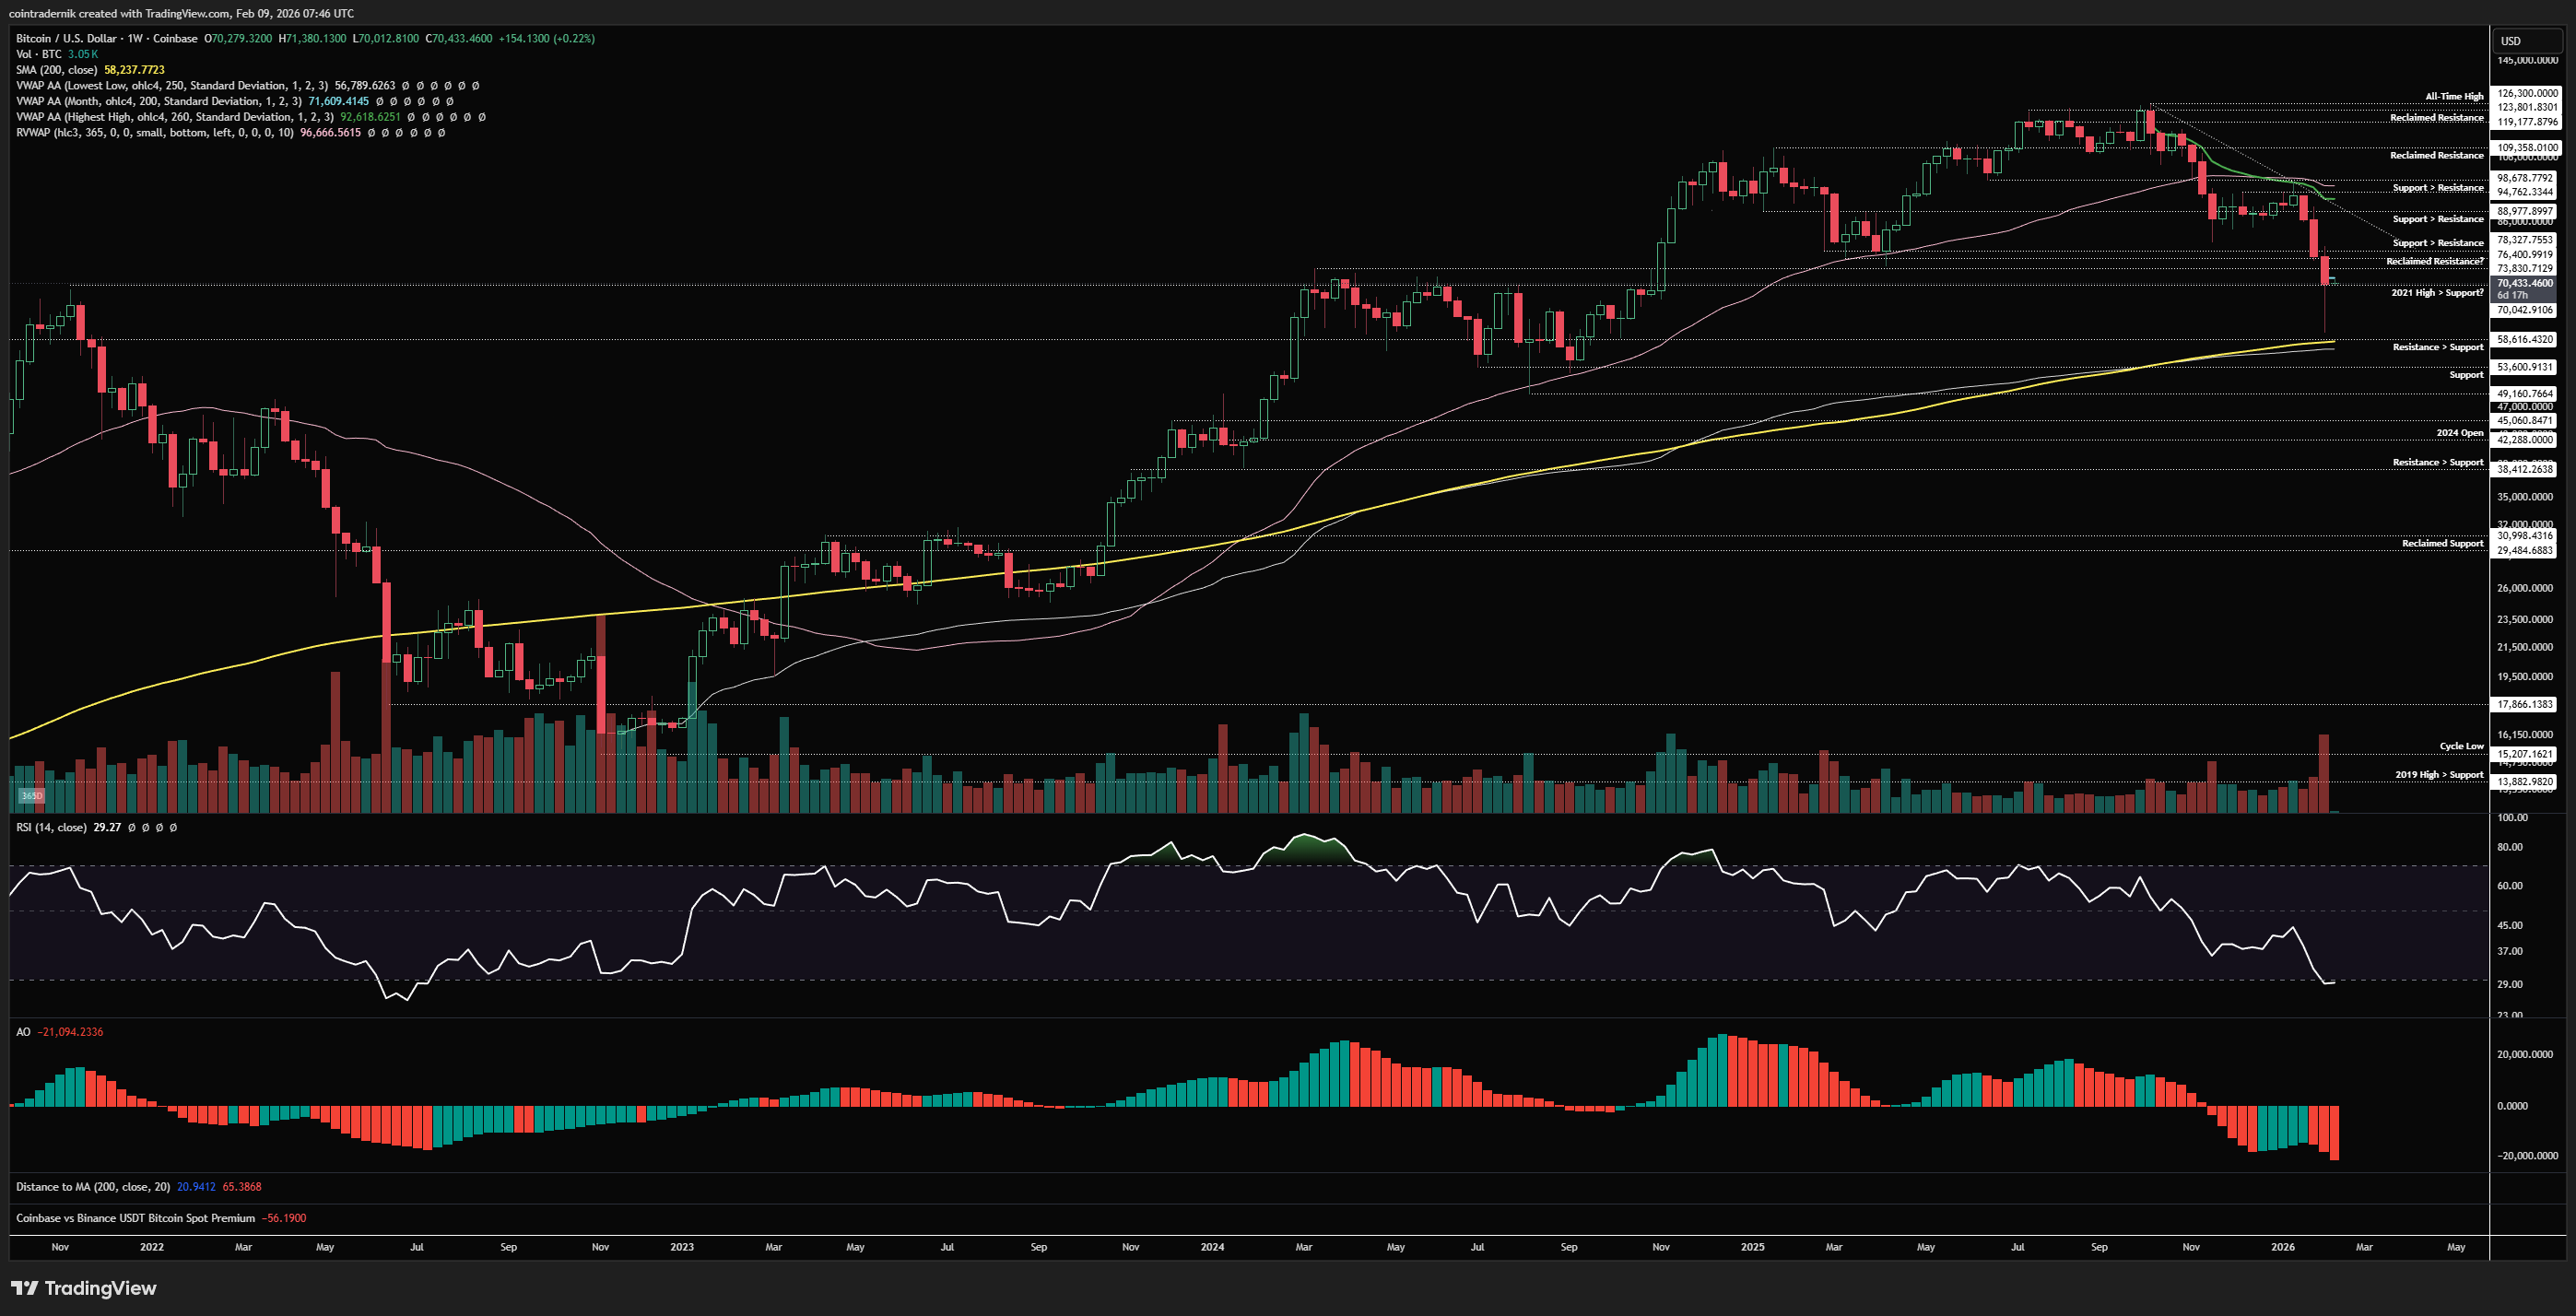
Beginning with the weekly for Bitcoin, it's pretty clear for all to see that last week was a gigantic week, with price selling off from the open at $78.4k, moving through April 2025 support at $74k, then through prior cycle highs at $69k and capitulating all the way into the 200wMA and anchored VWAP from prior cycle lows, both around $58.6k, with price marking a low just shy of $60,000. This occurred on the highest weekly volume since early 2024 on Coinbase, sending weekly RSI below 30 and printing a fresh lower-low for momentum on AO. Price bounced hard off that low, as one might expect, to close the week back at $70.3k, marginally above that prior cycle high.
It cannot be overstated how wild the move was last week into the low. As I shared on X, at ~$59k we would have been 3 standard deviations below the 365d rolling VWAP - a degree of overextension to the downside that has not occurred in over a decade of price-action for Bitcoin. This was confluent with the 200wMA and that anchored VWAP from prior cycle lows, which itself has been supportive in each successive cycle trough. Prior major lows have occurred at 2.5 std devs from that 365d rolling VWAP (with 2022 the only real outlier that made a new ~12% low below that a few months later). This shows just how violently we have moved off the highs and how relatively underextended the peak itself was.
We do now have bearish weekly structure, with the first lower-low beneath the swing-low that preceded the last all-time high, but we also have momentum and price at historical bear market troughs. In some sense, we have speedrun the Bitcoin bear market, in my view, at least as relates to price, and my view here is that we are likely to spend some time re-accumulating in this area between $58k and $74k for some time (without a meaningful positive change in liquidity conditions). A full v-reversal becomes much more probable if, over the coming weeks, we are able to flip the anchored VWAP at $92.6k into support, but that itself remains some way away at present. I do think there's a good chance we run last week's low at some point and begin to mark out a more durable bottom from that point, and I would be adding to my spot Bitcoin holdings for the first time in a long while if we do take out $60k, as I believe it presents deep value on a longer-term time horizon. Short-term, I expect price-action to be very choppy here with meaningful intraday moves in both directions, but largely capped by last week's high and low for the next week or two as we consolidate within this massive capitulation range.
Daily:
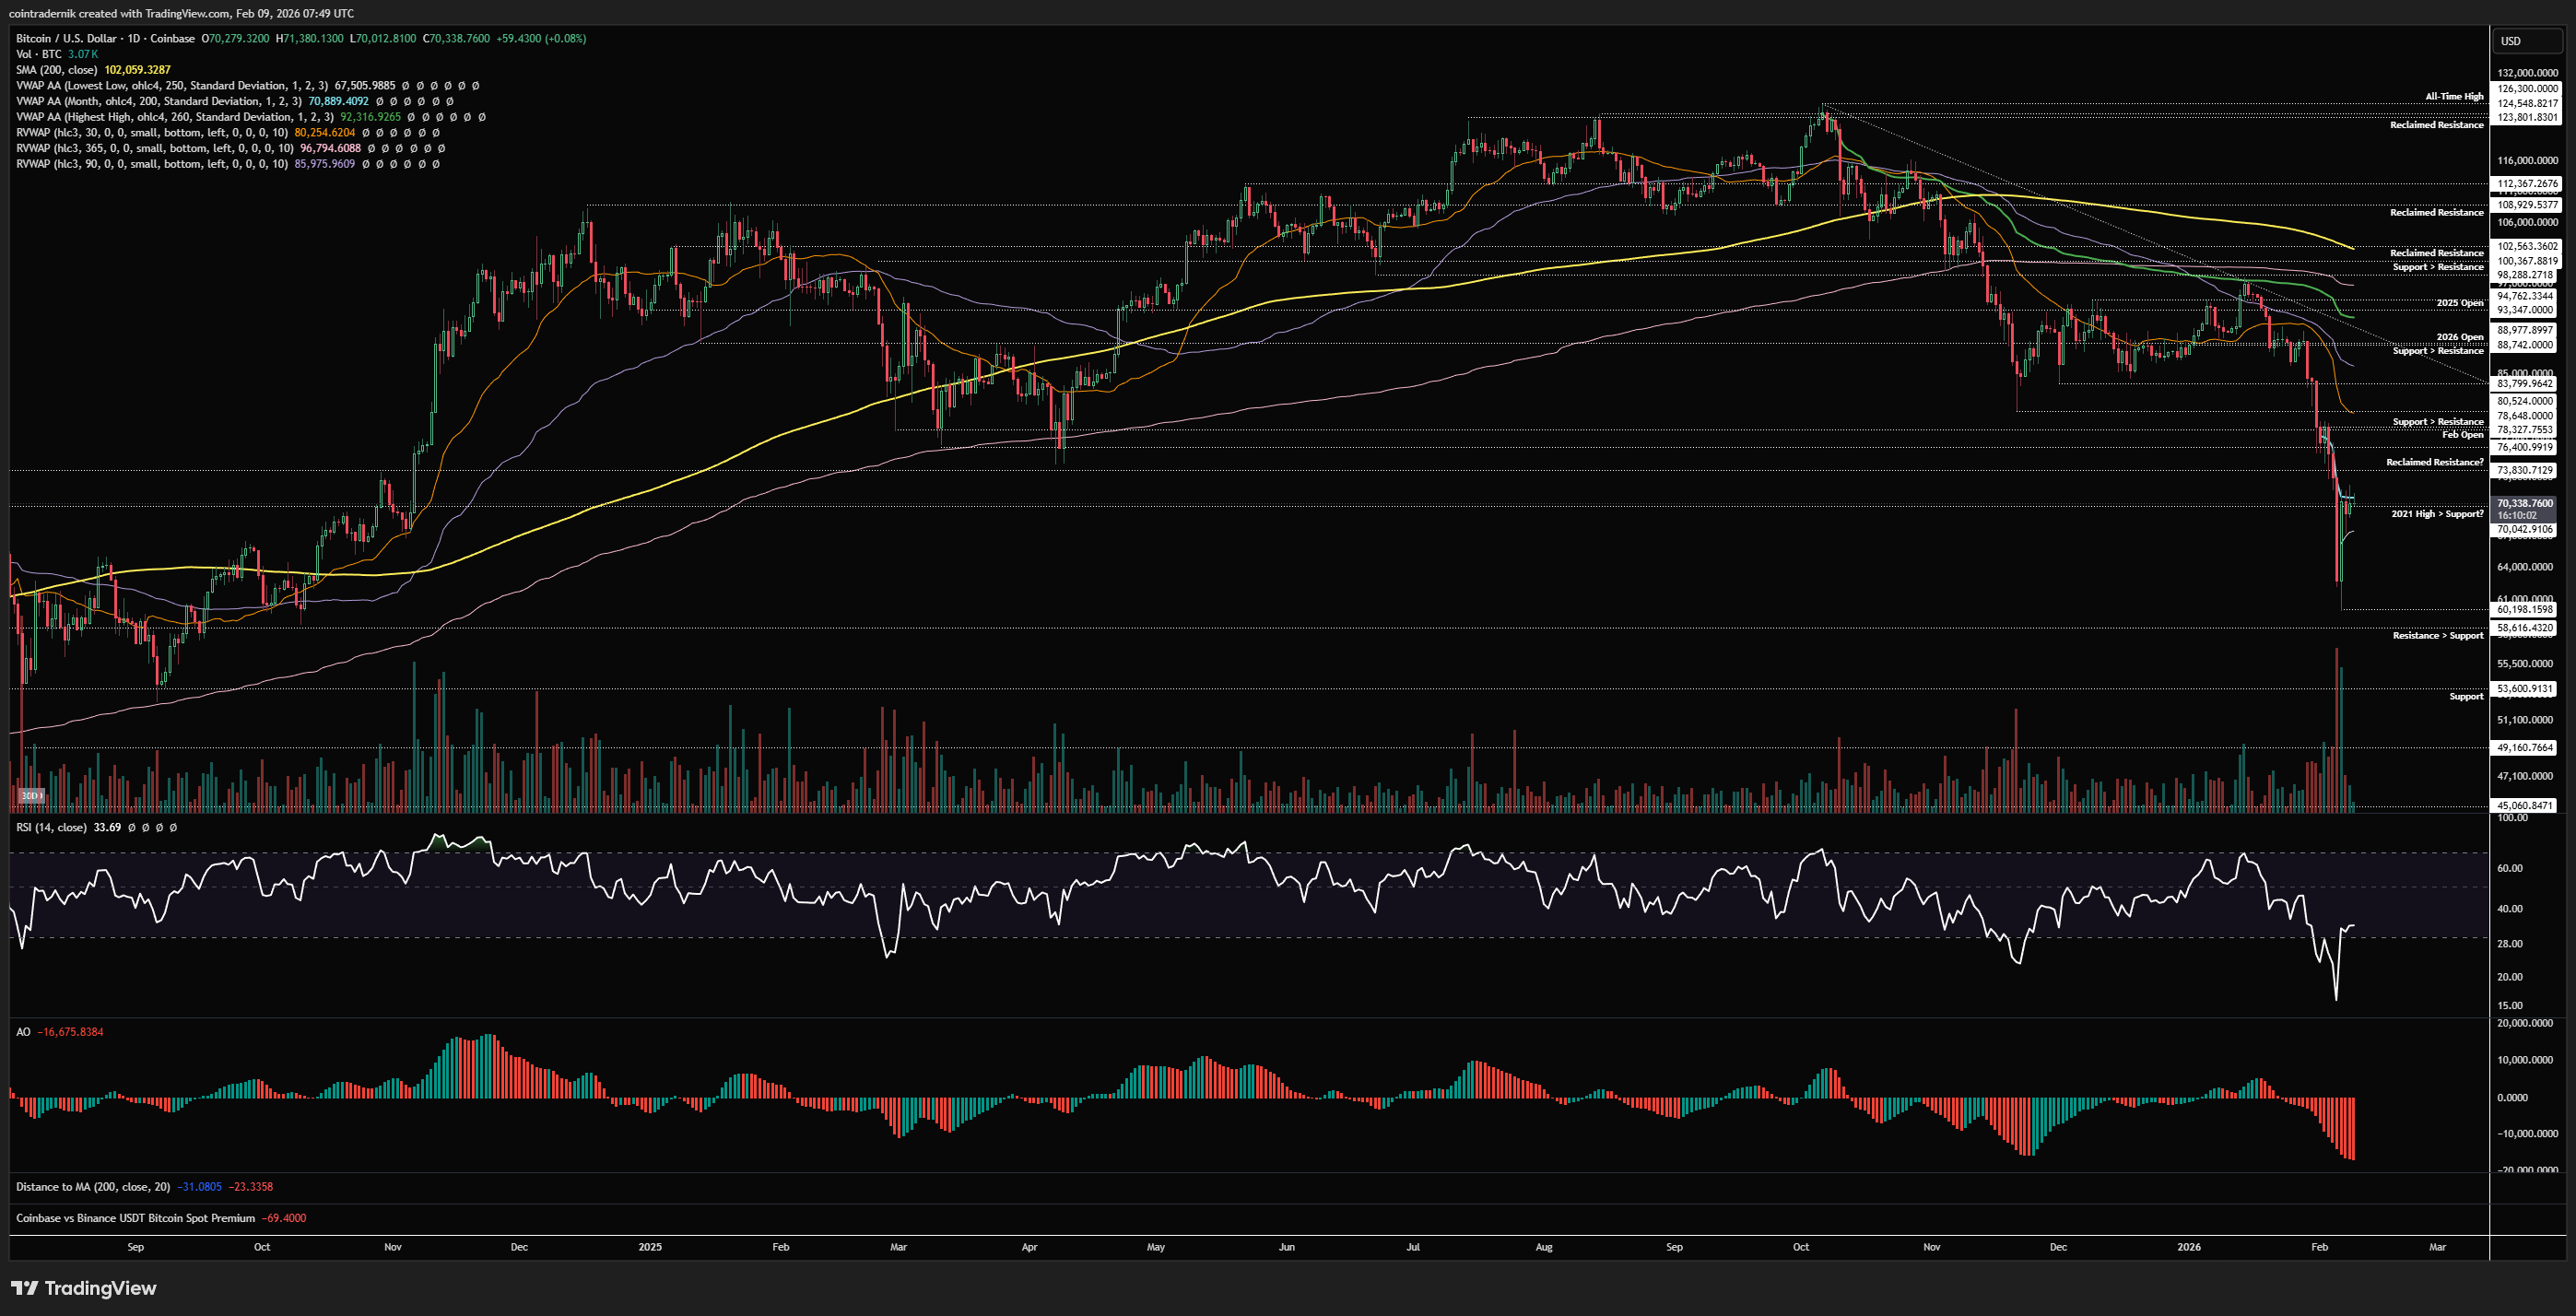
Turning to the daily, we can see the velocity of the break lower off the weekly open, with a huge move down occurring once we had lost that $74k swing-low, pushing 20% lower intraday, before puking into the $60.2k low the next morning and catching a strong bid above that historical cluster of support around $58k-$59k. Price has since been consolidating right around prior cycle highs at $70kish, capped by the February VWAP for now at $71k. We now have major support turned resistance overhead at $74k, and if we were to flip this Feb VWAP into support and then reclaim $74k on the weekly timeframe, that would be a more promising signs for that v-reversal, but until we see any signs of that it is more probable that after such an historic weekly move we chop around and consolidate inside the prior weekly range. If we break below the anchored VWAP from last week's low at $67.5k, I think we trade towards $63kish, where we can look for signs on the lower timeframes of the formation of a higher-low, or for continuation through last week's low into $58.6k. If we see the latter, I will be buying some spot as mentioned, but also be looking for an opportunity to get levered long if we see momentum divergence (which is inevitable given last week's momentum trough) and then some lower timeframe bullish structure. Importantly, I think without the expectation for 2026 being a global recession, of which I see a very low probability at present, the expectation of meaningful further downside beyond what is already objectively historic overextension is a bad bet. I think even in the likely scenario we run the low, there will be a lot of demand below $60k and significantly less supply.
Price: $134.93
Weekly:
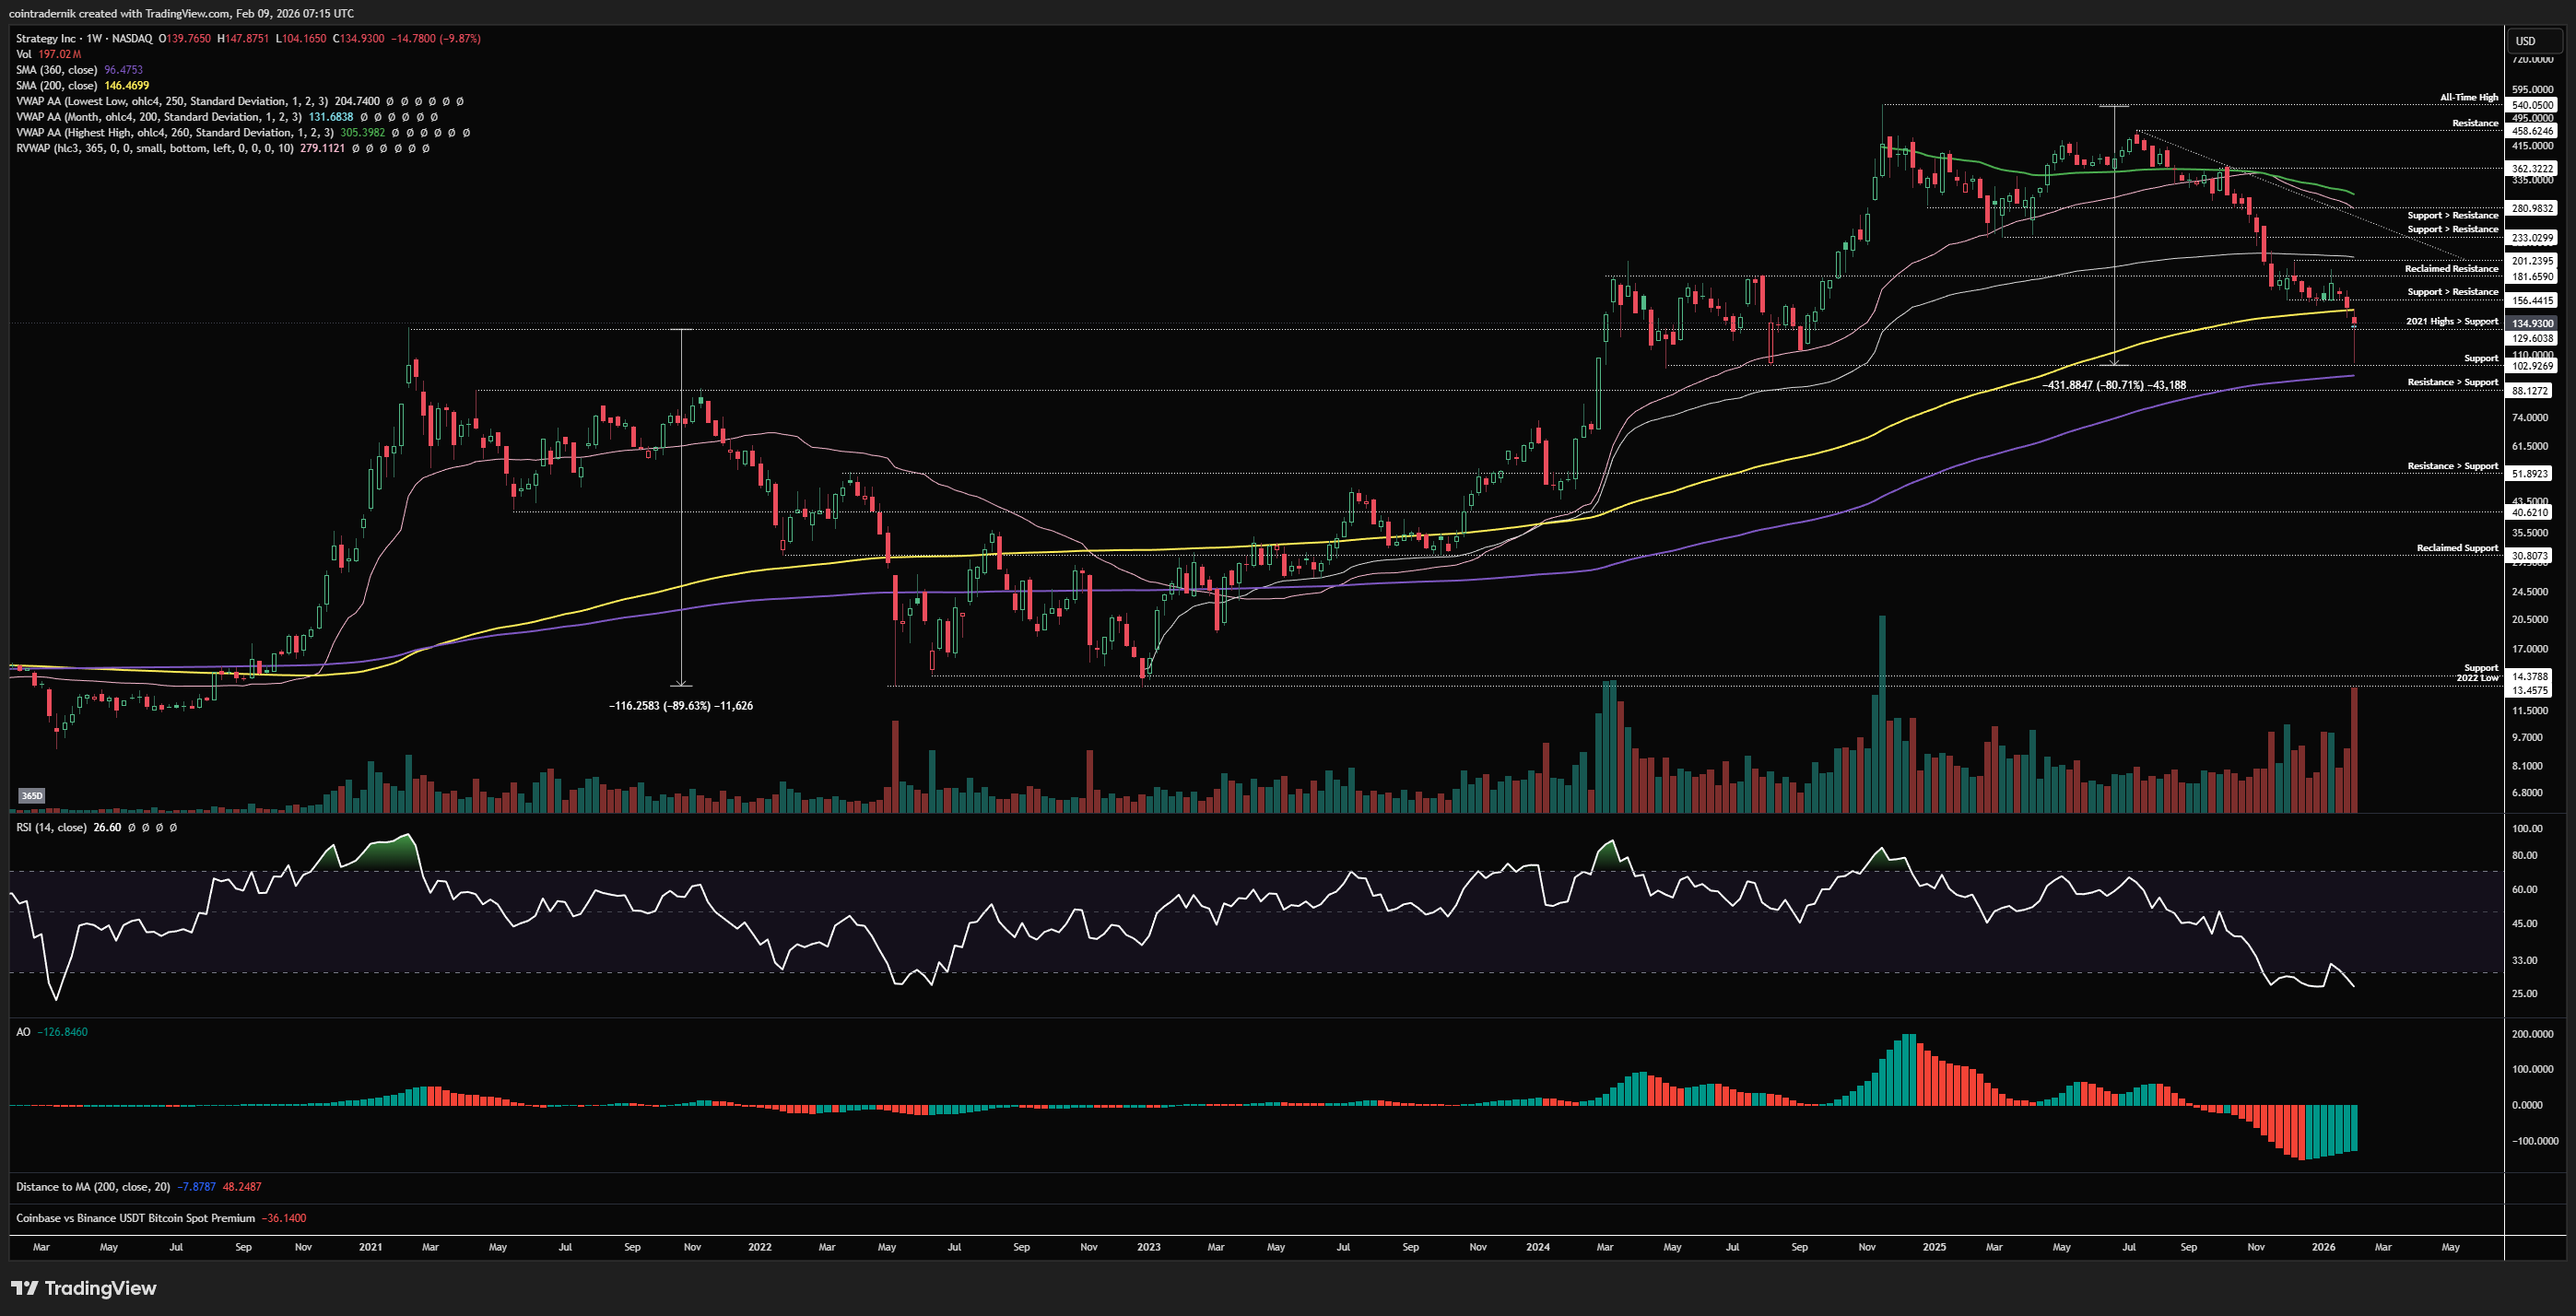
Beginning with the weekly for MSTR, we can see that price naturally also capitulated lower last week, given the movements we saw in Bitcoin, with price selling off from the 200wMA as support turned resistance into multi-year support at $100, marginally above the 360wMA. Price bounced at $103 following the Microstrategy earnings call, with some narrative fears potentially quelled around quantum (though I believe these fears were fed by price-action and not the other way around), leading to a bull market-esque rebound off the lows into $135 at the close, back above the 2021 highs. Momentum is also at historical troughs, again as one would expect, and price tagged ~81% off the all-time highs, not far off the 89% drawdown tagged in the previous bear market.
Given all of the above, I think it is looks very much like the capitulation low is in for MSTR, but again I would not be highly expectant of a v-reversal here, rather expecting prior support at $156 to cap the upside short-term and price to range within last week's candle for a couple of weeks at least. Again, I think there is a decent chance we could run that low, but the range between $88-$103 is likely to provide a more durable bottom, and I think it is highly unlikely we break the bottom of that range at all (without a global recession). Instead, I think we should expect to see something like a compressed version of May 2022 - Dec 2022 for Microstrategy, likely occurring much faster given the very different macro backdrop now versus then, where price moves sideways here, perhaps takes the low at $104 and then begins to mark out some bullish structure from there akin to early 2023 as we move into Q2 of this year. Whilst it is obviously evident that MSTR has played out its own bear market, I do not believe this is some sort of harbinger of death for the rest of risk assets this year. Instead, I think it is likely that MSTR (and crypto more broadly) has dealt with its own issues and has speedrun its own bear market, and any corrective price-action in equities between now and Q3 likely just leads to more grinding chop for crypto rather than meaningful continuation of the trend lower.
Daily:
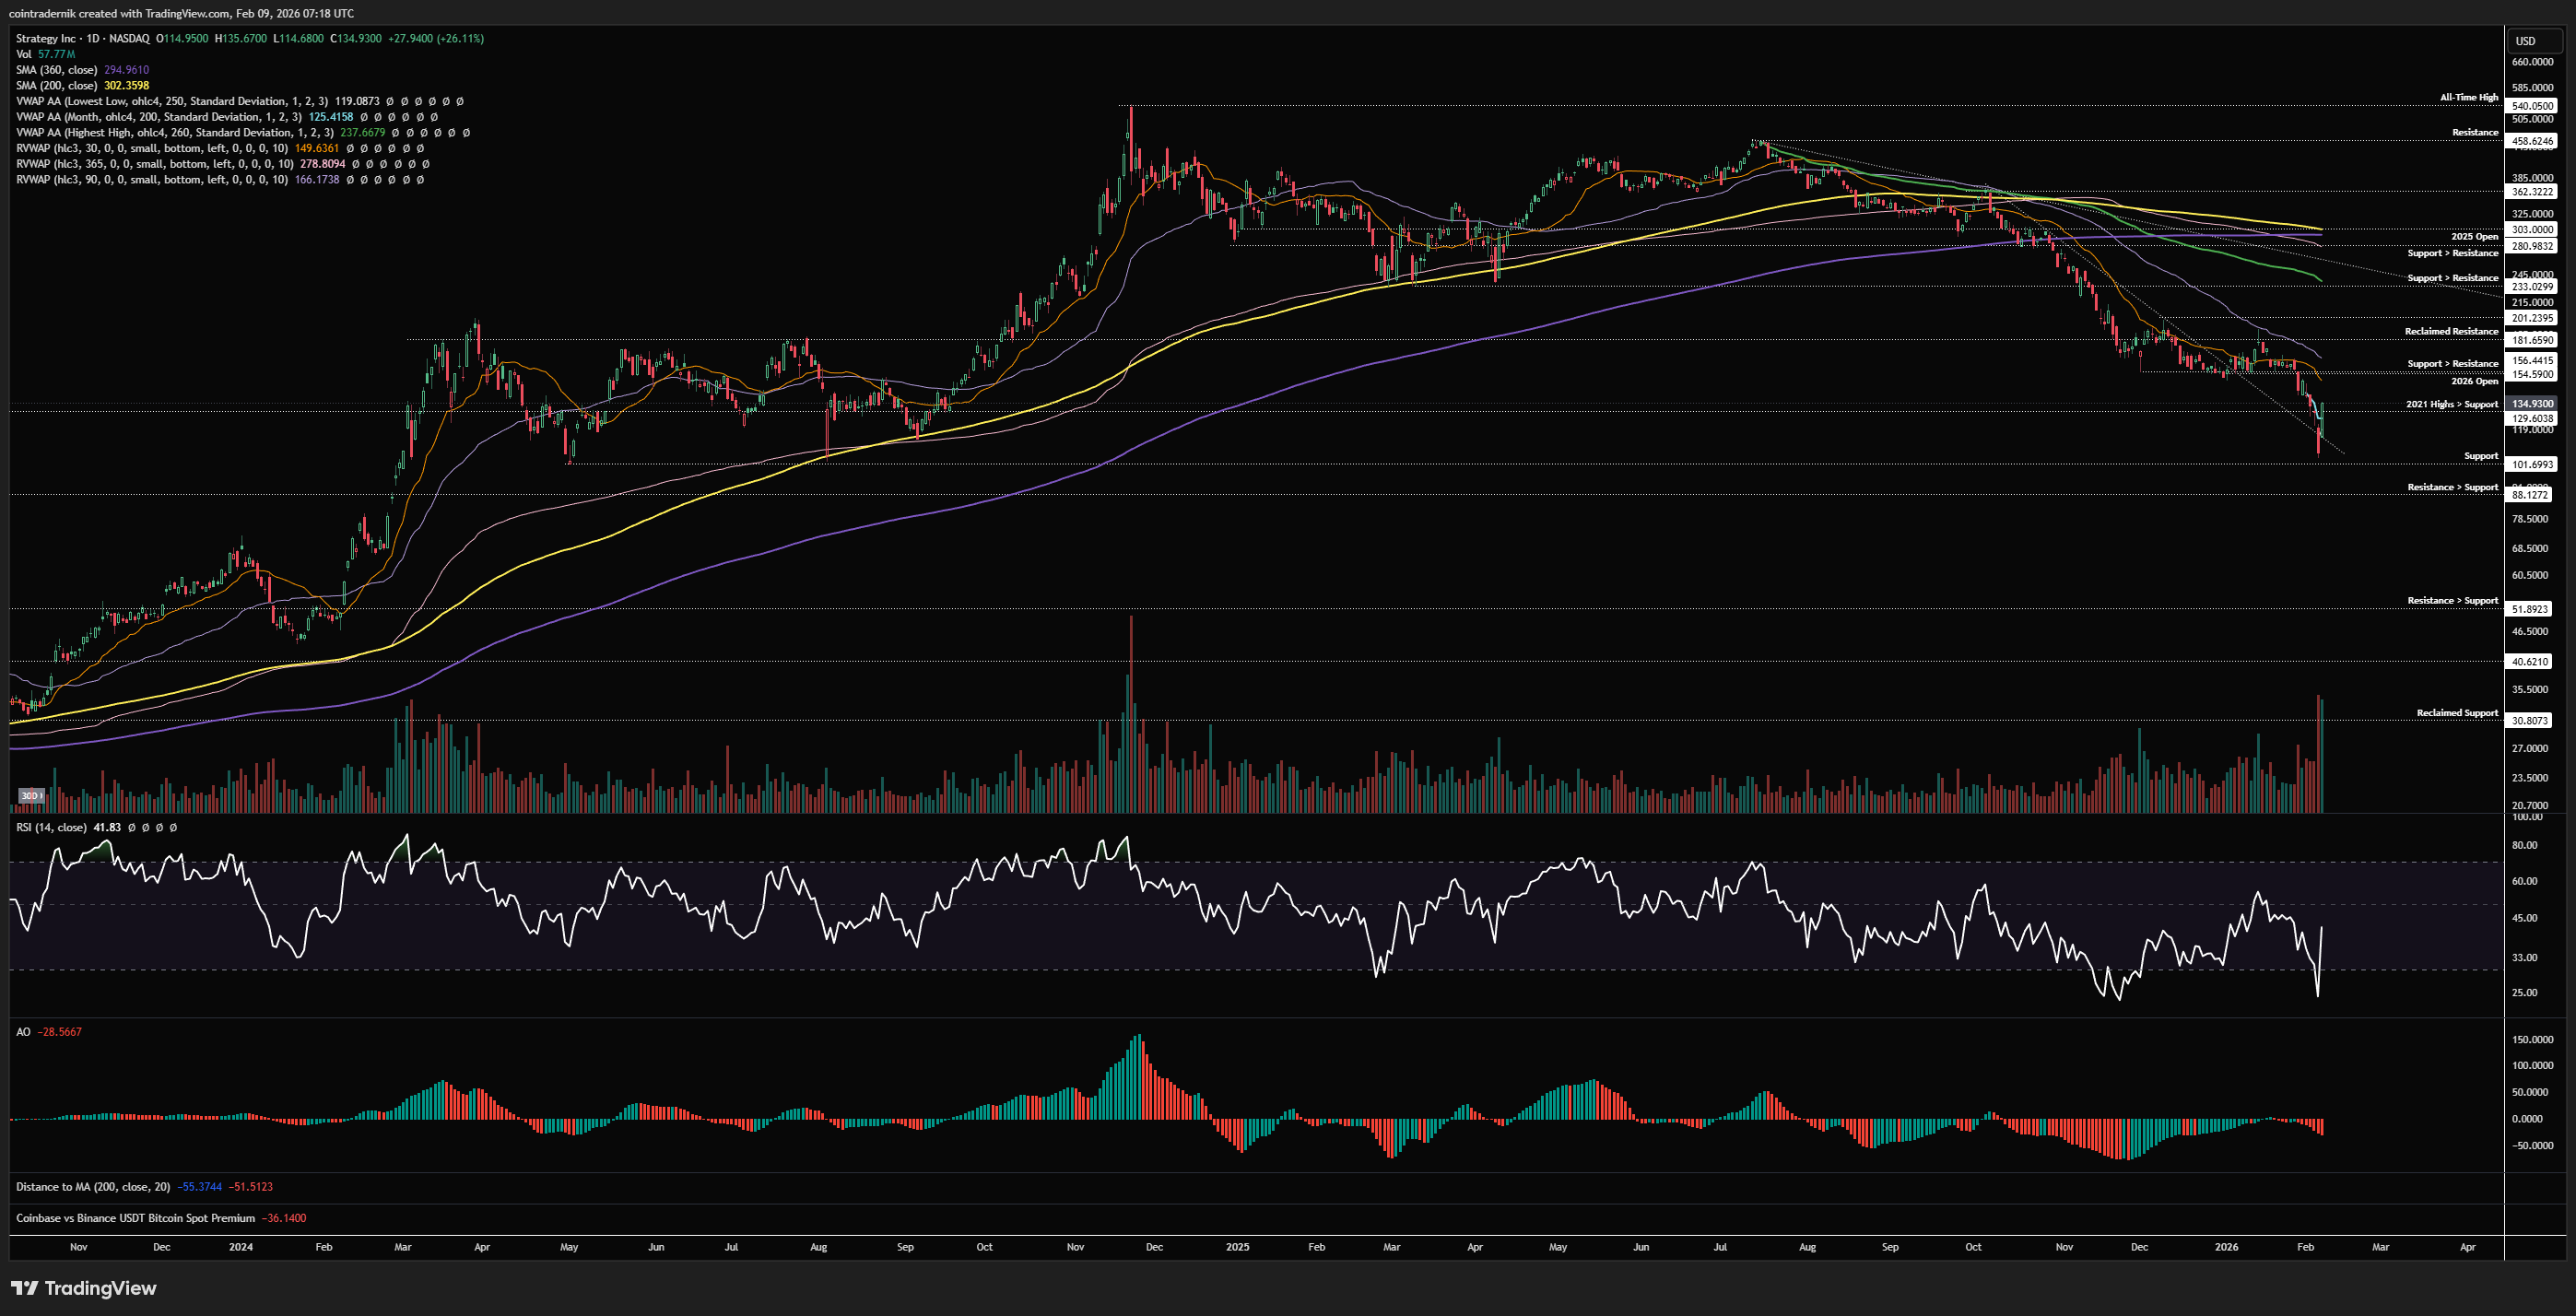
Turning to the daily, we can see that price bounced off prior trend resistance turned support last week on that capitulation candle, with significant volume traded into the low. Structure remains bearish despite the bounce and we need to see the formation of a higher-low and then a higher-high in order to shift this, which at present would be back above the swing-high at $180. Given how far away that remains, I do think we can look to the 30d rolling VWAP here, where a reclaim of $155 and then a subsequent higher-low above the 30d rolling VWAP would also look promising for continuation higher. Until we see any of that, however, I would view $155 as major support turned resistance, where you could look to fade a pop into that area with $180 as invalidation and look for a return towards the bottom of the range above $100. Not much else to add here for the time being...
Receive the latest updates directly to your inbox

Price: $26.91
Weekly:
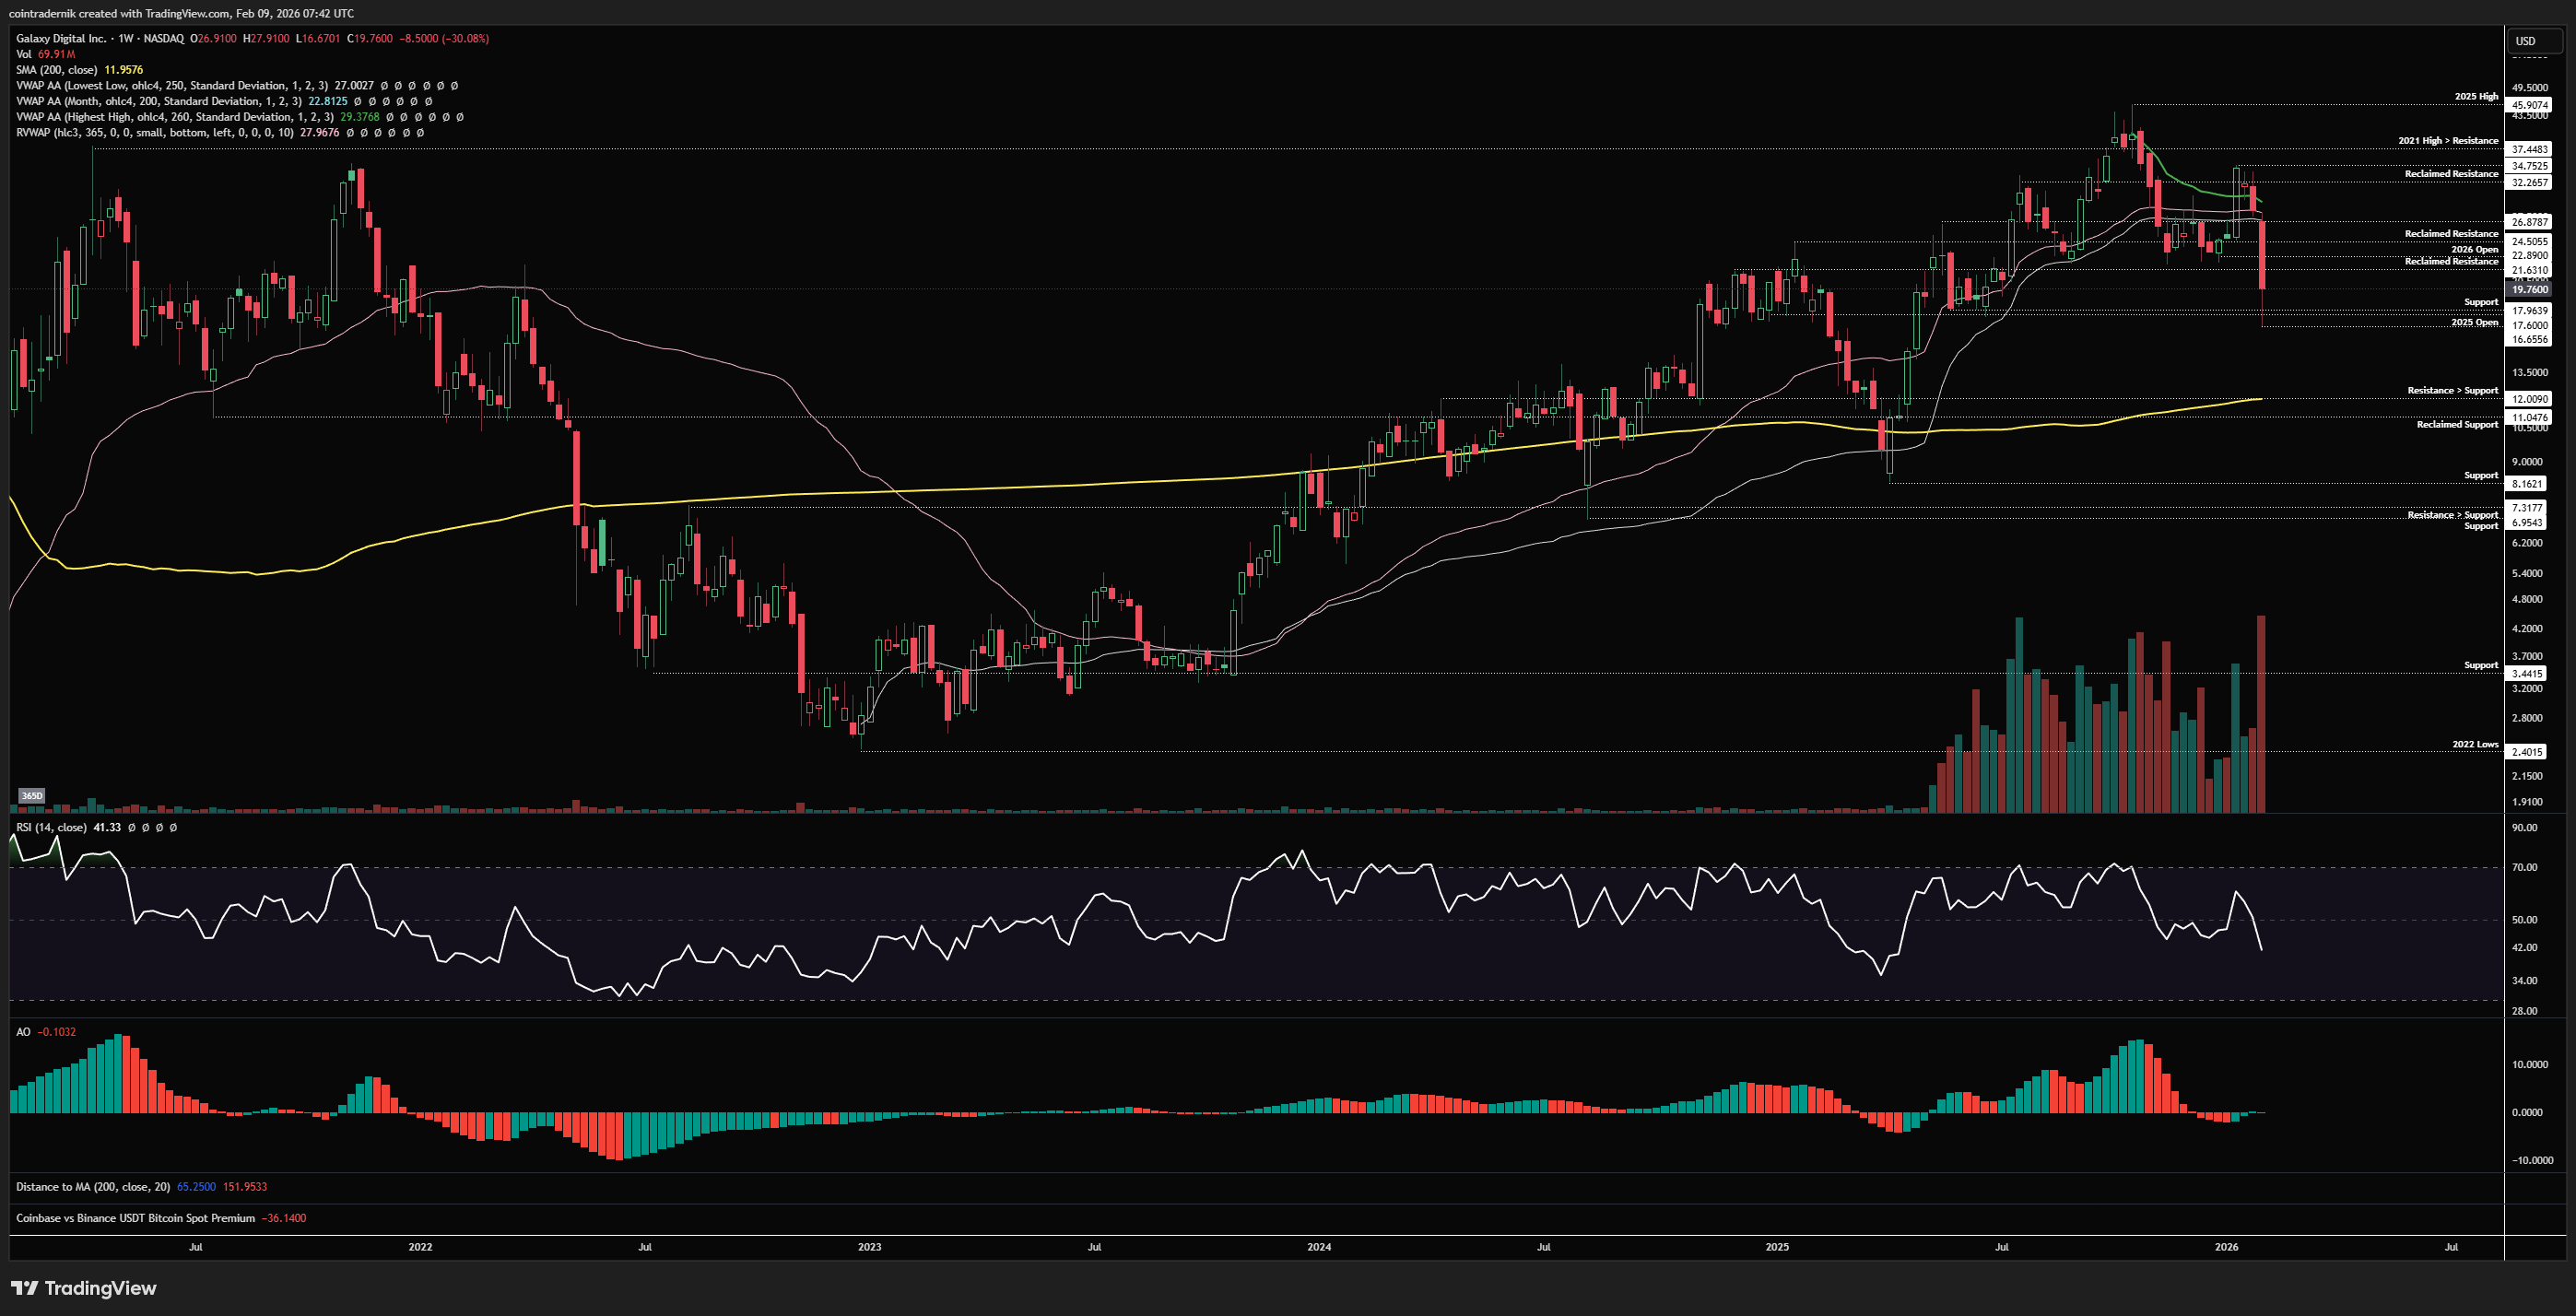
Beginning with the weekly for GLXY, we can see that last week was a brutal one, with price having marked out that lower-high at $34.75 as a nasty bull trap above the anchored VWAP from all-time highs a few weeks ago, rejected and closed back below that VWAP the week before last and then rug-pulled from the open last week. Price found resistance at the 365d rolling VWAP and the anchored VWAP from the 2022 lows around $26.88, which had been acting as support, then puking through multi-month support at $21.63 and sweeping the $17.60 support (also the 2025 open) into $16.65 before bouncing to close the week at $19.76. Nonetheless, weekly structure is now firmly bearish, as is momentum with that lower-high and lower-low. Looking purely at price-action, structure and momentum here, rallies should be sold whilst price remains below $27, with a view towards a leg lower from here back into the 200wMA as major support at $12, where longs become much more favourable.
Daily:
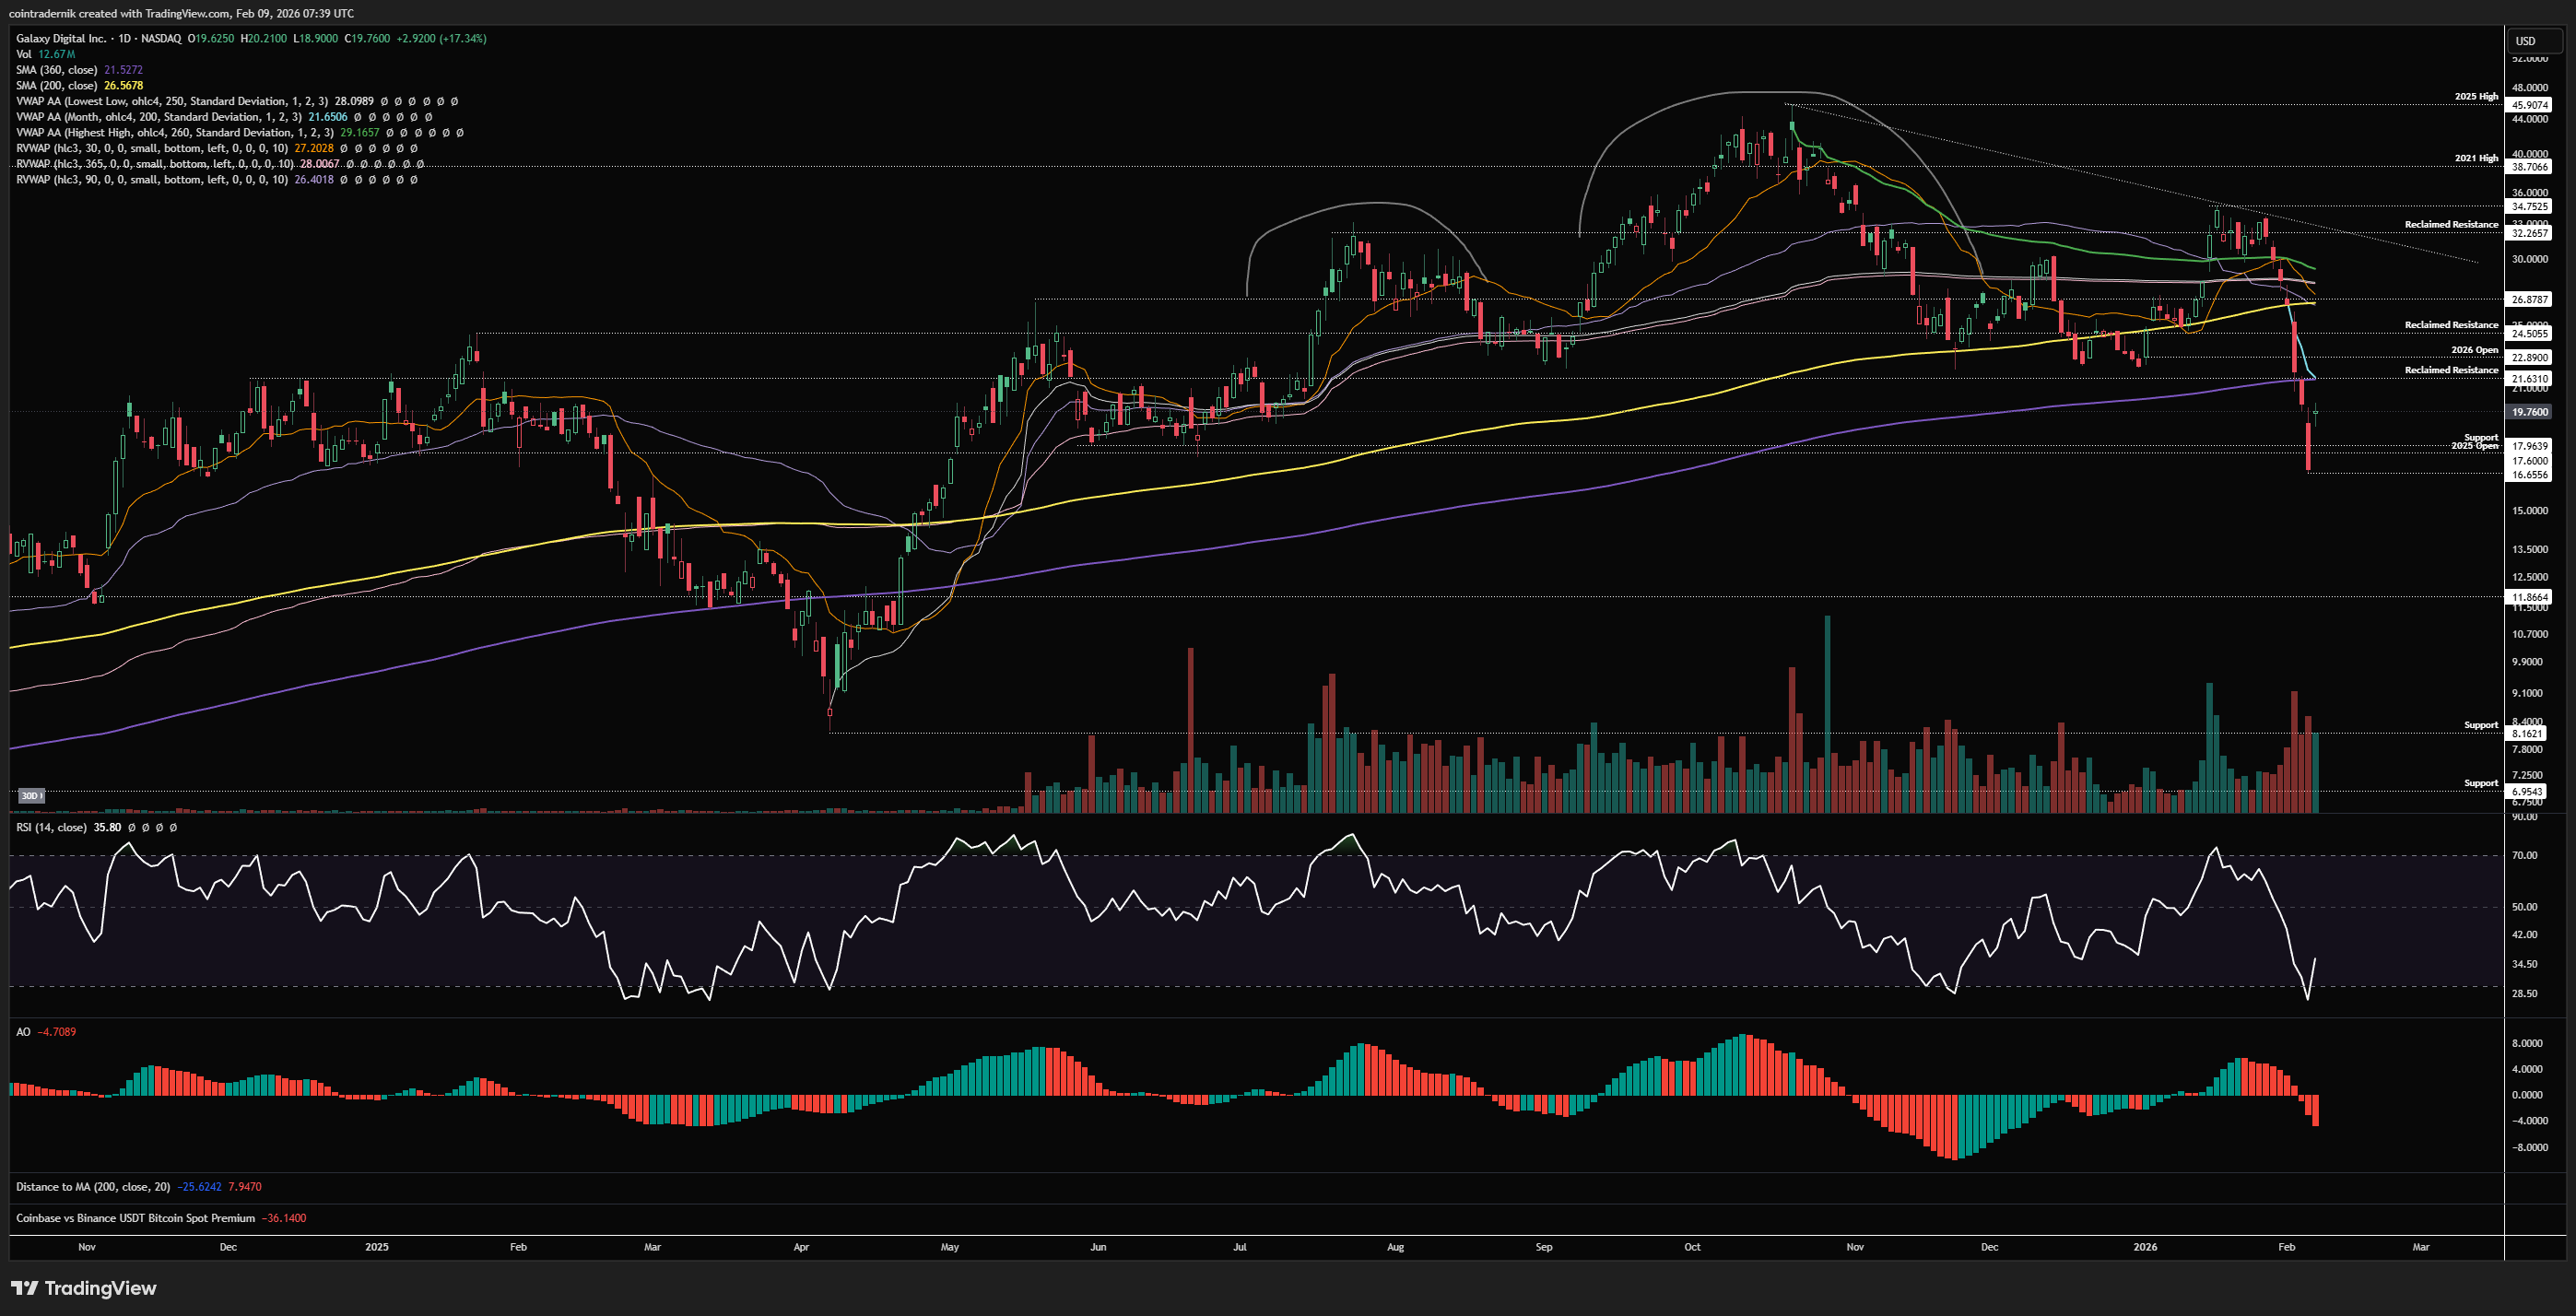
Now, looking at the daily, I have marked out what every man and his dog will be looking at, which is the head and shoulders pattern that culminated in that $34.75 right shoulder which preceded last week's capitulation. That capitulation led to a breakdown below the 'neckline' of the patten at $21.60, which would be supportive of our $12 target area to again begin looking for longs, if market always behaved in textbook fashion. This, we know, is not always the case, and so what such classical patterns do present is the opportunity to fade the textbook move under the right circumstances. So, should we see the late bounce last week find momentum off this low and price reclaim the neckline at $21.60, likely pushing well above it and then marking out a higher-low around that $22 (Feb VWAP) area, we have a failed breakdown, where we could look for longs with invalidation below $16.65 and looking for continuation back towards at least the $34.75 right shoulder but potentially new highs. If we think about why this might work, it is simply because those shorting the H&S breakdown become trapped as price breaks back above the level and holds it, and they get squeezed as price moves higher off it, likely compounded by those that sold spot into the lows buying back higher. This works as a very nice bear trap following that incredible bull trap, so it's worth keeping an eye on it over the next week or two. If, instead, this structure holds and the $22 area acts as resistance, I would expect any break and close below $16 from there to lead to that likely final leg lower towards $12.
Price: $165.12
Weekly:
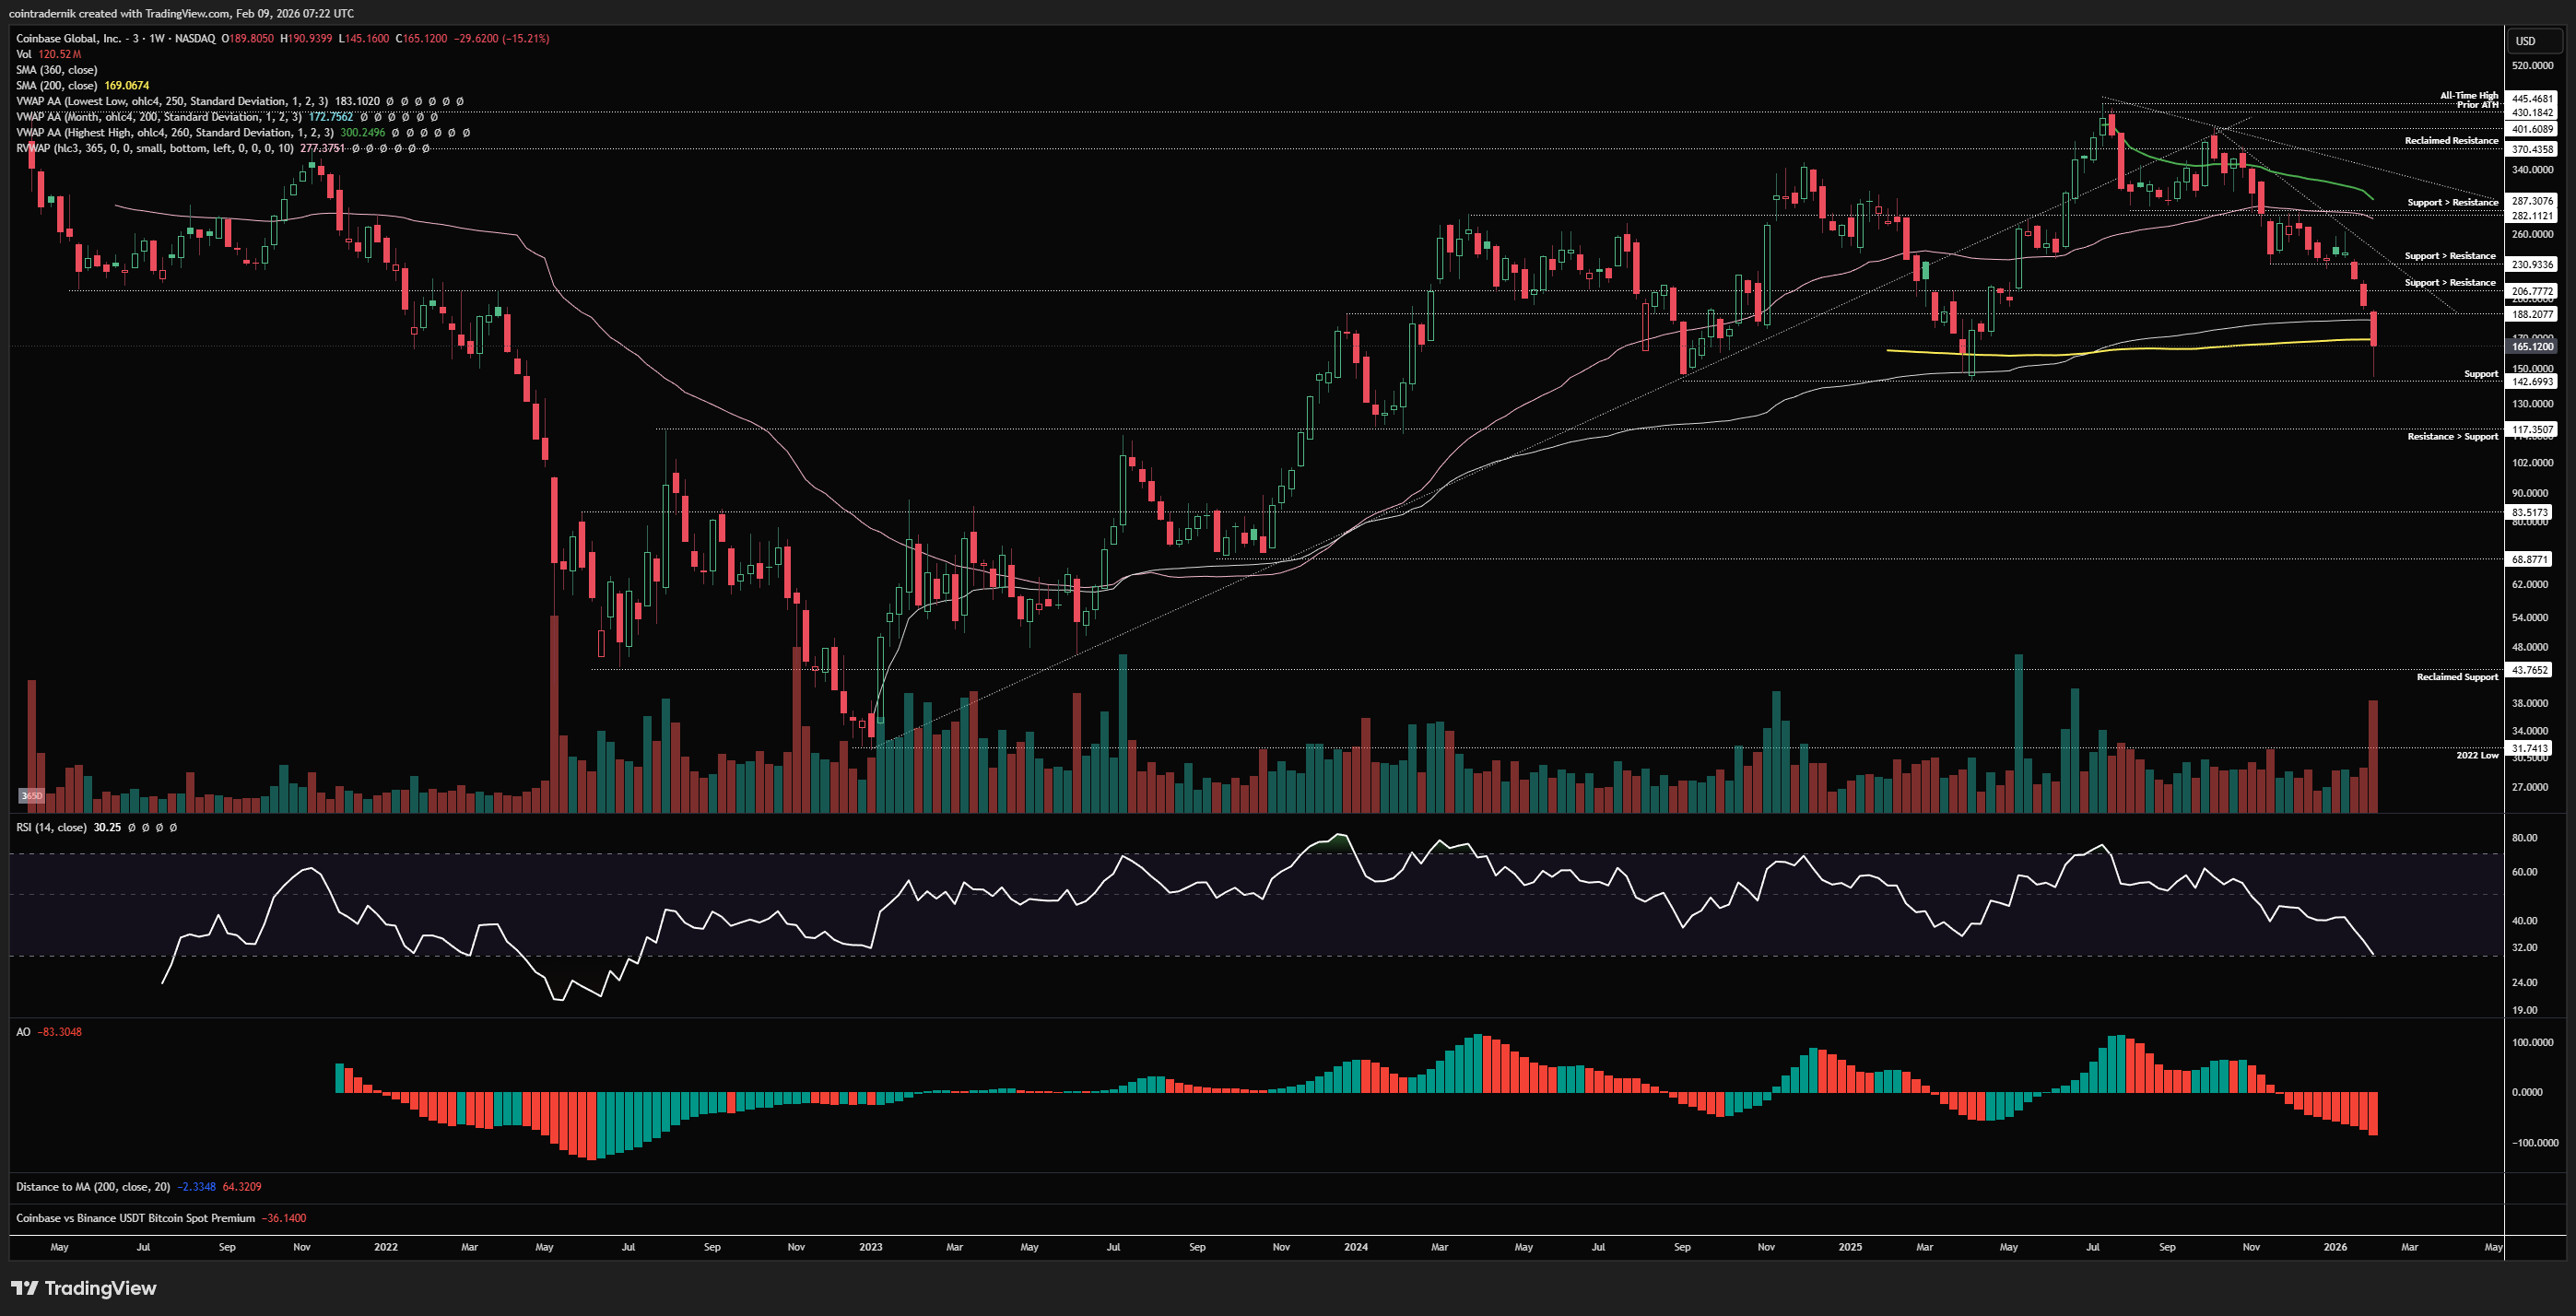
Beginning with the weekly for COIN, we can see that price has retraced all of its gains from the April 2025 tariff crash, which had marked out a low at $143, right around the anchored VWAP from the 2022 low. We then saw COIN rally to a marginal new all-time high at $445, reject, mark out a lower-high in October and then correct all the way back into $143 as of the low last week. This also saw price trade below the 200wMA, before bouncing to close back around it at $165. The anchored VWAP from the 2022 lows is now sat above at reclaimed resistance ~$188, and this is the most important level short-term for Coinbase. Momentum is approaching prior bear market trough levels and the reaction here will be quite telling for the next few weeks of price-action. If we push off this low into $188 this week, reject hard and break and close below $143 next week, it does not look good for Coinbase, and I would expect at least another 20% of downside from there into the next support around $117. What would be very promising as a bullish setup for COIN would be to await a reclaim of $188, see demand above that level and then buy the pull-back towards that level from above, with invalidation at $143 and a first target of the major overhead resistance clustered around $283, which is both prior support turned resistance and the 365d rolling VWAP, as well as the downward-sloping anchored VWAP from all-time highs. I would not be rushing to buy right here in no man's land, however, and if you are brave you could attempt the fade of $188 on the first attempt, with invalidation on a daily close above that level.
Daily:
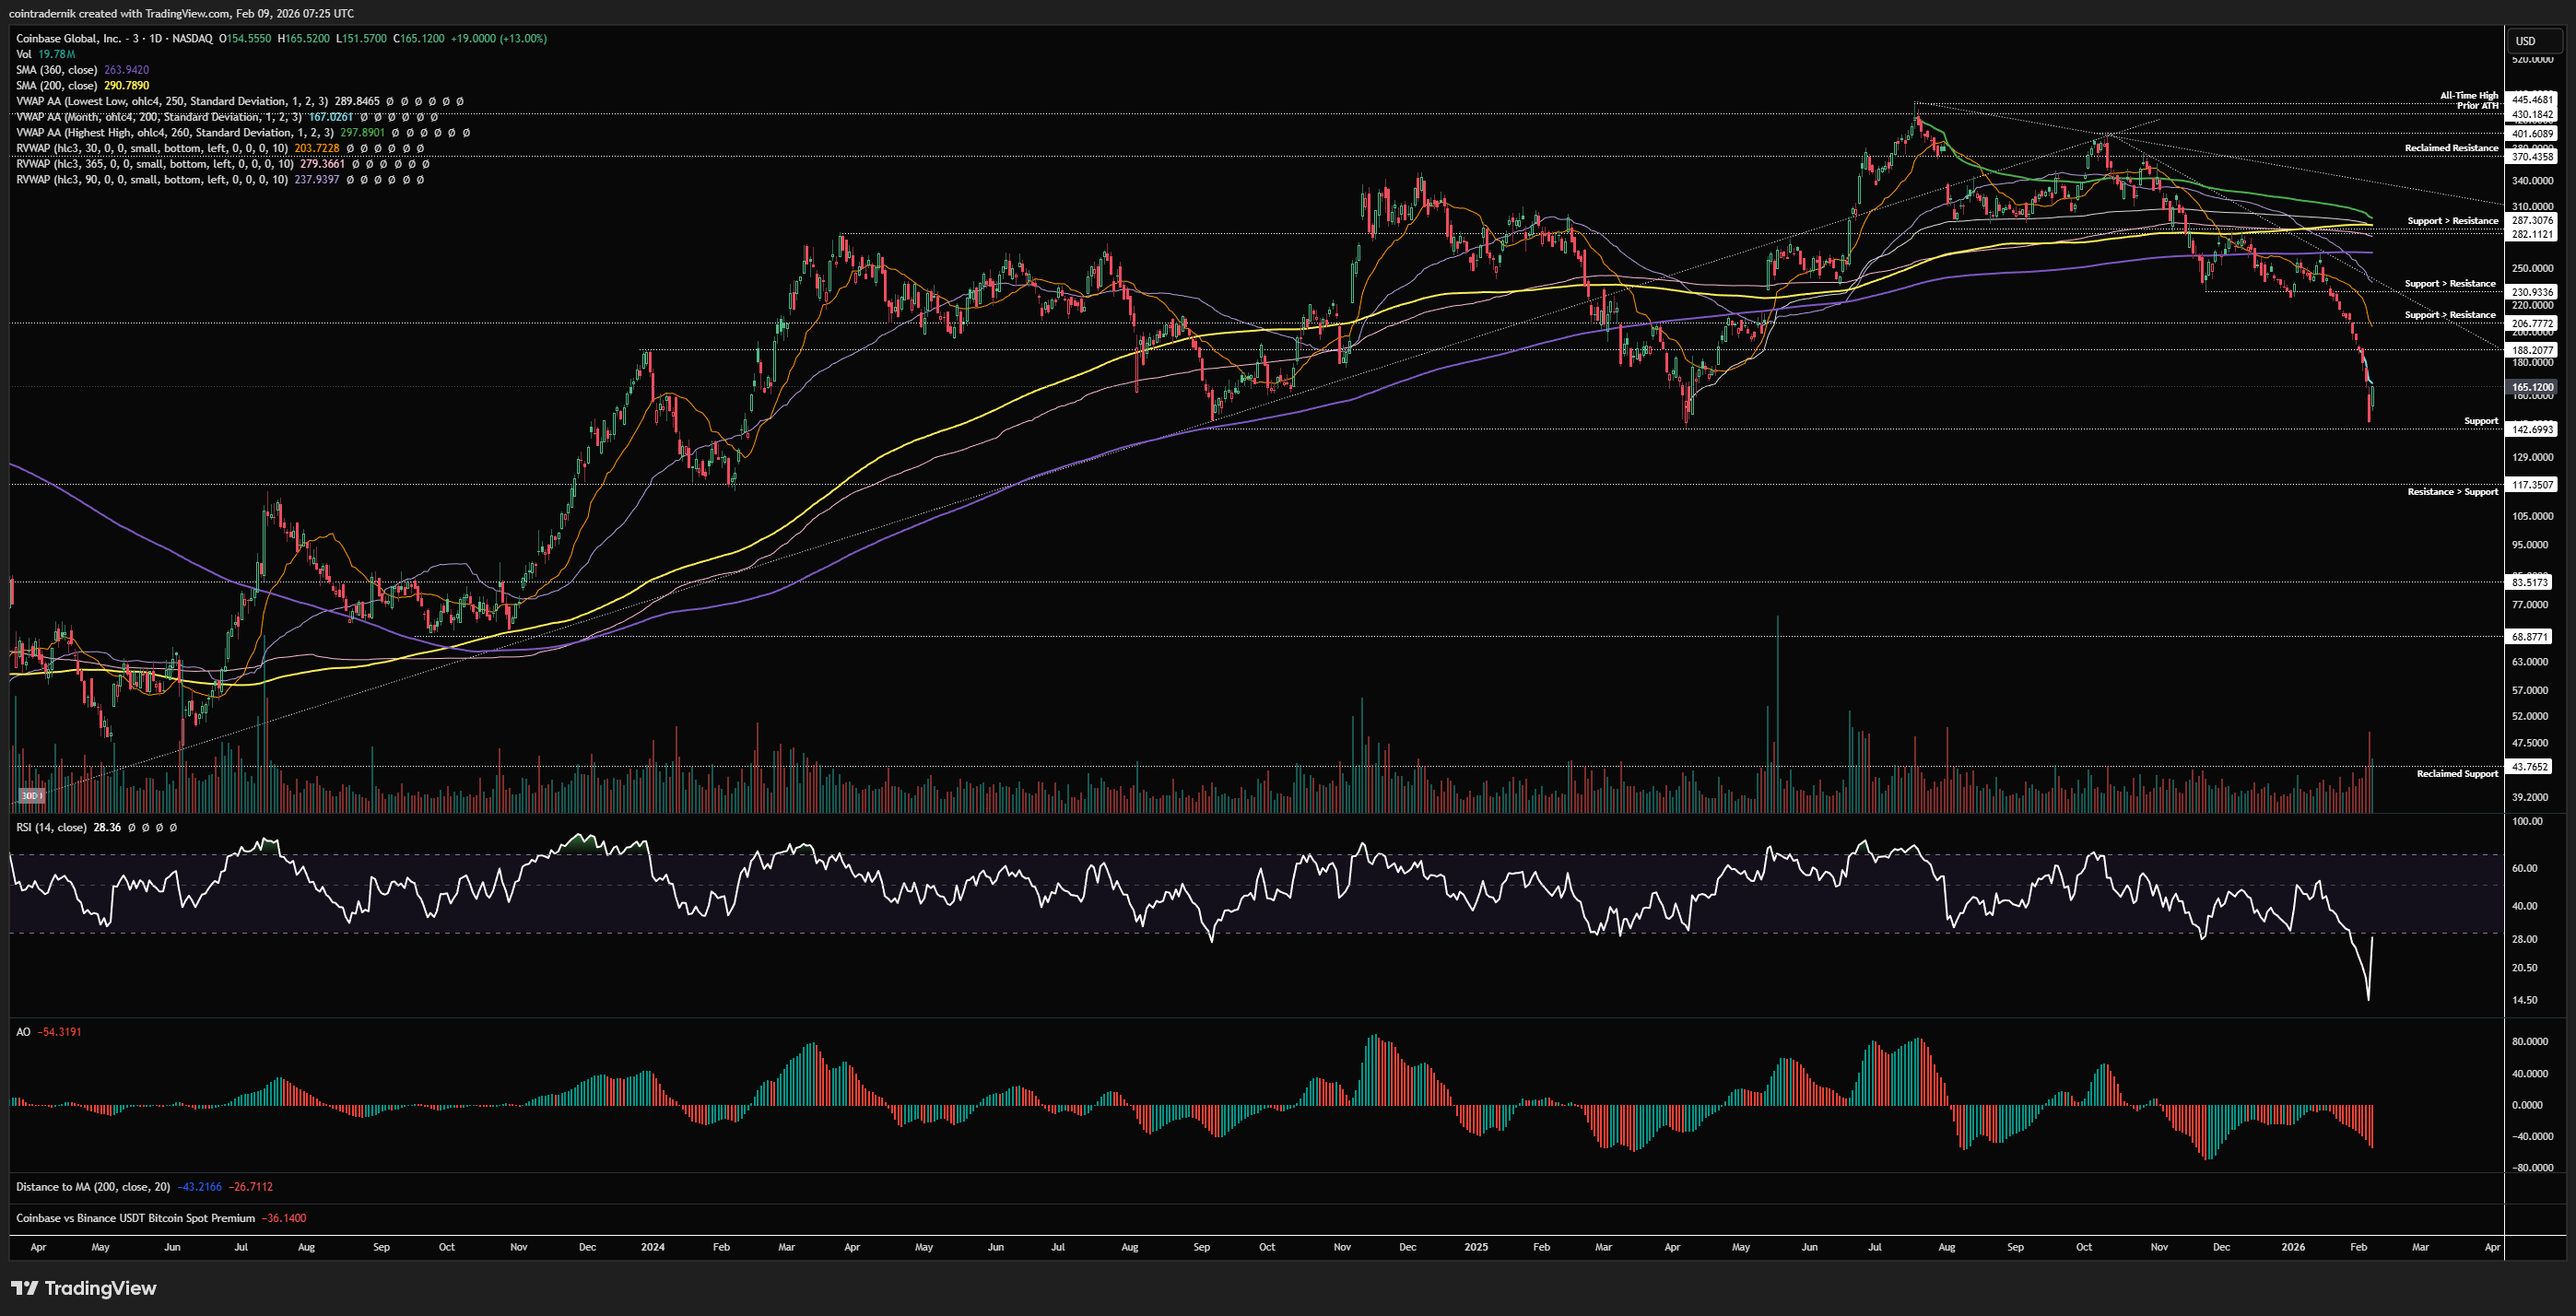
Turning to the weekly, we can see daily RSI was at historic lows last week into the $143 area, and even with the snapback the day after momentum remains below multi-year lows. Whilst this can be seen as 'overbought' and 'oversold' as is most common, I just view it as the strength of the momentum in either direction, in this case suggestive of downside momentum at the extremes. This is why momentum divergences around historic extremes are so useful, so if we do take out $143 and print some trend exhaustion into that low, I would be looking for a reclaim of the level and then bid that as a strong signal that the move lower has been utterly exhausted and that those shorting into the low are likely to fuel upside on any marginal push higher. The 30d rolling VWAP has capped the rallies since November, so flipping that into support would also be something to watch for over the coming weeks. Really, I just want to see a daily close below $143 with momentum marking higher-lows and then a reclaim of that level: that is all I ask for. If I don't get it, I am only a buyer back above $188. Given the extreme overextension to the downside across the crypto sector, I just don't like the idea of shorts around here in an attempt to eke out what might only been one more marginal lower-low. Now, looking much further out, if we do break and close below $143 and then fail to reclaim the level and break lower from there as momentum has somewhat reset, then we might have favourable shorts for further downside, but I'm not seeing that here.
Price: $82.82
Weekly:
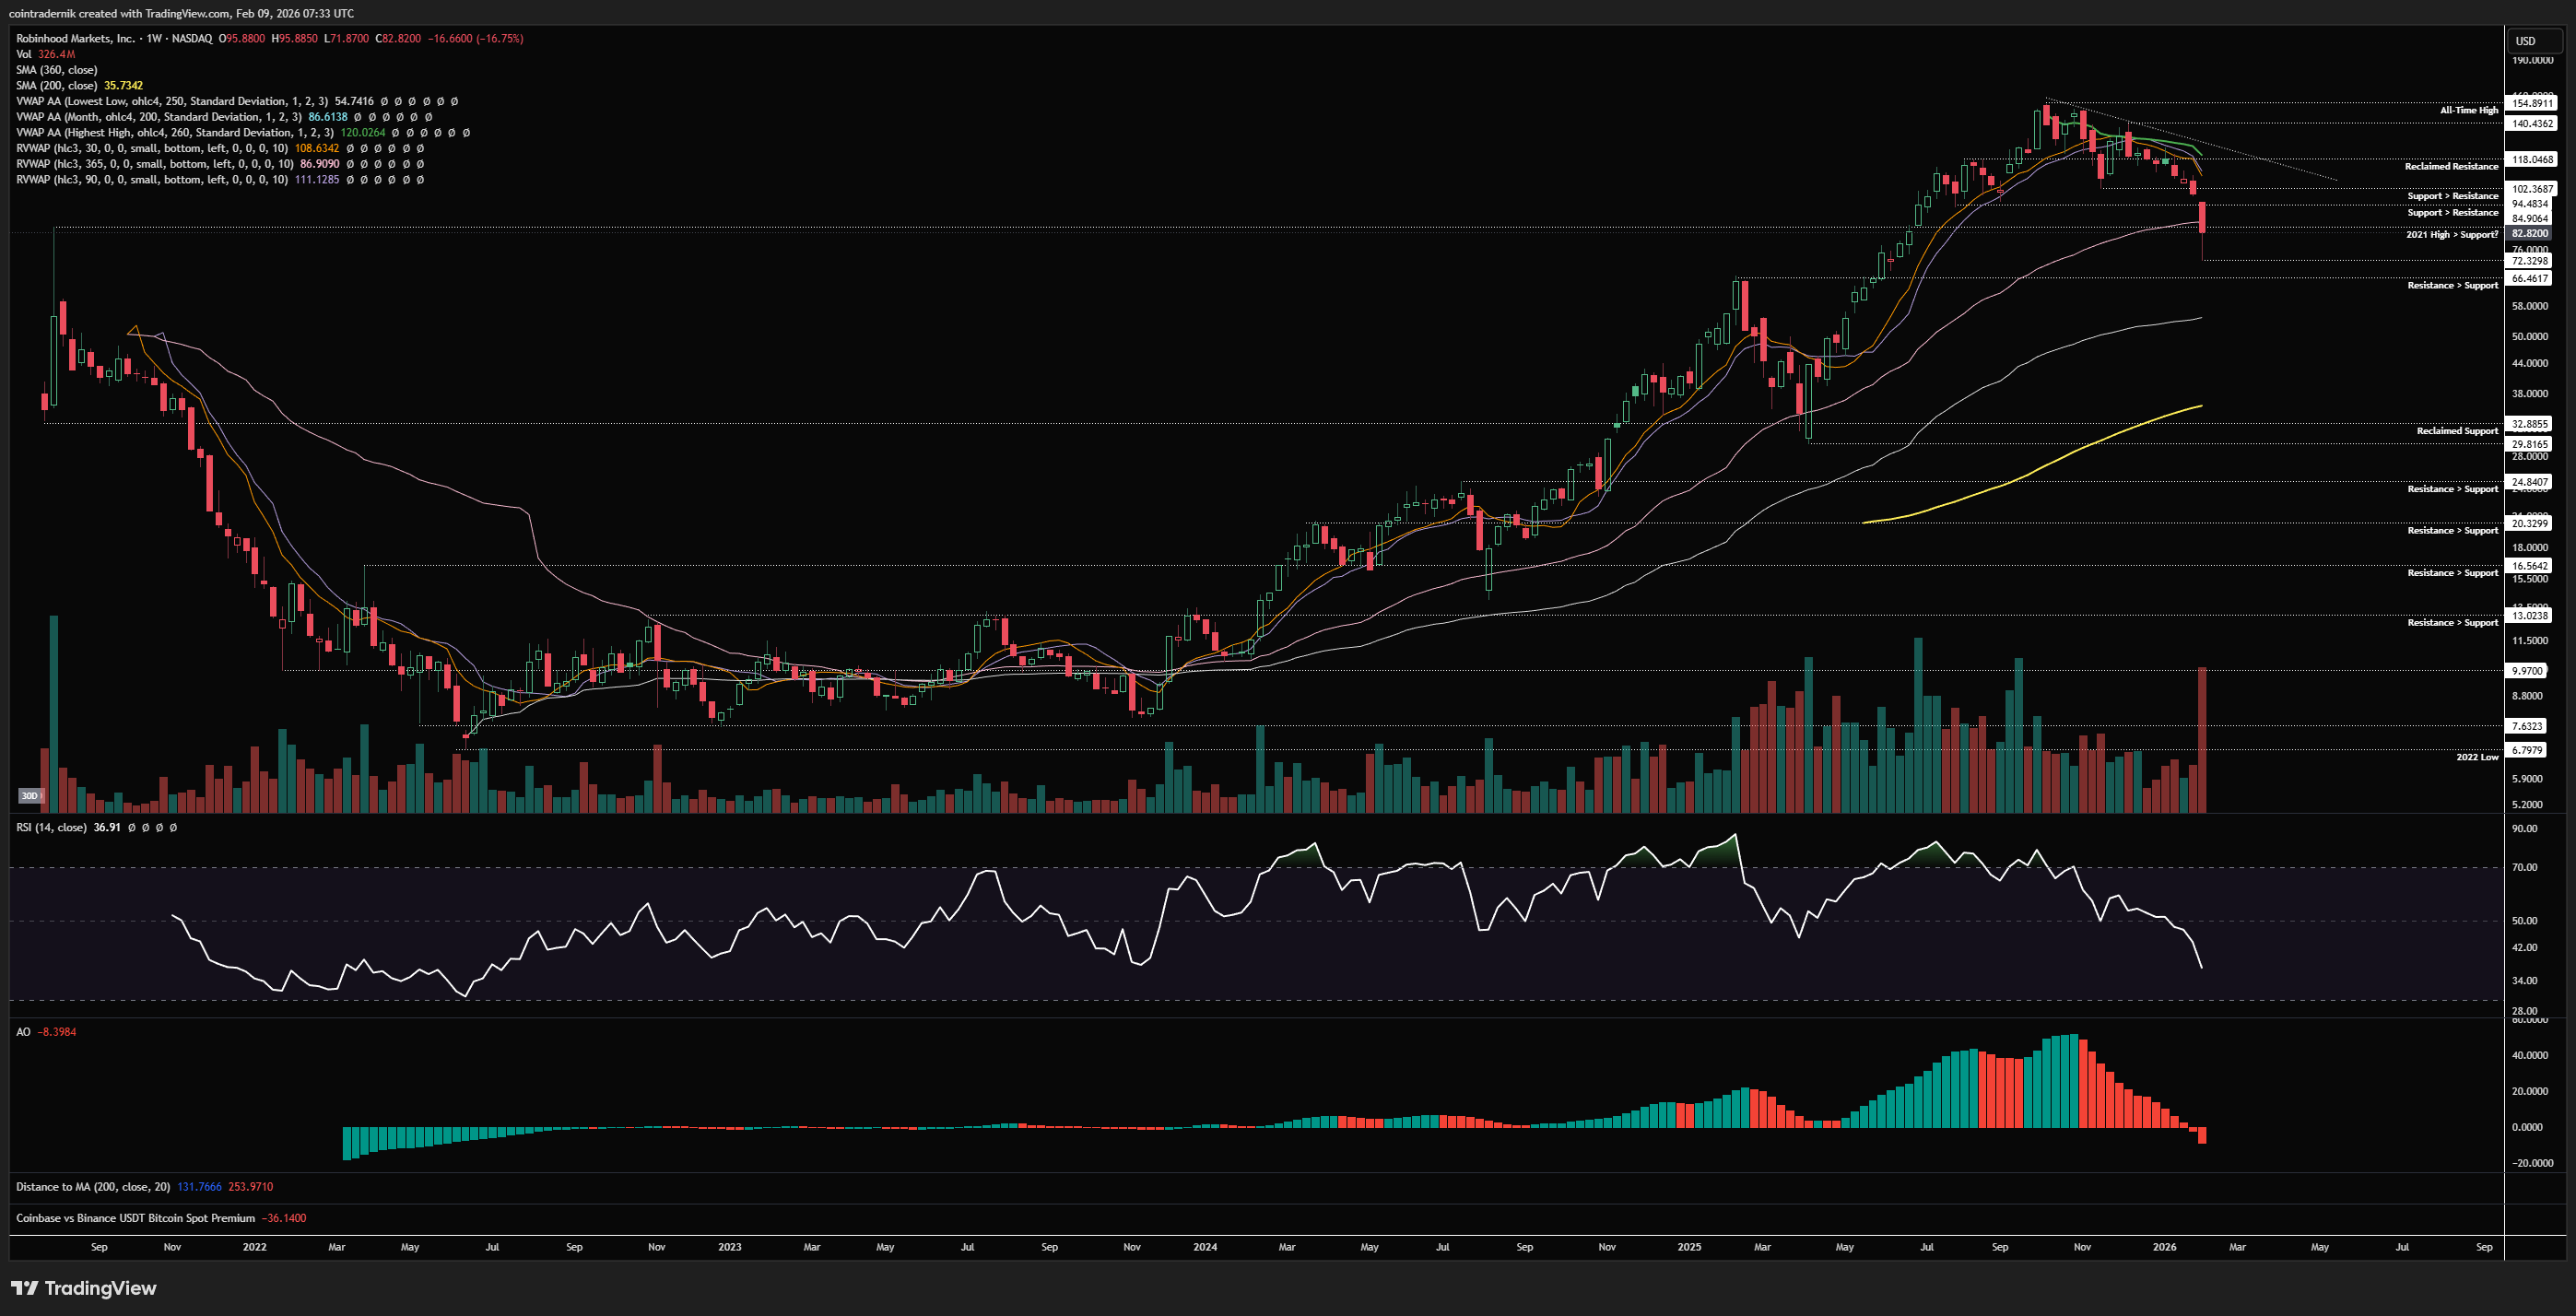
If we begin by looking at the weekly timeframe for HOOD, we can see that price made all-time highs just shy of $155 in September and has since been marking out lower-highs and lower-lows, flipping $118 into reclaimed resistance and then capitulating lower last week through $102 support into the 365d rolling VWAP at $87. Price wicked below that towards prior resistance turned support at $66.46, marking out a low at $72.33 before bouncing to close the week marginally below that 365d rolling VWAP and the 2021 cycle highs. Weekly momentum is firmly bearish and AO has just flipped negative on this timeframe, and so I am not particularly interested in bidding this here. Some might point to the prior two major pivots in Aug 2024 and Apr 2025, where price deviated below the 365d rolling VWAP, held firmly above the anchored VWAP from the 2022 low and then v-reversed higher, thus potentially making this a similar situation, but, unlike those two occasions, momentum has turned firmly bearish here. I think, even if HOOD marks out a bottom here and recovers, there are likely far better bets to make now. If we popped higher into $118ish, that is actually an area where I would be looking for short setups with very clean invalidation.
Daily:
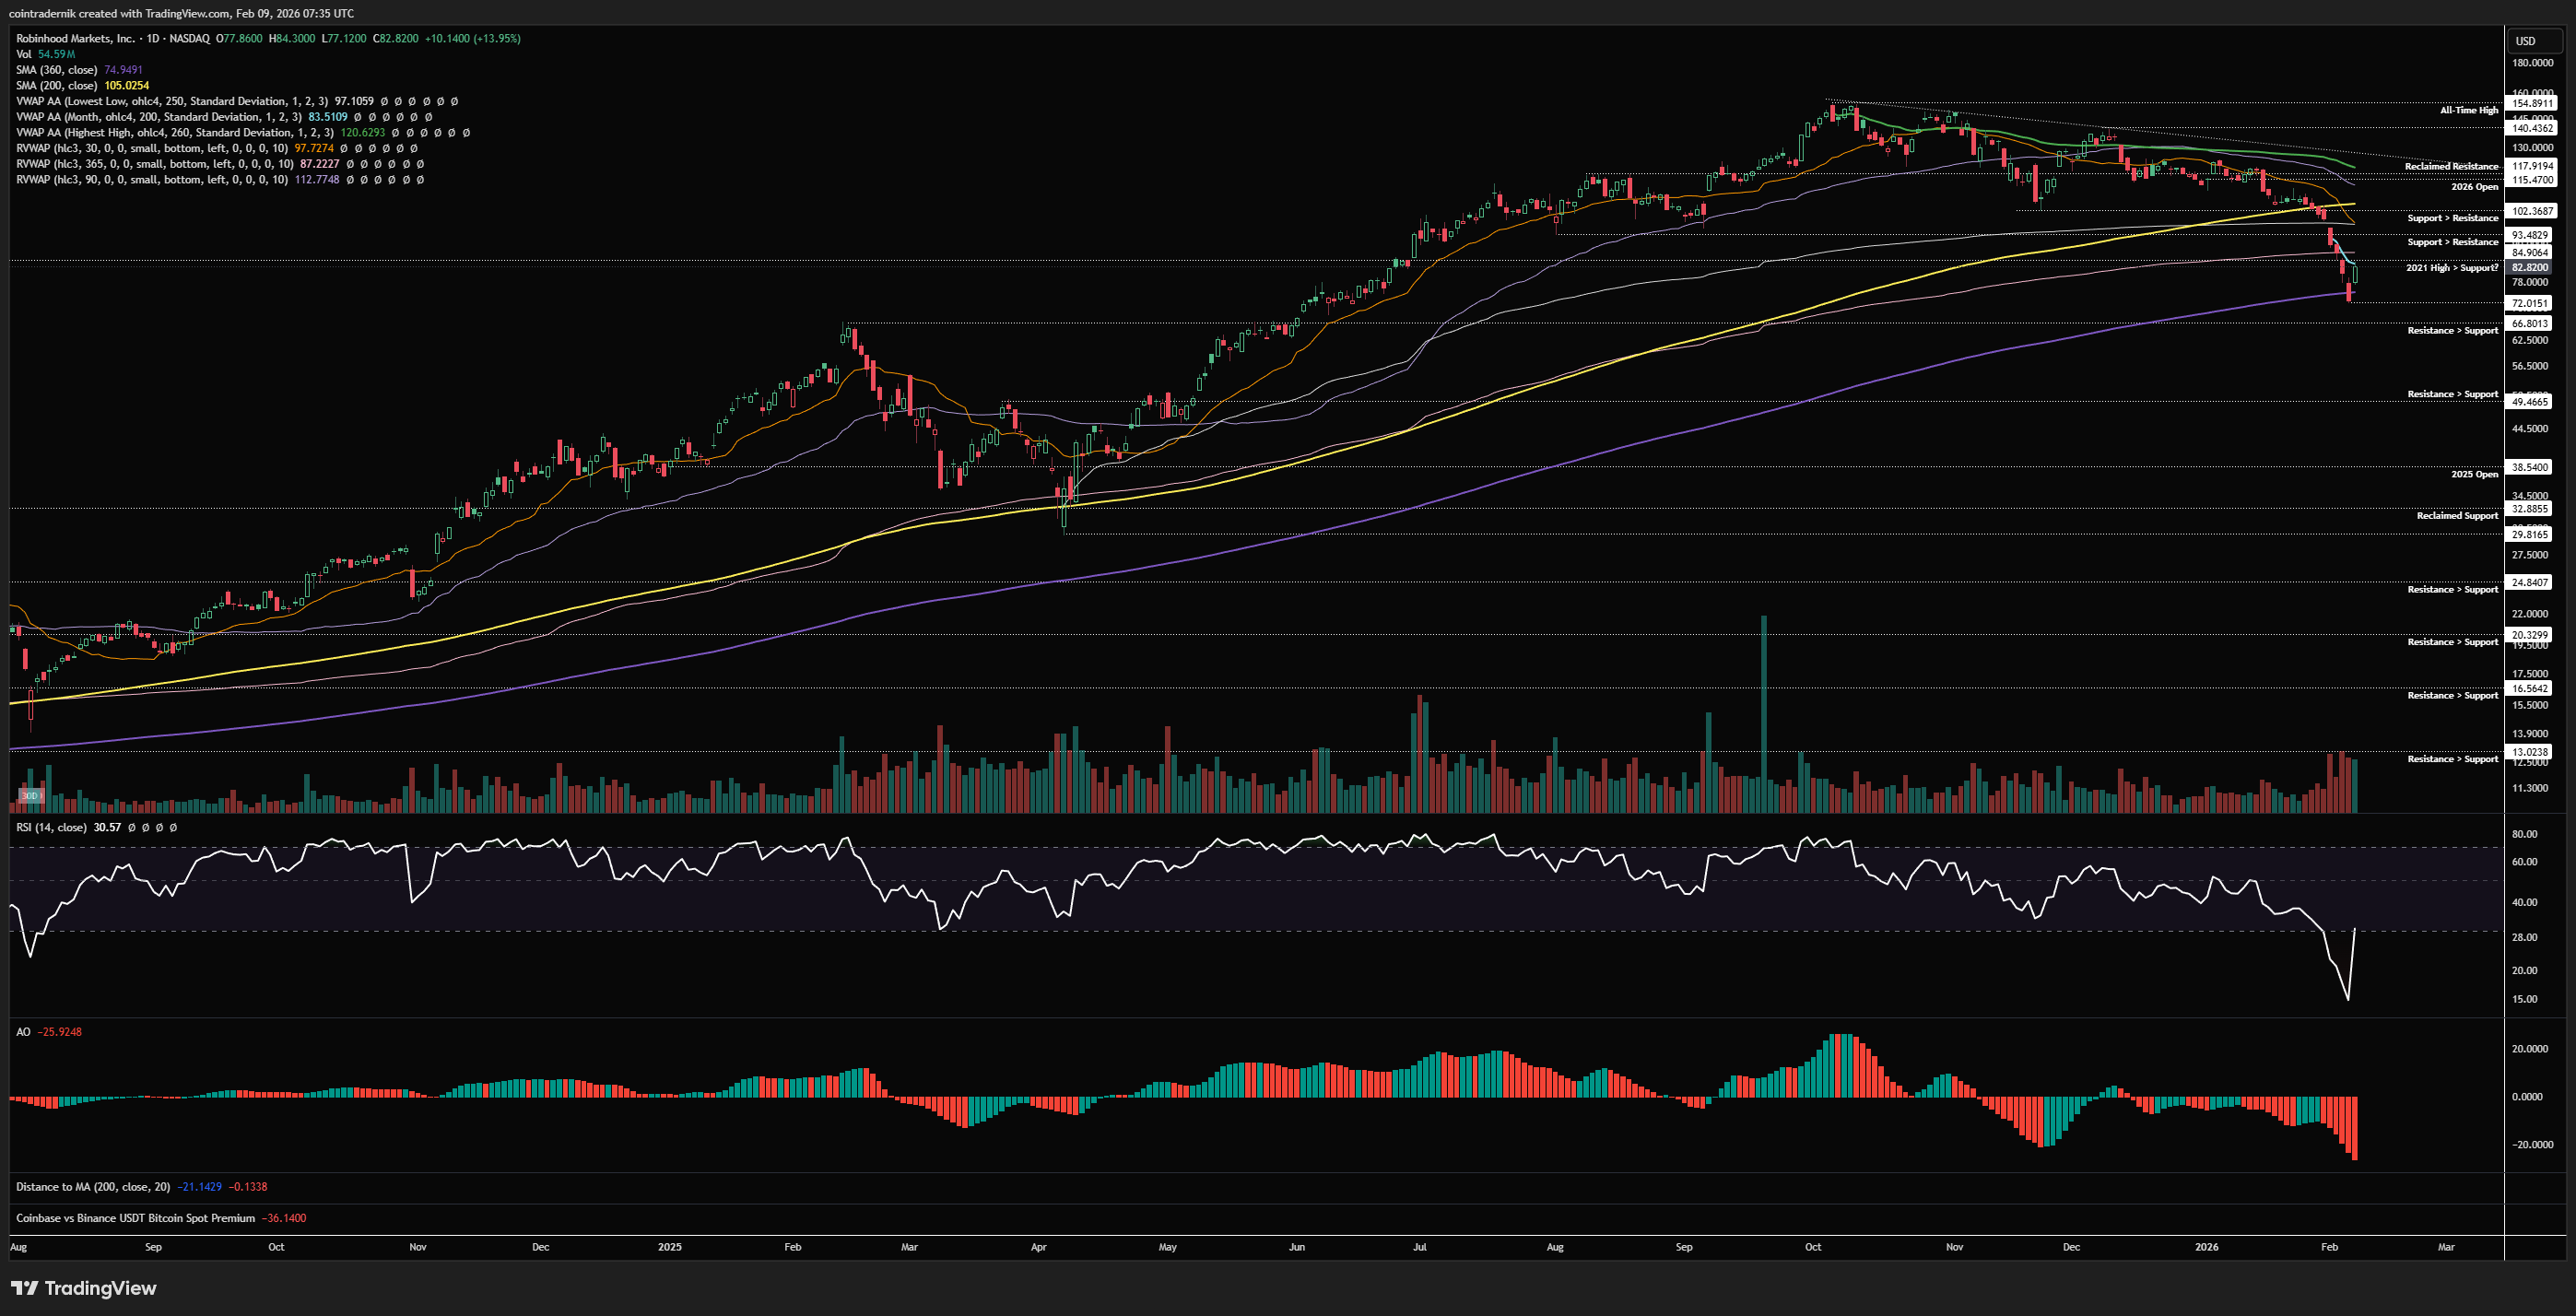
Finally, looking at the daily, we can see that price has traded into the 360dMA as of last week, with daily RSI at historic extremes to the downside and price-action not too dissimilar to that August 2024 capitulation candle. Daily structure is obviously bearish here and price is firmly below all the key MAs and VWAPs, including the anchored VWAP from the April 2025 swing-low, which is currently sat at $97, confluent with the 30d rolling VWAP. If we were to reclaim that level, I would potentially look for a tactical long back towards that major resistance cluster mentioned above around the 2026 open at $115 into $118, where I would flip towards a short bias. Alternatively, if we run last week's low into $66.80 and then reclaim $72 with some momentum divergence, we could look for longs into $97. On a higher-timeframe view, I just don't really see much value in HOOD here for continued outperformance.
I hope you've found some value in the read this week - please RT, share, engage etc. if so!
And if you've not already signed up for Ostium, please do so and test out some of the recent updates, including:
Sign up here (you don't have to use my ref link, of course): https://ostium.app/trade?from=CL&to=USD&ref=CTNIK

.avif)