

Market Outlook #70 - Powering Hyperscalers
January 26, 2026
-
12
min read


This blog references an opinion and is for entertainment and informational purposes only. It is not intended to be investment advice. Seek a duly licensed professional for investment advice.
In this special edition of the 70th Market Outlook here at Ostium Insights, we'll be taking a look at the week ahead in markets, focusing specifically on 'Powering Hyperscalers', looking at price-action, positioning and event risk for Uranium, Copper, US Oil, MSFT and NVDA.
Now, let's take a look at the busy calendar for the week, with FOMC as the major event but with plenty of data either side of it:
MONDAY: US DURABLE GOODS ORDERS (NOV): (CONSENSUS 0.5% VS PREVIOUS -2.2%)
TUESDAY: ECB PRESIDENT LAGARDE SPEECH
WEDNESDAY: BANK OF CANADA INTEREST RATE DECISION: (CONSENSUS 2.25% VS PREVIOUS 2.25%)
WEDNESDAY: FEDERAL RESERVE INTEREST RATE DECISION: (CONSENSUS 3.75% VS PREVIOUS 3.75%)
THURSDAY: US INITIAL JOBLESS CLAIMS: (CONSENSUS 205K VS PREVIOUS 200K)
THURSDAY: US FACTORY ORDERS (MOM) (NOV): (CONSENSUS 0.5% VS PREVIOUS -1.3%)
THURSDAY: JAPAN TOKYO CPI EX FOOD & ENERGY (YOY) (JAN): (CONSENSUS 2.2% VS PREVIOUS 2.3%)
FRIDAY: US PRODUCER PRICED INDEX (MOM) (DEC): (CONSENSUS 0.2% VS PREVIOUS 0.2%)
FRIDAY: VARIOUS FED SPEECHES
Now, let's dig into asset-specific price-action for the week ahead, looking firstly at Uranium:
Price: $57
Weekly:
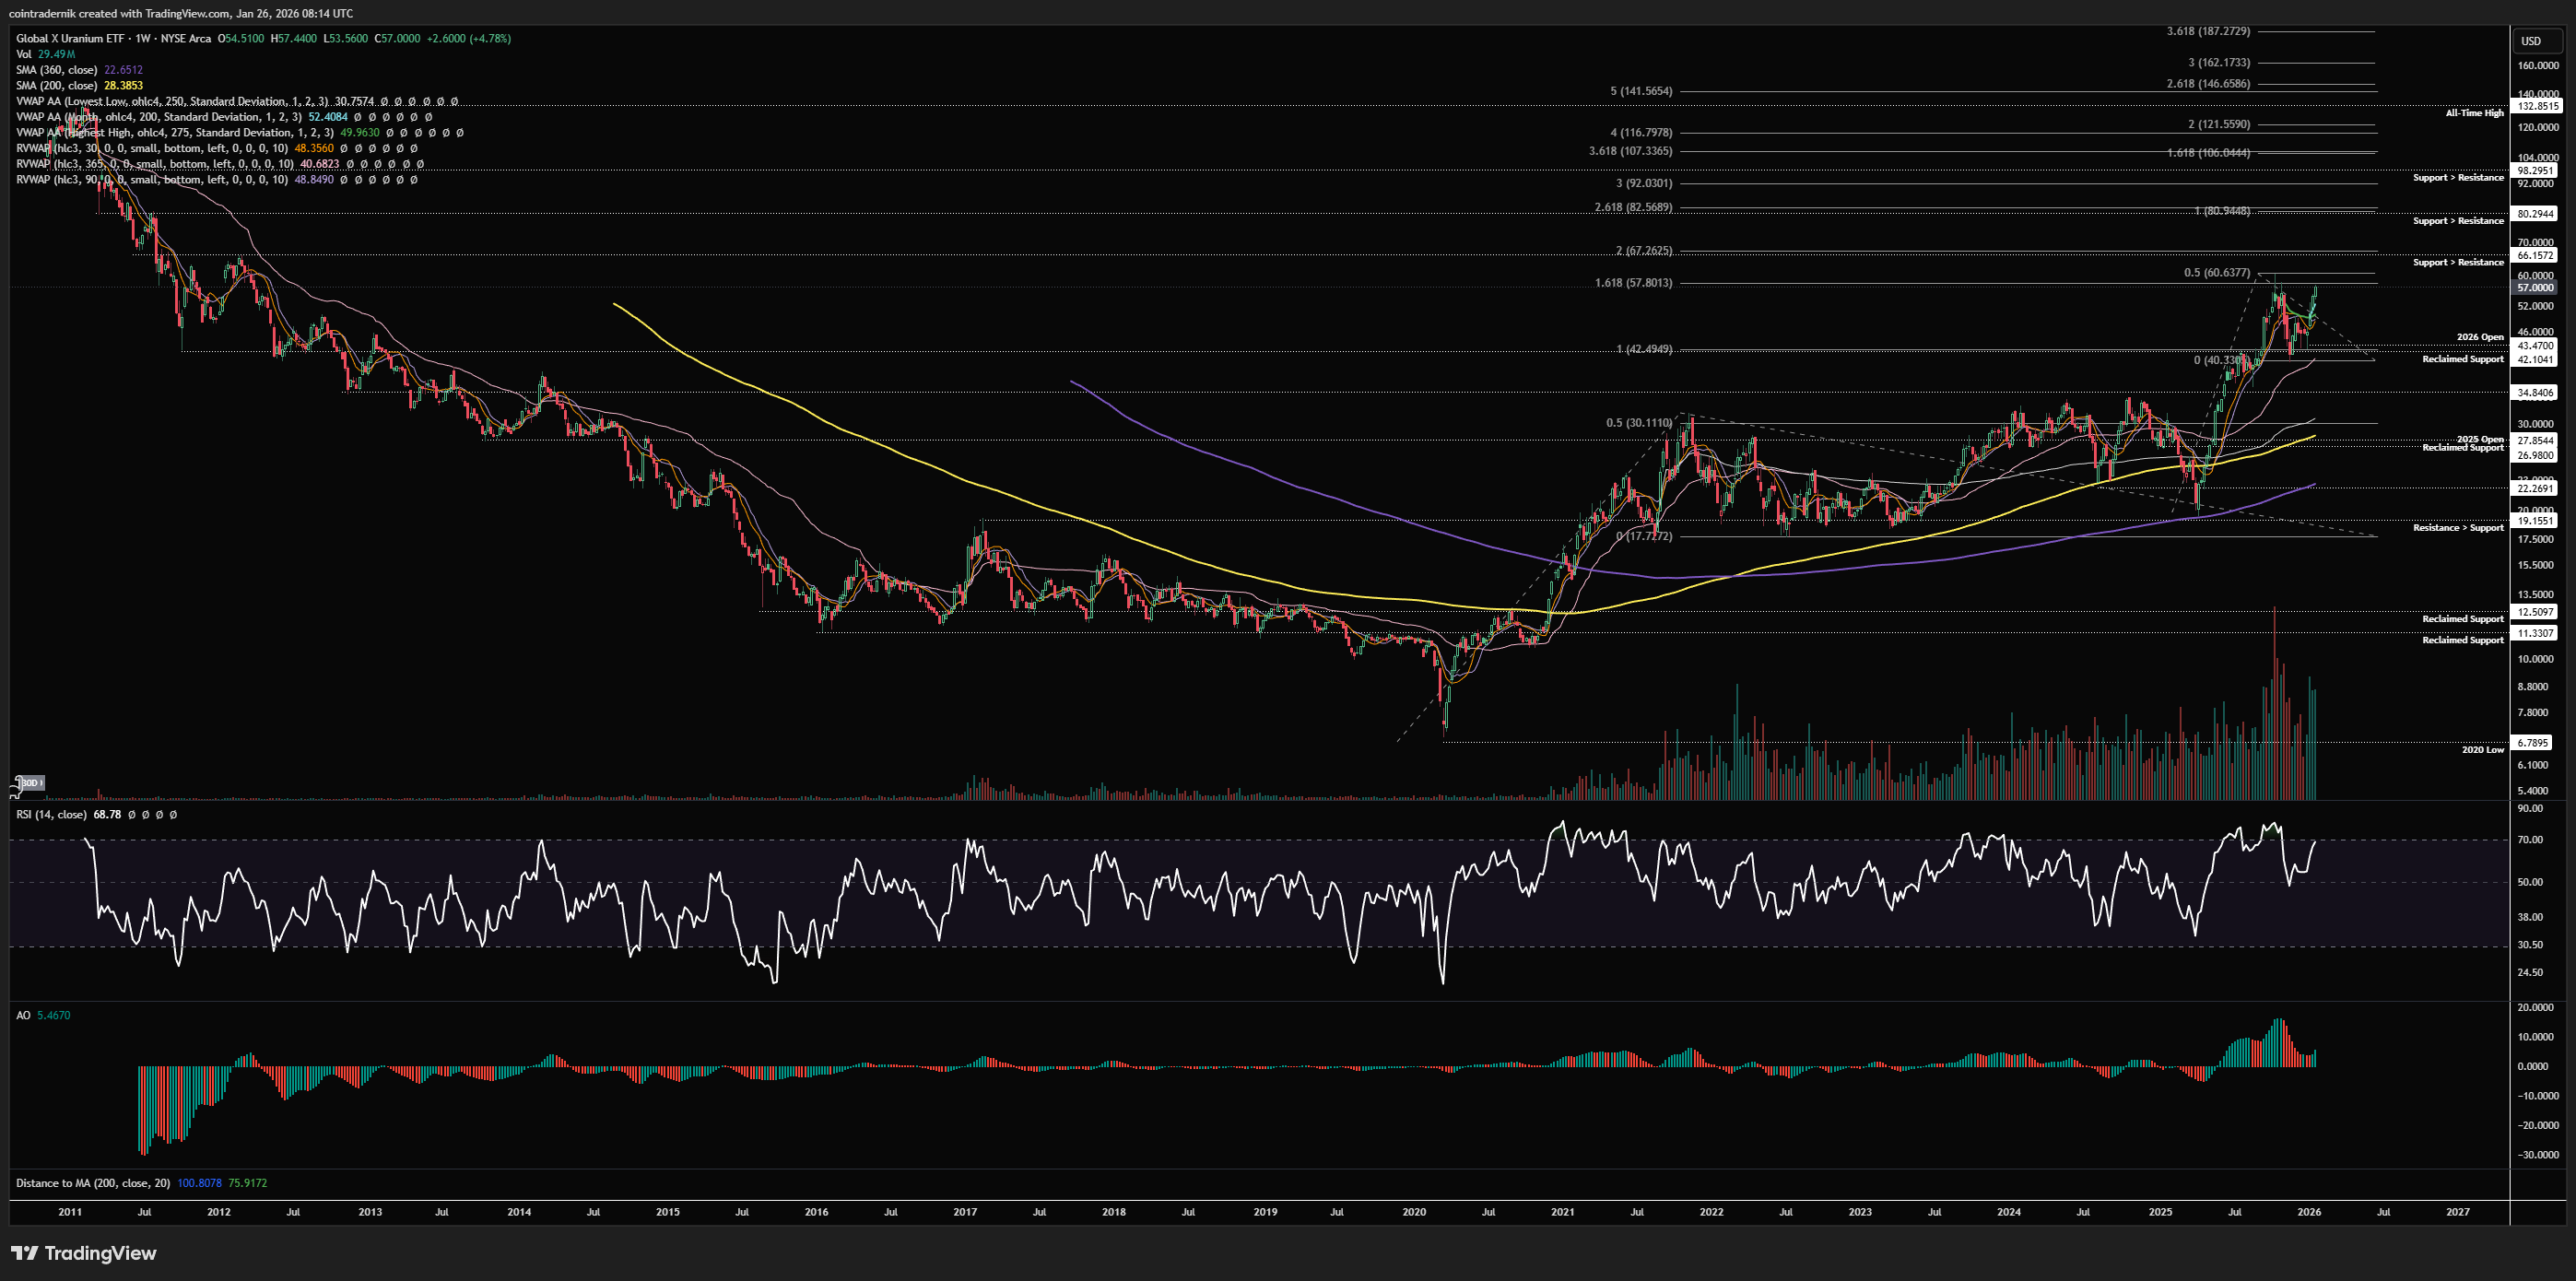
Beginning with the weekly for Uranium (with us specifically looking here at the Global X Uranium ETF - $URA), we can see that following a decade-long downtrend that culminated in a low at $6.79 during March 2020, the market bottomed out and began a new bull trend, with a multi-year top occurring at $30 in late 2021, followed by re-accumulation between range support at $19 and range resistance at $30. We then saw price break out above the range, reject at $35 and then correct back towards range support in early 2025, marking out a higher-low from which it v-reversed into fresh highs through $35. URA then continued higher into year-end, where it found resistance at $60.
We have bullish structure and momentum on the weekly timeframe and price has recently back-tested $42 as reclaimed support and bounced straight back to the highs. Given the structure of this trend, we should expect $60 to give way and price to continue higher from here towards $80 in Q1, where there is confluence of prior support turned resistance, as well as the 2.618 fib extension of the longer-term uptrend and the 100% extension of the most recent upswing. One thing to pay attention to here is whether we take the highs and reject, putting in some bearish divergence and potentially marking out a major top, but until we see rejection we should anticipate the trend to persist. Looking further out into the rest of 2026, I think dips remain buying opportunities and we make our way towards that 2011 high at $132 going into 2027.
Daily:
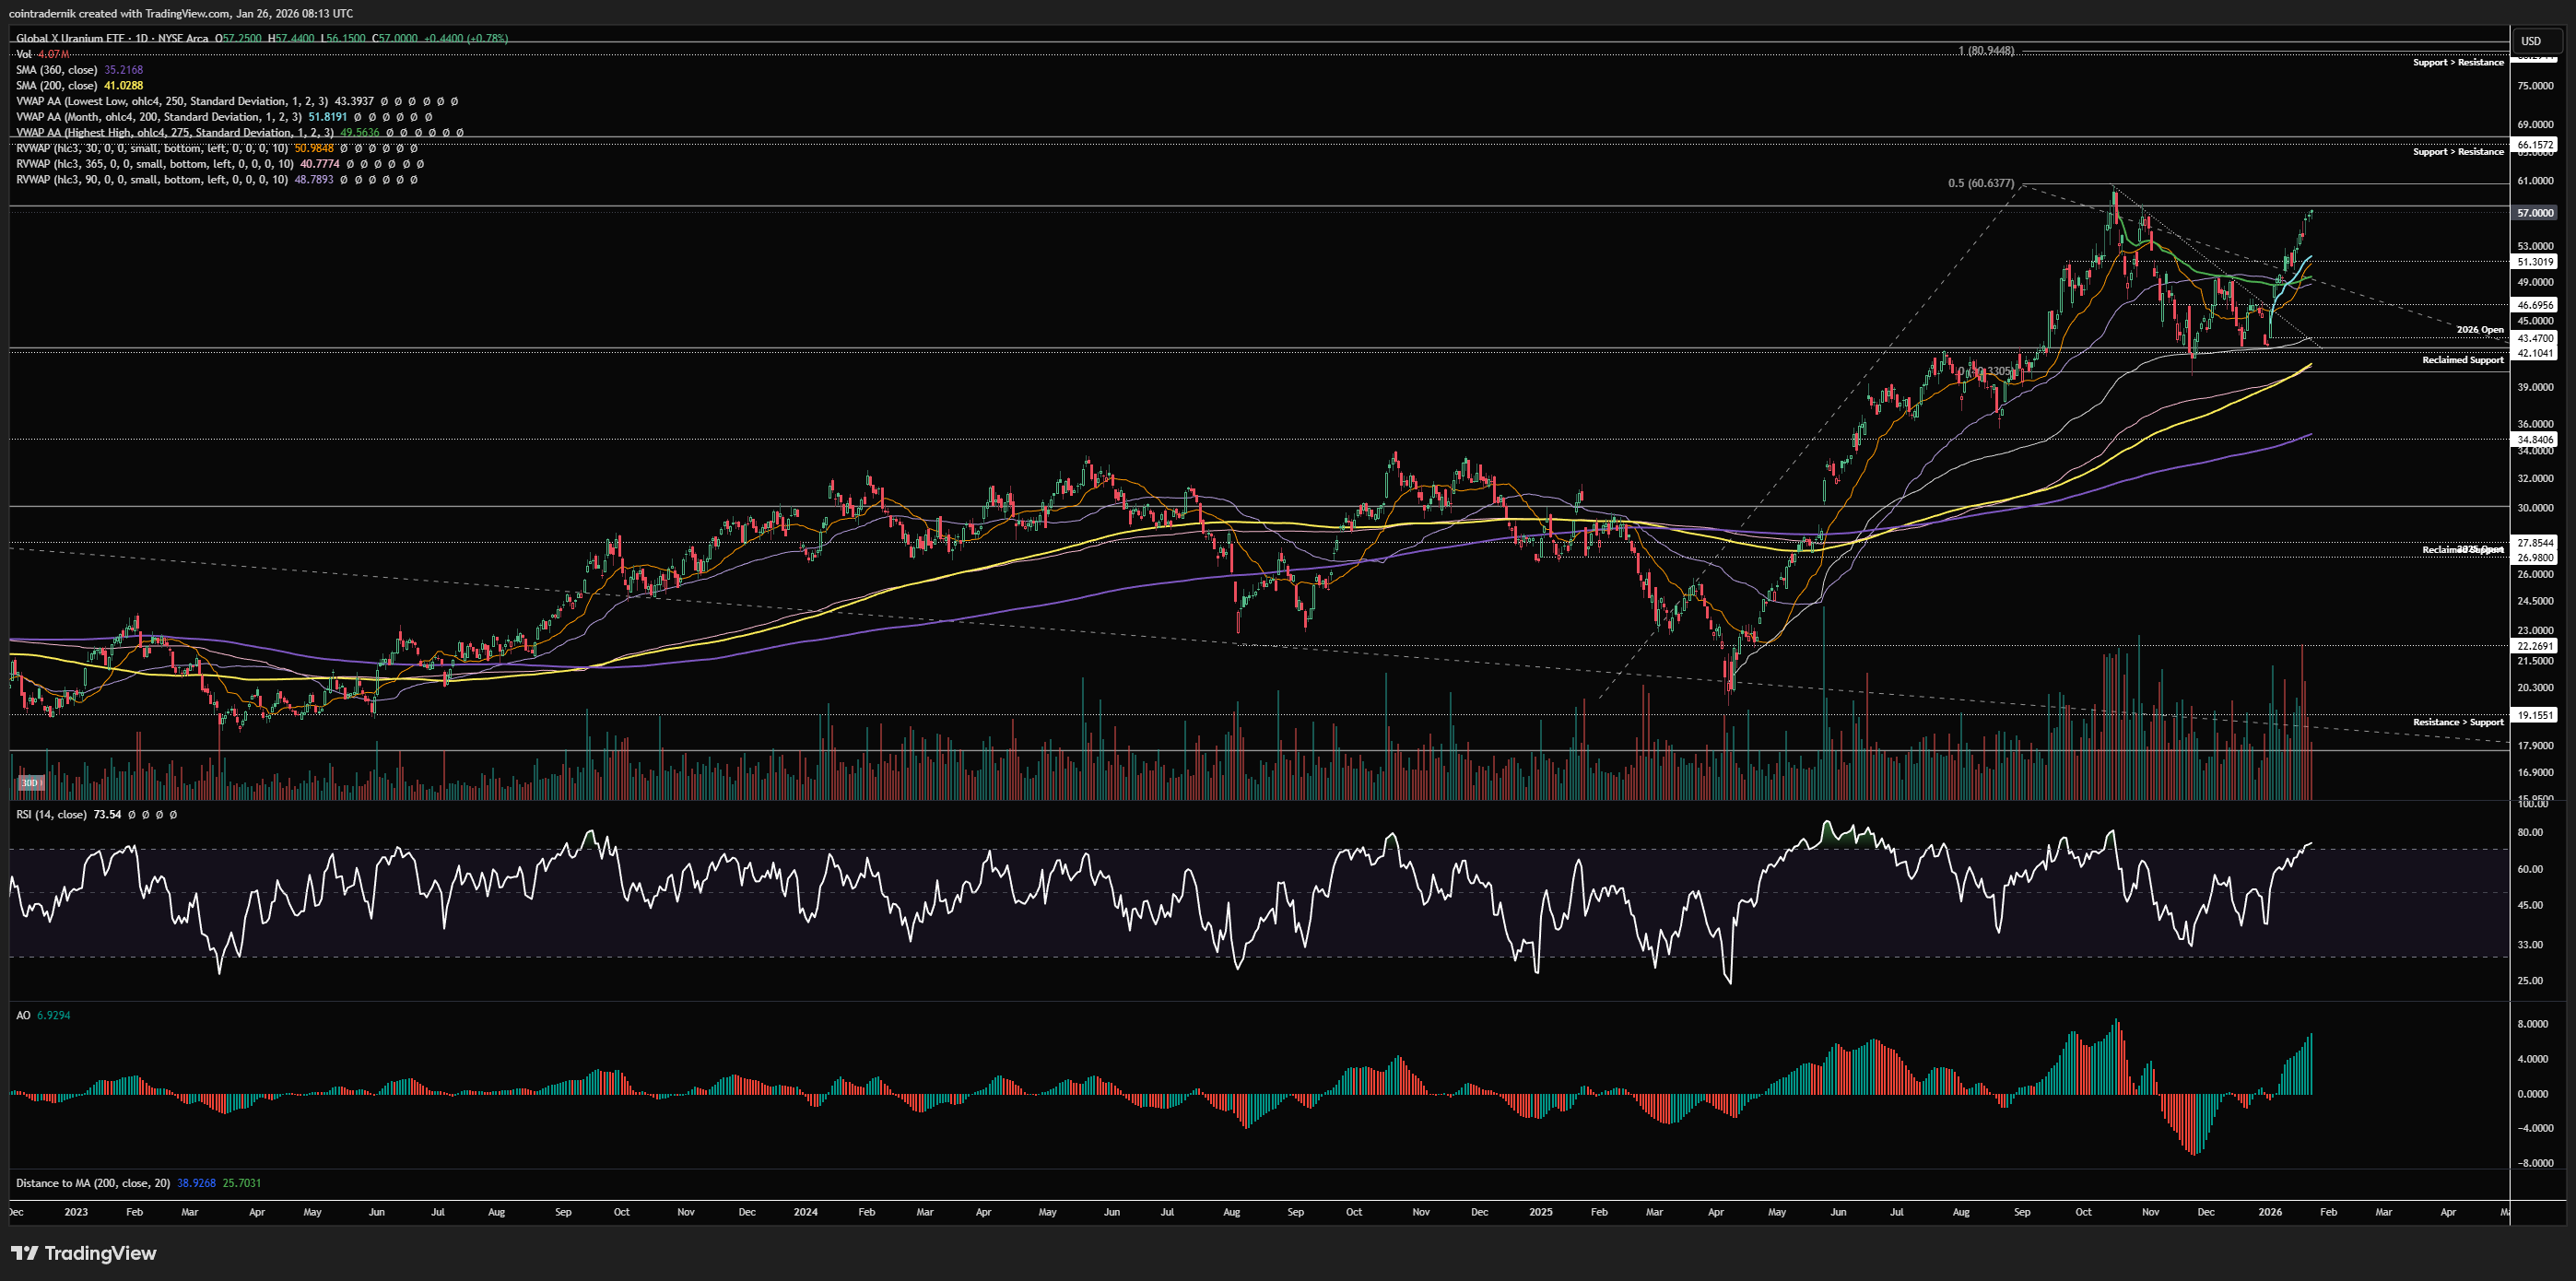
Turning to the daily, we can see that price found support at the anchored VWAP from the April 2025 lows late last year, around $39, marking out higher-lows above it into $42 and then breaking out above trendline resistance from the $60 high as we came into the New Year. From there, price has continued to rally, flipping the anchored VWAP from the 2025 high into support, with the 30d rolling VWAP, 90d rolling VWAP and January VWAP all supporting the trend. A local pullback into that $52 area over the next week or so would thus be a nice opportunity to look for long setups, with a view to cutting exposure if we flip that confluence of support into resistance, with the first target above $60 being prior support at $66, but with $80 as the major level. There is no signs of trend exhaustion on this timeframe as of yet, so, as mentioned above, dips are for buying.
Price: $6
Weekly:
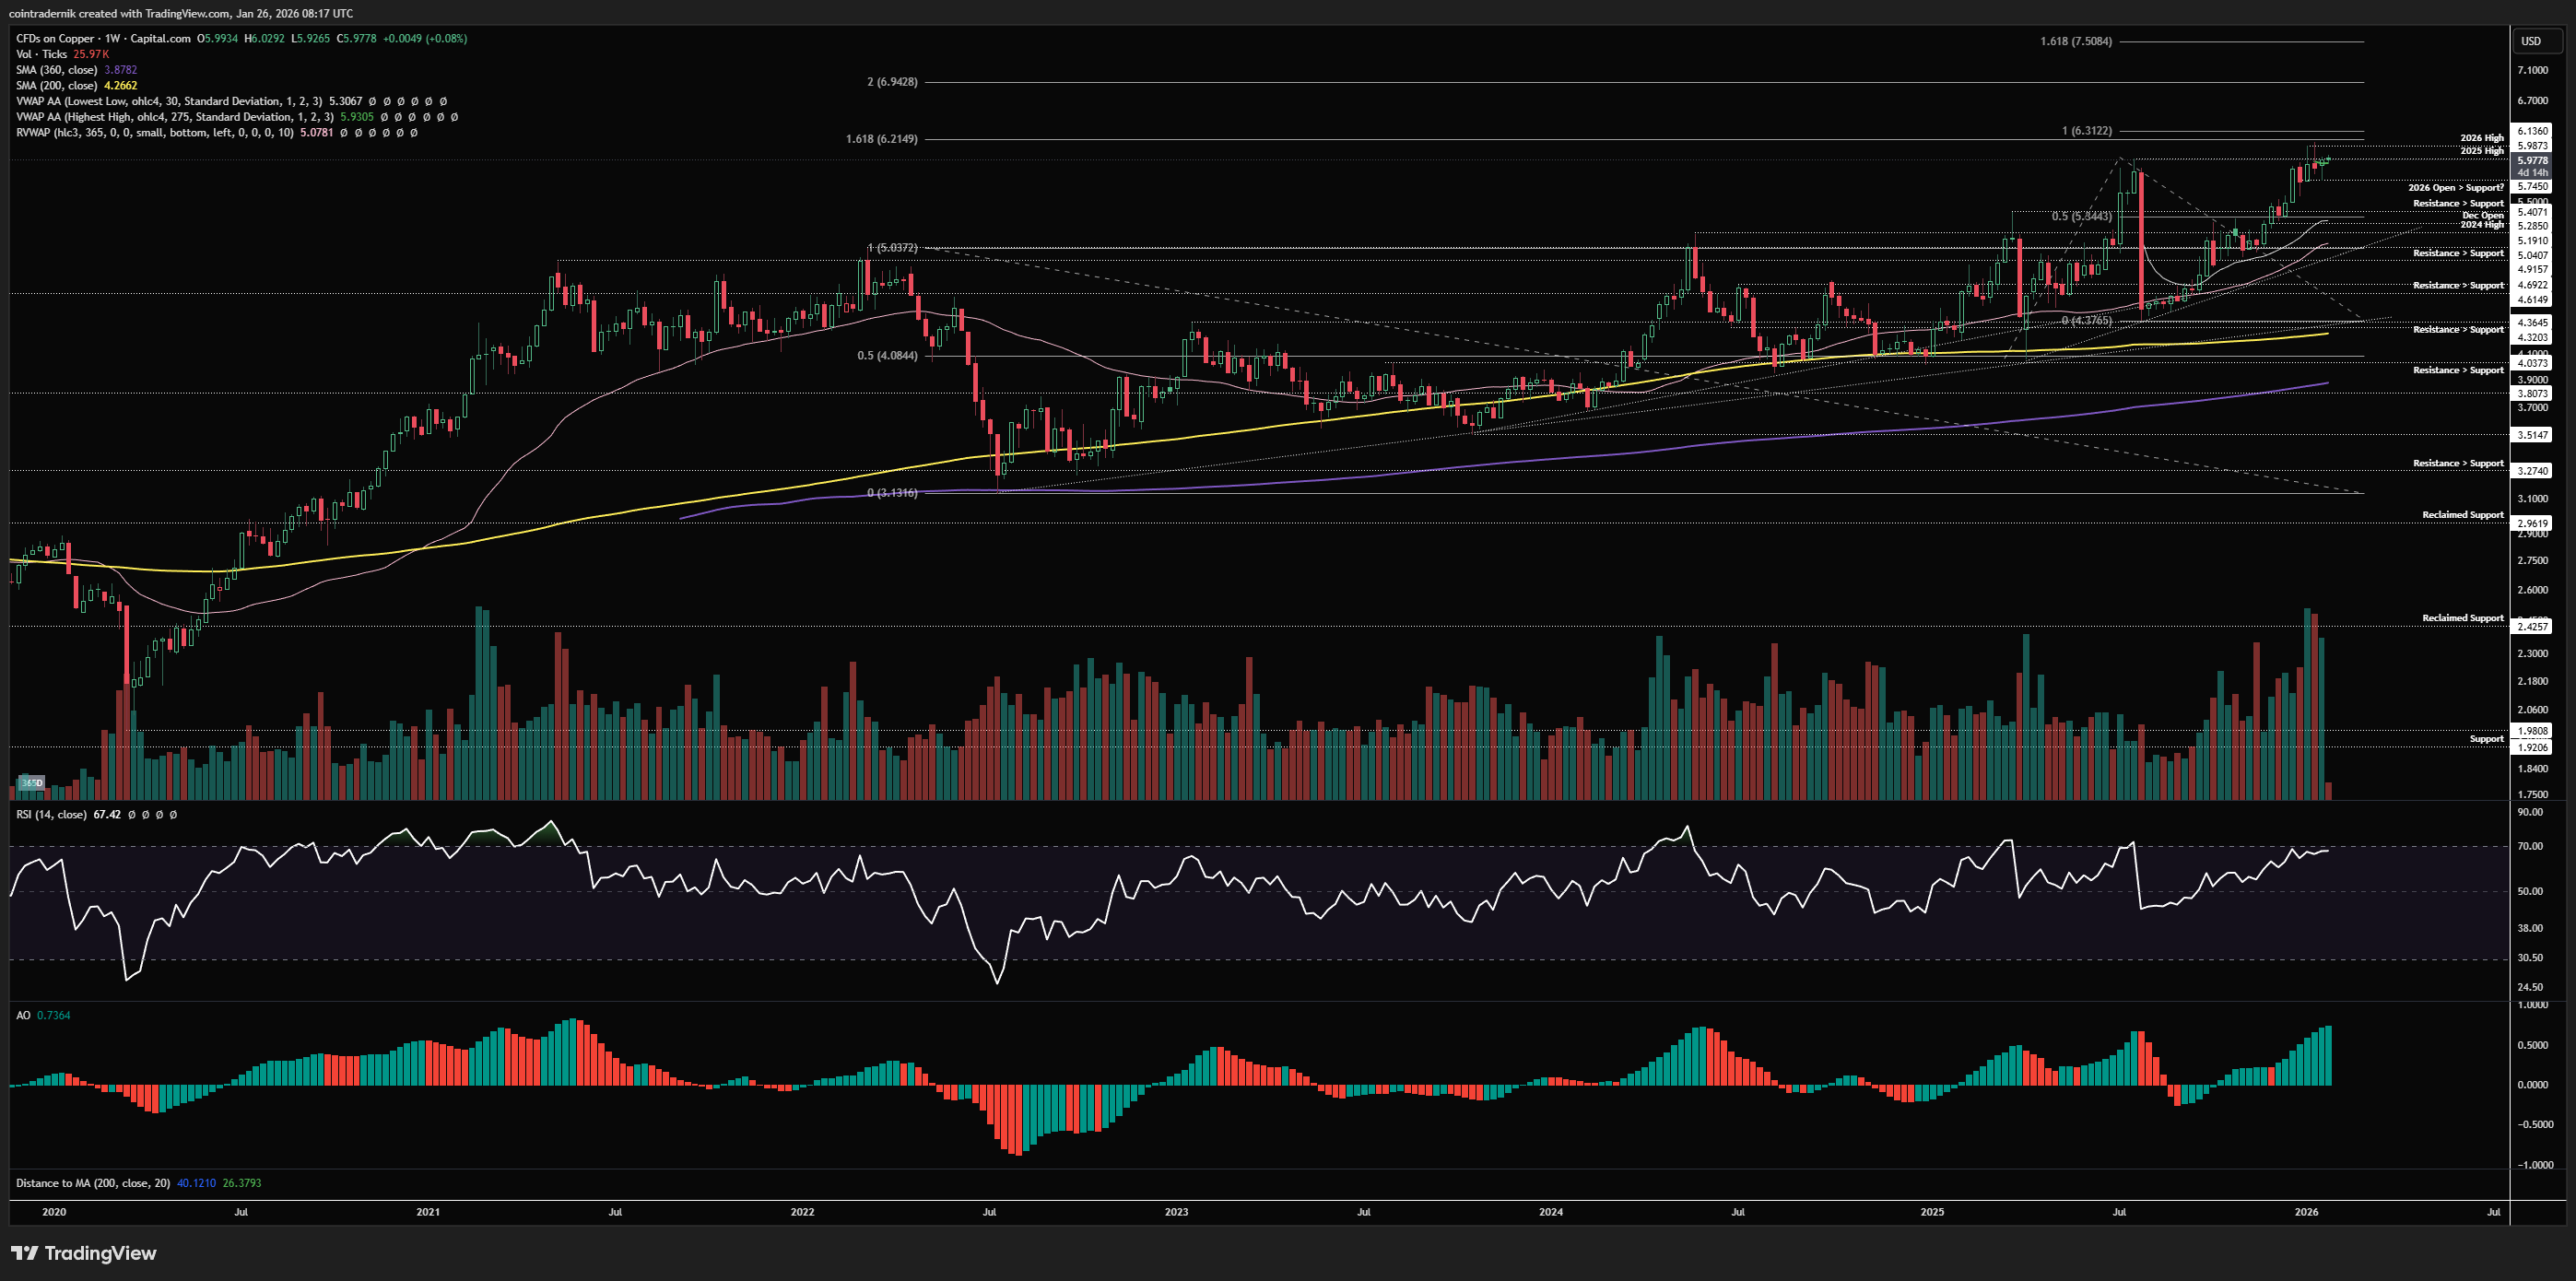
Beginning with the weekly for Copper, we can see that price is just consolidating right around all-time highs, with the 2026 open acting as support around $5.74 and price closing marginally below the 2025 high last week. This $6 level is what we want to see flipped into support for the next leg to begin, and I expect as Silver and Gold mark out local highs the rotation will favour Copper given the technical setup here right on the cusp of price discovery, with building momentum on the higher timeframes. If we can close the week above $6.14, I think we trade towards $6.95ish before we find any real resistance, with $7.50 and $8 the two key fib levels beyond that. If we fail to break out here, I would look for any higher timeframe retracement into $5.50ish as an opportunity to add at prior resistance turned support.
Daily:
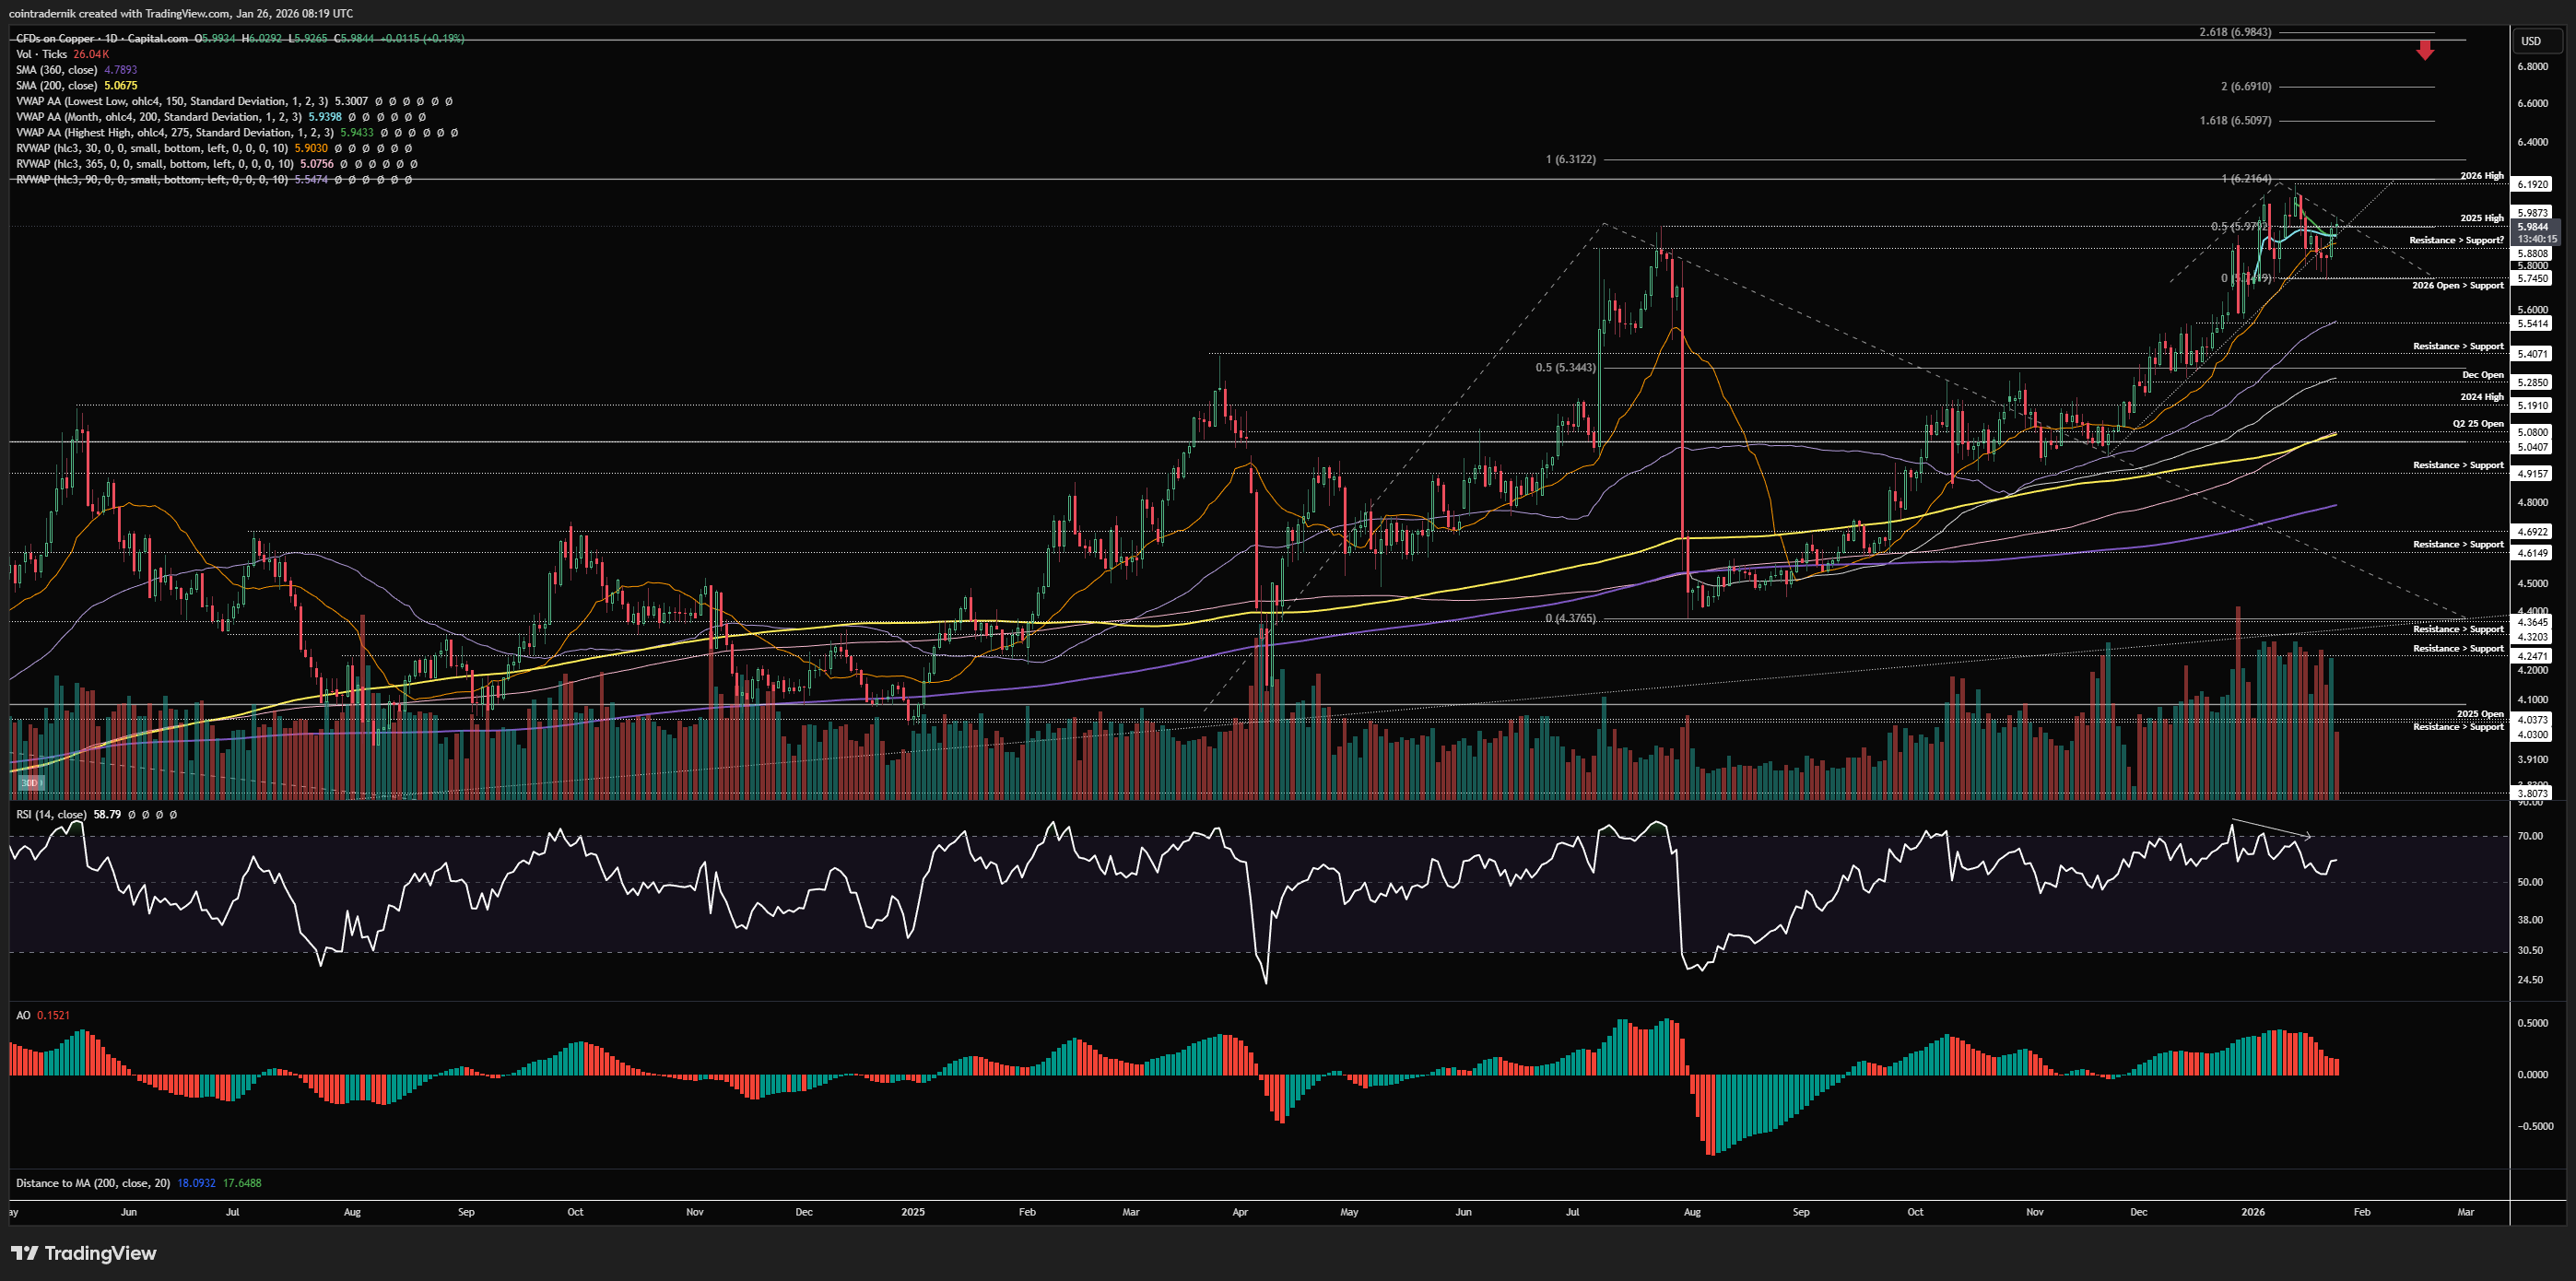
Dropping into the daily, we can see that there is some trend exhaustion here on this timeframe into the highs but price is marking out a higher-low above the yearly open, so there are some mixed signals. The 2025 high at $6 is acting as local resistance, but given daily structure is still bullish and the strength of the trend on the weekly, we should expect this divergence to be invalidated, providing further fuel for upside. If we can hold above $6 early this week and flip it into support (along with the anchored VWAP from the high and the January VWAP), I would expect price to take out $6.20 later this week and RSI to break back above 70, invalidating this momentum divergence. If, instead, we reject here at $6 and price breaks and closes below $5.75, daily structure turns bearish and the trend exhaustion is validated, from which I Would expect the 90d rolling VWAP at $5.55 to be retested at least, if not the major support below at $5.40 - where, I hasten to add, I would be a buyer, increasing overall exposure with a view towards continuation through $6.20 later this quarter into Q2.
Receive the latest updates directly to your inbox

Price: $60.93
Weekly:
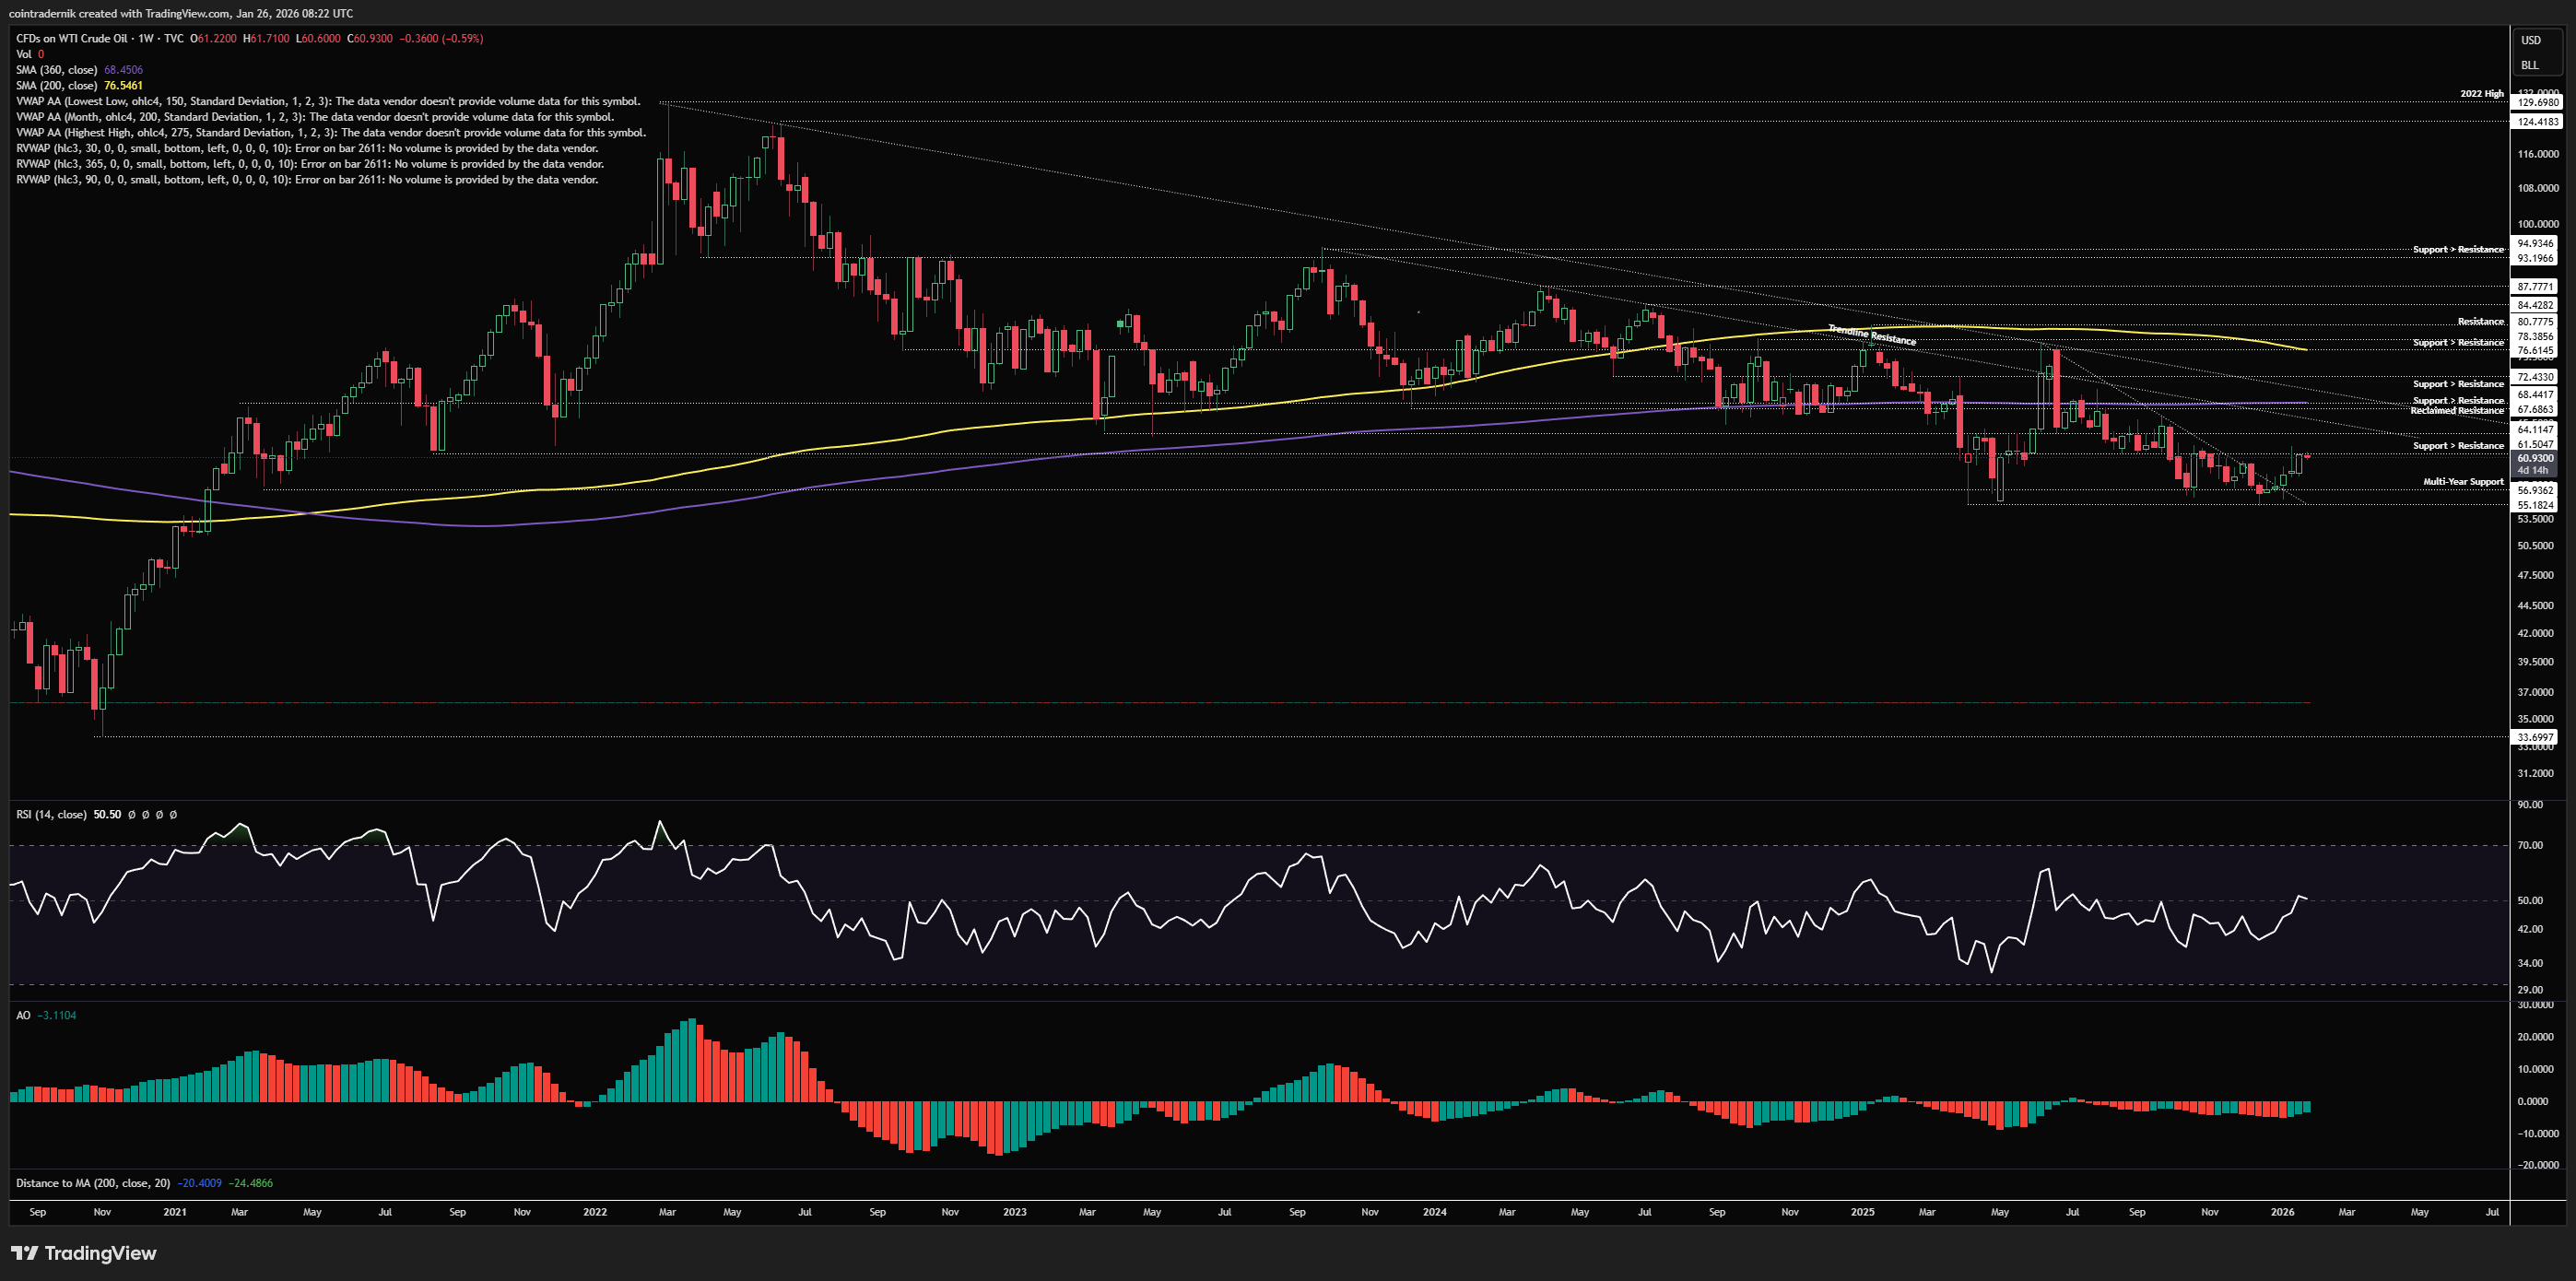
Beginning with the weekly for US Oil, we can see that price rejected at prior support turned resistance at $61.50 a couple of weeks ago after breaking out above multi-month trendline resistance off $55 support, but last week saw price push higher again off the open, closing right around that $61.50 level. Given the weekly trendline breakout and with RSI pushing back above 50 here, I expect $61.50 does not hold as resistance short-term, but rather price pushes through it and moves towards the next trendline, with $64-$65 likely to provide much more resistance. As mentioned a couple of weeks ago, whilst positioning is extreme in its expectation of further downside, this alone is not a catalyst for a major reversal, and I expect price-action to continue to be choppy and range-bound in early 2026. If, however, we can break and close above that trendline from the 2023 highs, flipping $64 into support, we can then entertain a move higher into $68.50, near the upper trendline. And above that, we have the 200wMA confluent with the 2025 highs around $77, which I expect will act as a ceiling throughout 2026 until the midterms have passed.
Daily:
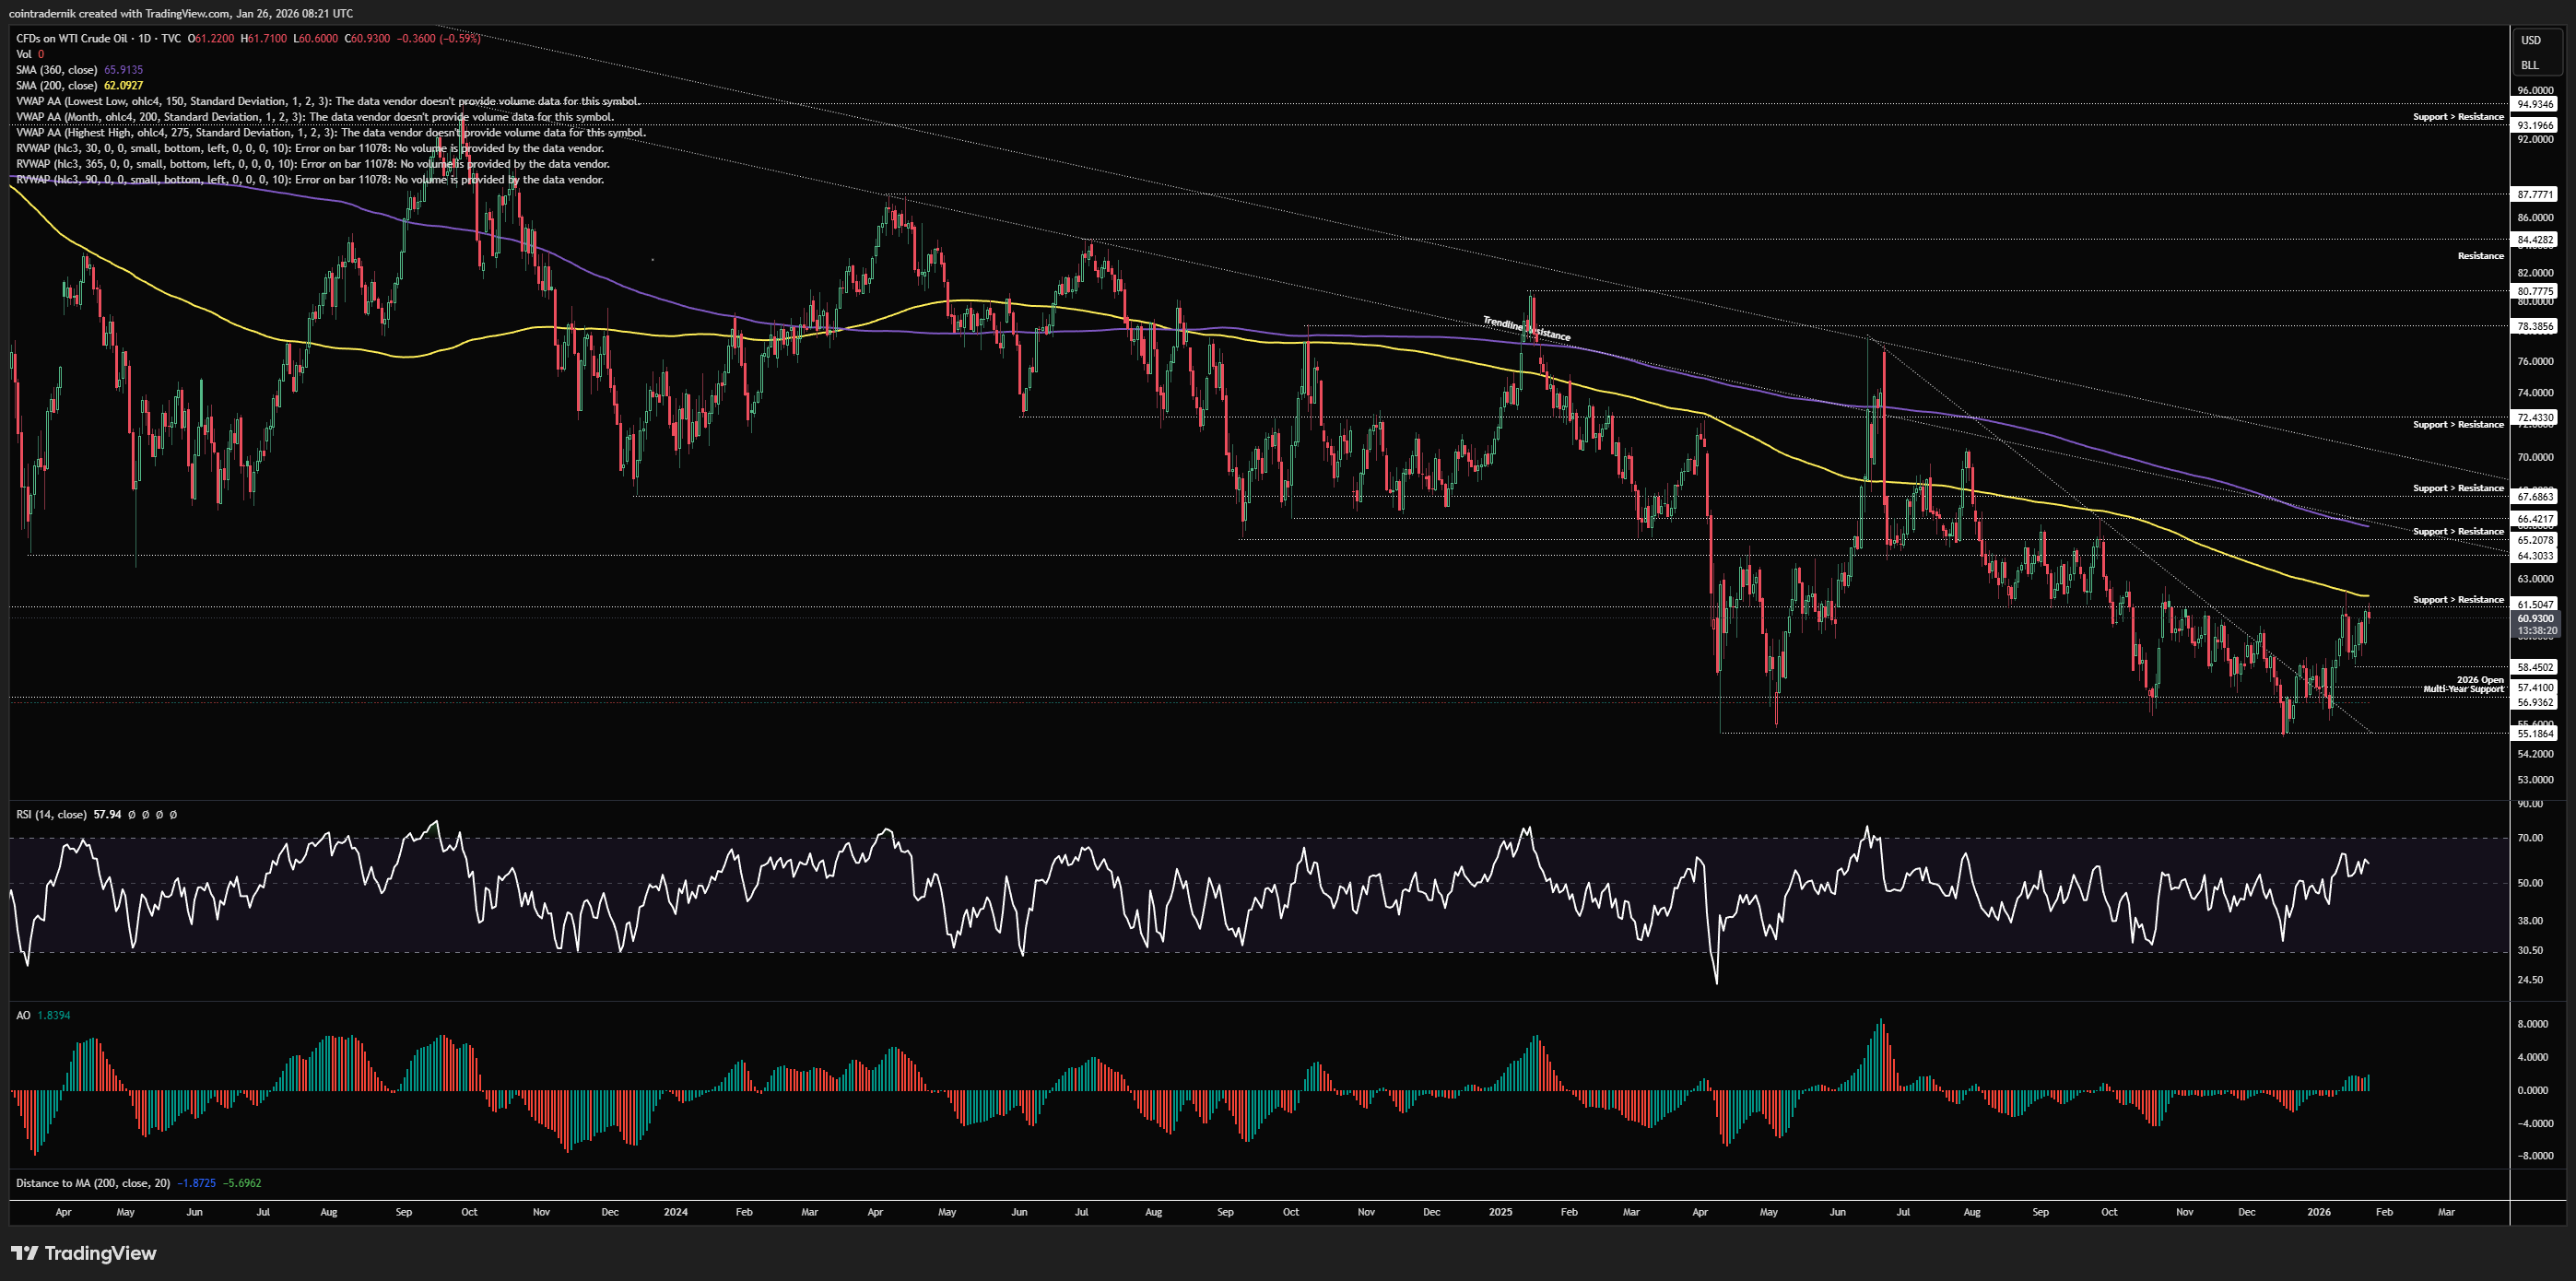
Turning to the daily, we can see that daily structure has turned bullish but momentum is struggling a little here at that prior support and 200dMA ~$61.50. Flip this area into support this week and I think we could bid a lower timeframe pullback into that level and target $65.20 into early Feb. This was obviously where I was expecting the relief rally to take price when I entered longs marginally above $57, but I cut most exposure at $61.50 and then got stopped in profit on the rest last week before price inevitably pushed back into weekly highs. As such, I am happy to look for longs again but not until we flip this resistance back into support. Alternatively, if we reject here again, I'd bid a sweep of last week's low into the yearly open, with invalidation on acceptance below $55.
Price: $465.95
Weekly:
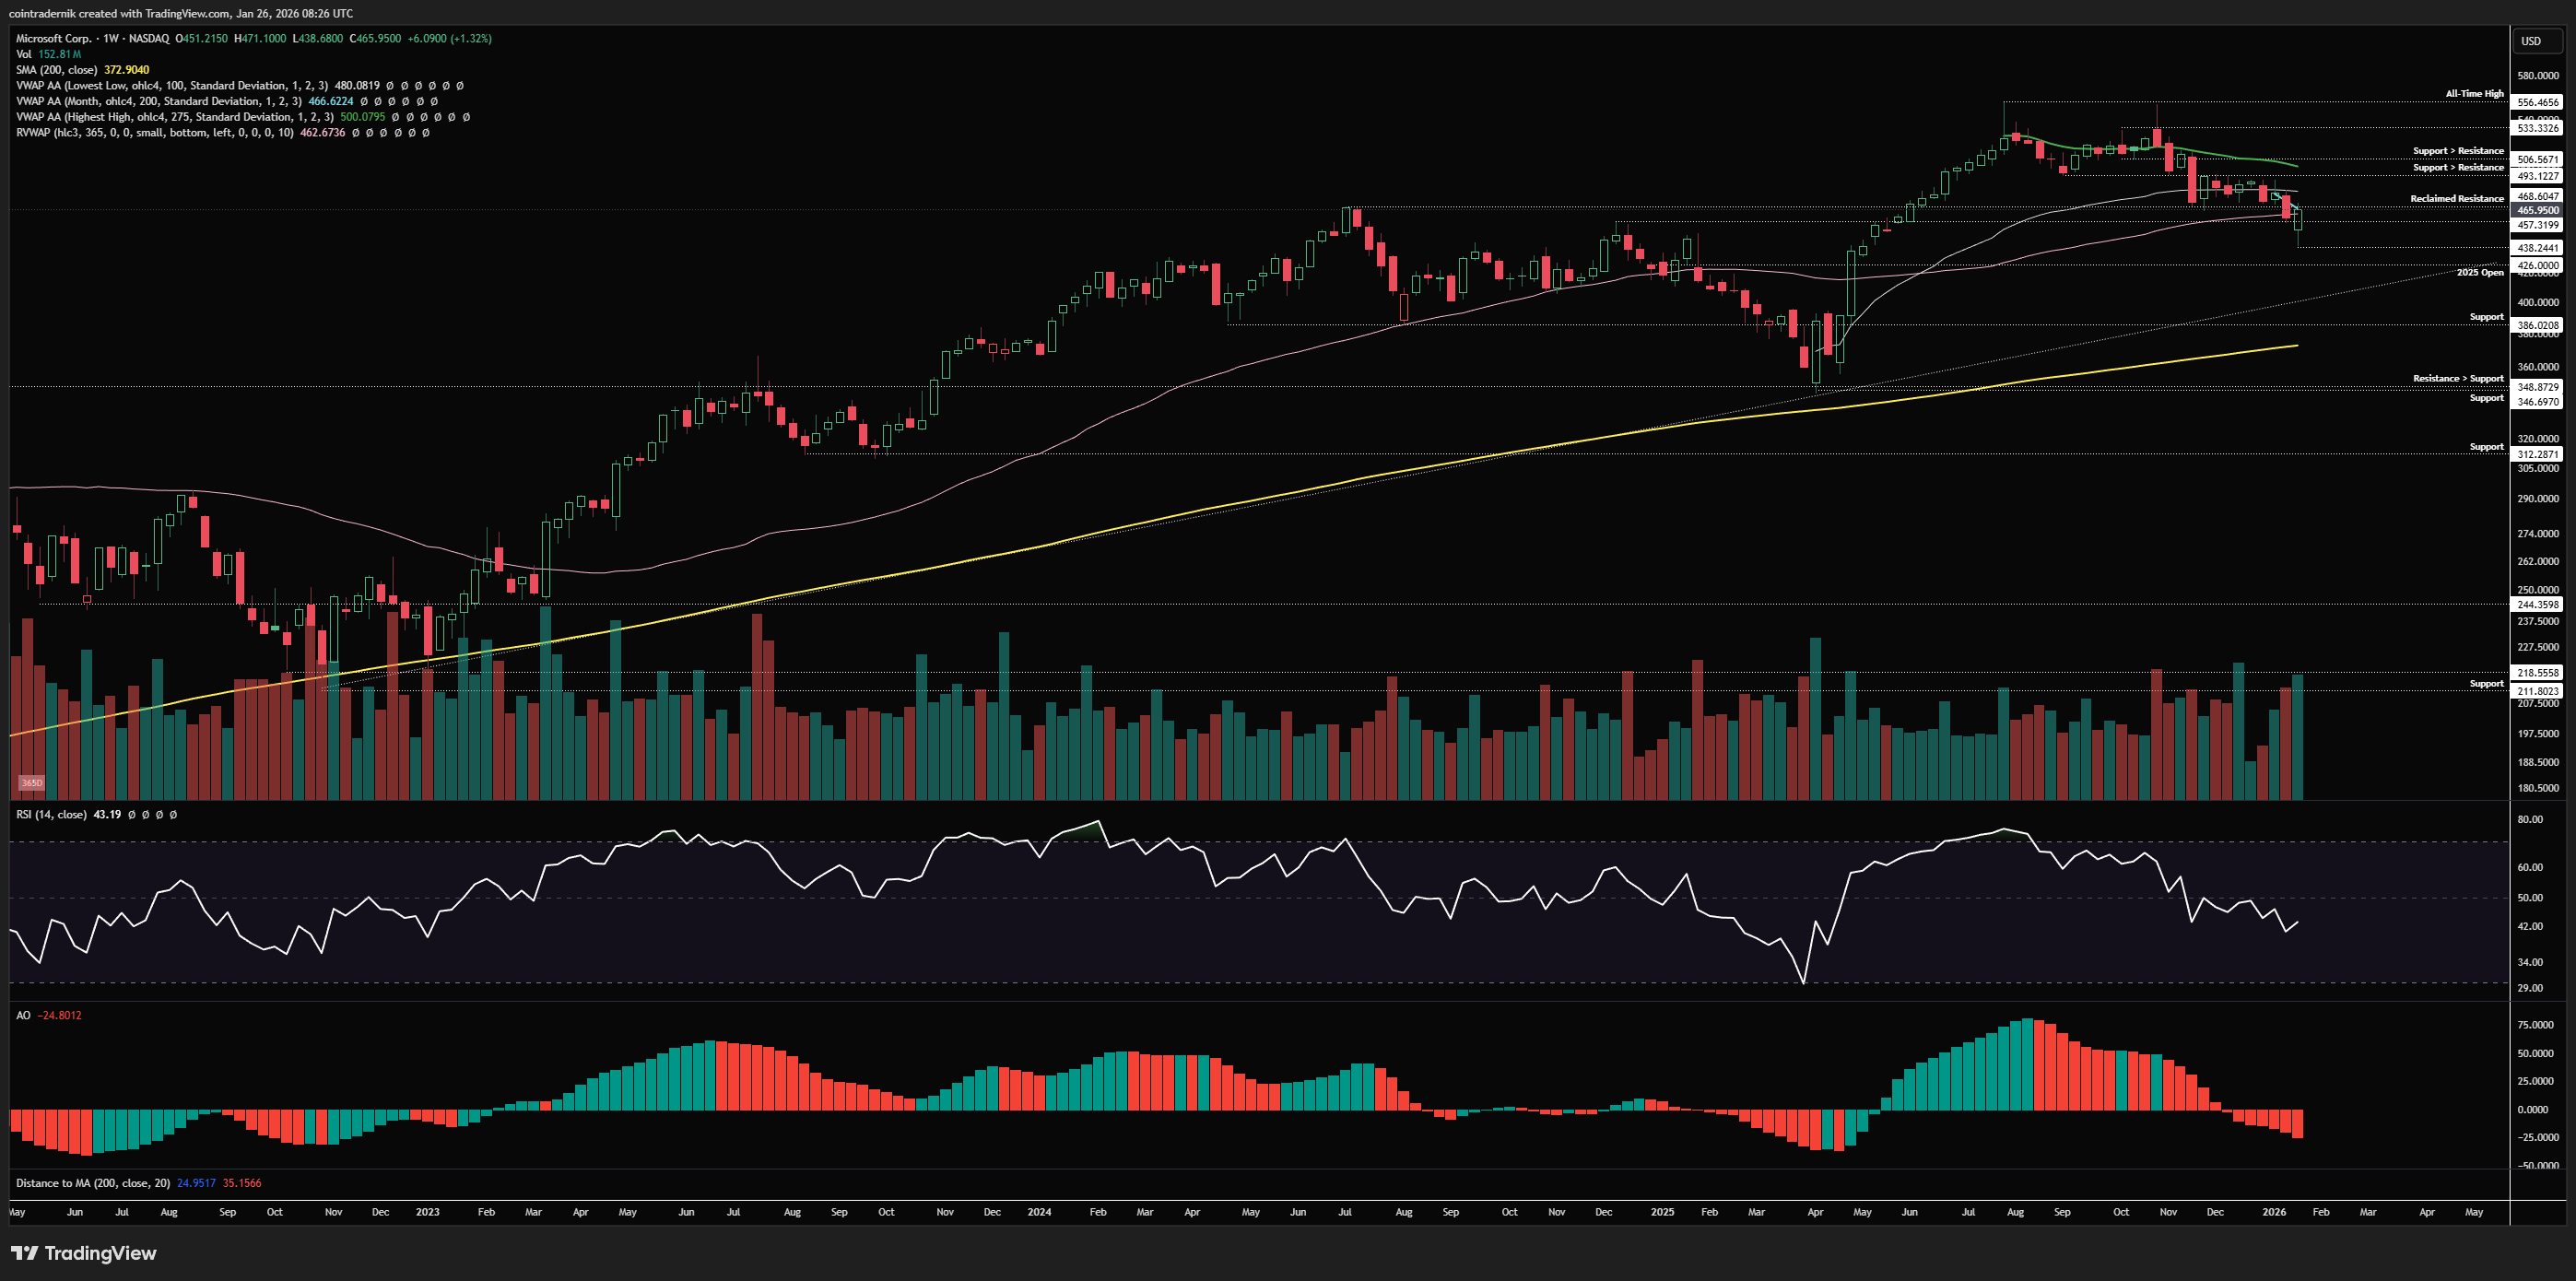
If we begin by looking at MSFT on the weekly timeframe, we can see that price has been trending down from the summer 2025 highs at $556, marking out a double top and then retracing into the 365d rolling VWAP in Q4, consolidating around there but with weak momentum, then breaking below prior resistance at $468 last week into $438, where price bounced and closed back near the weekly high. We are obviously still within a long-term bull trend on MSFT, with price still well above the April 2025 lows at $346 and firmly above trendline support from the 2022 lows, but we're kind of in no man's land here, having broken below prior resistance, with weak momentum and bearish weekly structure. There is some chance that the low of last week holds, of course, but if it doesn't then no doubt we retest the 2025 open around $425 (and I would bid that area as a gap hold). If last week's low does hold and we were simply deviating below 2024 highs only to reclaim them as support, then I would want to see price push higher this week above $480 (the anchored VWAP from the April 2025 lows), and then hold above $468, looking for lower timeframe pullbacks into that level to potentially bid for a move back towards $500 (the anchored VWAP from all-time highs). With regards to continuation to fresh highs, until we flip $500 into support again, the structure and momentum here is still weak and I wouldn't be so eager to hold levered exposure at major resistance. Above $500, we can look to re-assess and play dips into support back towards highs, but if we do get a nice little long from $470 being reclaimed as support into $500 then I'd absolutely bail at that level.
Daily:
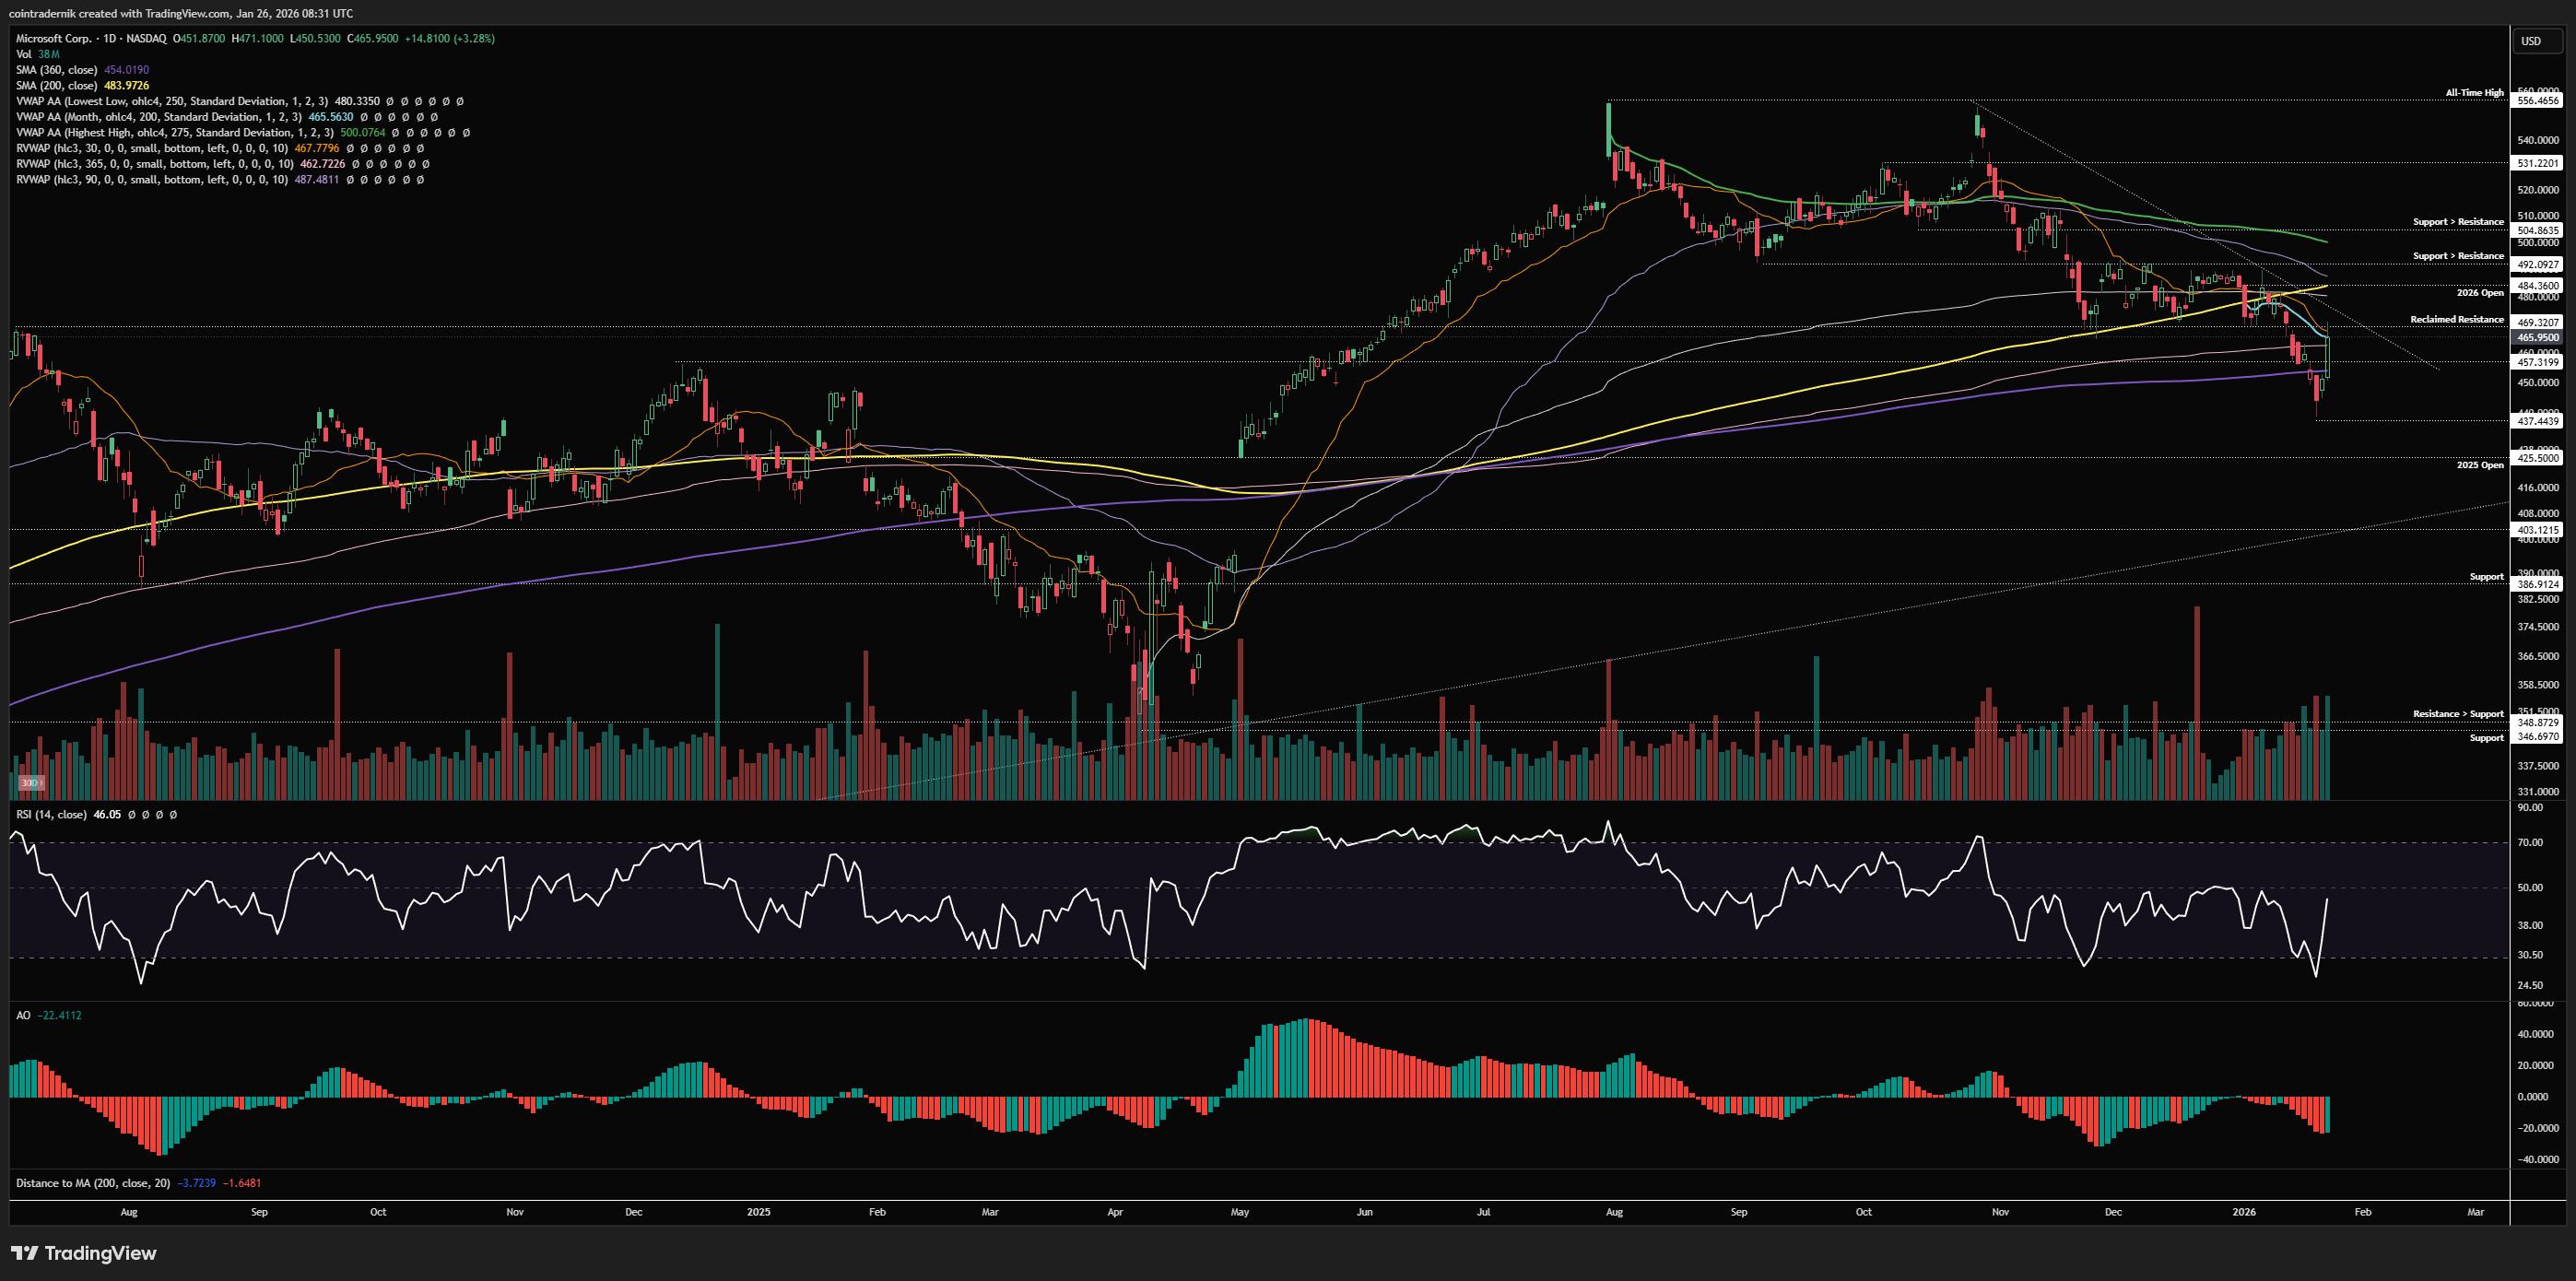
Turning to the daily, we can see that structure and momentum are also bearish on this timeframe, despite the late bounce last week, with daily RSI still being capped below 50 and price still below trendline resistance. If you were brave enough, you could potentially look for shorts into that trendline with invalidation on a daily close above $485, looking for continuation lower through last week's low, but with earnings on Wednesday there's obviously the gap risk. If we get a post-earnings bid and price accepts back above the yearly open and anchored VWAP from the 2025 low (with momentum breaking back above 50 on daily RSI), then buying the next pullback makes sense, with somewhere between $470-$475 likely to mark out a higher-low, from which we continue into that critical $500-$505 range. If we get weakness post-earnings and this bearish structure holds, I'd like to see momentum diverge into a move below last week's low, looking to layer bids between there and the 2025 open at $425, as acceptance below that opens up the likelihood of a gap fill back towards $400.
Price: $187.67
Weekly:
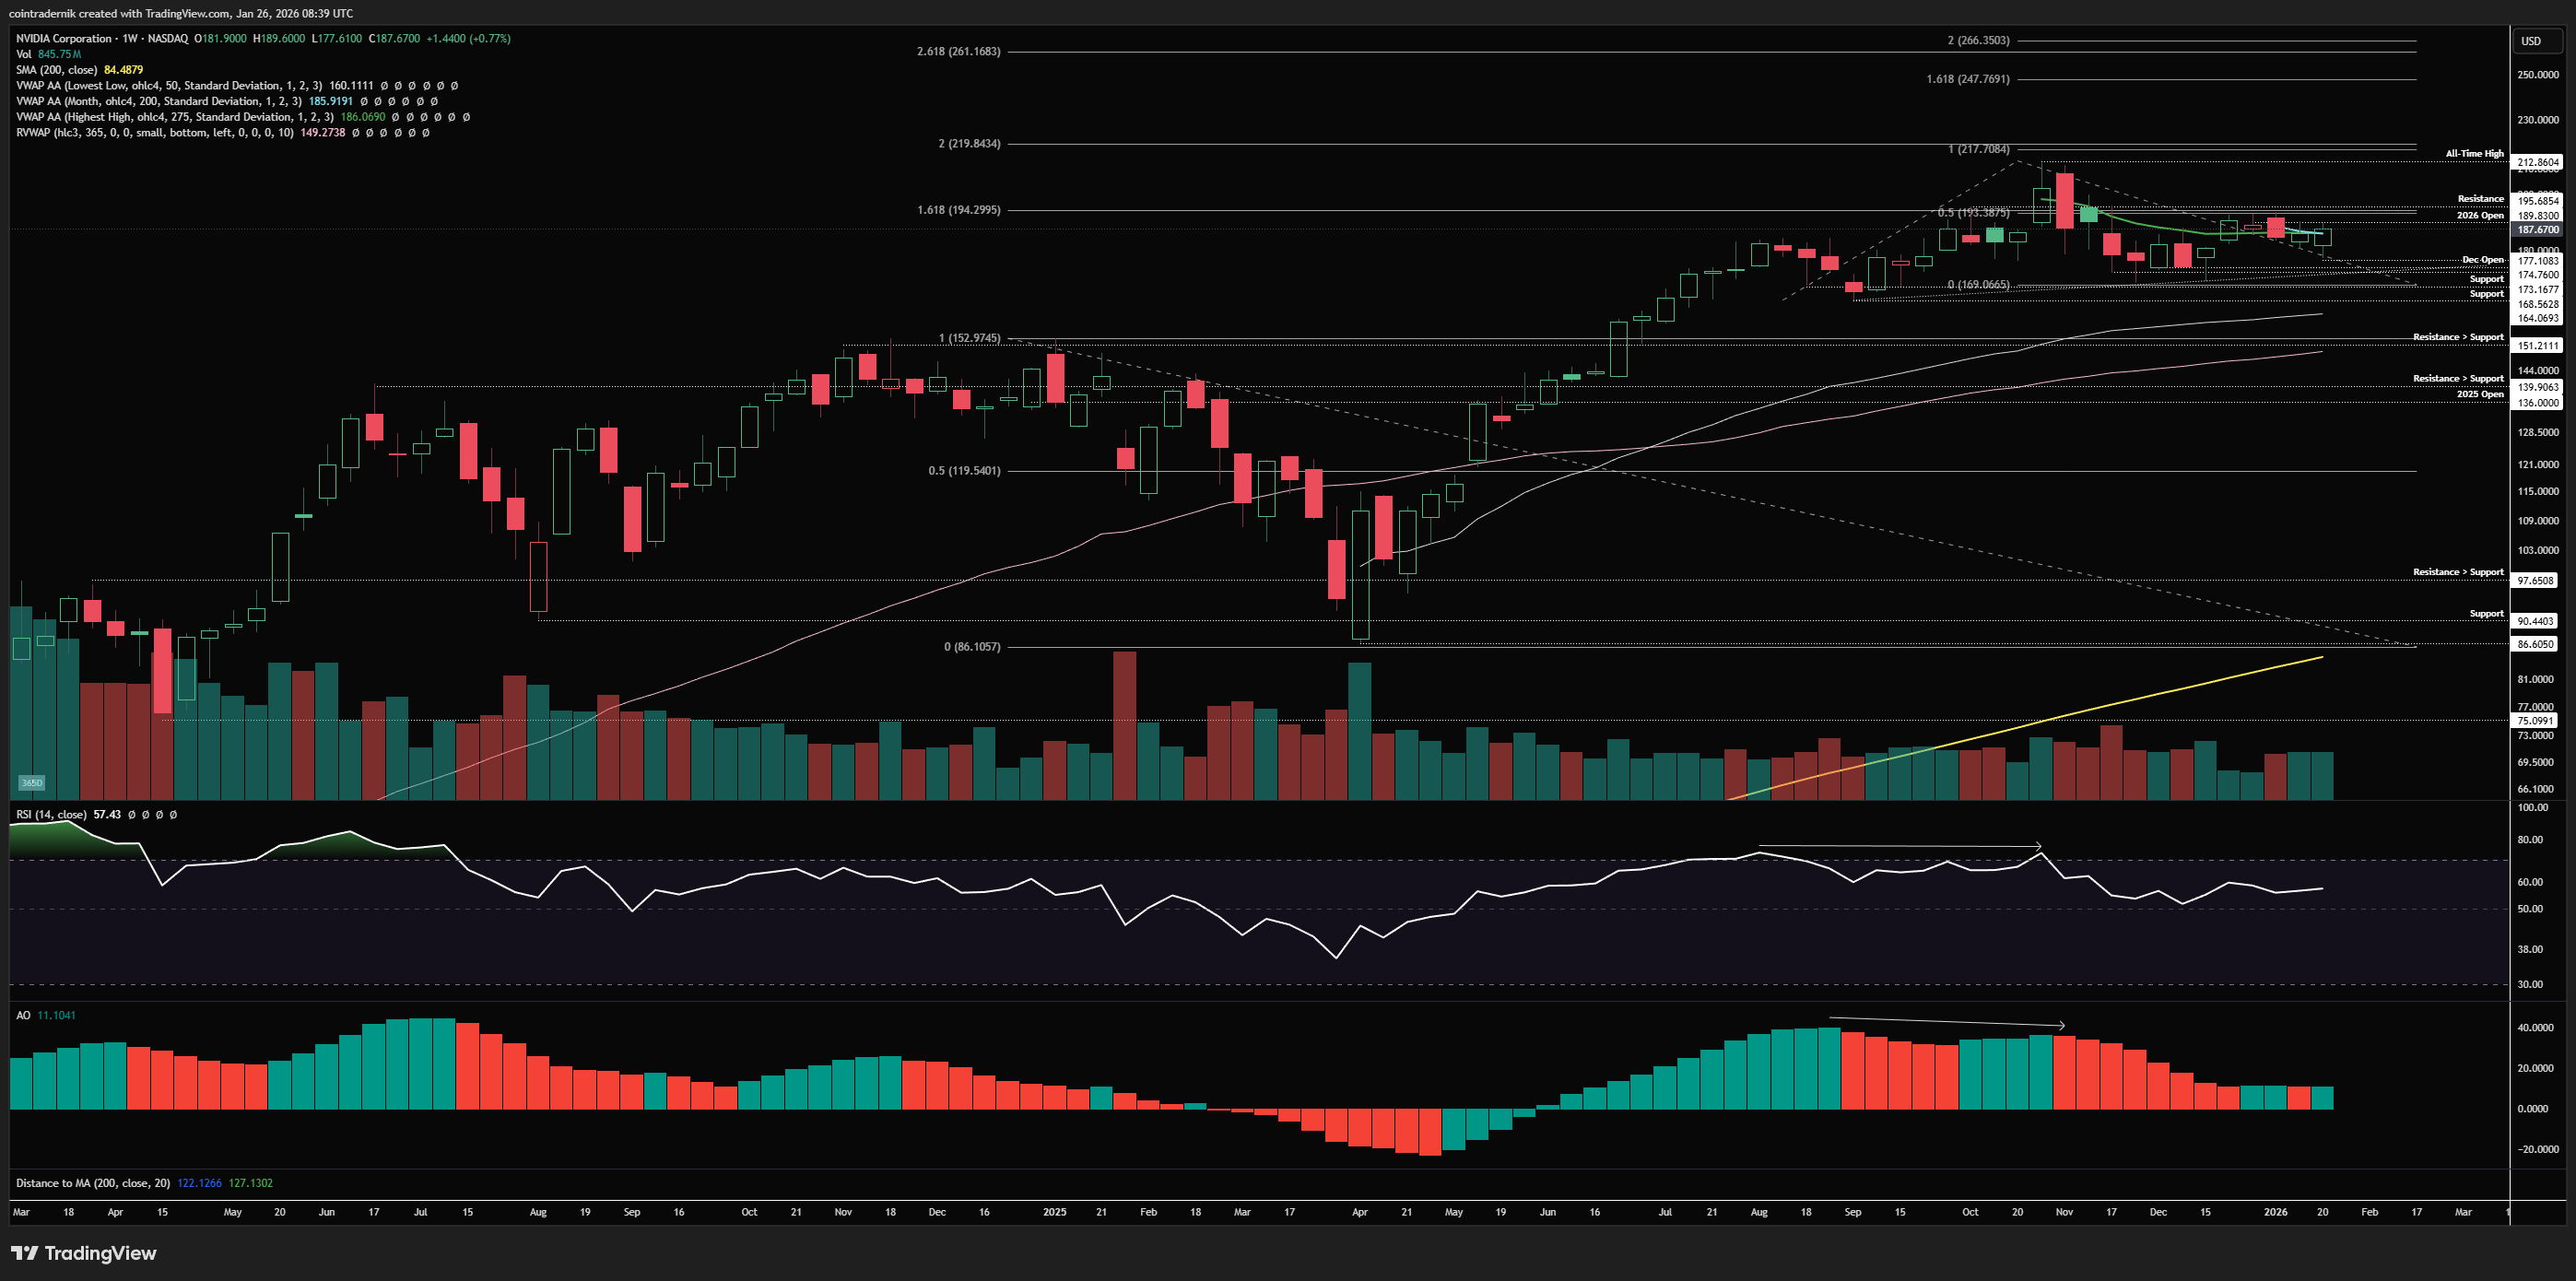
Looking firstly at the weekly timeframe for NVDA, we can see that following the bearish divergence price traced into major support, marking out a higher-low above $164 and then consolidating in a tight range for several weeks whilst momentum reset. That reset, in my view, appears to have completed, with price now pushing higher, breaking above the anchored VWAP from all-time highs, finding resistance at $190 and now marking out another higher-low at $177, above the prior range support. If we can now flip $190 into support, I like NVDA longs back into $213 and beyond, towards $250. I can't be bearish here given the higher-lows and the weekly momentum reset unless we reject here and break and close the weekly below $160 - then we have a significantly worse-looking higher timeframe chart for Nvidia. Until then, expect the higher-timeframe trend to hold and buy dips above $190.
Daily:
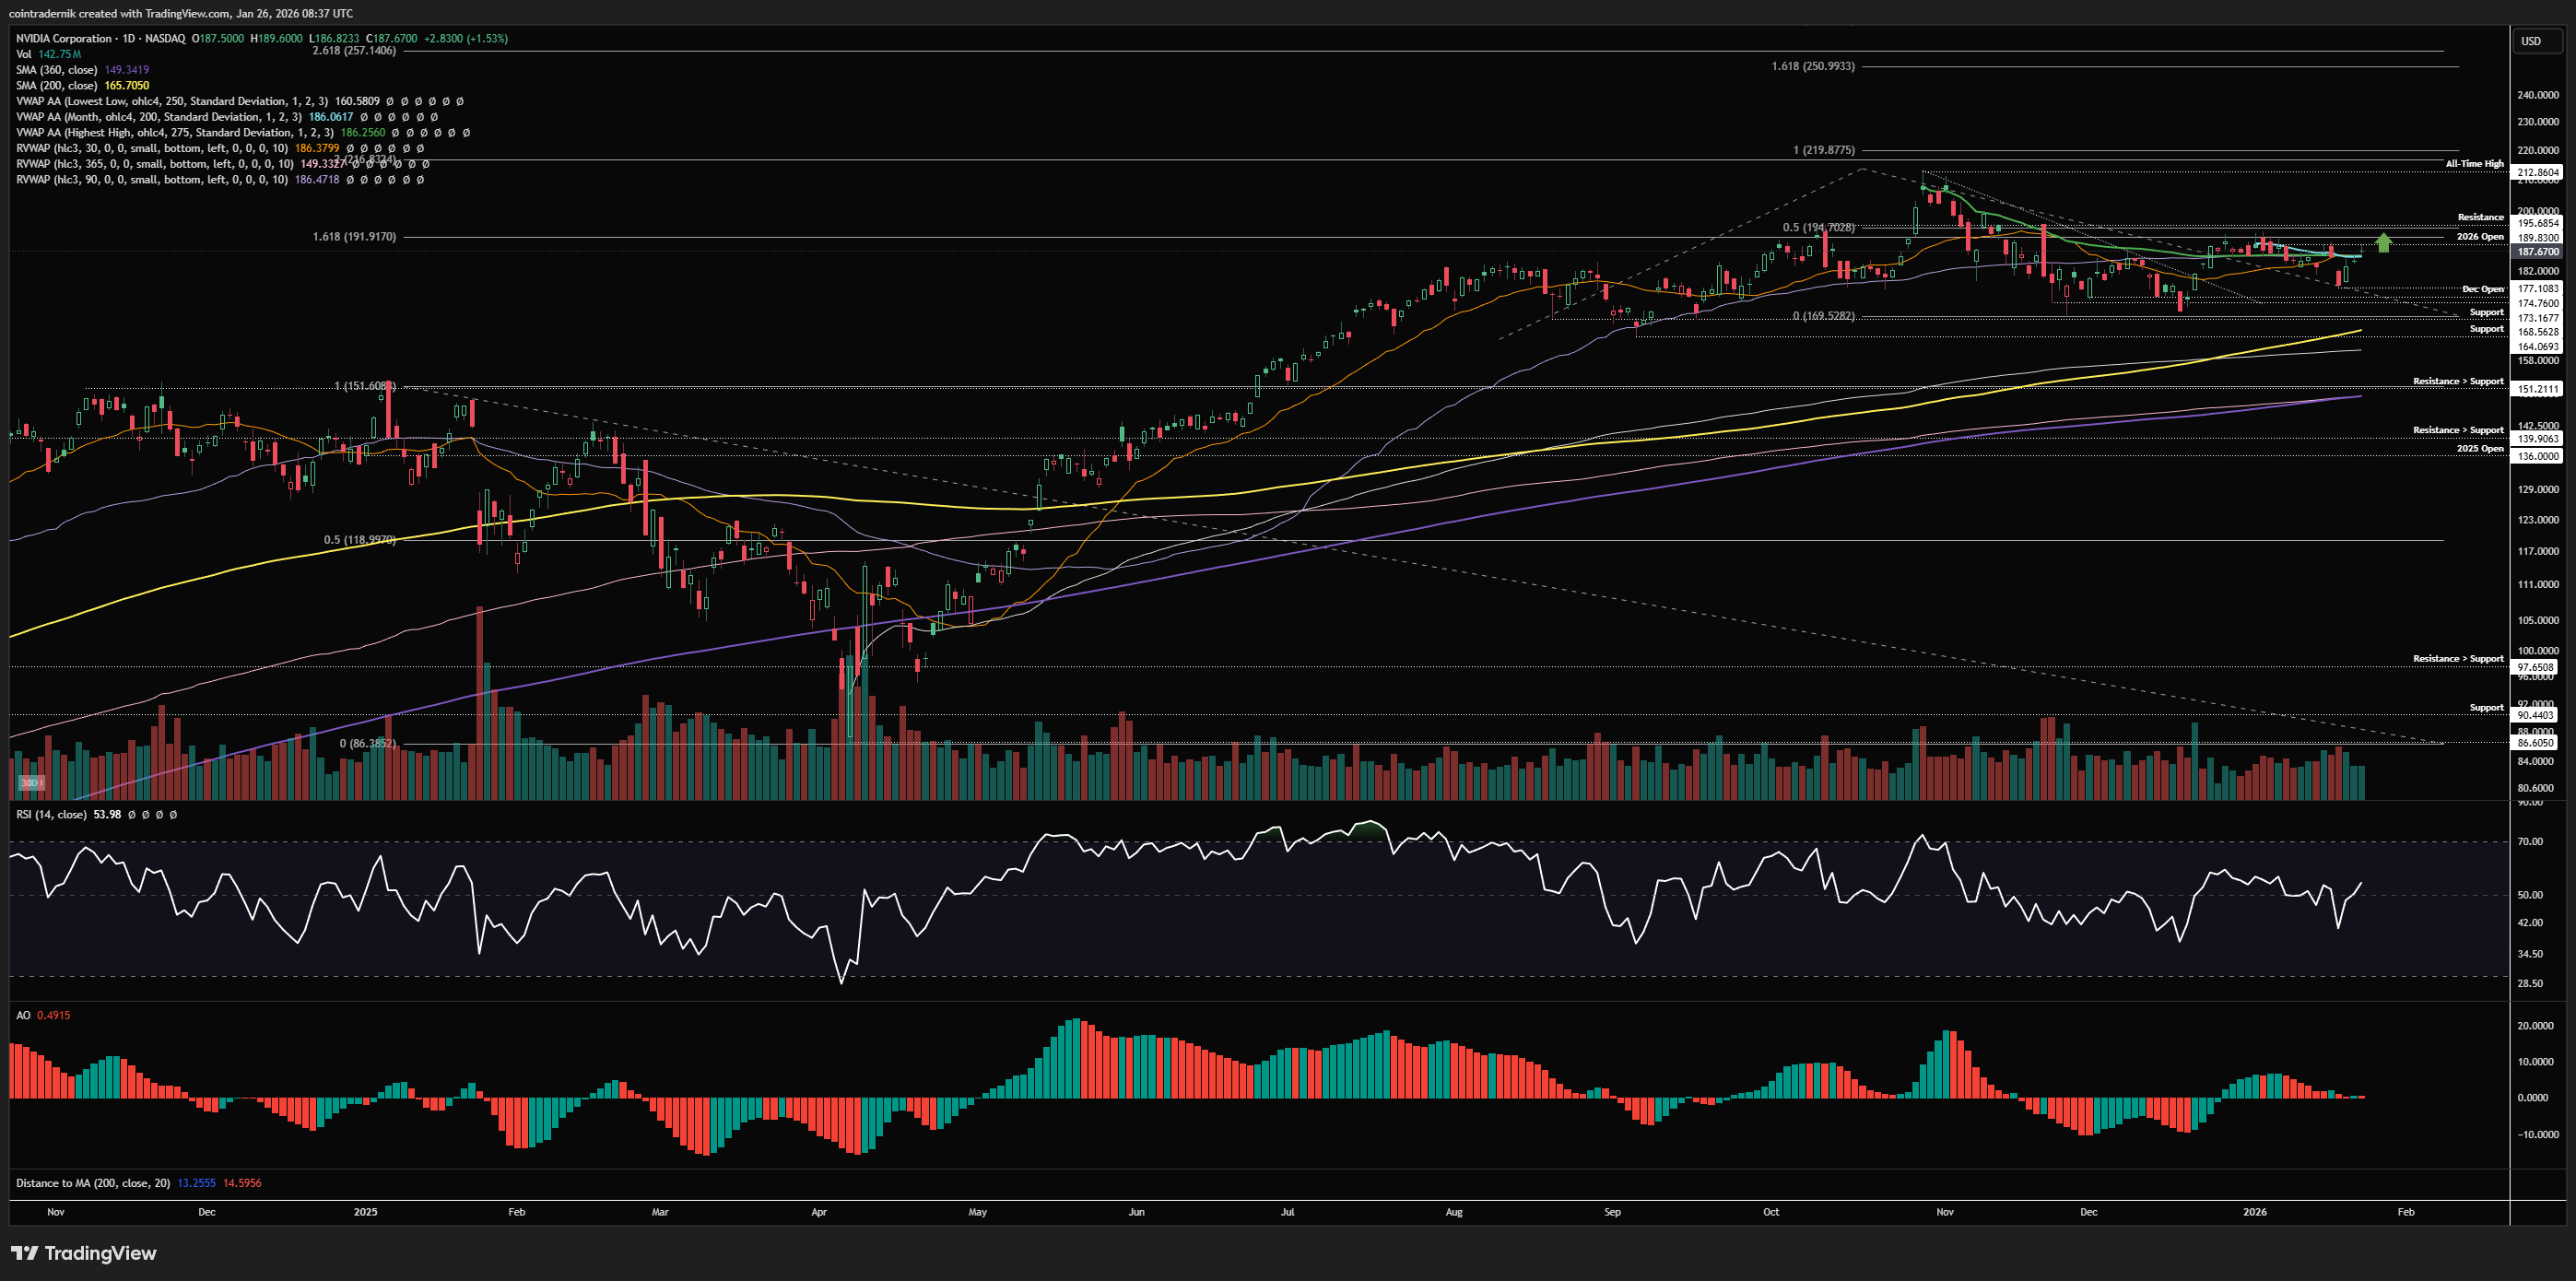
I have marked this out on the daily, but it's pretty clear to see just how much confluence we have in this $185-$195 range, with a break and close above $195 on this timeframe opening up that continuation leg higher into all-time highs. Daily structure and momentum are technically bullish and so we should expect $190-$195 to give way into February and price to trend higher from there. If we wick above $195 and reject and close back below the 2026 open at $189, we could look for tactical shorts back towards $177, but really I don't like shorting NVDA unless it validates a higher timeframe structural shift - and for me that only happens below the $160-$165 support zone. Not much else to add here for the time being...
I hope you've found some value in the read this week - please RT, share, engage etc. if so!
And if you've not already signed up for Ostium, please do so and test out some of the recent updates, including:
Sign up here (you don't have to use my ref link, of course): https://ostium.app/trade?from=CL&to=USD&ref=CTNIK

.avif)