

Market Outlook #71 - Macro Mukbang
February 2, 2026
-
12
min read


This blog references an opinion and is for entertainment and informational purposes only. It is not intended to be investment advice. Seek a duly licensed professional for investment advice.
In this special edition of the 71st Market Outlook here at Ostium Insights, we'll be taking a look at the week ahead in markets, focusing primarily on FX, looking at price-action, positioning and event risk for EUR, JPY, GBP, AUD and US Oil.
Now, let's take a look at the extremely busy week ahead, with 3 interest rate decisions and key growth and inflation data, culminating in Nonfarm Payrolls:
MONDAY: US ISM MANUFACTURING PMI (JAN): (CONSENSUS 48.3 VS PREVIOUS 47.9)
MONDAY: US LOAN OFFICER SURVEY
TUESDAY: RBA INTEREST RATE DECISION: (CONSENSUS 3.85% VS PREVIOUS 3.6%)
TUESDAY: US JOLTS JOB OPENINGS (DEC): (CONSENSUS 7.1M VS PREVIOUS 7.146M)
WEDNESDAY: US ADP EMPLOYMENT CHANGE (JAN): (CONSENSUS 40K VS PREVIOUS 41K)
WEDNESDAY: US ISM SERVICES PMI (JAN): (CONSENSUS 53.8 VS PREVIOUS 54.4)
THURSDAY: BOE INTEREST RATE DECISION: (CONSENSUS 3.75% VS PREVIOUS 3.75%)
THURSDAY: ECB INTEREST RATE DECISION: (CONSENSUS 2.15% VS PREVIOUS 2.15%)
THURSDAY: US INITIAL JOBLESS CLAIMS: (CONSENSUS 210K VS PREVIOUS 209K)
FRIDAY: US NONFARM PAYROLLS (JAN): (CONSENSUS 70K VS PREVIOUS 50K)
Now, let's dig into asset-specific price-action for the week ahead, looking firstly at EUR:
Price: $1.1856
Weekly:
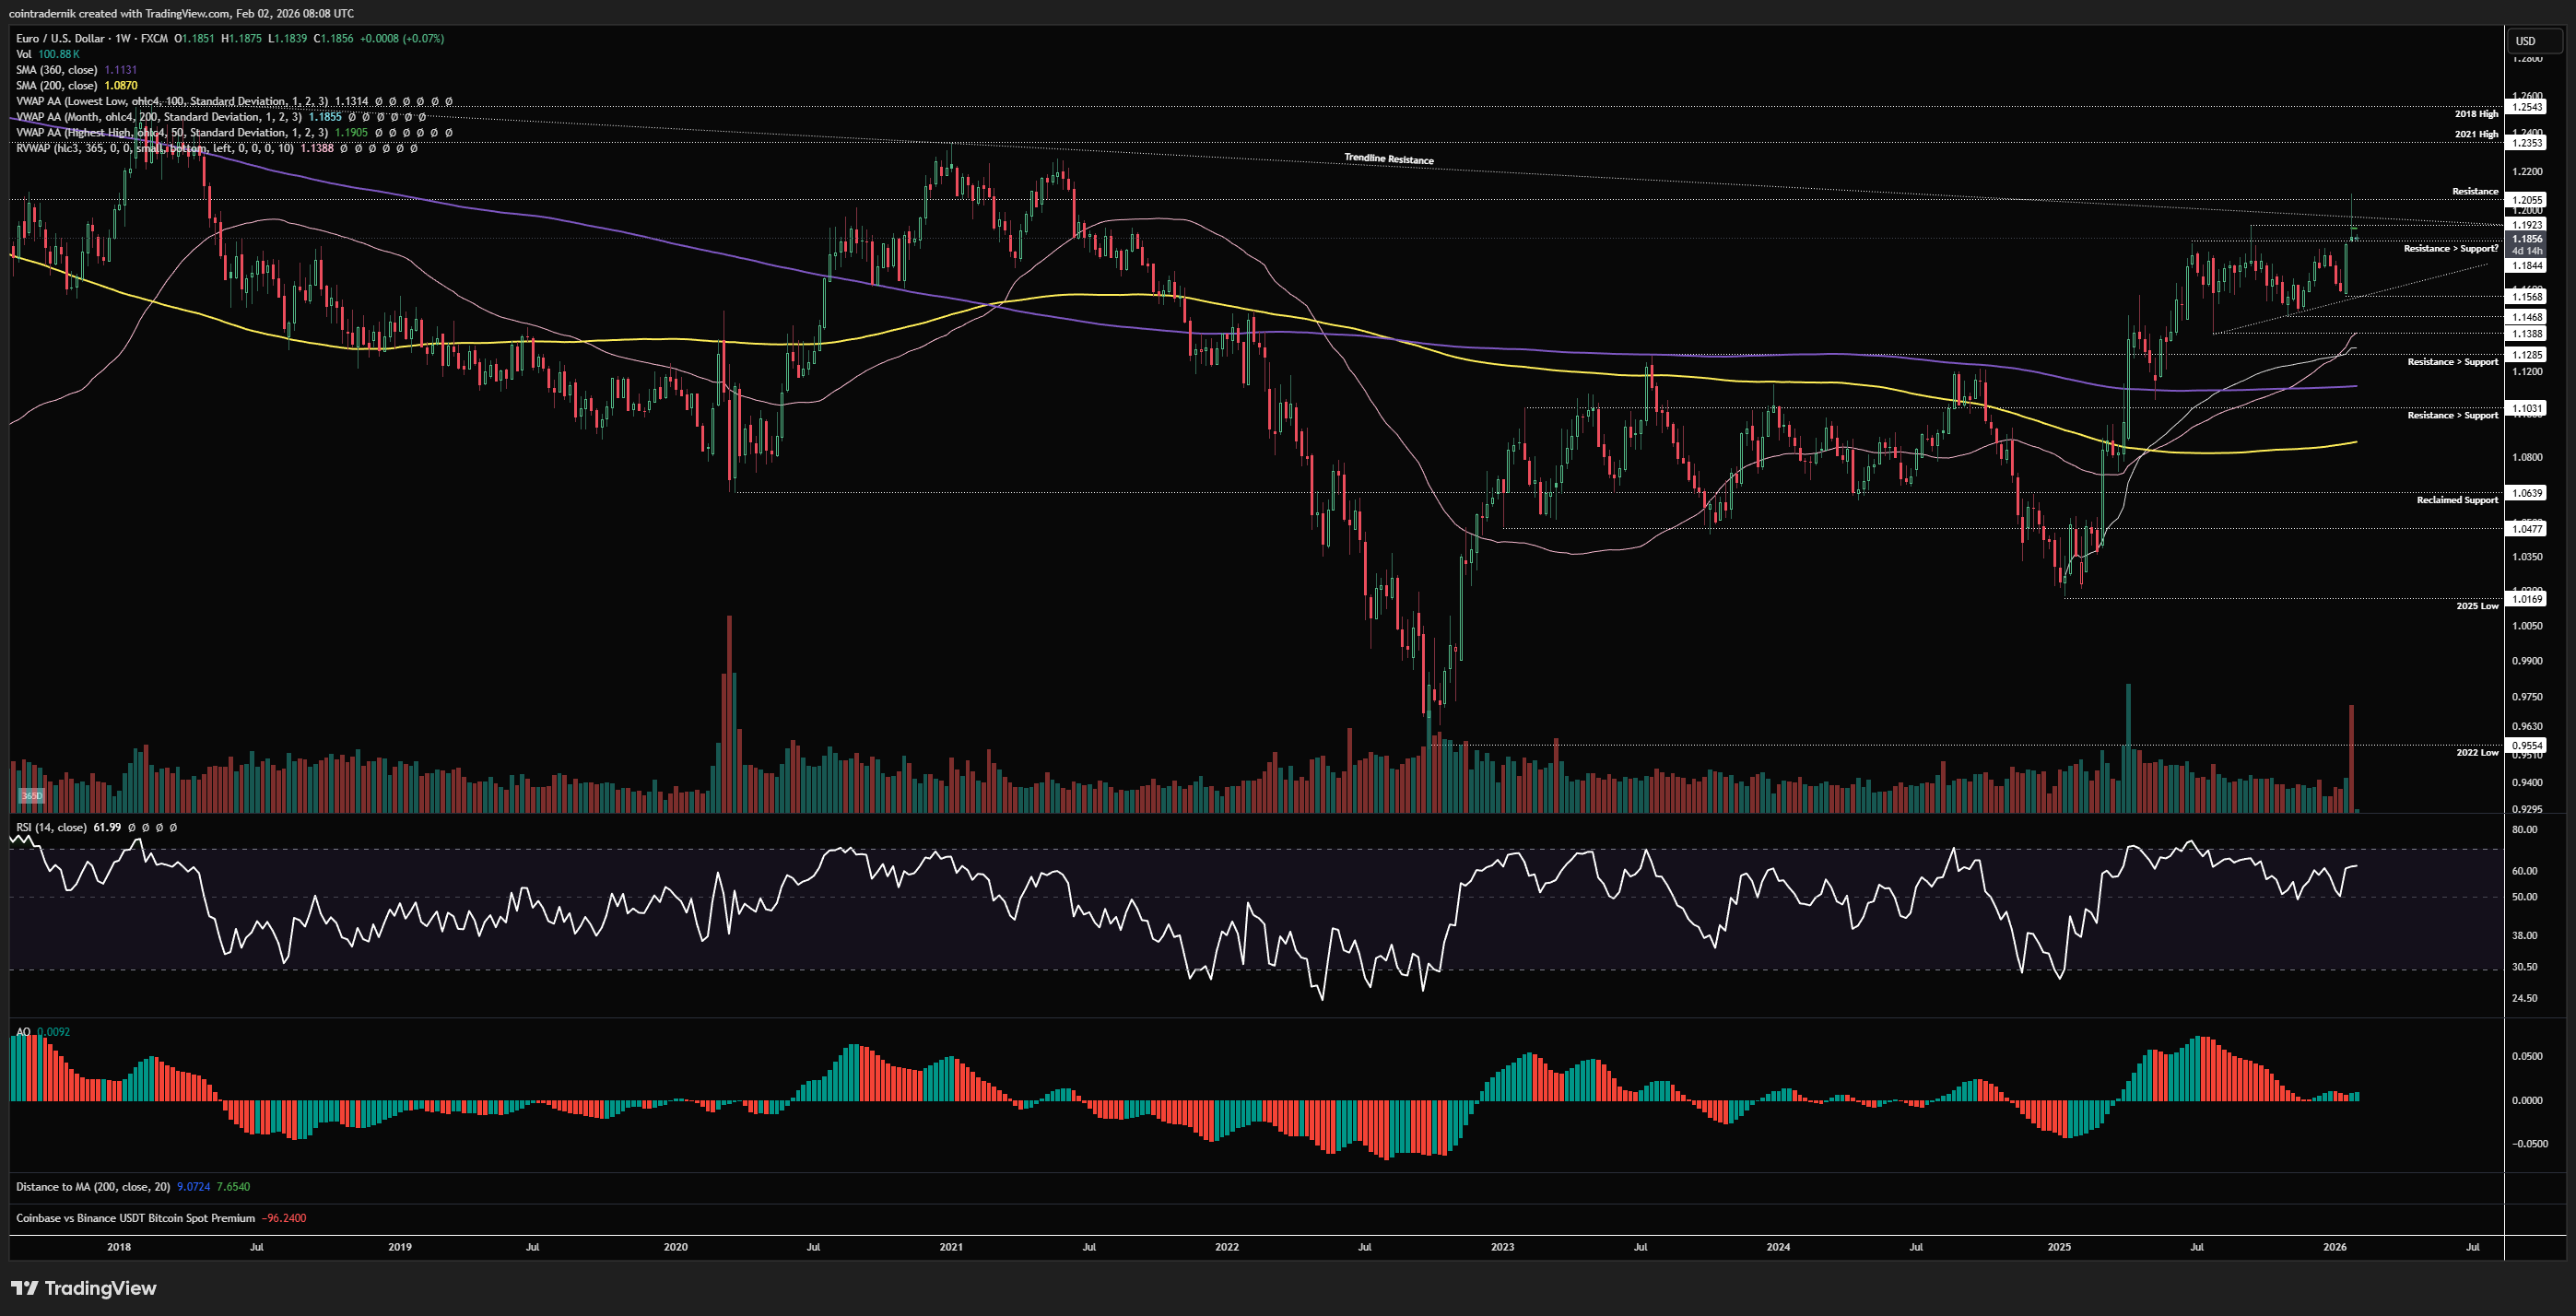
If we begin by looking at the weekly for EUR, we can see that price bounced hard off trendline support earlier in January at 1.1568, pushing up into that 2025 resistance at 1.184, where it closed the week before breaking higher through multiple resistance levels into 1.205 last week. Price rejected those highs and reversed most of the weekly gains to close back near the open, though marginally above prior resistance at 1.1844. I took off my entire EUR long at an average of 1.1904 early last week with a view to re-entering lower, as I do not expect the rally is over but I did think the crowd was very loud on continued dollar weakness right at those 2025 range lows. I am not yet willing to enter, as I think we still have scope for some relief in DXY and thus EUR could deviate below this resistance turned support, trapping those breakout longs. Weekly structure and momentum is bullish, however, so we should continue to expect higher-lows and higher-highs to form. If we do get a little bit more downside, I will be looking for longs in early Feb. If I am forced to buy higher, that is fine too, and I would look for strength above trendline resistance and bid a subsequent pullback, with higher timeframe targets of ~1.235 for H1 2026.
Daily:
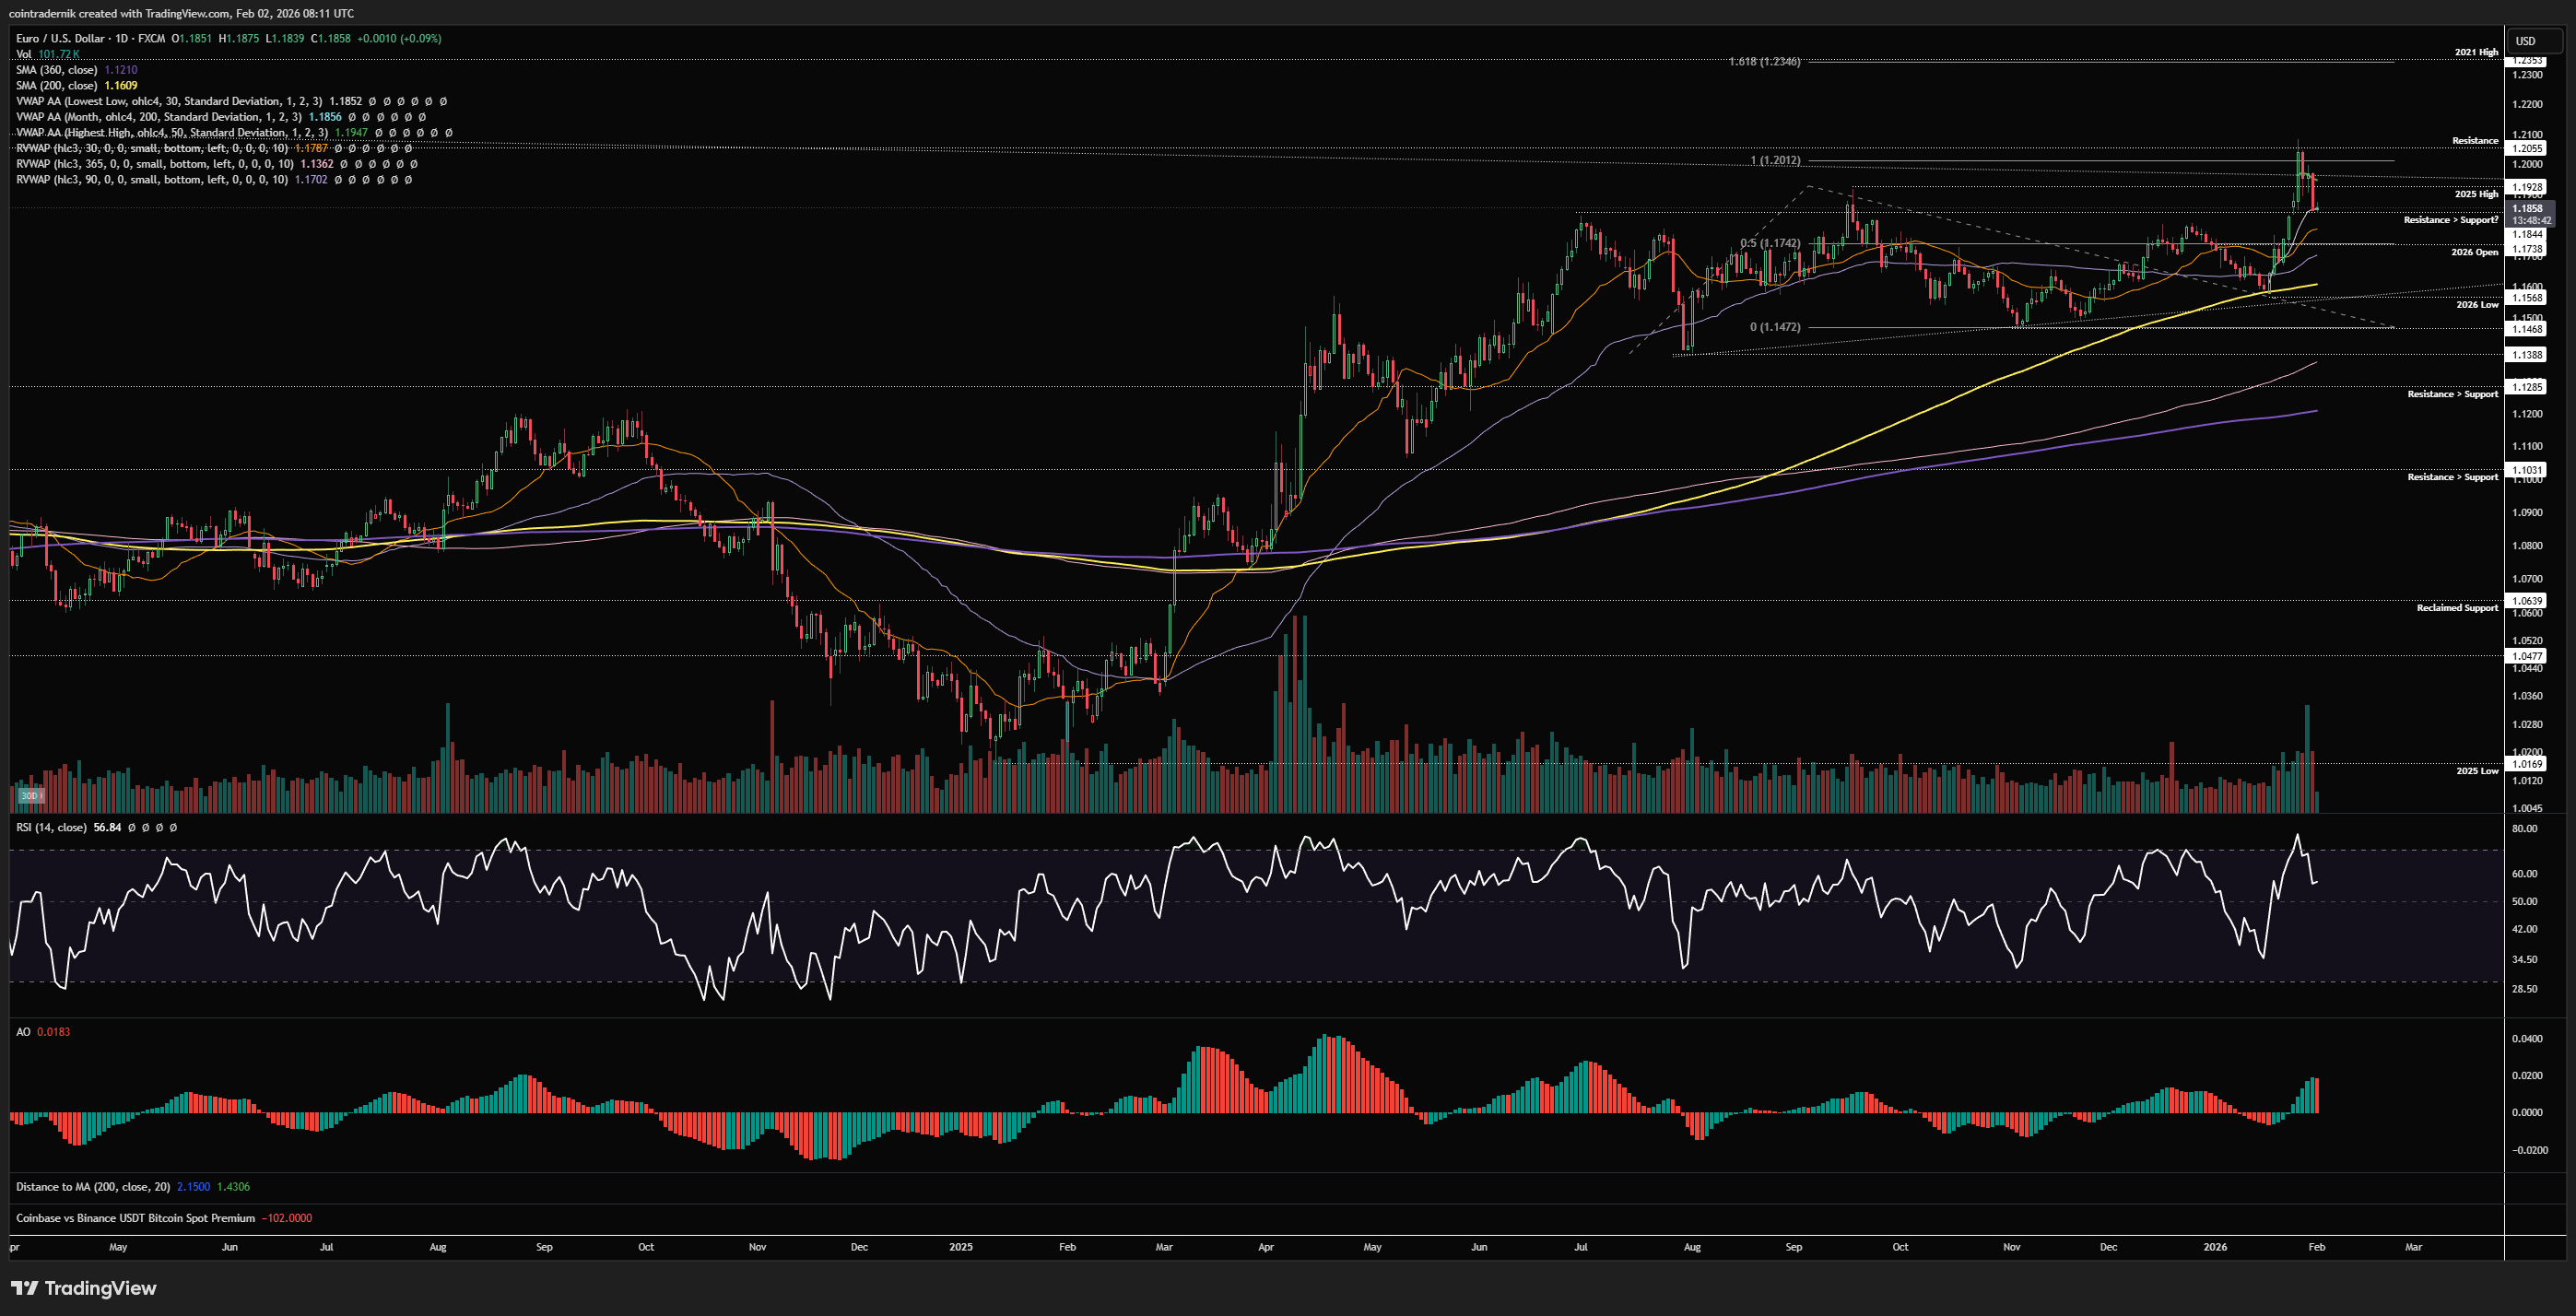
Turning to the daily, we can see that daily structure and momentum are also bullish here, and price rejected right at historical resistance above 1.205. We then retraced most of the weekly gains and closed right at prior resistance turned support, as well as the anchored VWAP from the 2026 low. This is a logical place for a swing-low to form, so I may be wrong in expecting further downside, but if we break and close below 1.184 I would look towards a retest of the yearly open as an opportunity to re-enter swing longs. If we do start to form some decent structure right here early this week, I may jump the gun and enter, but I'd want to see a sweep of today's low and then some strength early this week in order to do so. In either case, you should be looking for reasons and areas to be long for the coming months, in my view, and whilst we are getting much closer towards a cyclical turn in DXY I do not believe we are there yet.
Price: 154.87
Weekly:
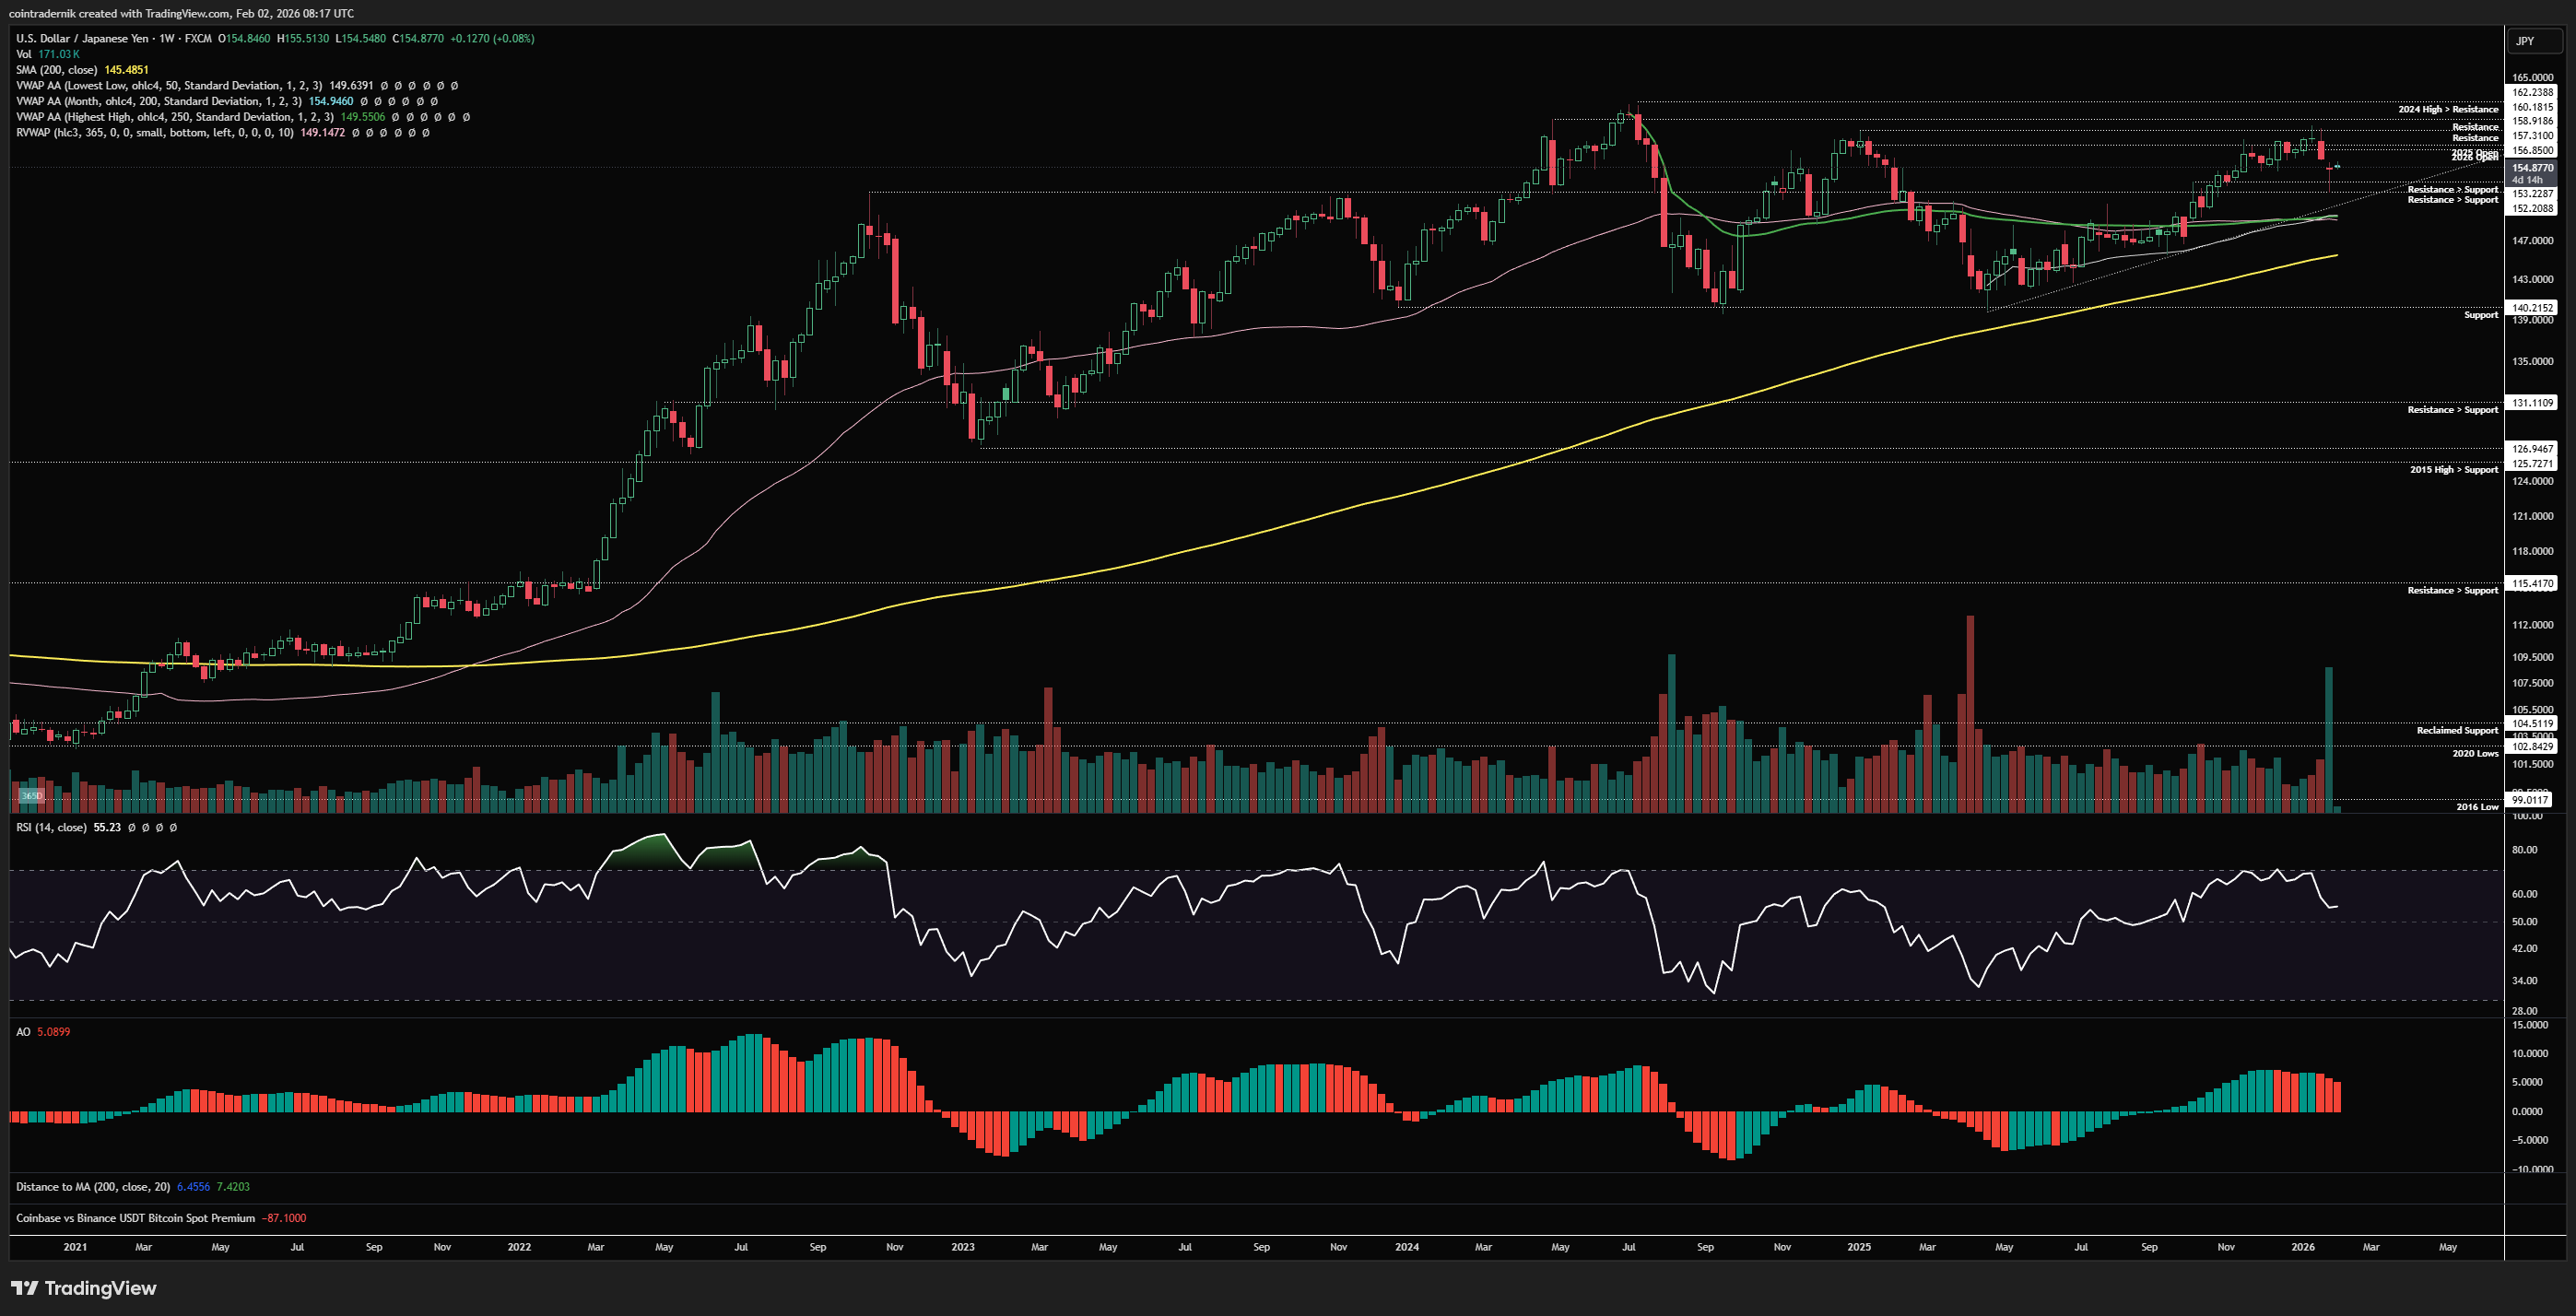
Beginning with the weekly for USDJPY, we can see that following some coordination from interest parties we erased weeks of grinding higher within a couple of weekly candles, rejecting below 159 resistance and then closing below the 2025 and 2026 open, leading to last week's leg lower into support at 152.2. Price bounced, well above trendline support and key VWAPS, closing the week back near the open, and now we find ourselves in no man's land as relates to price-action. Weekly momentum is still bullish here and we remain supported by a strong trend, but I think any pops higher here into that 156.9-157.3 area would be a high R/R area to look for a short back towards 150ish, where I think there is a huge among of support - and where I would be more interested in swing longs. If, however, last week has marked the low, and we flip 157.3 into support early in Feb, I would look for lower timeframe pullbacks to get long for a breakout beyond 159, with 162.2 the major target beyond that - the 2024 high.
Daily:
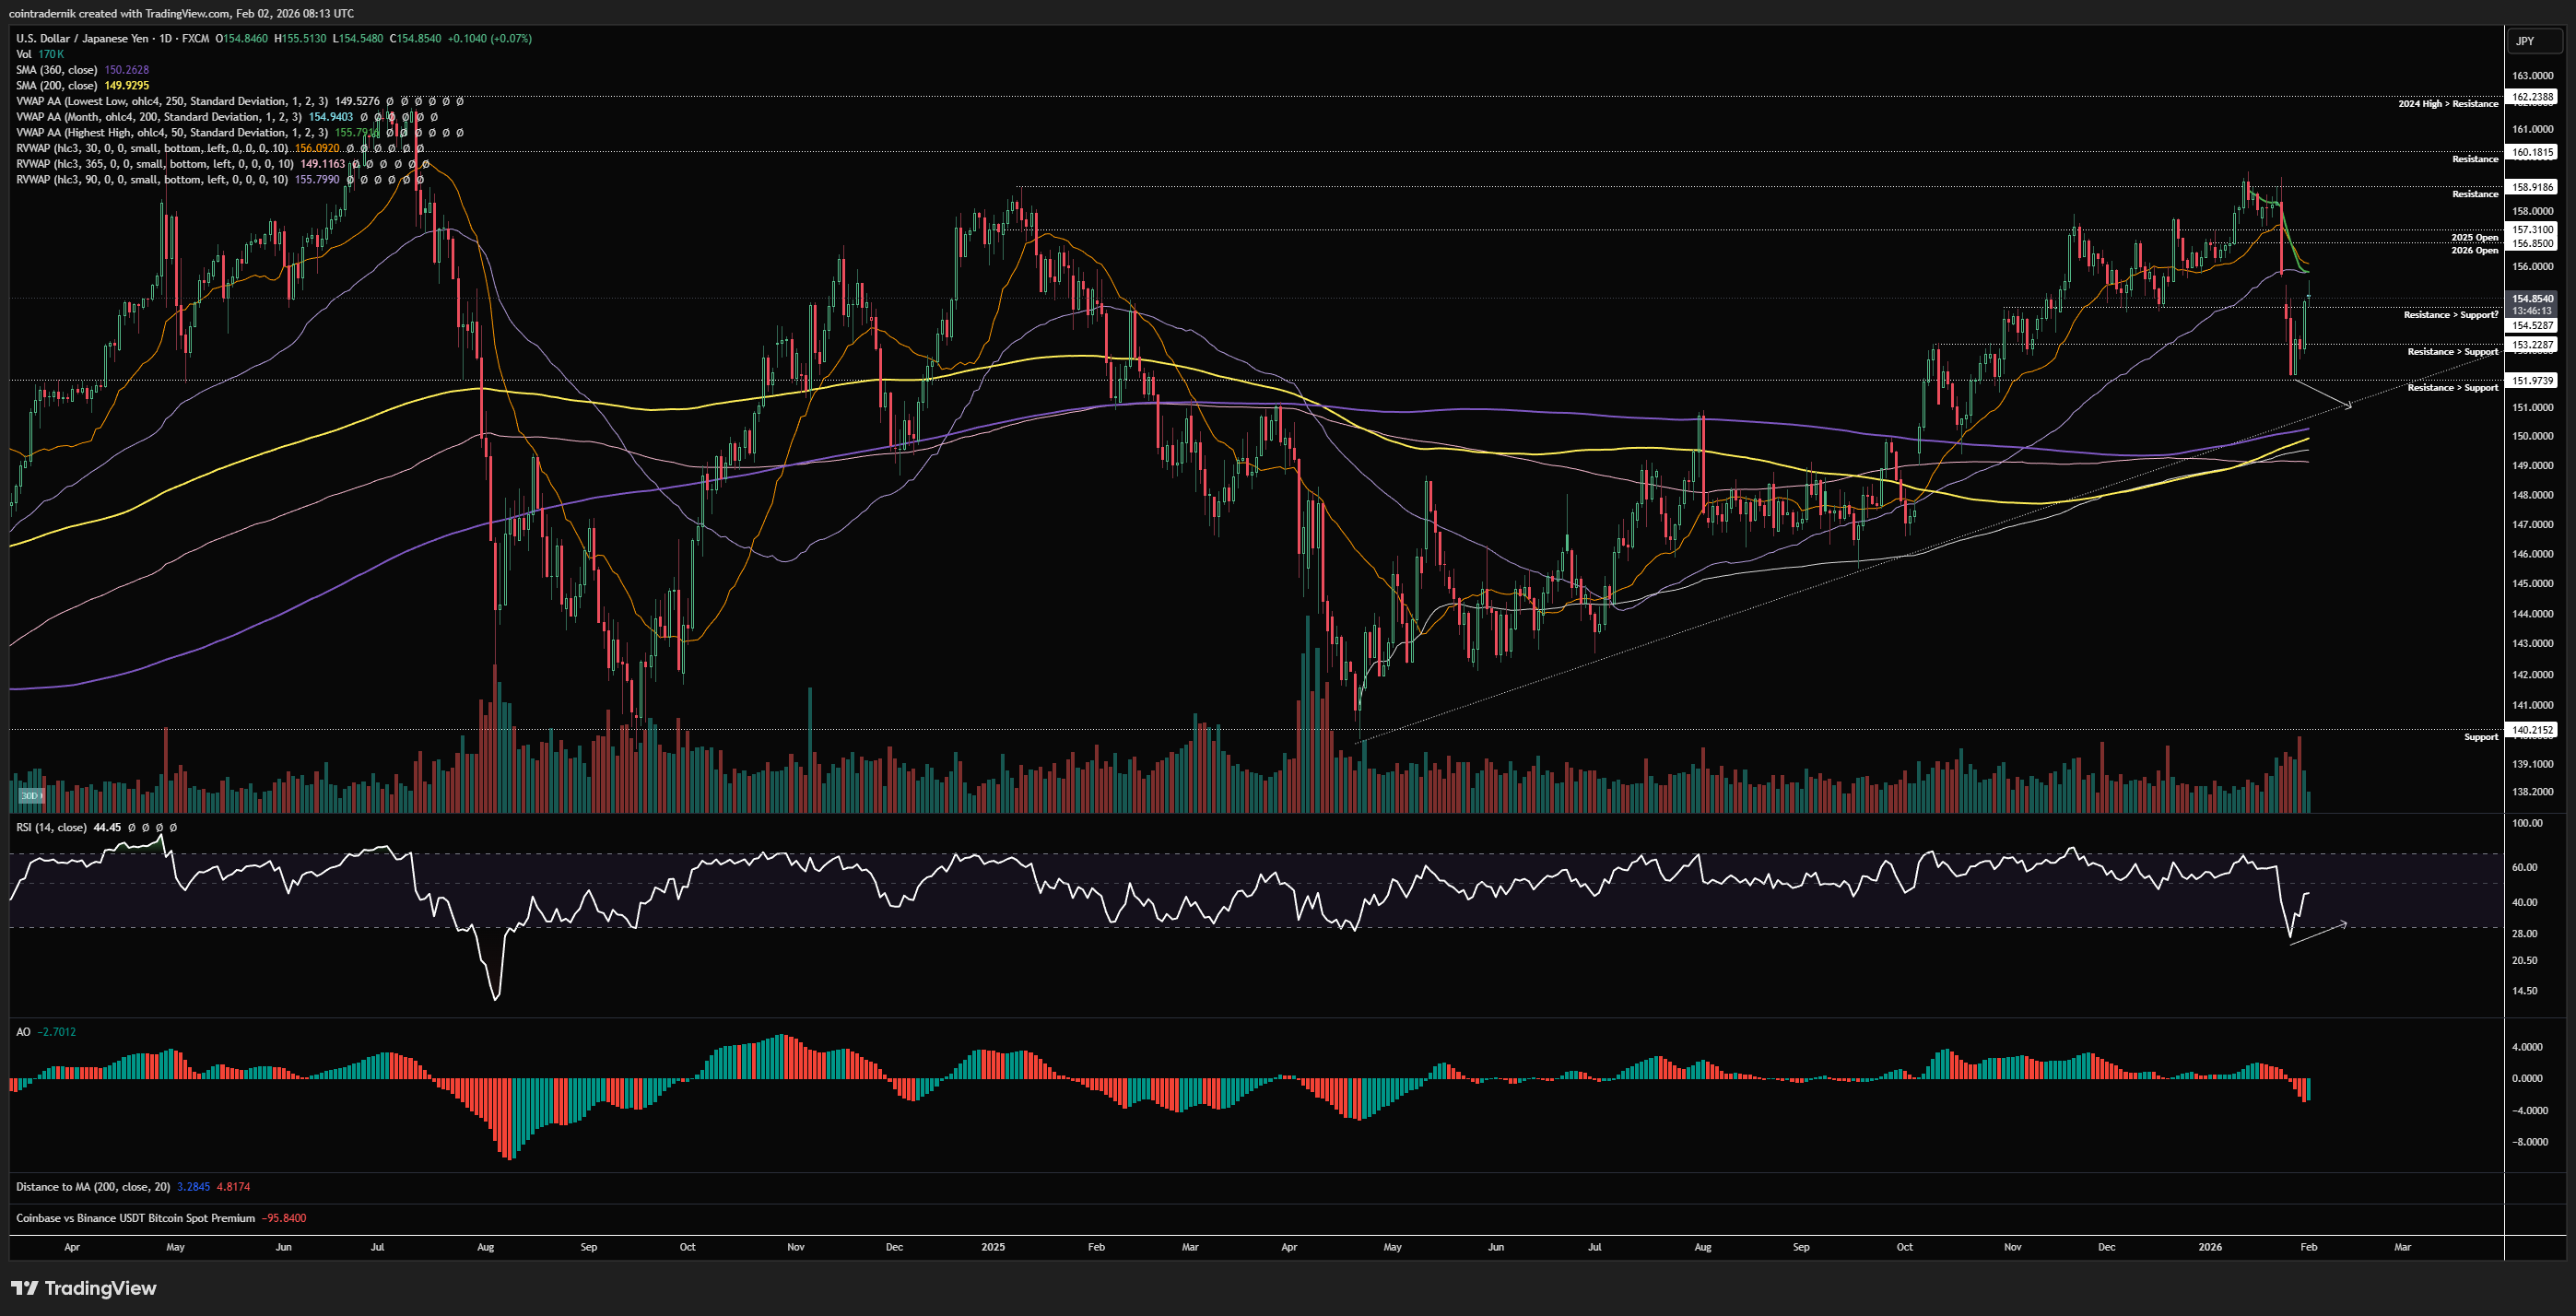
Turning to the daily, I have highlighted what I think would make for a really nice long setup if we do get some rejection below this confluence of the 30d rolling VWAP, 90d rolling VWAP and anchored VWAP from the yearly high, leading to a leg lower towards trendline support. A little bit more upside here his week and then a move into 150ish with bullish divergence forming - or even the formation of a higher-low above 151.97 with RSI making a lower-low - would be very interesting for a multi-week long position. I may look for a short if we deviate above 156 into 156.8 and then break down on the lower timeframes, as that would give us a really clean invalidation on the expectation of further downside.
Receive the latest updates directly to your inbox

Price: 1.3689
Weekly:
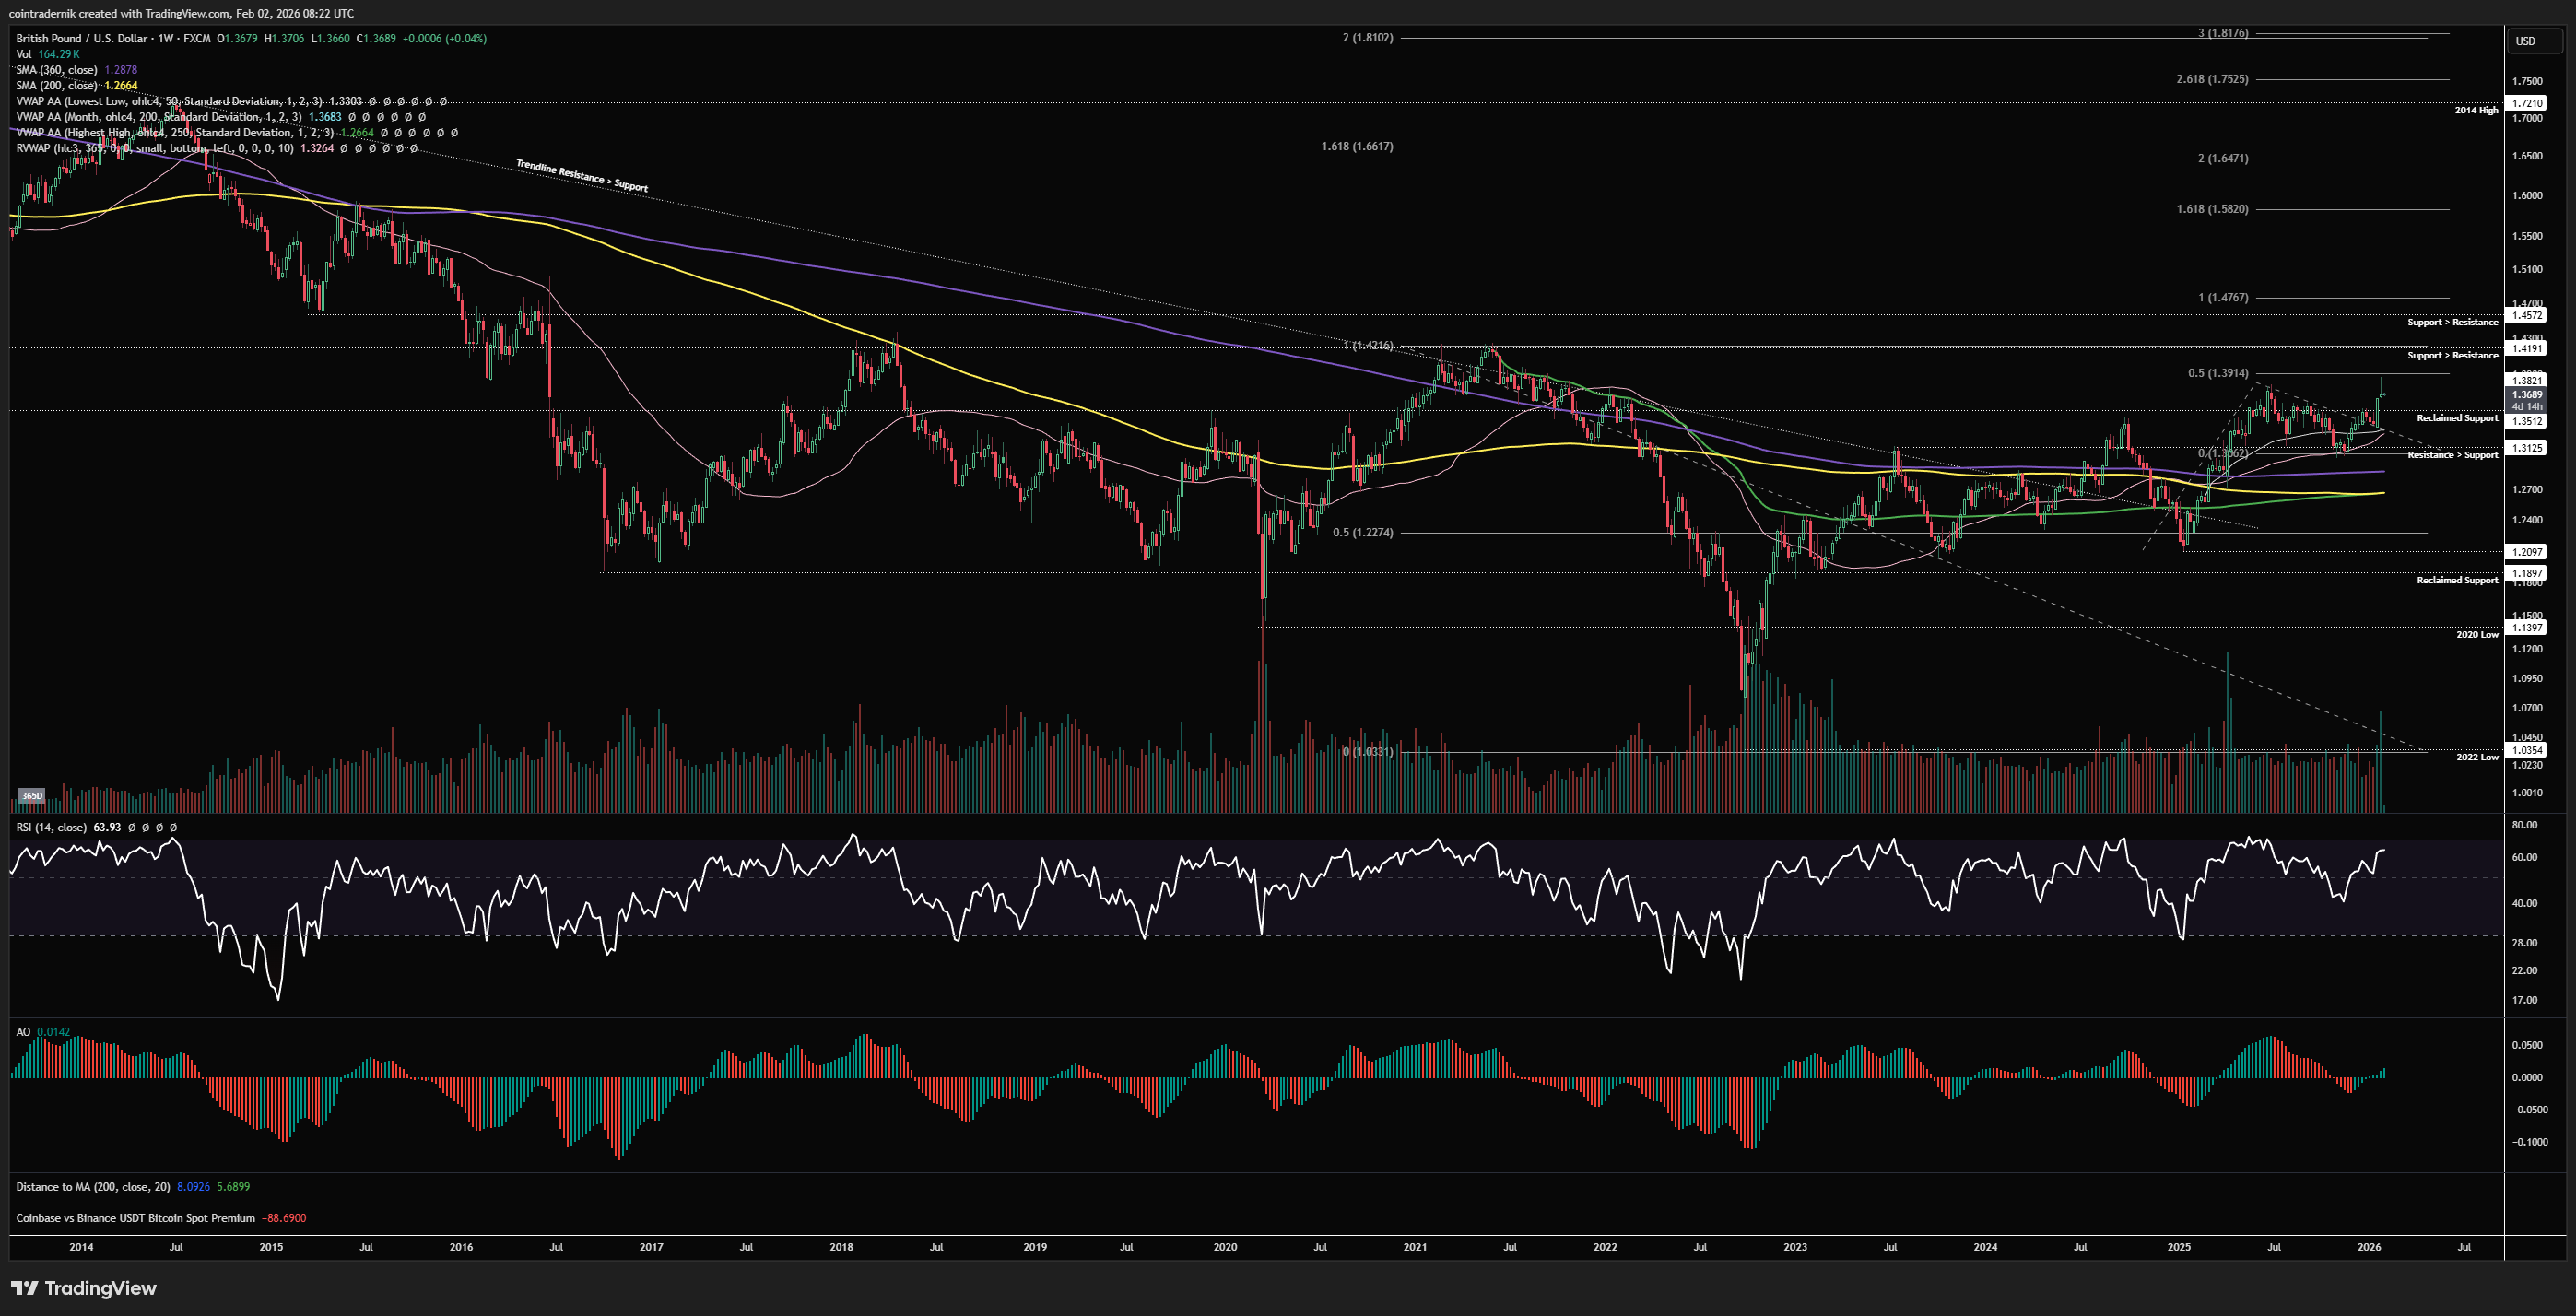
Beginning with the weekly for GBP, we can see that price emerged from a long-term downtrend that culminated in a v-reversal off the 2022 low, which led to consolidation below long-term trendline resistance throughout 2023. Subsequently, price chopped around below the 200wMA and resistance around 1.31, before deviating above that level into 1.35 late in 2024, breaking out above the trendline and then retesting it as support in early 2025. Since then, GBPUSD has been strong, rallying for most of H1 2025 into a fresh high above 1.35, marking out a swing-high at 1.382. Price then retraced into prior resistance turned support, holding above and pushing higher once again into early 2026, where we saw price wick into new highs above 1.382 last week, only to close back near the open. Weekly momentum and structure are bullish GBP here and this remains a dip-buying environment, where a retest of 1.35ish would make for a nice long to take out the 2021 highs at 1.42. Only if we break and close back below 1.3125 does this turn bearish on the weekly timeframe.
Daily:
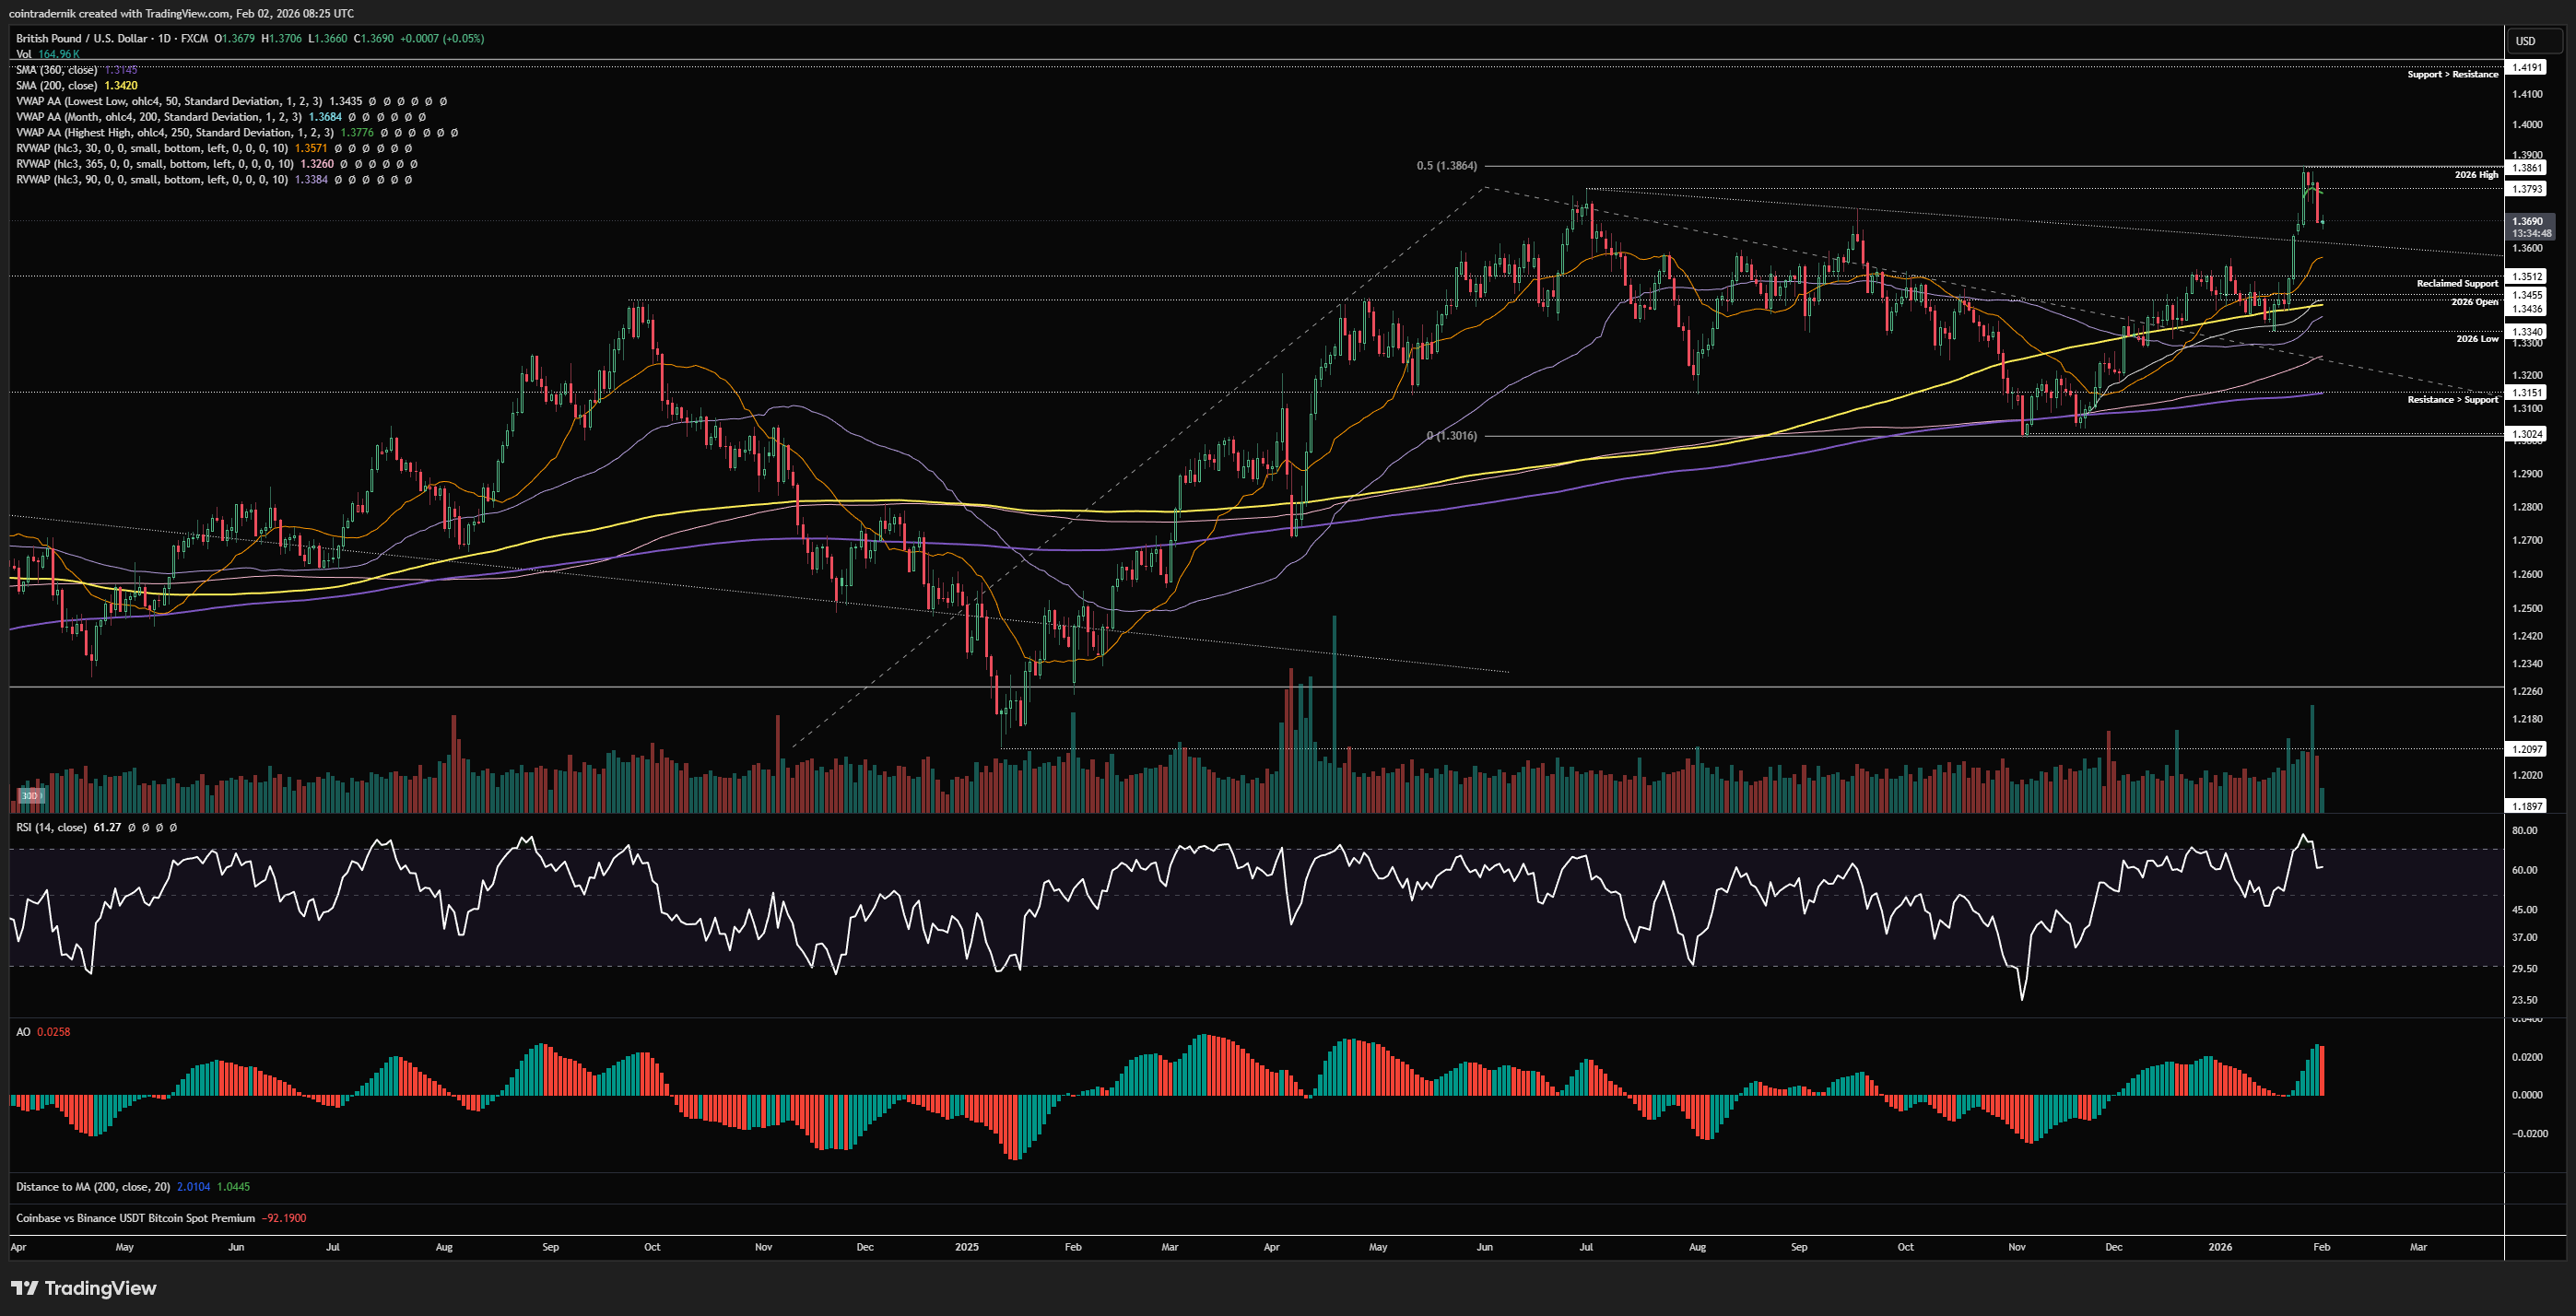
Turning to the daily, again structure and momentum are bullish here, and price is in a steepening uptrend since the low at 1.302. We rejected last week above the 1.38 swing-high and closed back below it, opening up the probability of a little more downside here before a bottom is found. We do have an untested trendline breakout below, marginally above the 30d rolling VWAP at 1.357, so that's somewhere we can look for long setups to form, with the cluster of support below that at 1.345-1.351 the next area of interest. Daily structure is bullish as long as that Jan low is protected. As mentioned above, the next target for the pair if we can fill a long somewhere between 1.34-1.36 would be 1.419.
Price: 0.6948
Weekly:
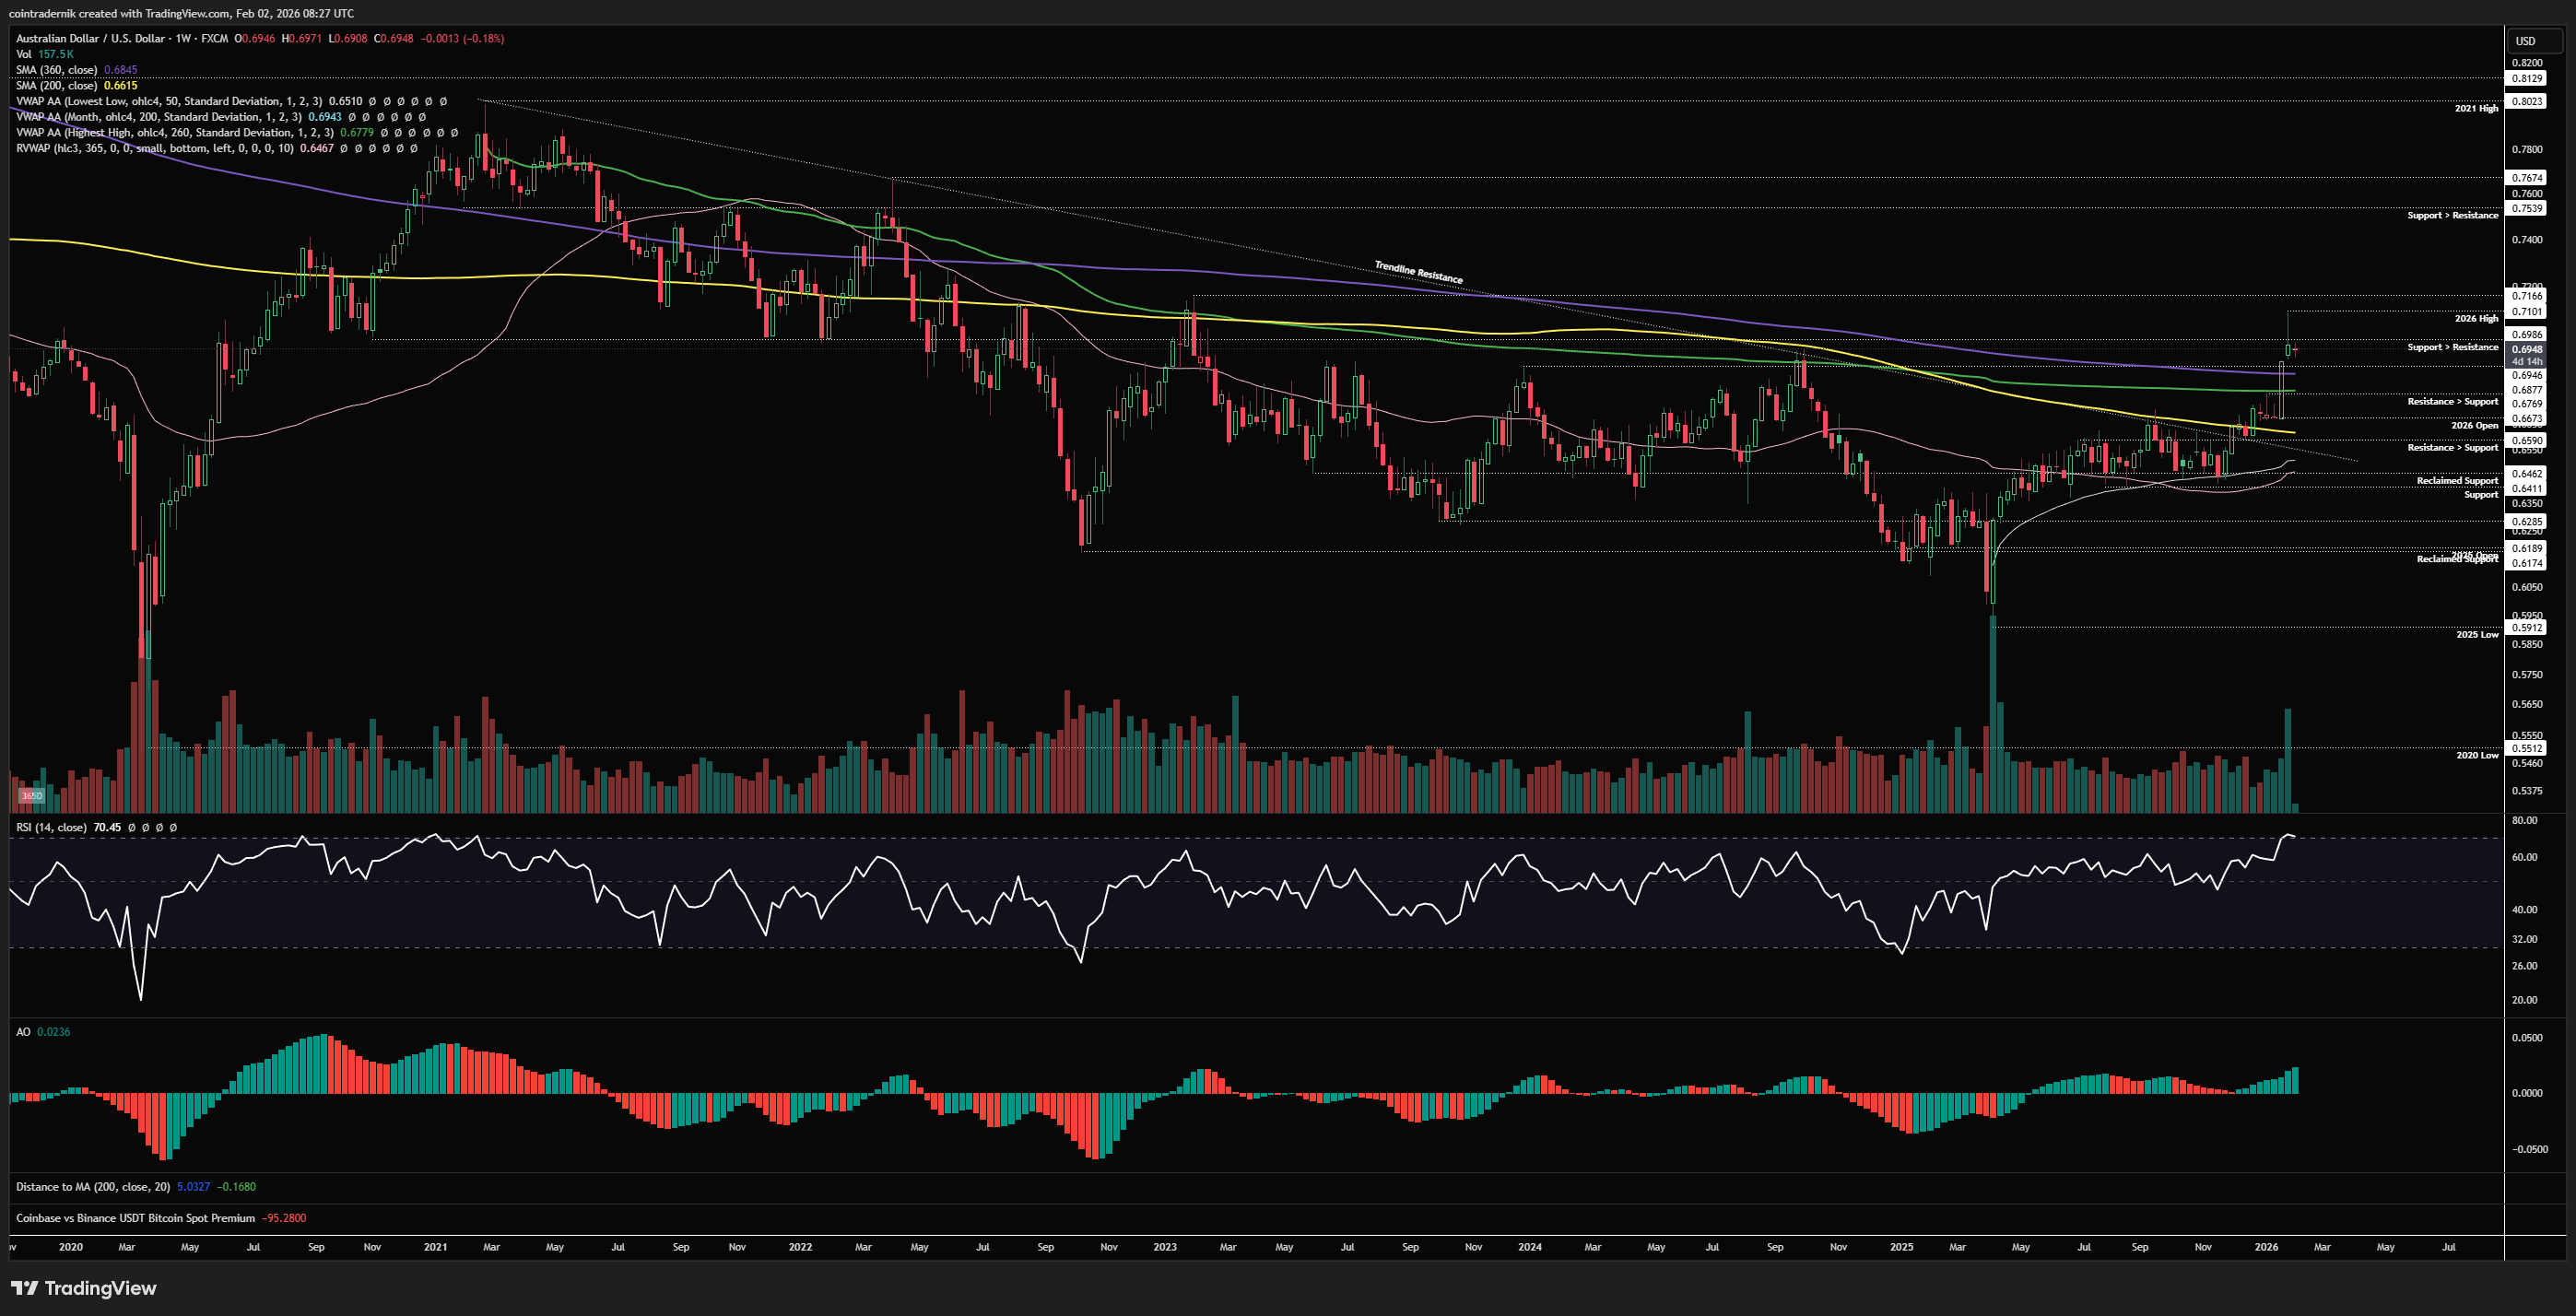
Looking at the weekly timeframe for AUDUSD, we can see that price played out pretty much perfectly following my thoughts in the 'Rising Sun' Outlook a couple of weeks ago, breaking out above the anchored VWAP from the 2021 highs for the first time throughout this downtrend and ripping through multiple levels of resistance, with last week seeing price tag 0.71 and close back below 0.6986. Weekly structure is firmly bullish, as is momentum, and we have a breakout above the VWAP that has capped every rally since 2021. We should be looking for any opportunity to jump on this trend, and my expectation here is that a little more DXY relief + a little more metals vol will give us a retest of that anchored VWAP sometime in the next couple of weeks, with a view towards laddering bids between 0.68-0.688, looking for 0.75 as the next major level of resistance.
Daily:
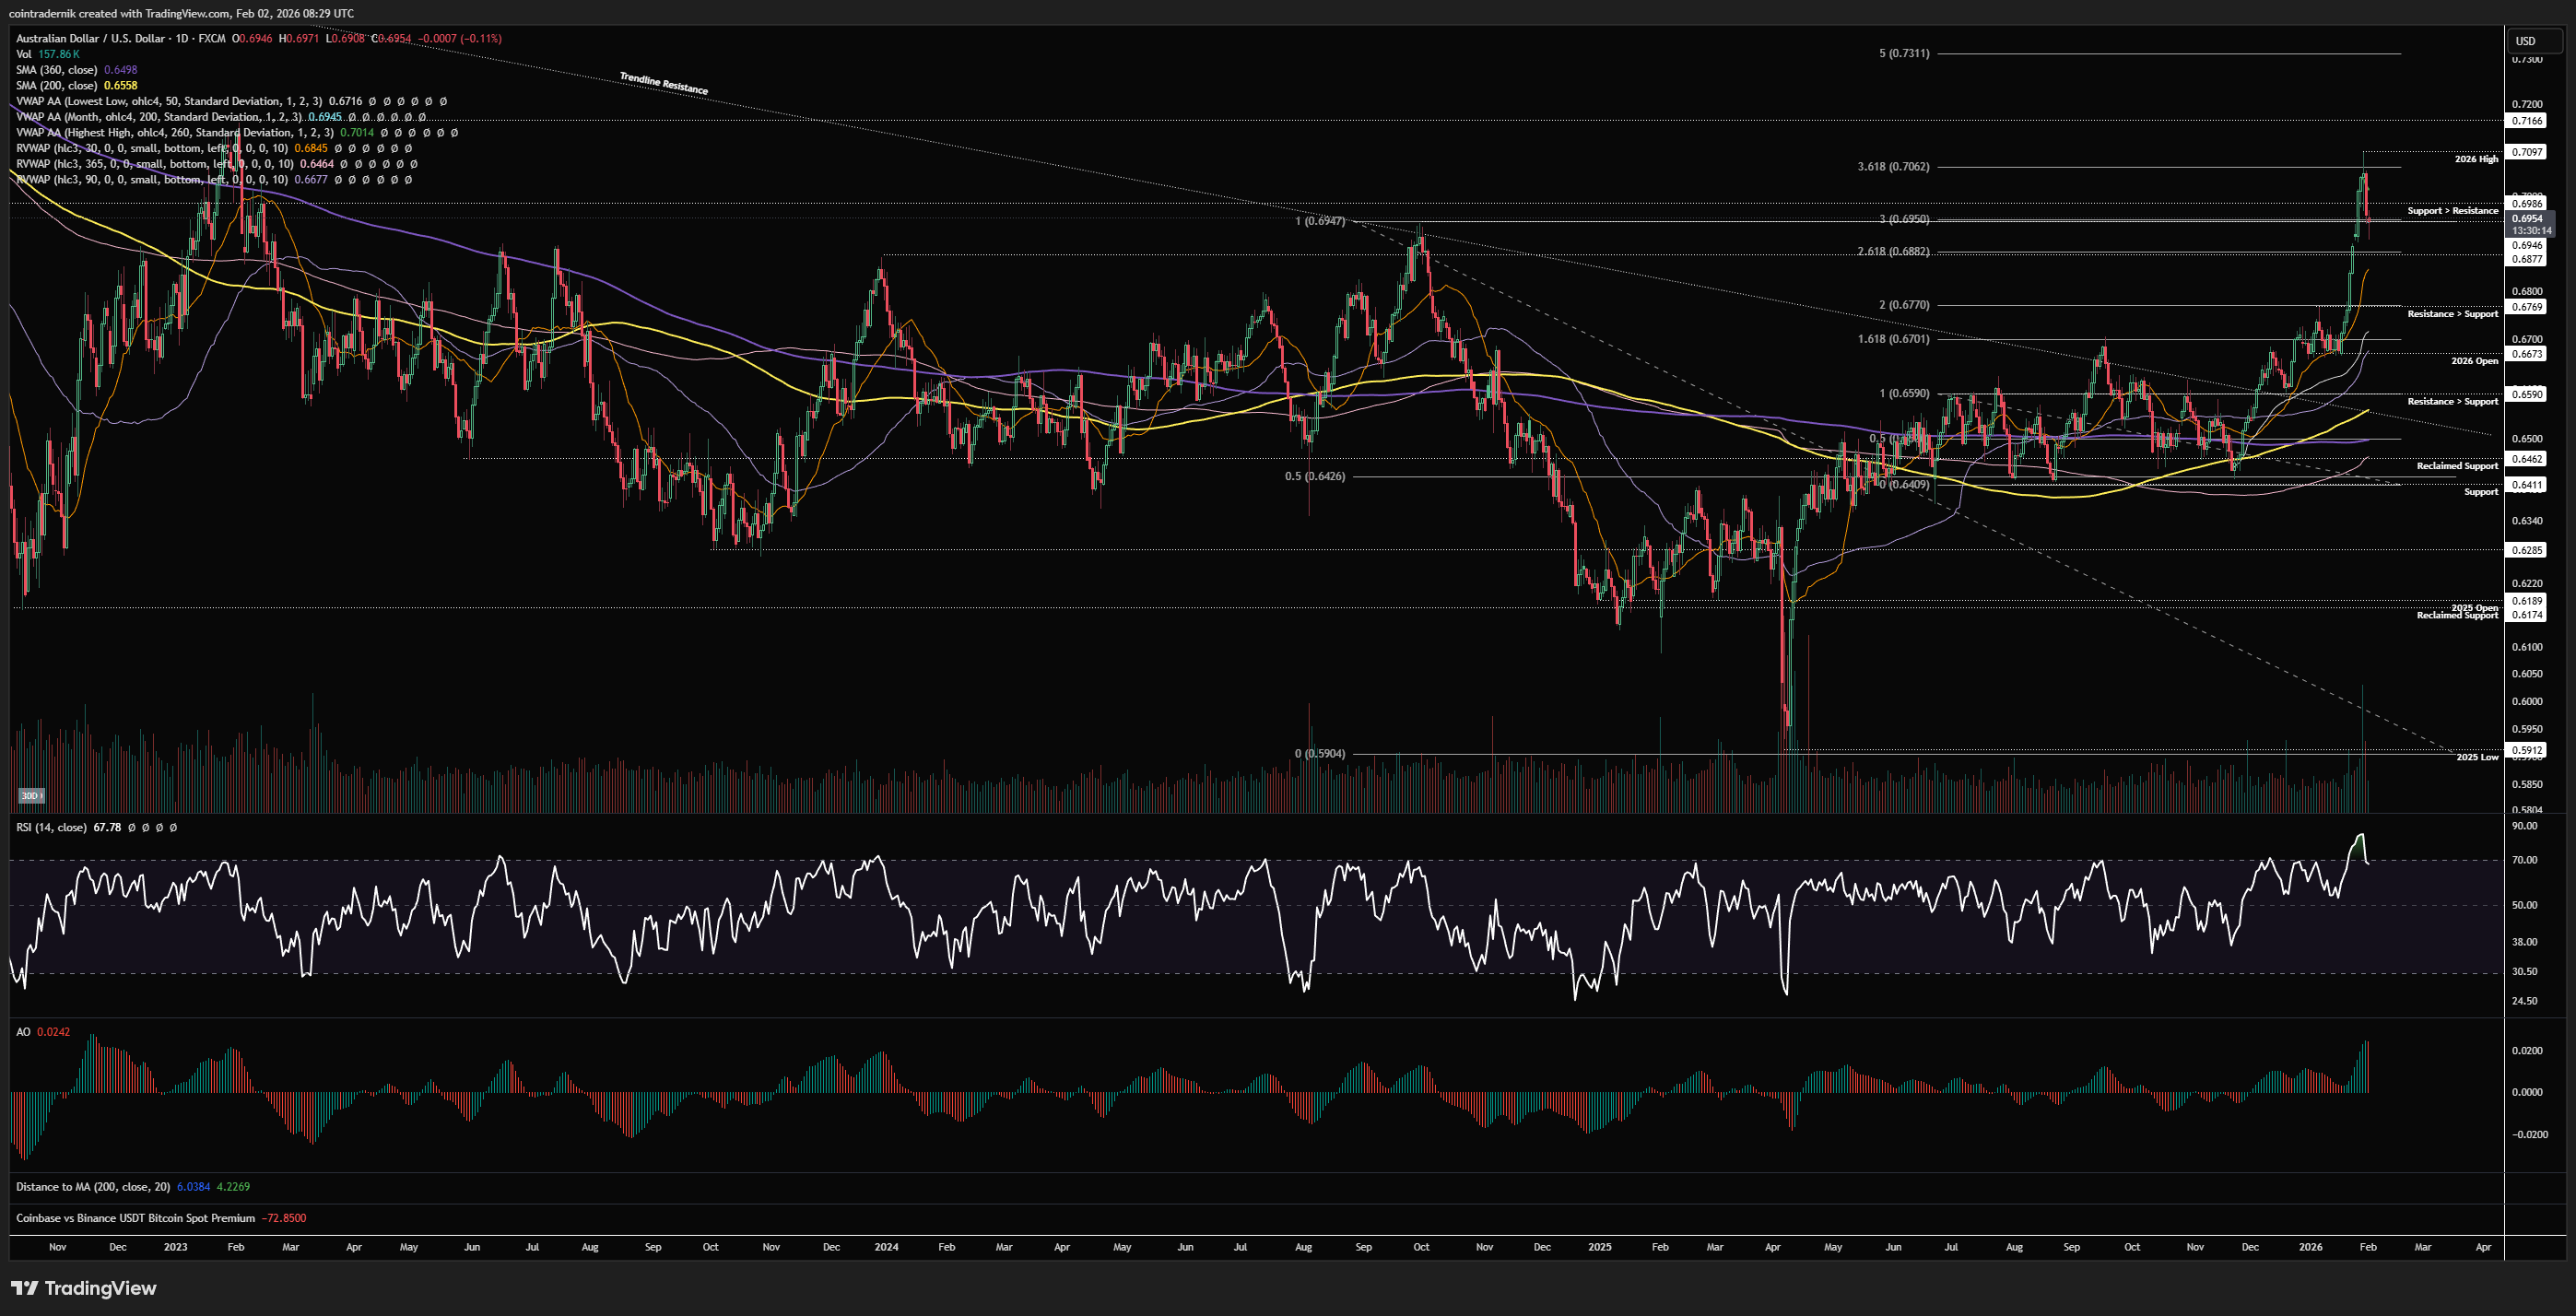
Dropping into the daily, we can see that daily structure and momentum are also very much bullish here, as you'd expect, but we did push towards an extreme in momentum last week into the high, which gives us some confluence for a pullback and momentum reset here. We rejected at 0.71 and have since pulled back into prior resistance at 0.695, around which we are trading at present, with 0.6877 as the next key level below, which is marginally above that 30d rolling VWAP. If we can get a bit more downside this week into that level below with daily RSI coming off a little more but holding above 55ish, that looks like a nice area to get long, with invalidation on a close below 0.667 and a primary target of 0.75 for H1 2026.
Price: $62.22
Weekly:
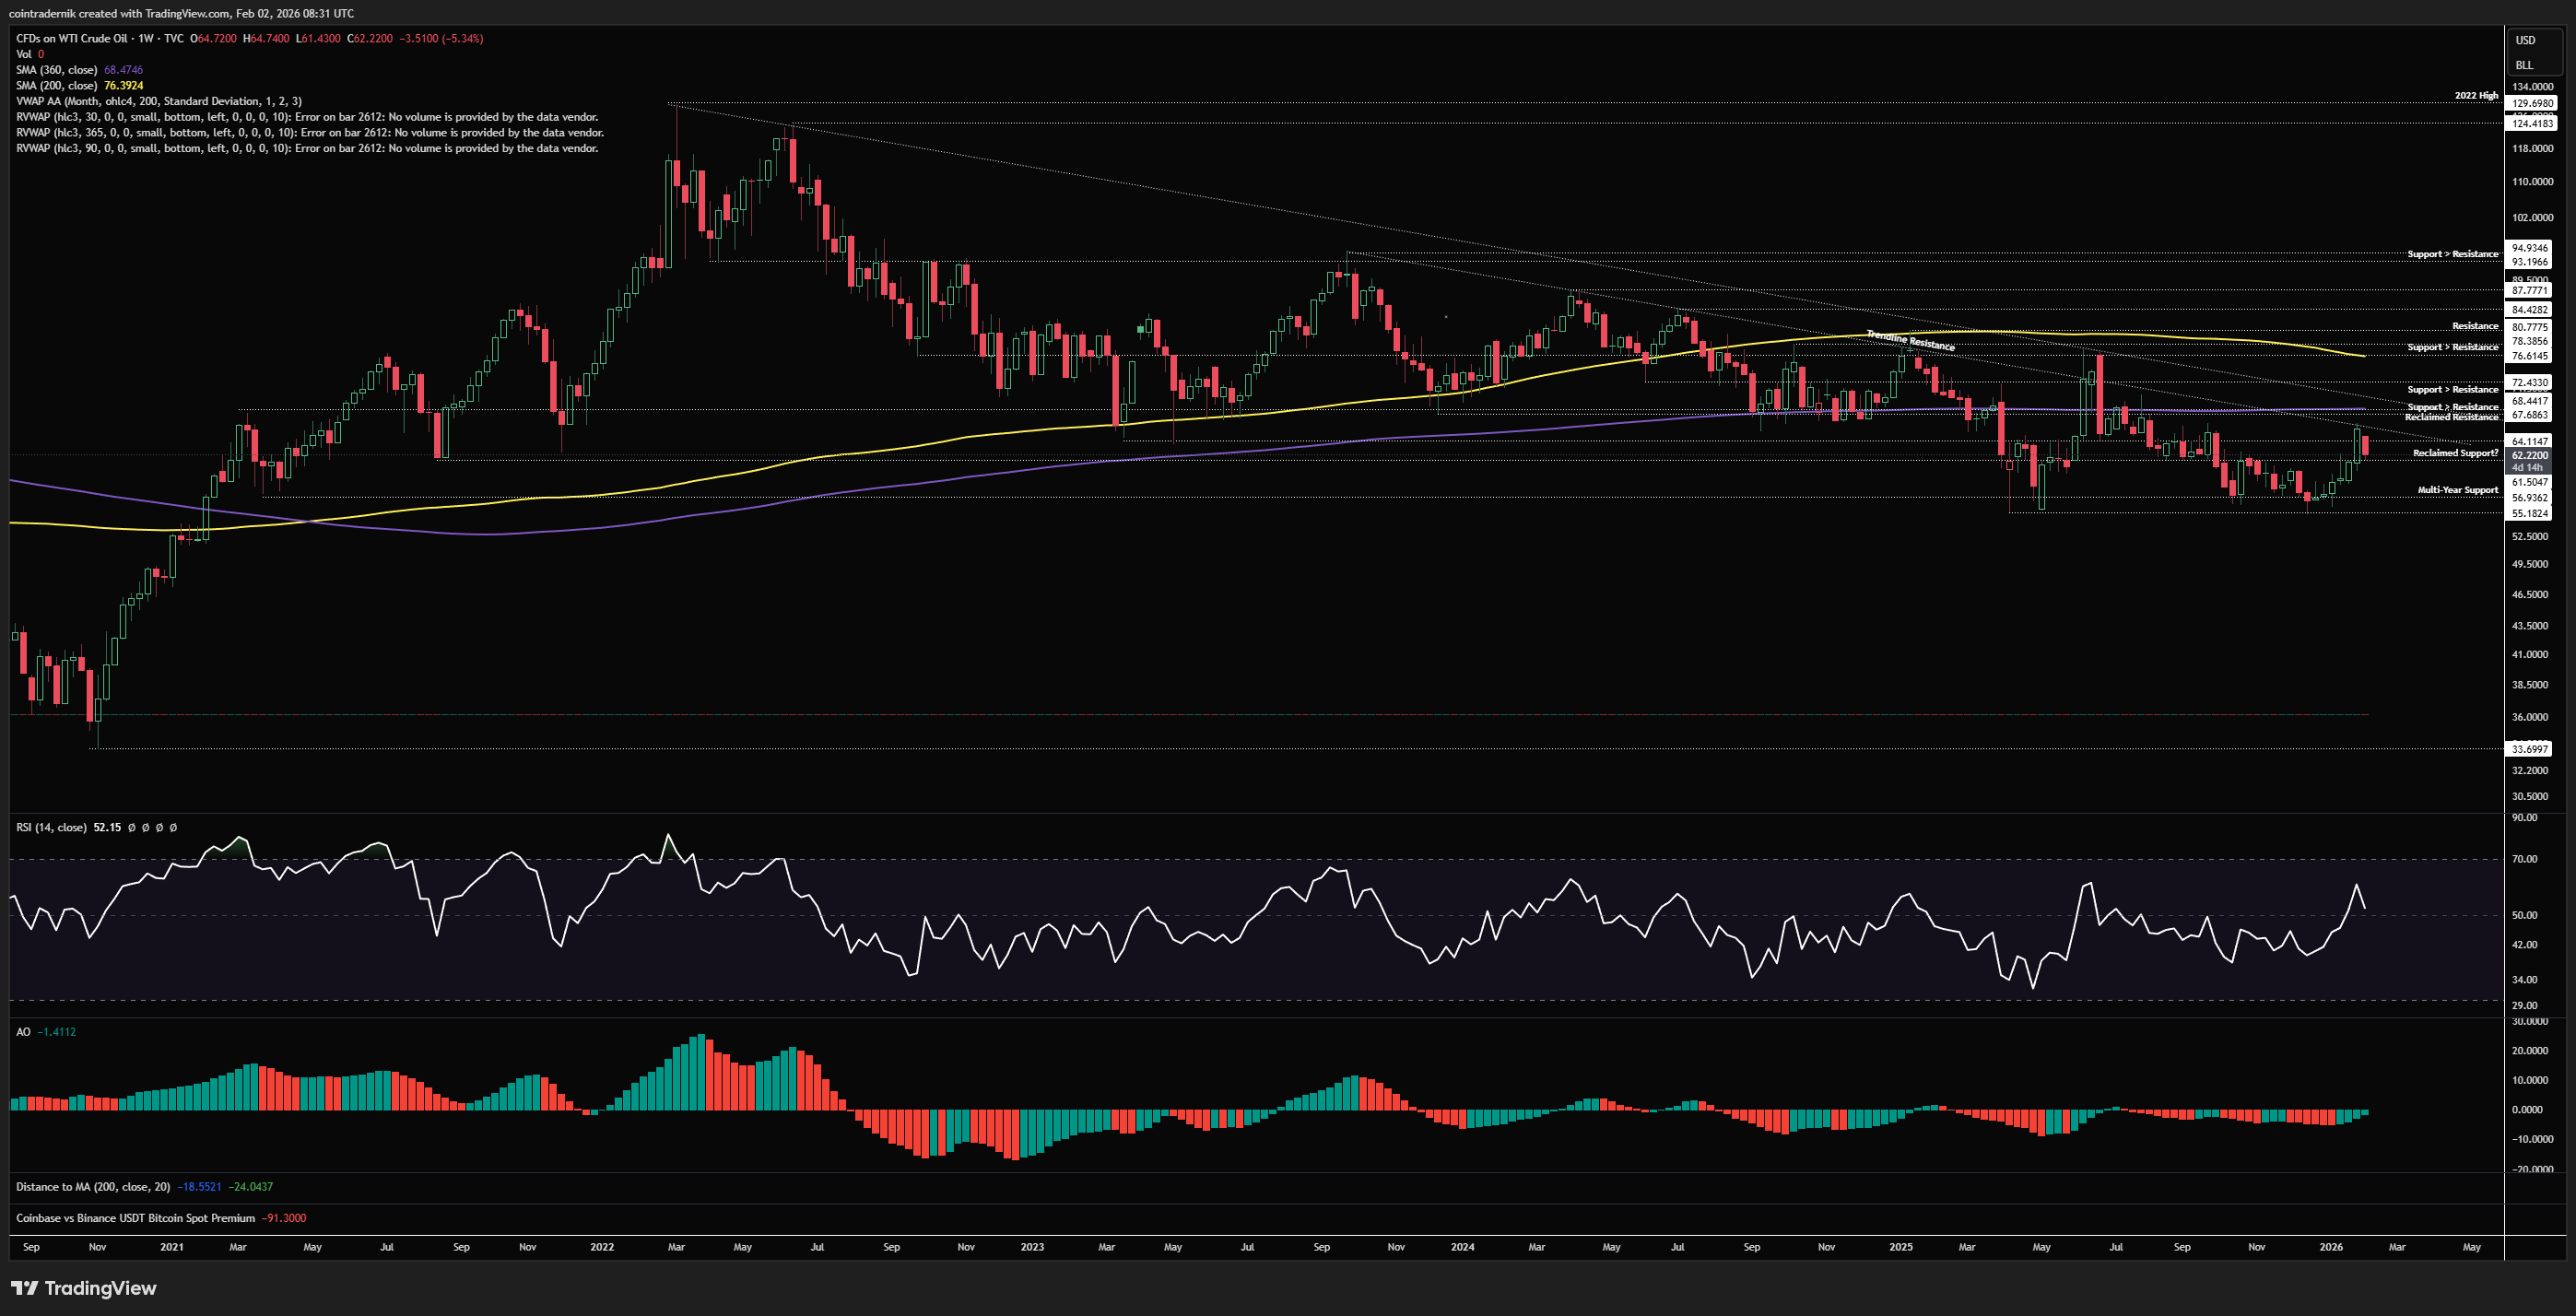
Beginning with the weekly for US Oil, we can see that price pushed higher as anticipated having flipped $61.50 into support, rallying off the open last week all the way to target at $66; alas, I did not get an entry last week and so missed that entire trade. Nonetheless, we were capped by trendline resistance and price has rejected and gapped down early this week, pulling back into $61.50 as of this morning. I am unsure whether this holds as support here, so I'm not willing to take a long given where we rejected. I would want to see a higher-low form and then price close above trendline resistance to be more confident in longs towards the upper trendline, or I would look for longs closer to range support. I expected price-action for Oil to continue to be very choppy early this year, and I am still of this view until we clear this first trendline, but both momentum and structure are looking more promising for the reflation story into H2 and beyond.
Daily:
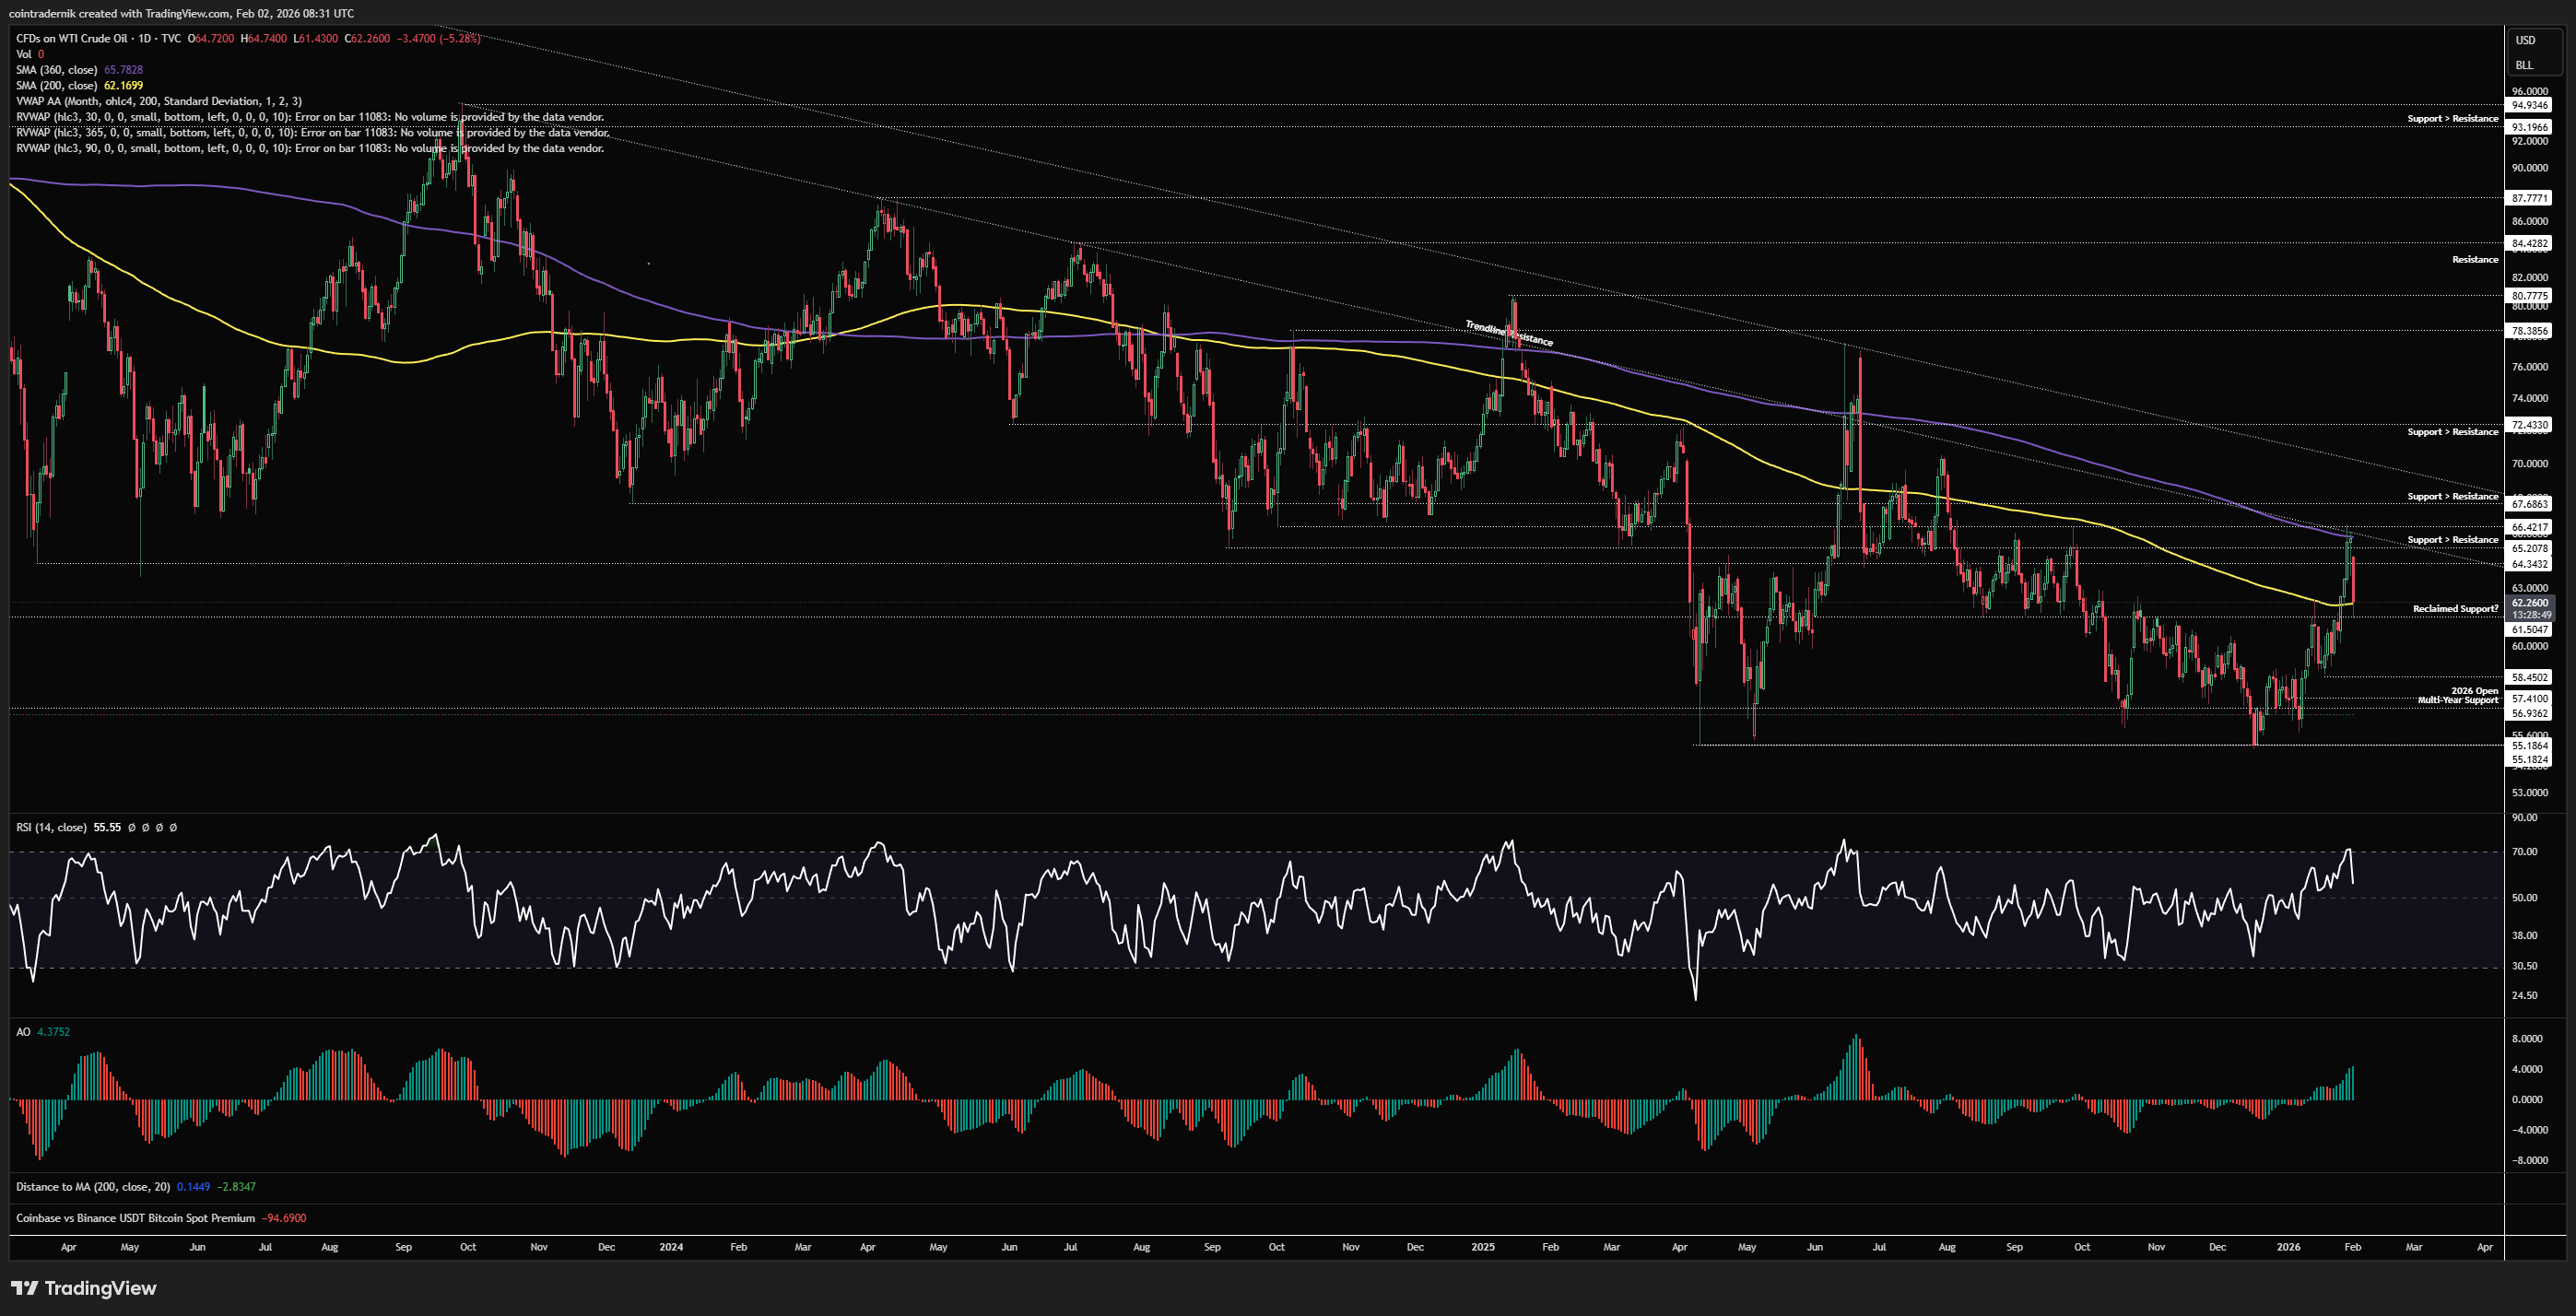
Finally, looking at the daily, we can see that price rejected right at the confluence of the lower trendline and the 360dMA at $66.40, with a huge gap down early this week into what is currently acting as reclaimed support at $61.50. This is also confluent with the 200dMA, and throughout this downtrend there have been numerous instances in which Oil has broken above and then immediately closed back below the 200dMA, with it failing to act as support. If this area does now mark out a higher-low this week, that is a notable change. Momentum is bullish here and daily structure is also technically bullish whilst we hold above the $65.45 swing-low. If we close below $61.50 and daily RSI breaks below 50, I would expect continued chop and range support to be retested around $57, where I would look for fresh longs.
I hope you've found some value in the read this week - please RT, share, engage etc. if so!
And if you've not already signed up for Ostium, please do so and test out some of the recent updates, including:
Sign up here (you don't have to use my ref link, of course): https://ostium.app/trade?from=CL&to=USD&ref=CTNIK

.avif)