

Market Outlook #64
December 8, 2025
-
12
min read


This blog references an opinion and is for entertainment and informational purposes only. It is not intended to be investment advice. Seek a duly licensed professional for investment advice.
In this 64th Market Outlook here at Ostium Research, we'll be taking a look at the week ahead in markets, focusing specifically on price-action, positioning and event risk for Bitcoin, Ethereum, Dollar Index, Copper and Crude Oil.
Firstly, let's take a look at this week's very busy calendar that includes 4 interest rate decisions, with the primary focus being Wednesday's FOMC:
TUESDAY: RBA INTEREST RATE DECISION: (CONSENSUS 3.6% VS PREVIOUS 3.6%)
TUESDAY: BOJ GOVERNOR UEDA SPEECH
TUESDAY: US JOLTS JOB OPENINGS (OCT): (CONSENSUS 7.2M VS PREVIOUS 7.227M)
WEDNESDAY: ECB PRESIDENT LAGARDE SPEECH
WEDNESDAY: BOC INTEREST RATE DECISION: (CONSENSUS 2.25% VS PREVIOUS 2.25%)
WEDNESDAY: FED INTEREST RATE DECISION: (CONSENSUS 3.75% VS PREVIOUS 4%)
WEDNESDAY: FOMC PRESS CONFERENCE
THURSDAY: SNB INTEREST RATE DECISION: (CONSENSUS 0% VS PREVIOUS 0%)
THURSDAY: BOE GOVERNOR BAILEY SPEECH
THURSDAY: US INITIAL JOBLESS CLAIMS: (CONSENSUS 221K VS PREVIOUS 191K)
FRIDAY: VARIOUS FED SPEECHES
Now, let's dig into asset-specific price-action for the week ahead, looking firstly at Bitcoin:
Price: $91,990
Weekly:
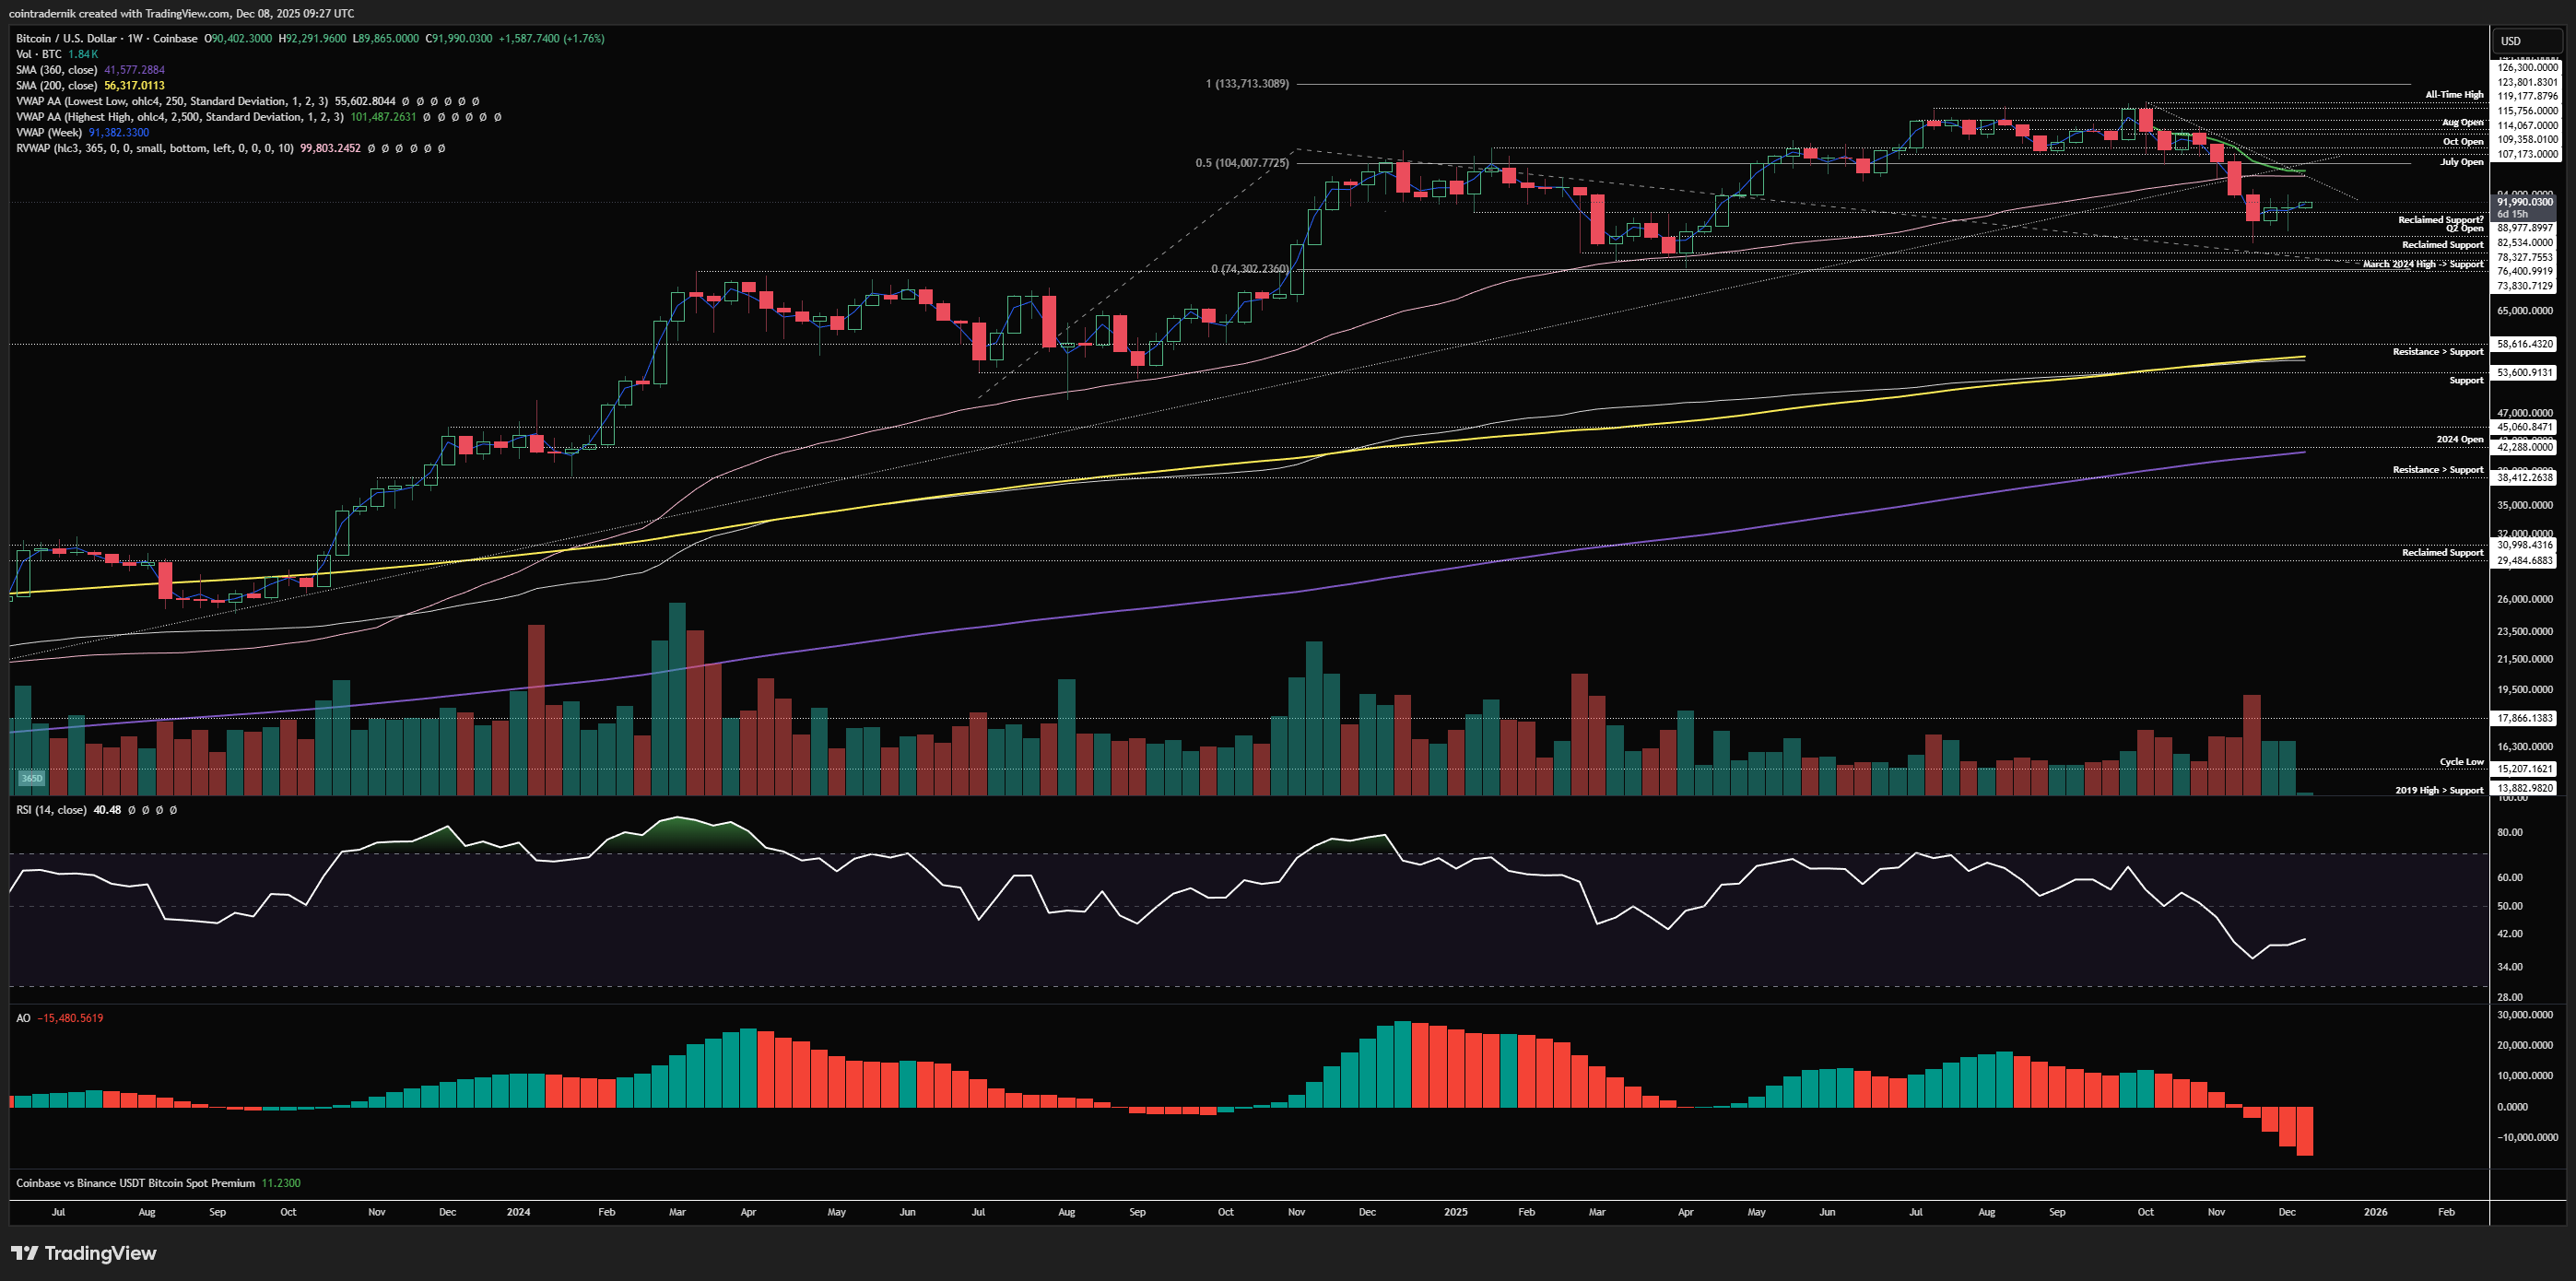
If we begin by looking at the weekly timeframe for BTC/USD, we can see that price last week did not form inside week failure (as was possible) but instead wicked below the prior weekly low, found support above $82.5k and then took out the prior weekly high and closed above reclaimed support at $89k. Given this price-action, I would expect to see continuation higher from here whilst last week's low acts as support, where any weekly close below last week's low opens up another leg lower into the zone between $73.8k and $78.3k (and where I would be eagerly looking for low leverage swing longs). For now, however, this seems unlikely and I do think we're in the early stages of a squeeze towards at least $100k, where there is significant confluence of resistance. A weekly close above the anchored VWAP from all-time highs and the 365d rolling VWAP around $100k would begin to look like another higher-low has formed within the multi-year uptrend and that this move below the 365d rolling VWAP was a bear trap within a 'higher for longer' regime into 2026, in my opinion, so all eyes on the reaction overhead. Whilst it now feels more contrarian than it has in a very long time, I do still believe we are in a bull market and Bitcoin will trade new all-time highs above $125k in Q1, and this move below $107k range support into $80k has been isolated weakness rather than structural weakness that will endure for many more months with much more downside.
Daily:
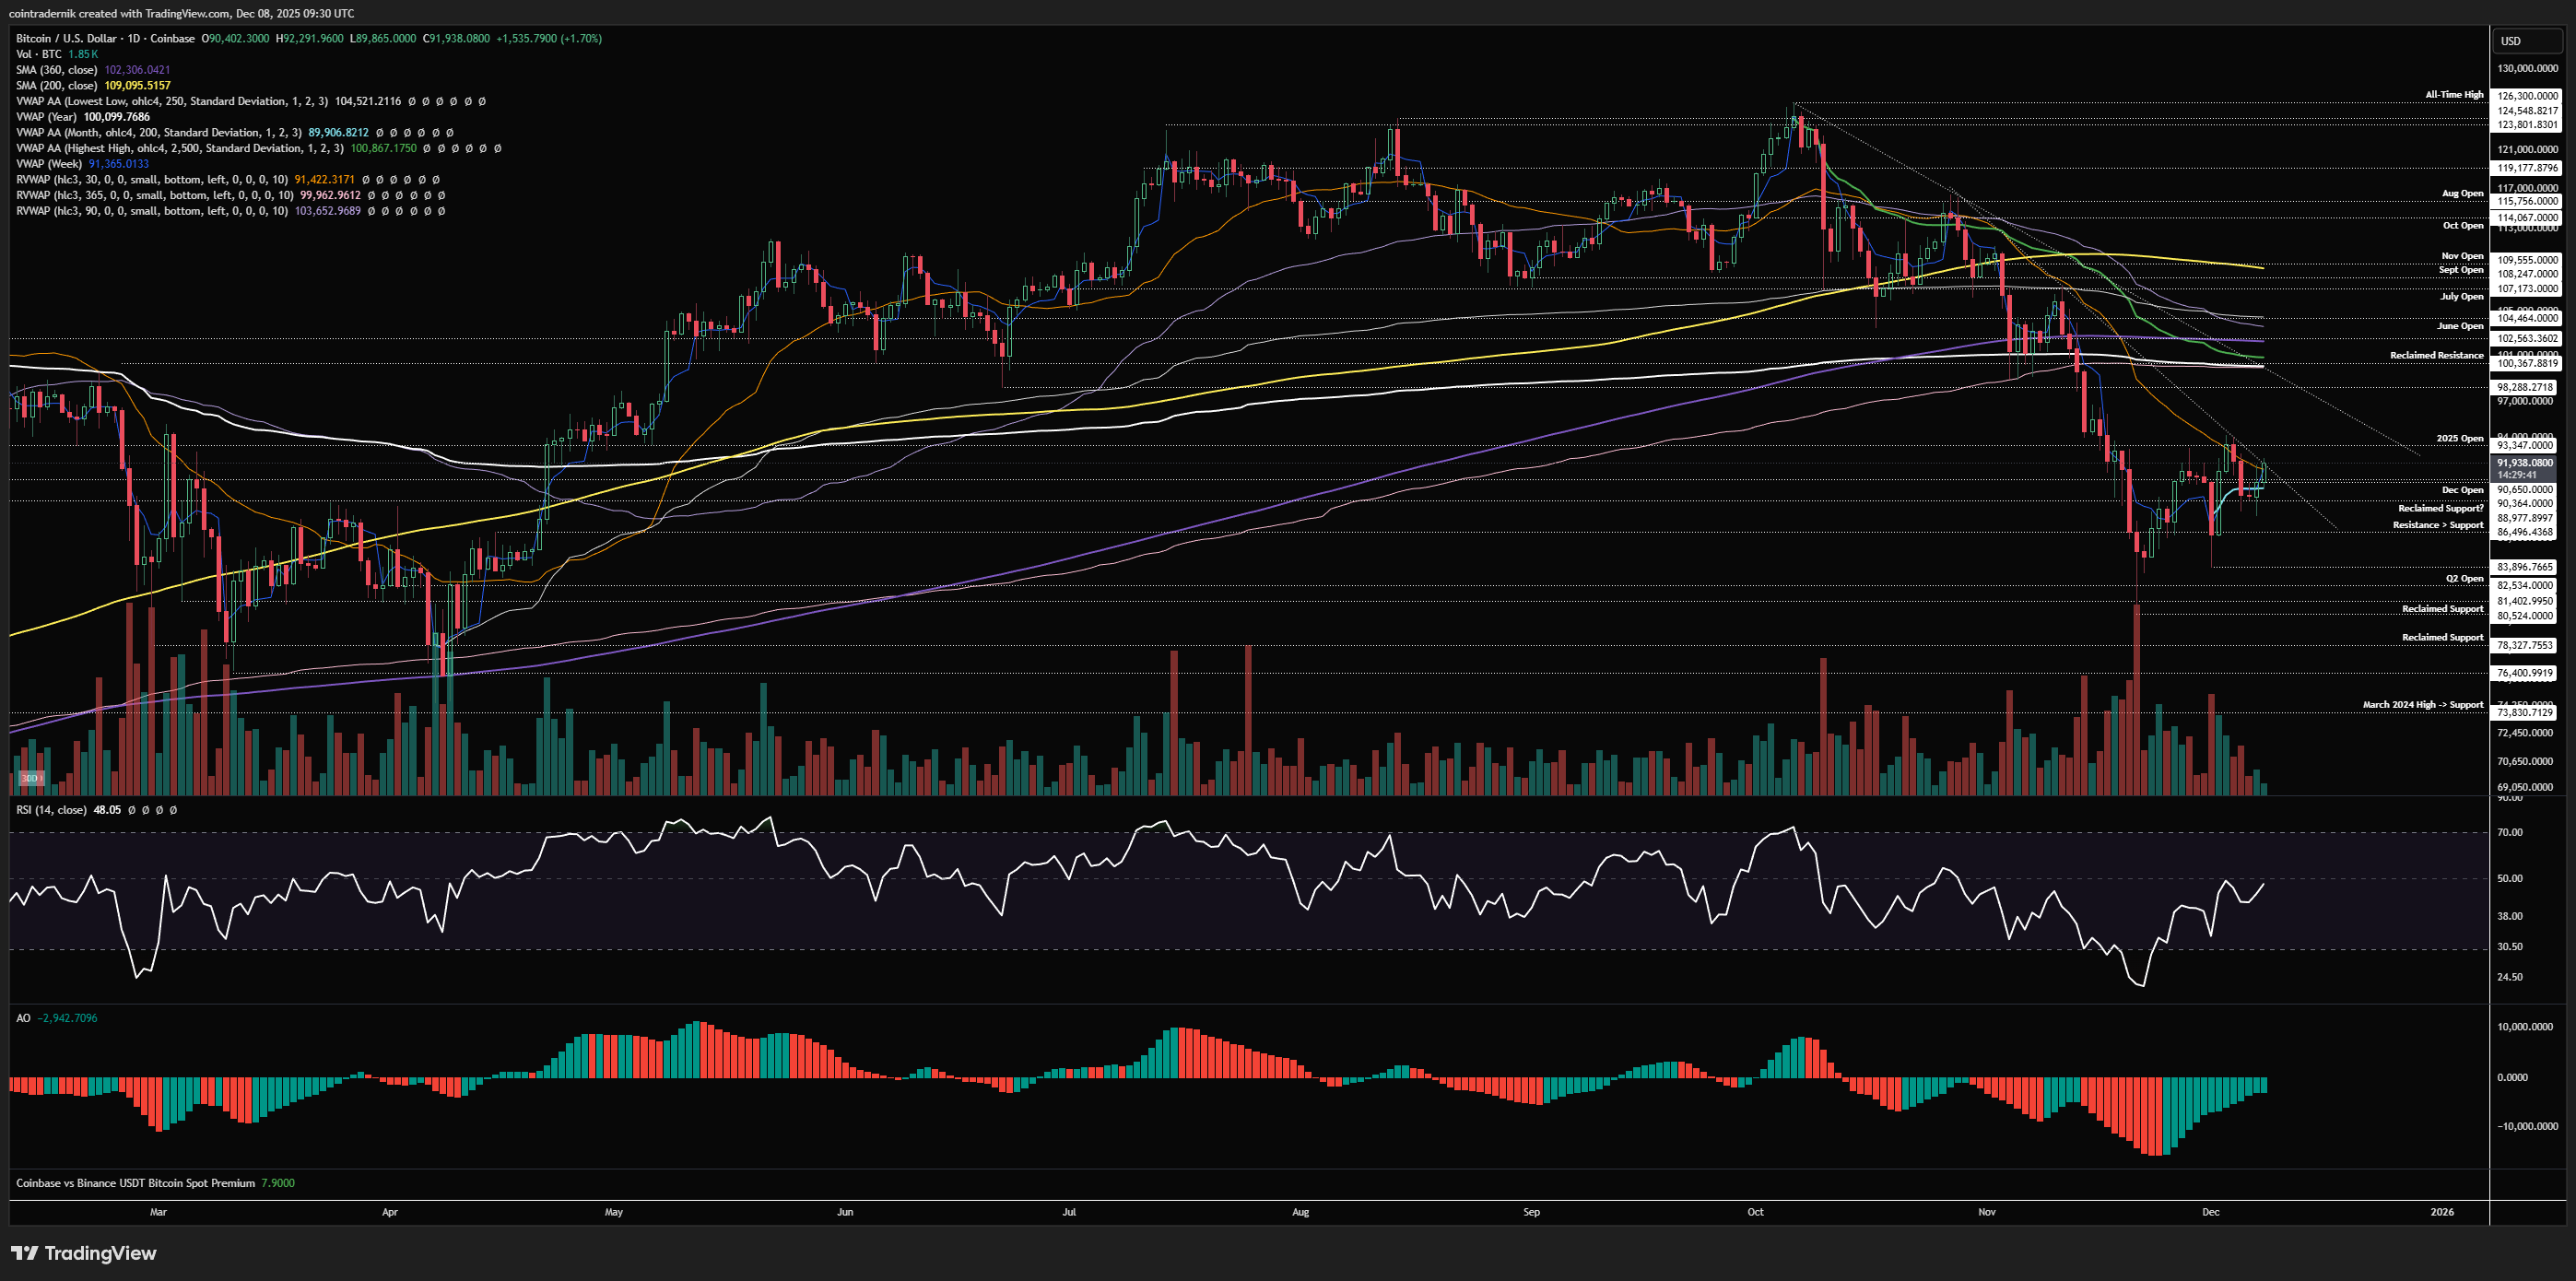
Looking now at the daily, we can see that price formed a higher-low at $83.9k last week above the $80.5k swing-low and then ripped higher off that area, retracing the entire down candle the next day and closing back above the December open at $90.3k. We then made a new swing-high around the yearly open, confirming bullish structure with a higher-high following the higher-low, and we have since formed another higher-low over the weekend and early price-action this week is seeing Bitcoin push higher. Now, daily momentum is still technically bearish, though daily RSI looks set to break back above 50. I think if we can accept above the yearly open this week with RSI back above 50, that will open up the next leg of the squeeze with no real resistance above $93.3k all the way into $98k, above which we have so much confluence for resistance and where I do think we see sellers step in, either to hedge exposure, look for fresh shorts or from selling spot in anticipation of a complacency shoulder: that $99k-$104k region is likely to be where that sell pressure is most prevalent, and if we can flip that zone back into support I think you're going to see a lot of people get nervous about the possibility of 'the bottom' being in without them and therefore wanting to catch the move back to the highs. On the bearish side short-term, if you're looking for downside here you'd want to see last week's high swept and longs jump in, then see price reject and trap them above the yearly open, leading to a break and close below $86.5k support - acceptance below that level I think it becomes more probable we take out all the lows into $80.5k and below.
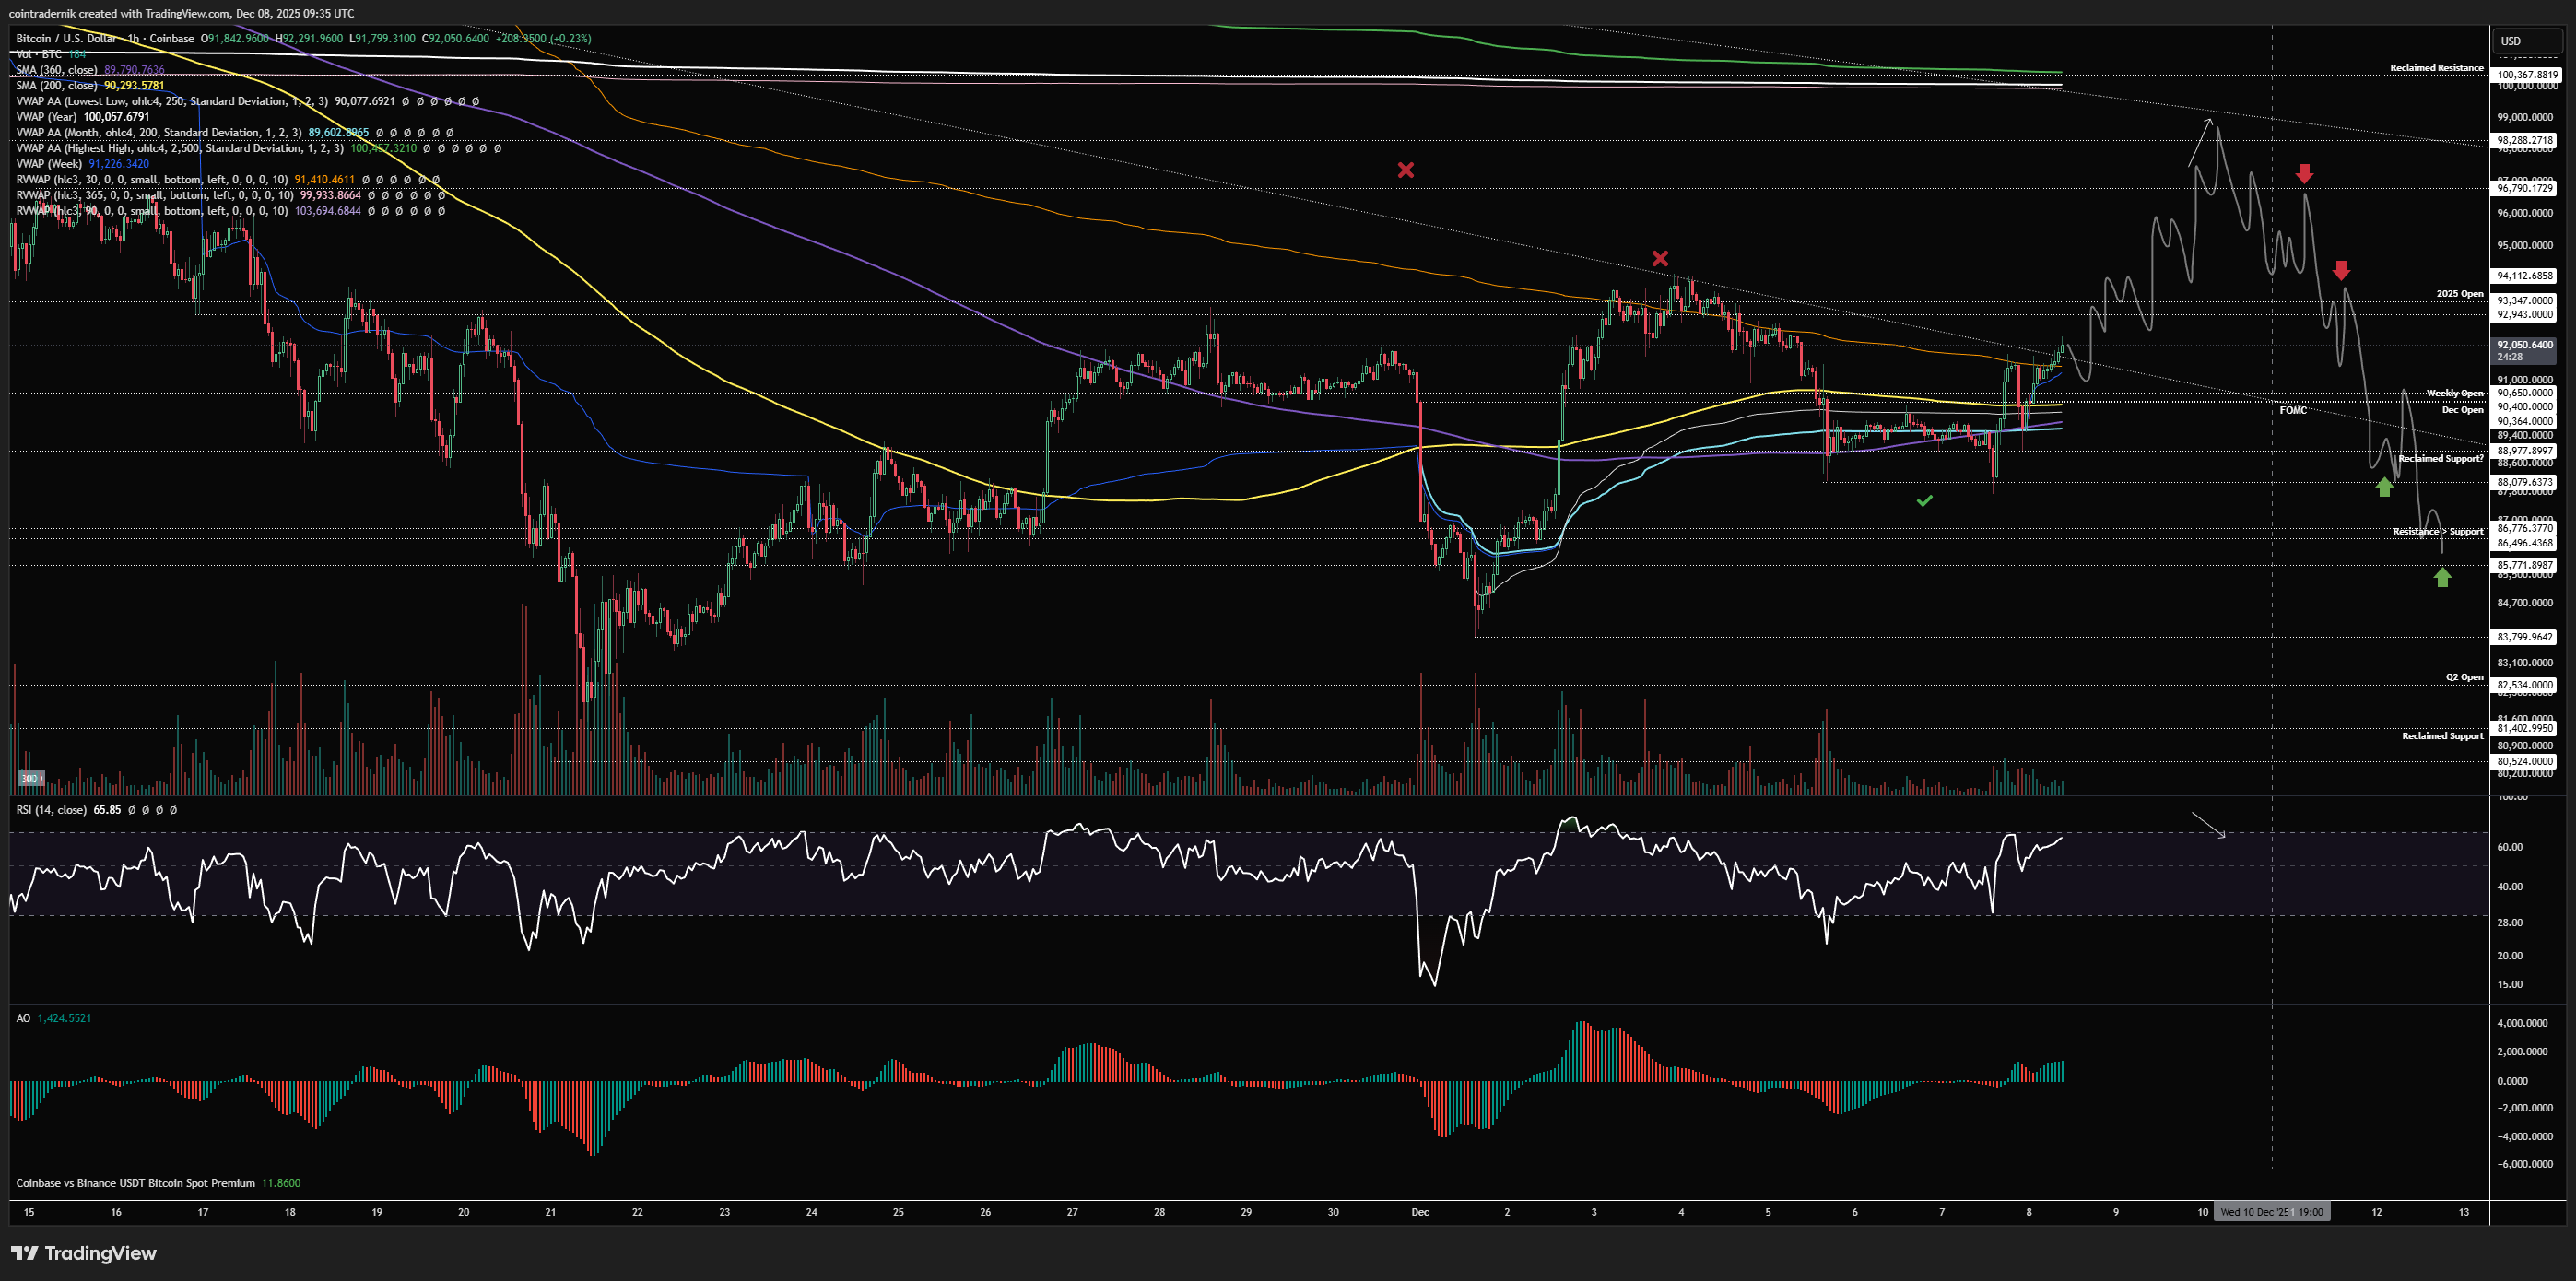
Now, we've been doing very well on the intraweek setups of late, so let's see if we can nail another one this week. On the short side, I would want to see price rip higher from today into Wednesday and form momentum exhaustion below that $98.3k area, front-running the major resistance cluster, and then look to fade a pullback into $96.8k after a post-FOMC rejection/breakdown, adding below the yearly open and covering at $88k and then TP2 at $86.5k, as there should be some support there and it could be where another higher-low forms:
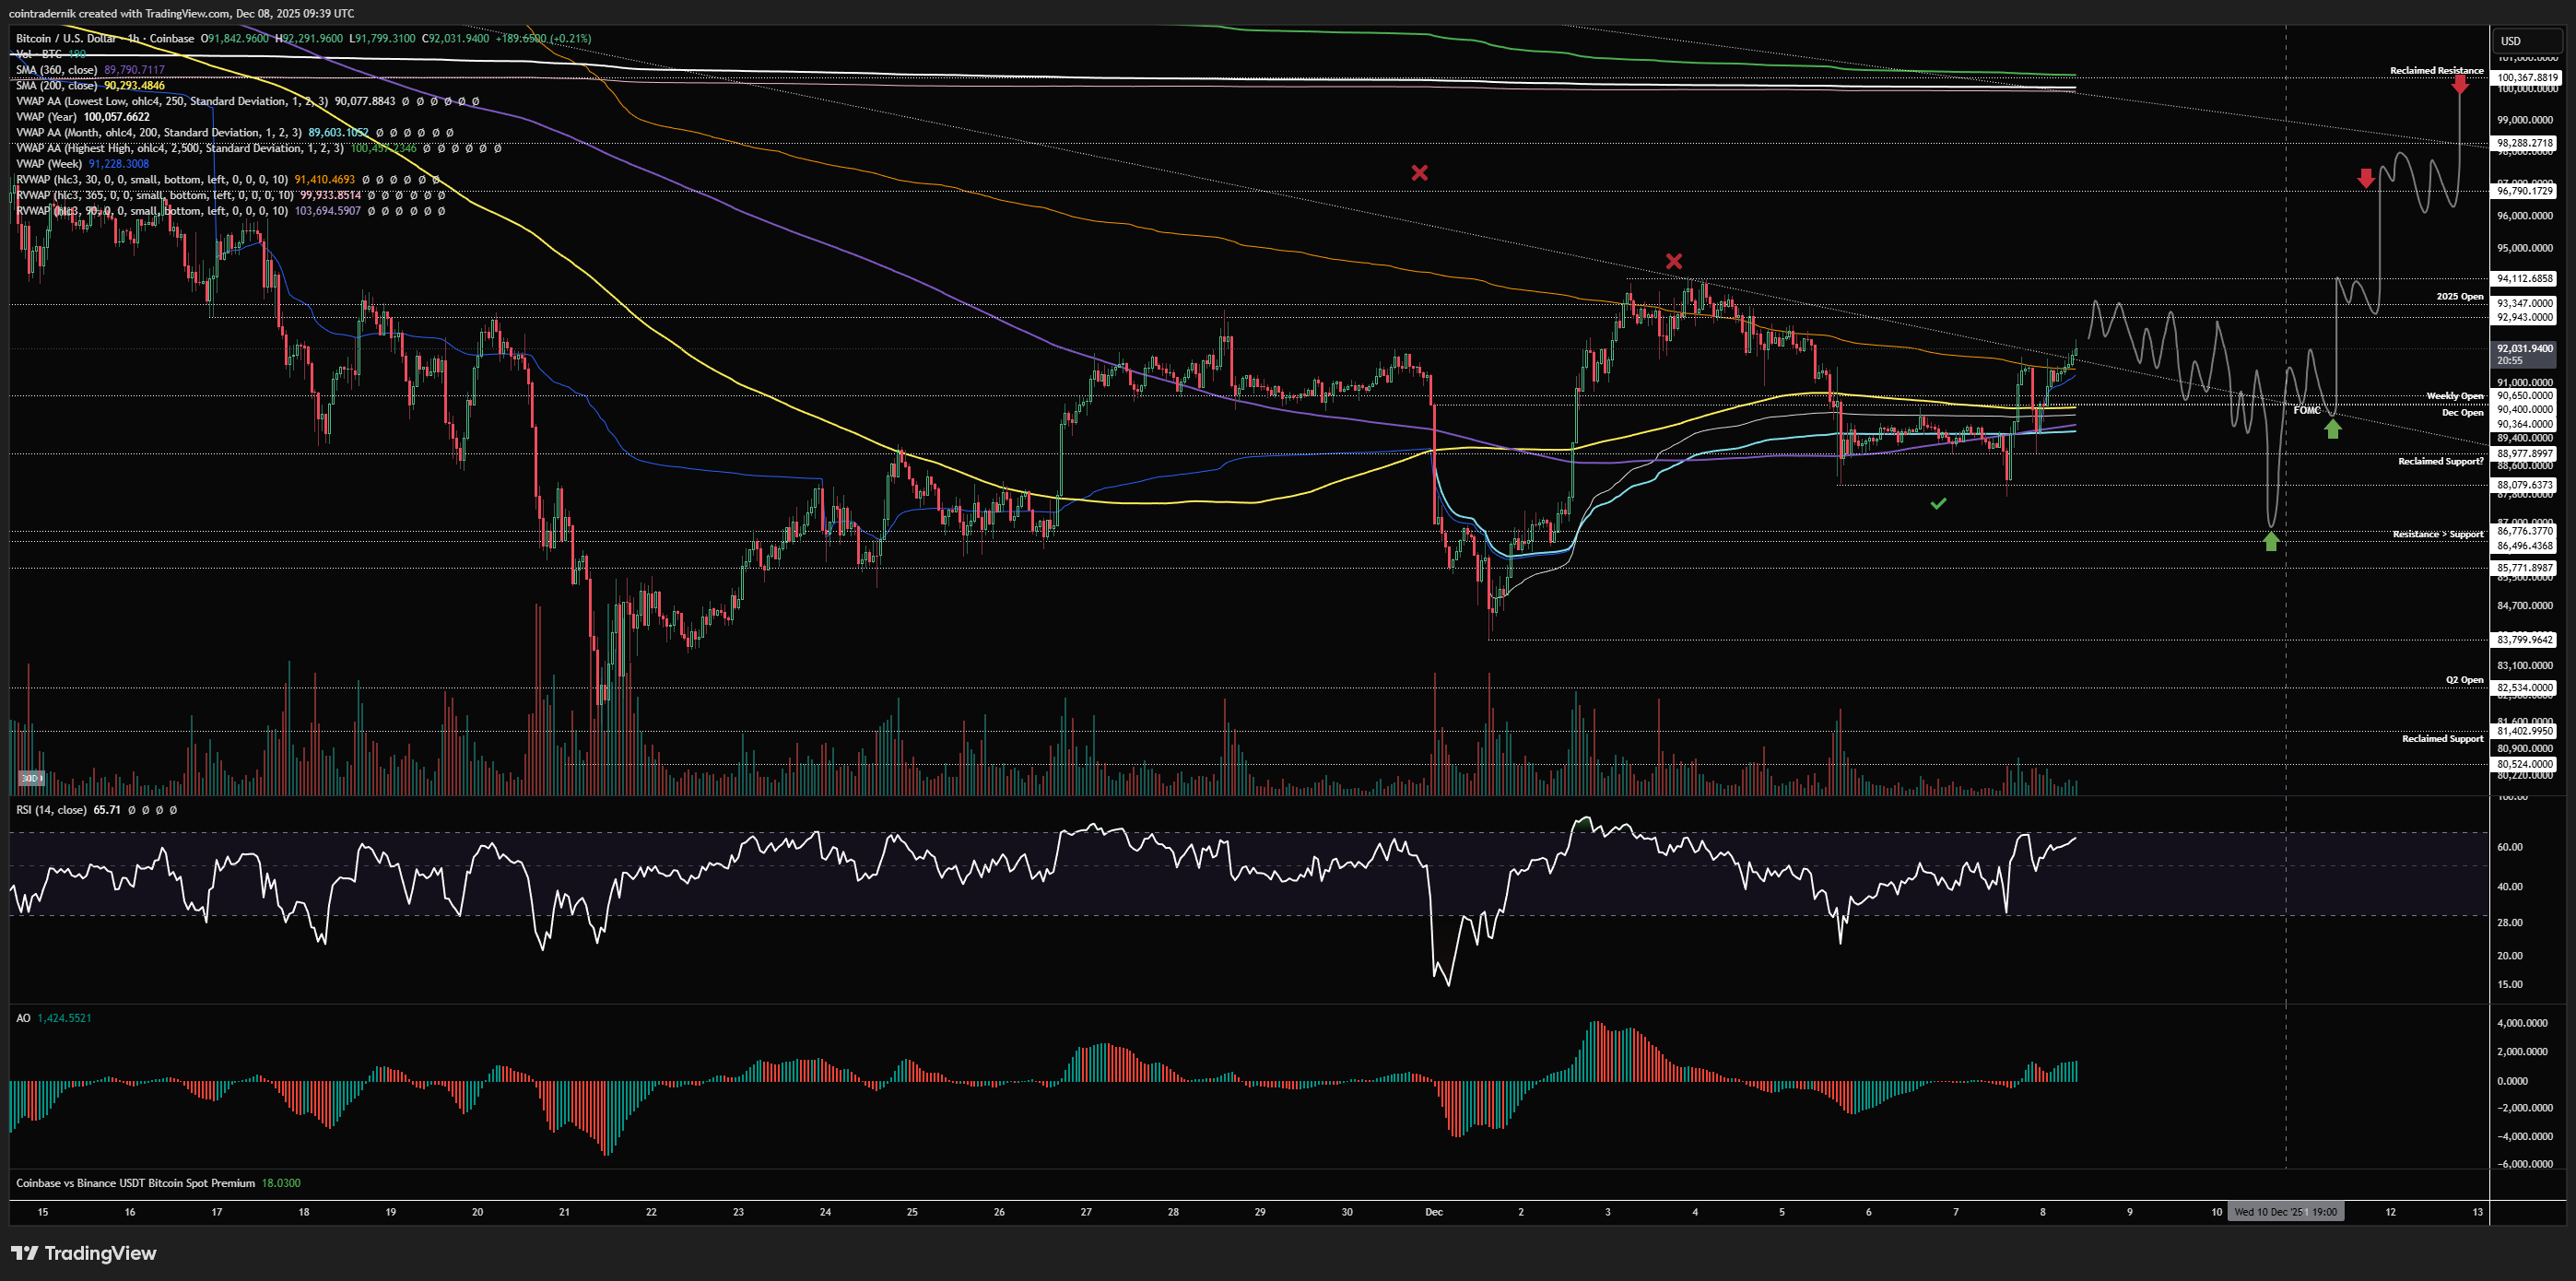
On the long side, which is what has been working over the past couple of weeks, I want to see last week's high left untapped and price to grind and chop over the next couple of days, then bid a fast scam dump below $88k pre-FOMC and add on acceptance back above $90.5kish post-FOMC, looking for $98k as TP1 and $100k as TP2, roughly:
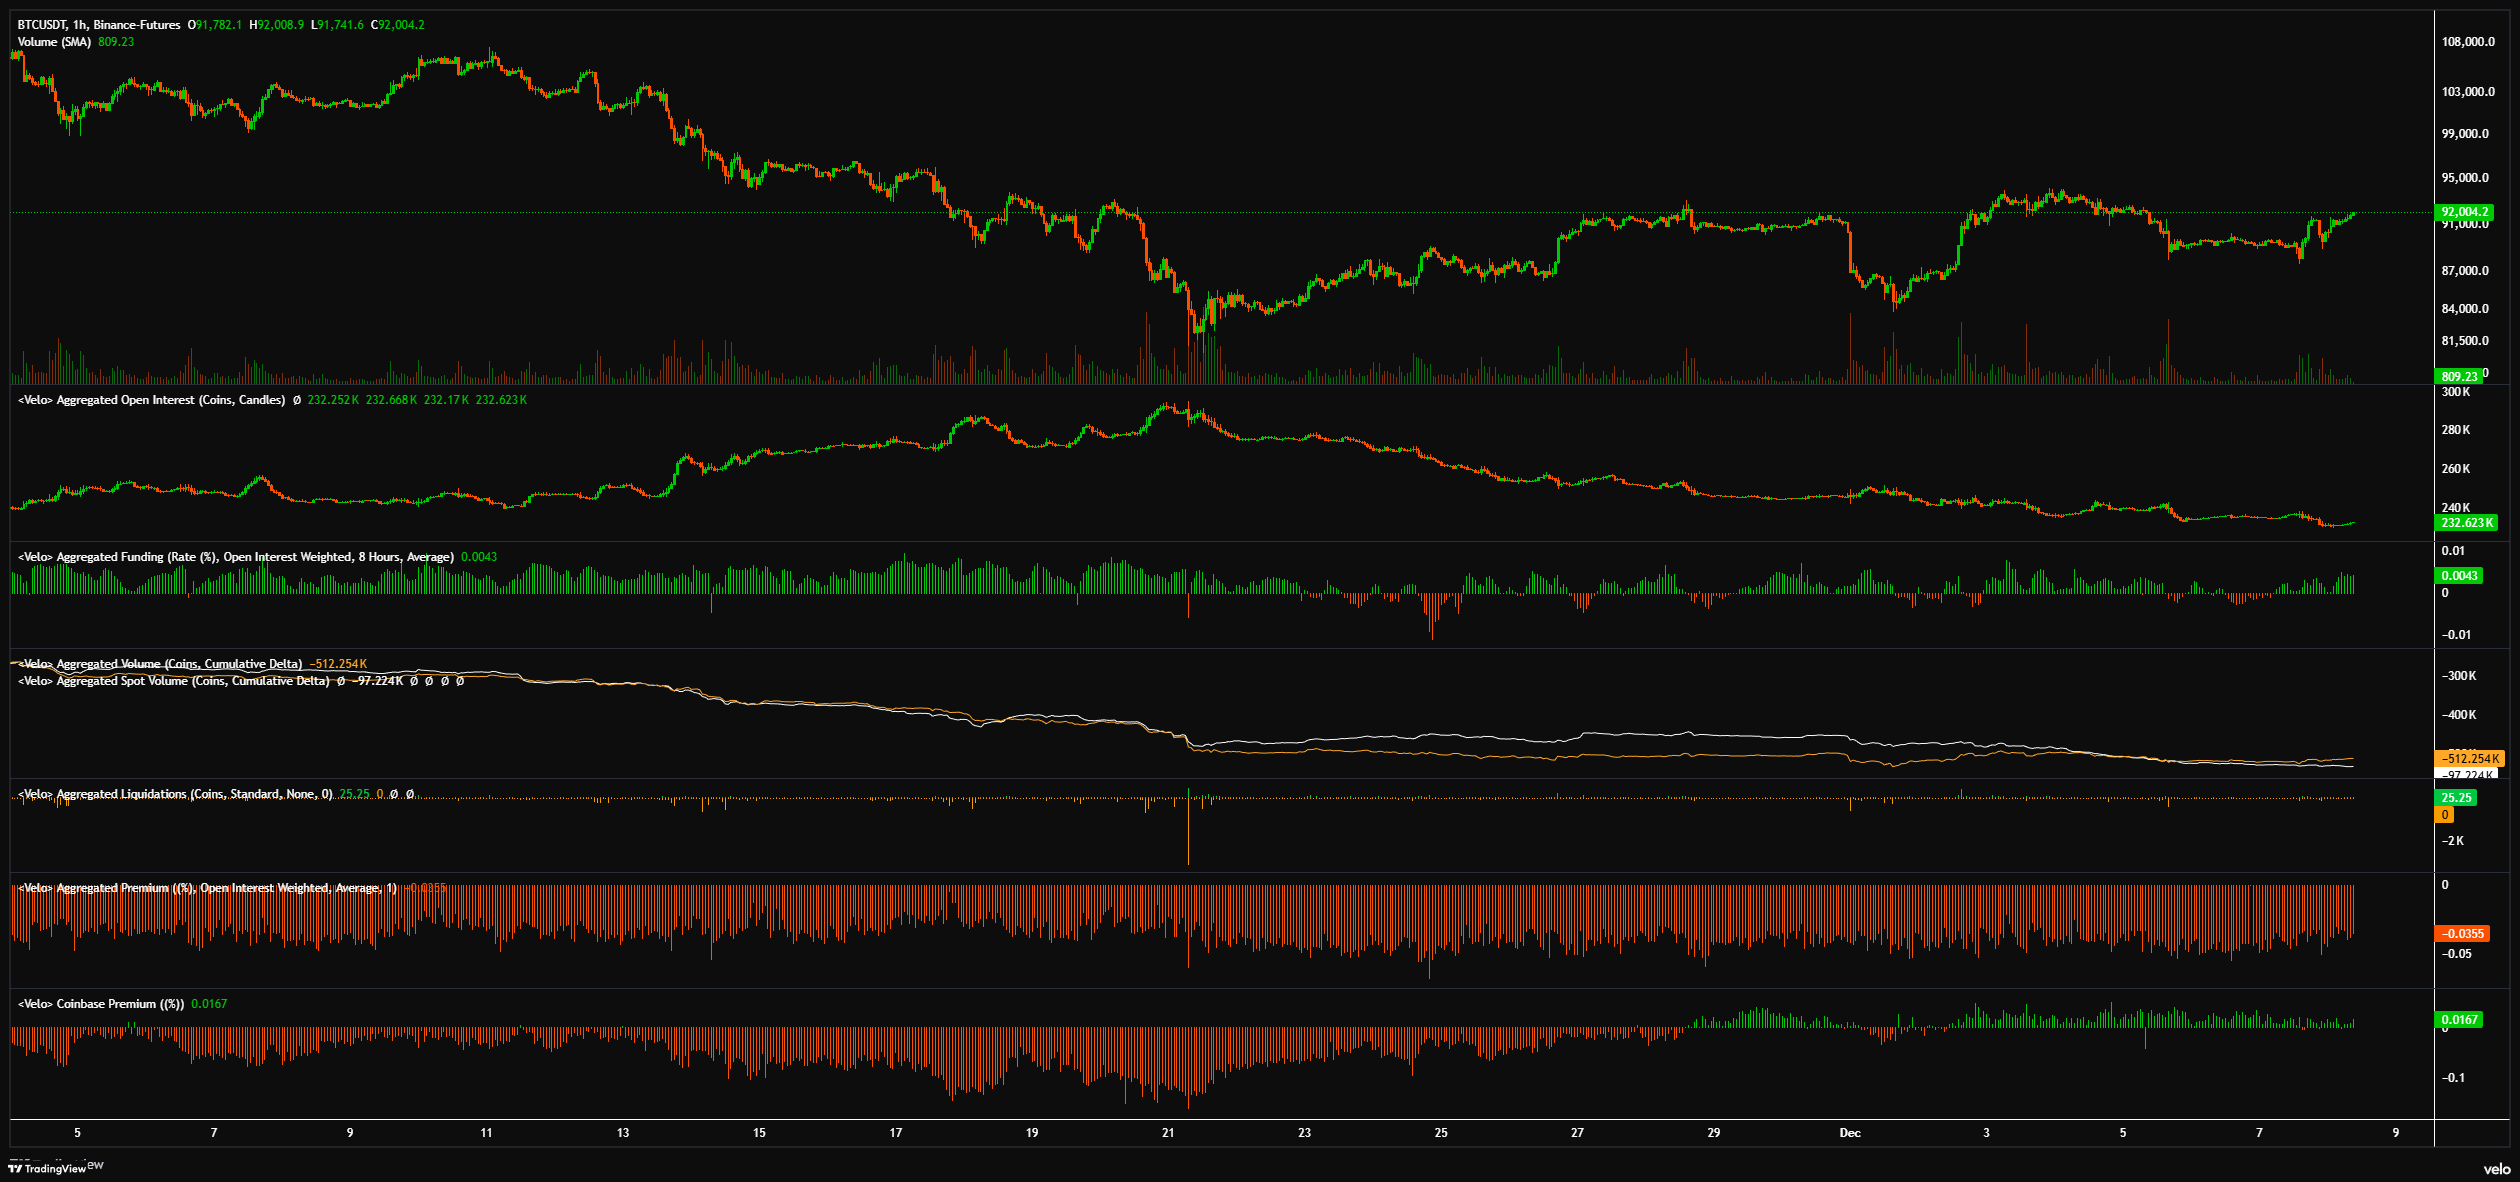
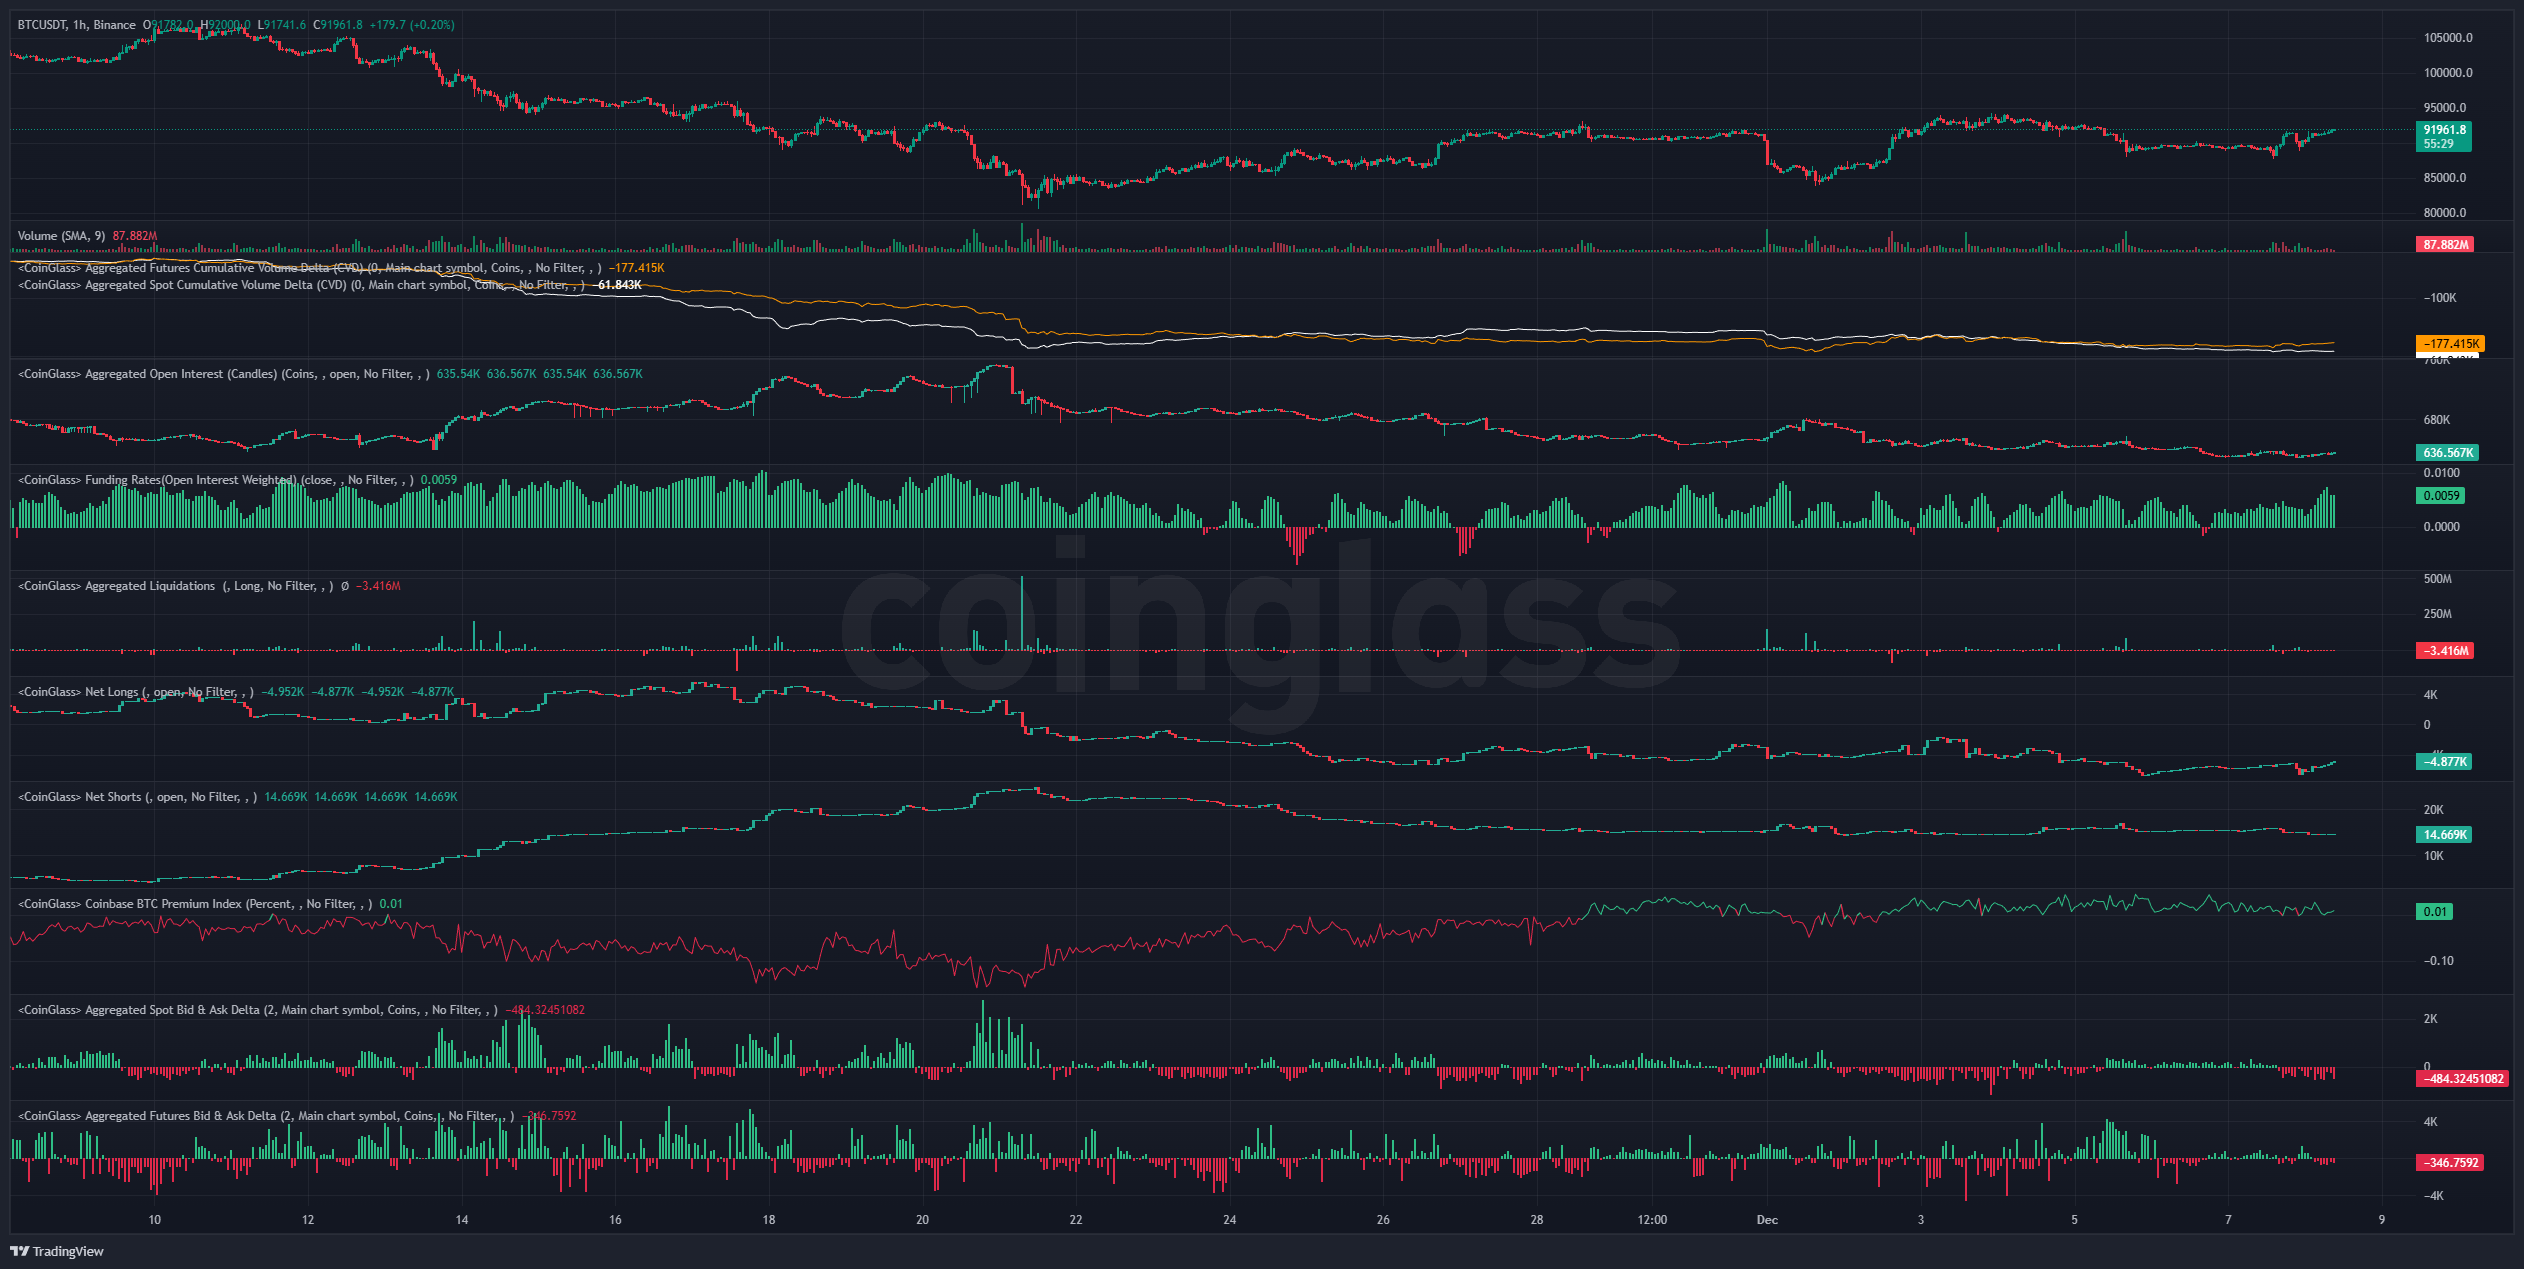
And here's a snapshot of positioning across Velo and CoinGlass:
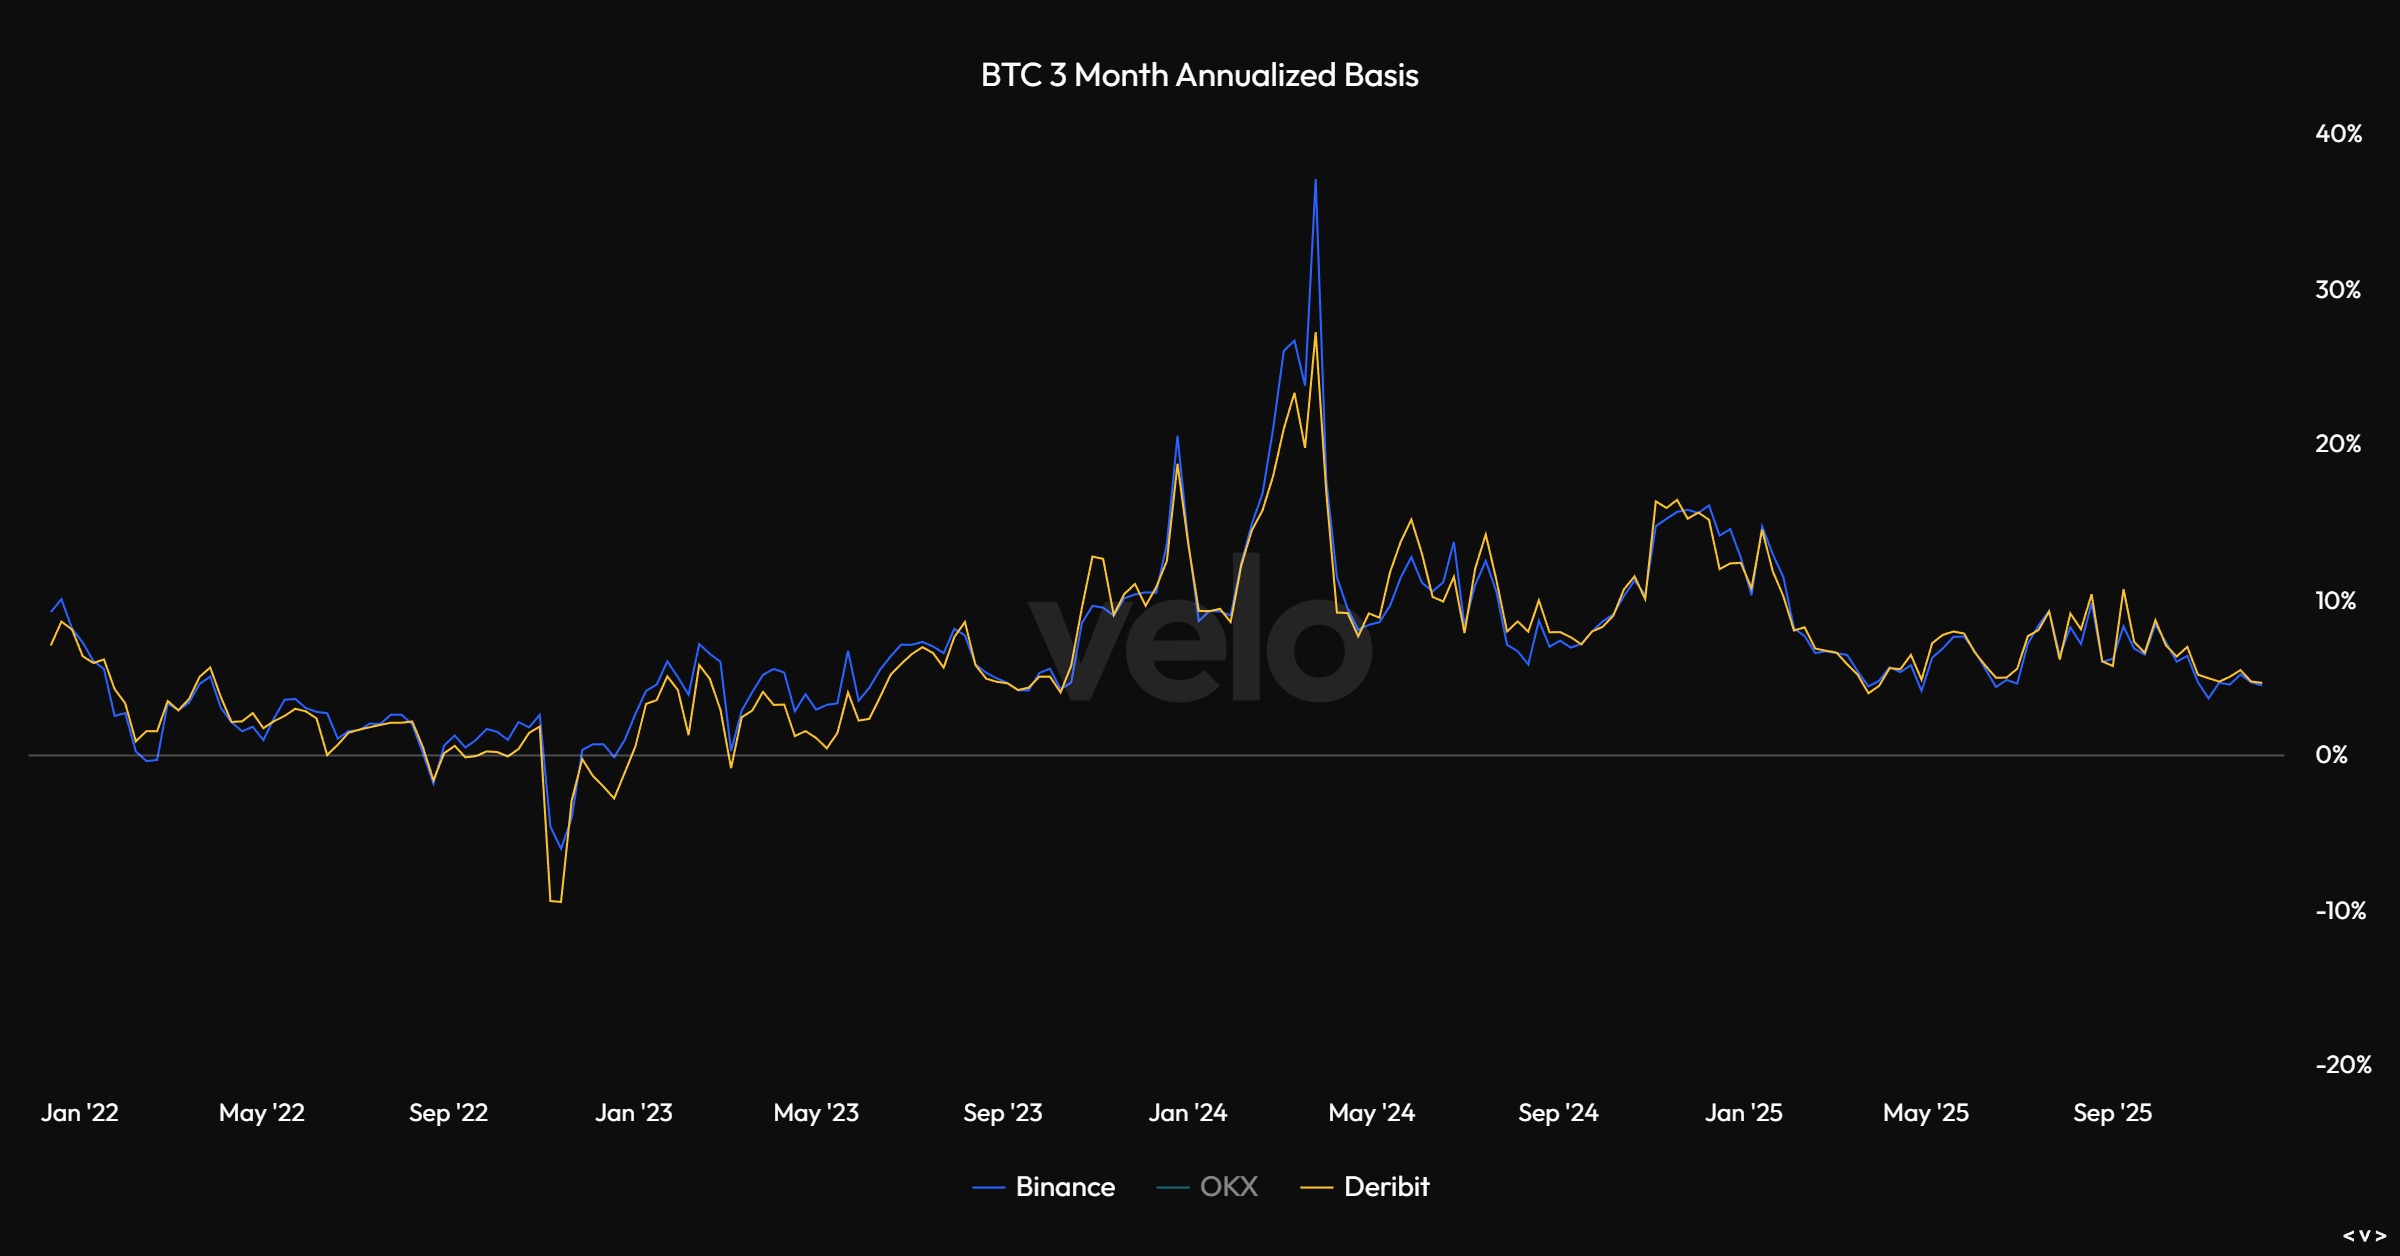
And here's 3-month annualized basis:
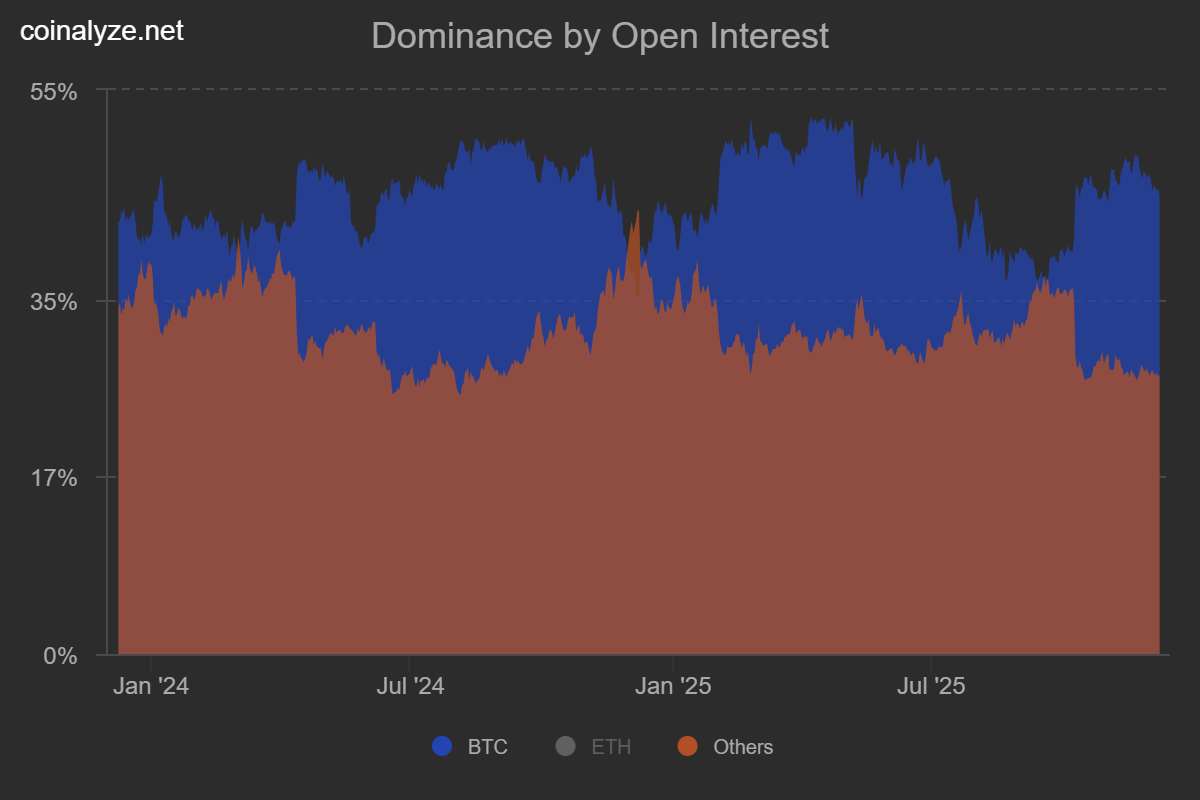
And Bitcoin OI vs Altcoin OI:
And finally some of the expected 1-week and 1-month liquidation levels:
-2025-12-08_09_02_32.png)
-2025-12-08_09_02_39.png)
Price: $3162
ETH/USD
Weekly:
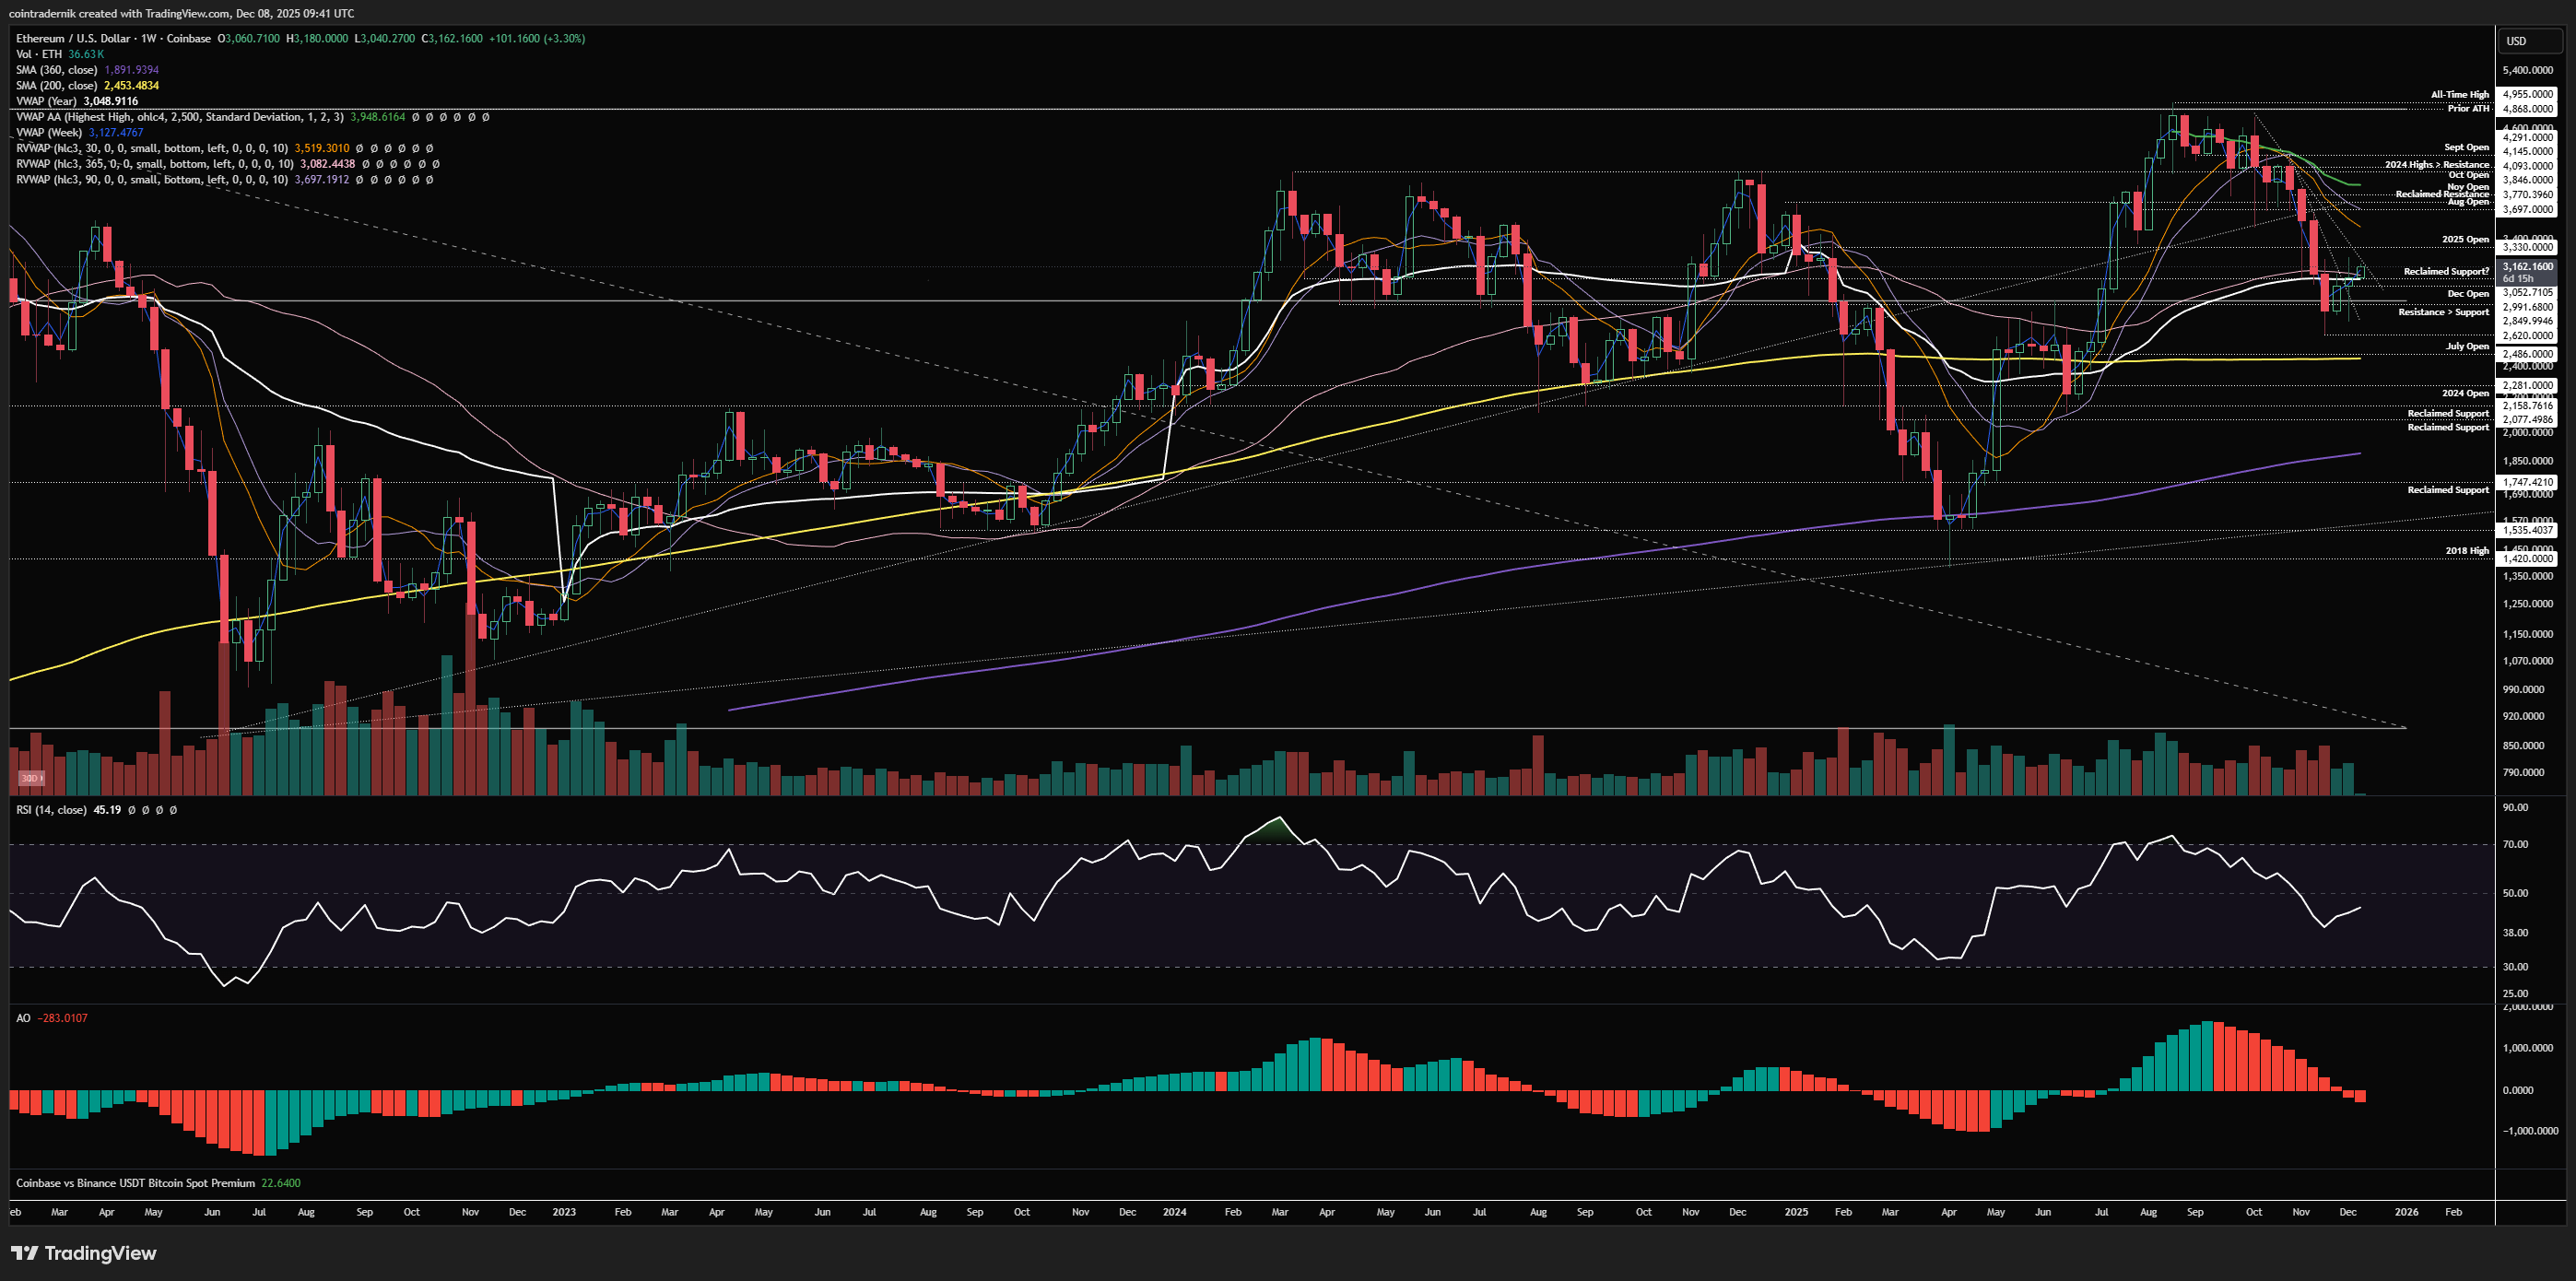
Beginning with the weekly timeframe for ETH/USD, we can see that price wicked below the prior weekly low and then took out the prior weekly high, trading above the yearly VWAP towards the yearly open but rejecting below trendline resistance and ultimately closing the week back at $3060, above the December open. I think there's a good chance we could see a trendline breakout this week if ETH can hold above $3050 as reclaimed support, where a weekly close above last week's high would open up a rally into year-end, where we could easily retest that $3700+ zone as support turned resistance. Despite all of the bearish sentiment, ETH is very much still in a multi-year uptrend, within which we are trading at a higher-low at present above the summer lows. As mentioned last week, I want to see this area mark out a higher- timeframe swing-low to be confident in continuation of this trend higher towards all-time highs, at least mid-term; obviously, we could trade as low as $1750 and still be within this multi-year upwards channel from June 2022, but trading those range lows would make it much less probable we see the top end of the channel any time soon. Rather, if we accept below the current swing-low at $2620, I think we have one chance at forming some weekly momentum exhaustion into the 200wMA as a major bottom, which if it fails and gives way would make it very likely we take out the summer lows and trade back towards the April lows and the bottom of the channel near $1750, thus making it highly improbable we trade new highs in Q1. If my broader view is correct, ETH should be marking out that durable bottom here, either already having formed or (as mentioned) forming with some trend exhaustion on another push lower, then trading higher into the range between $3700-$4100 as a huge area of overhead supply and forming a subsequent higher-low if we reject up there. So, at the moment, my expectation is something like $3770 -> $3050 -> $5000+ into Q1. Even mentioning the possibility of new highs on ETH seems ridiculous to the majority, particularly within the next 3-4 months, but both ETH/USD and ETH/BTC still look like they're in a longer-term uptrend and not in a bear market, in my view.
Daily:
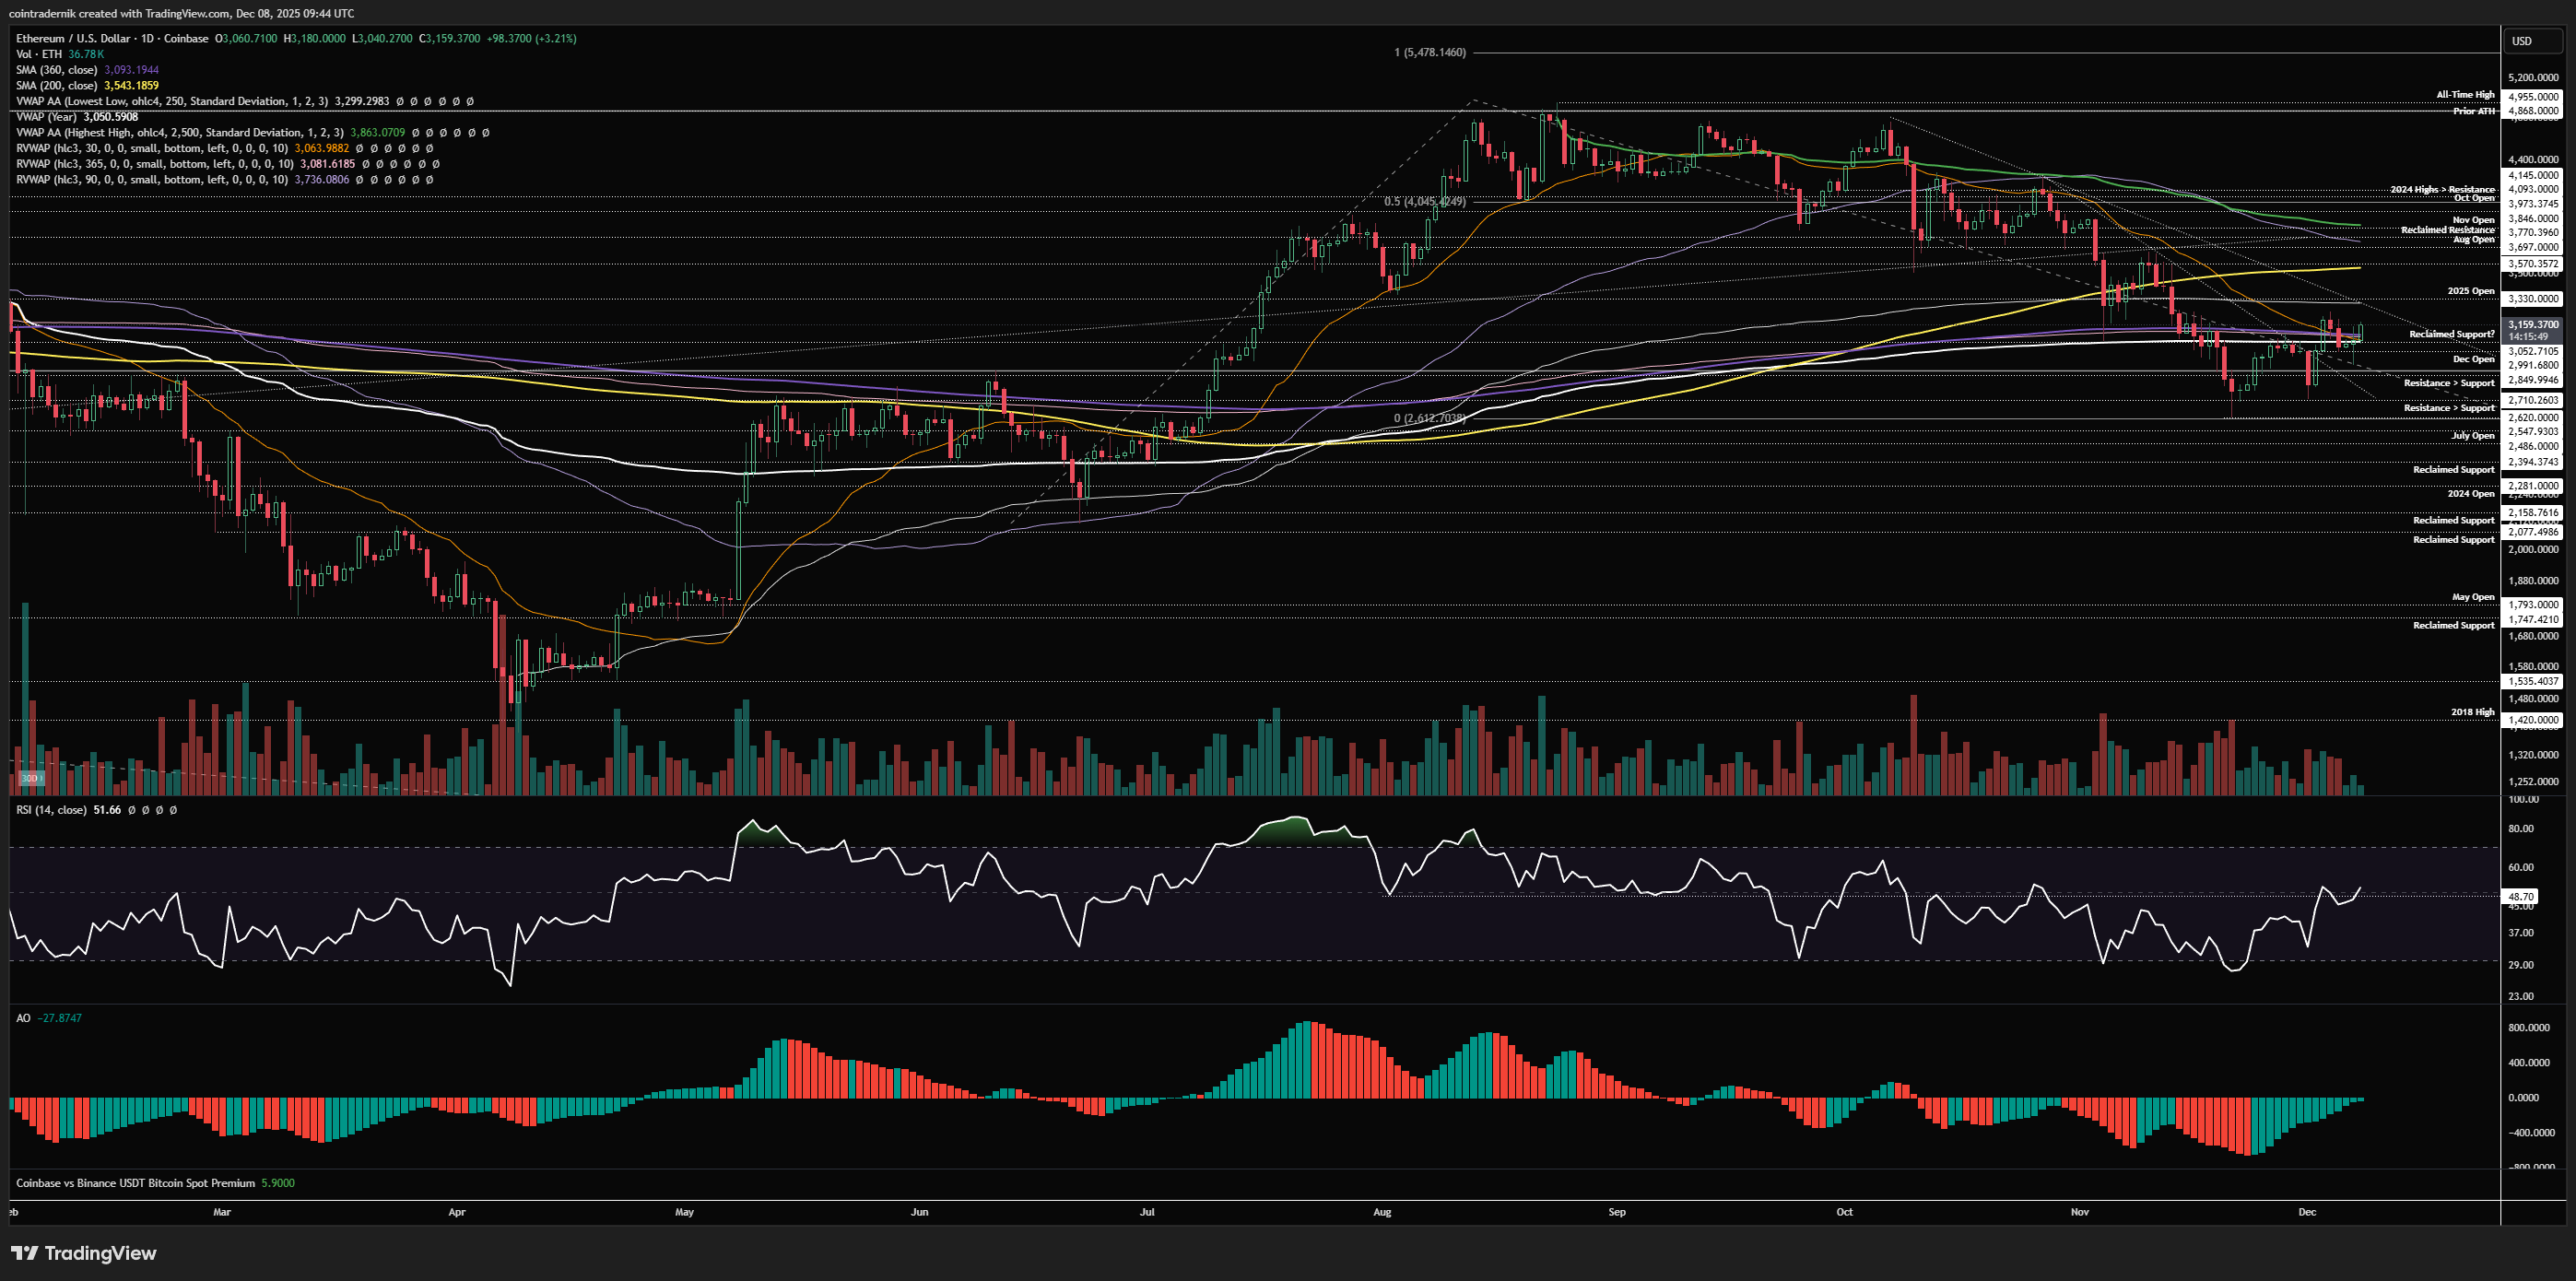
Looking at the daily, we can see price has turned daily structure bullish and reclaimed the yearly VWAP and 360dMA as support, with daily RSI back above 50 and AO about to flip green. This is not too dissimilar from the POV of momentum to the move off the April lows and June lows, and we are also now trading back above the 30d rolling VWAP for the first time since October. Price formed a higher-low last week above $2850 support and I would like to see that area hold this week, although we would be fine to wick below it as long as we immediately pushed higher off the sweep back above this cluster of reclaimed support. If we can hold this zone into next week and close above last week's high, I do think we push towards $3770 over the next couple of weeks into January, where we may see some sell pressure step in in the same manner outlined for Bitcoin, with expectations of a complacency shoulder formation. In my view, the broader market still points to continuation of the bull cycle in H1 2026 and so I am expect any sell pressure above $3770 to lead to the formation of a higher-low and then continuation higher towards $5000 and price discovery. As mentioned above, acceptance below the June low would obviously render this incredibly unlikely with regards to timing, so we really do want to see strength here into year-end and then look to bid January weakness for strength the rest of Q1 into April.
ETH/BTC
Weekly:
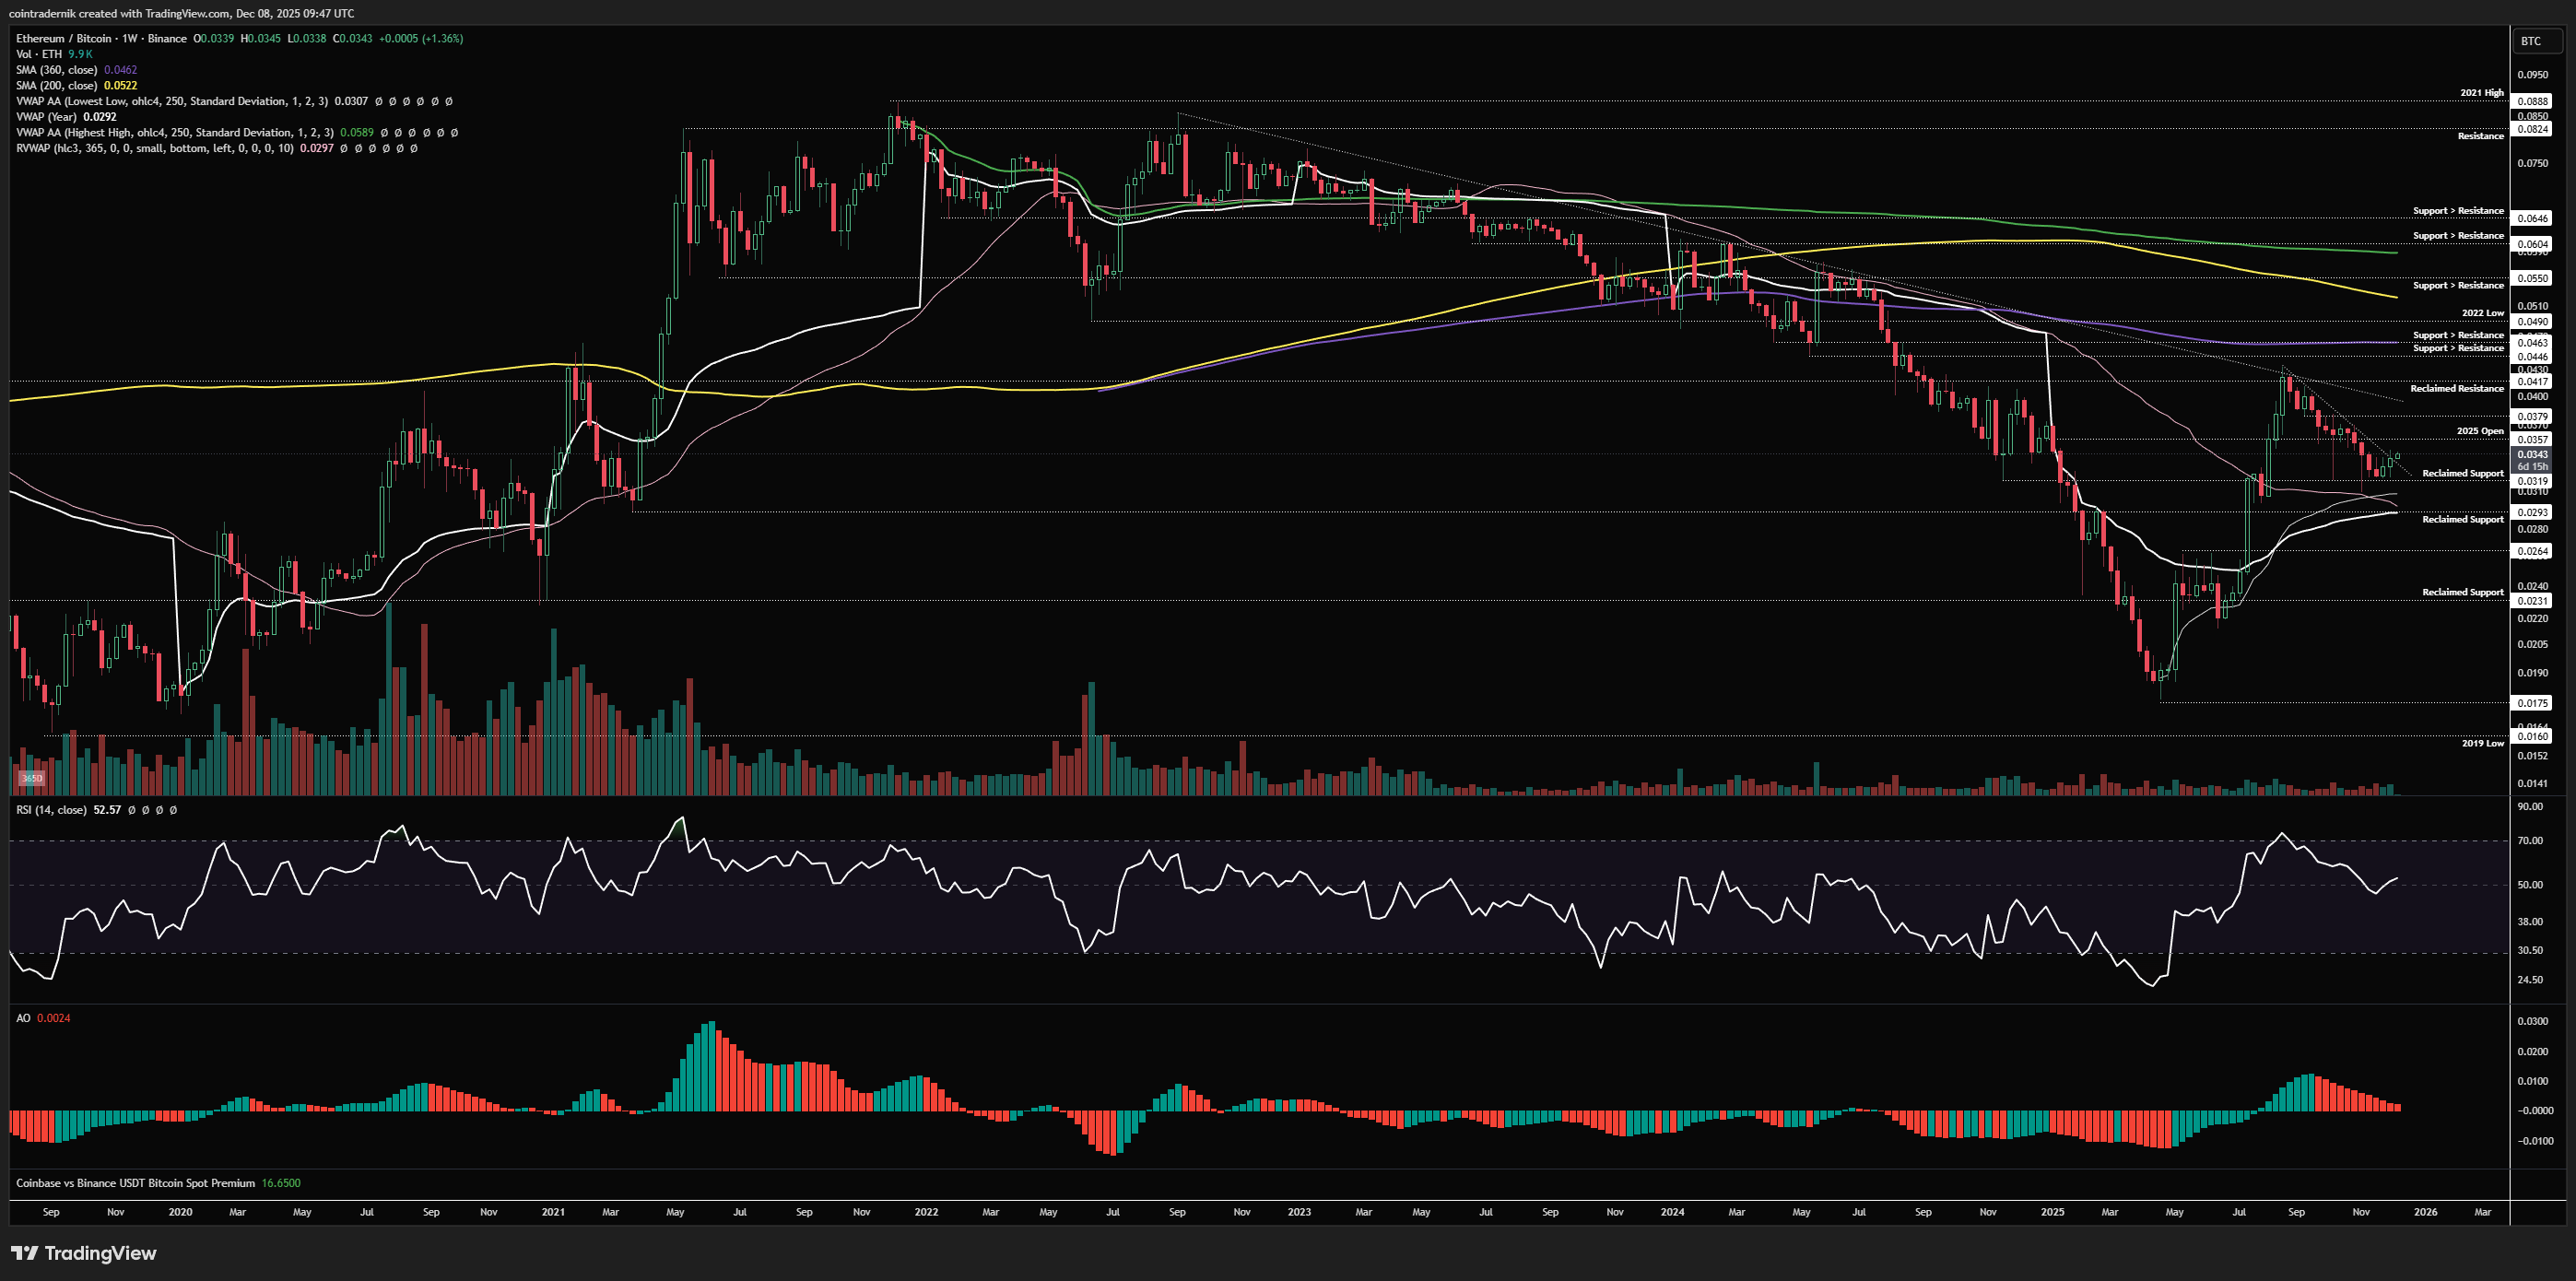
Looking at ETH/BTC, we can see from the weekly that price bounced off support at 0.0319 last week and closed marginally above trendline resistance from the yearly highs, which has capped rallies every week since September. We now need to see this breakout lead to some continuation and weekly momentum looks supportive of further upside here. If we can now close the weekly back above the 2025 open at 0.0357, I think it is inarguable that this is still an uptrend from the April lows and thus we should expect a return to the yearly high from there, above which we have clear skies towards 0.055 in Q1. Nothing has changed re: invalidation of this view - below 0.0293 the picture looks vastly different.
Daily:
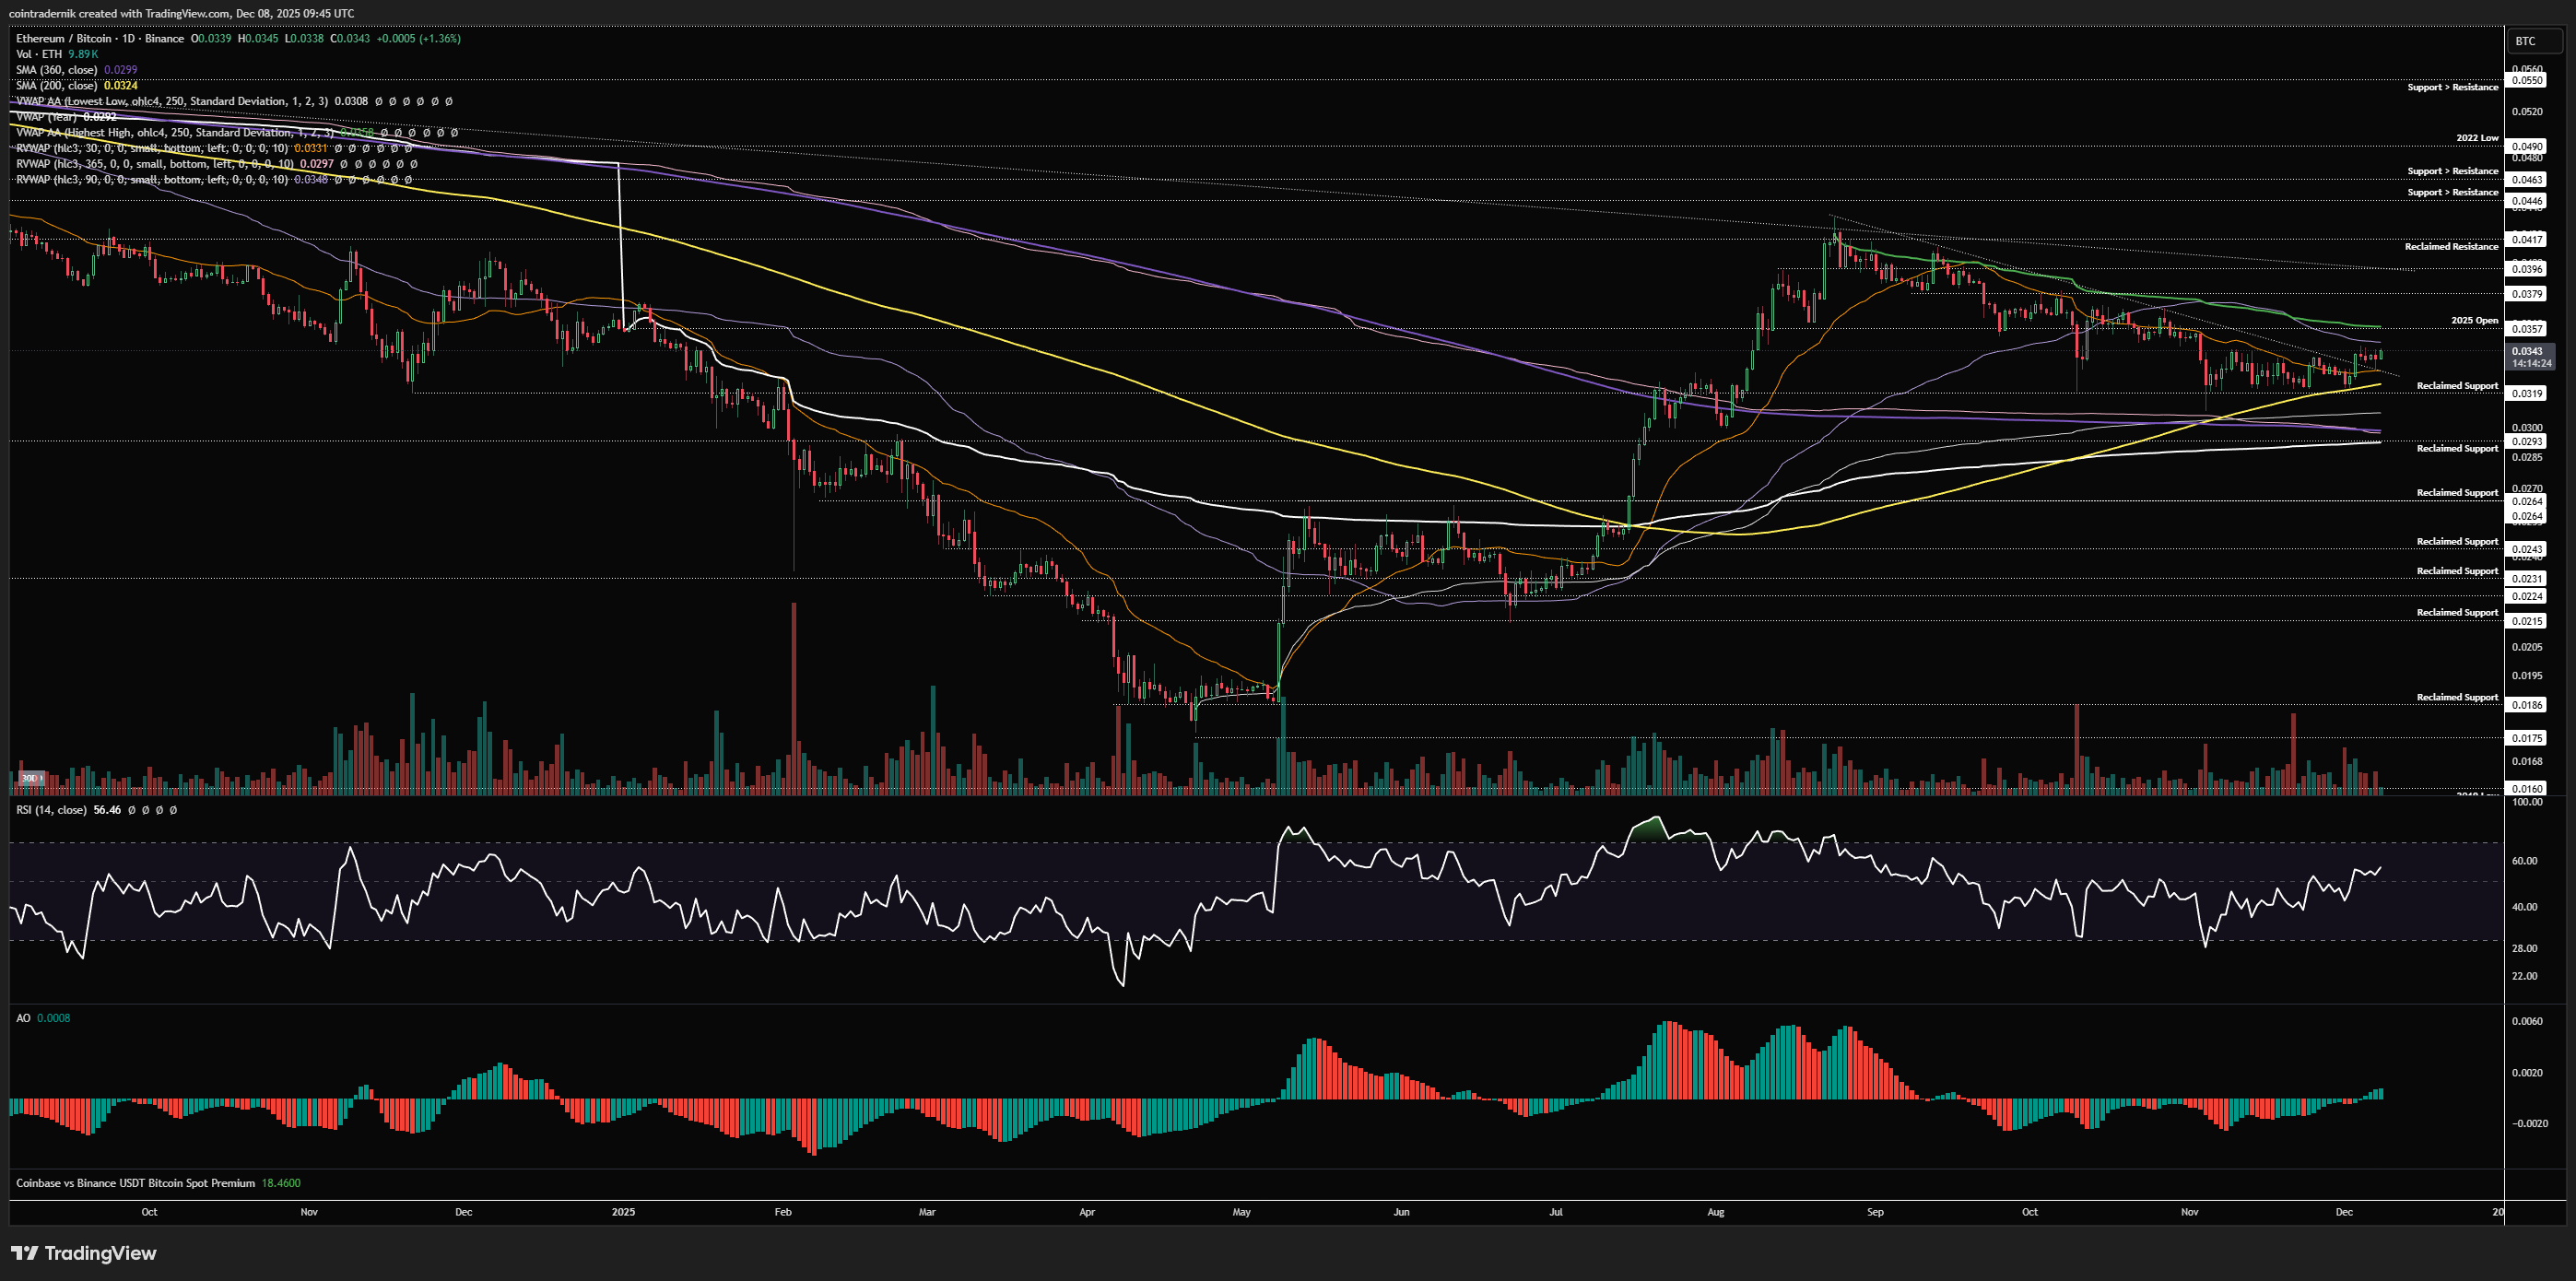
Dropping into the daily, we can see that price is now holding the 200dMA as support for higher-lows and is emerging from the extremely tight range that had formed following this trendline breakout. We are now sandwiched between the 30d rolling VWAP as support and the 90d rolling VWAP as resistance, with the anchored VWAP from the yearly highs above that confluent with the yearly open at 0.0357. I would like to see the 30d rolling VWAP hold here as a higher-low formation this week and price then break and close through the overhead resistance, subsequent to which I think it is much more probable we begin that leg higher into the 0.0417 retest. For context, ETH/BTC back at 0.0417 with BTC staying around $90k would be $3750ish on ETHUSD, whilst ETH/BTC at 0.0417 with BTC at $100k is a $4170 ETH - key levels across the board for that narrative to build around the complacency shoulder / lower-high - but if ETH/BTC has bullish weekly structure and bullish momentum and the broader market for risk still looks like it wants higher, I would expect any weakness around those levels to lead to higher-lows and then higher-highs.
Receive the latest updates directly to your inbox

Price: $98.59
Weekly:
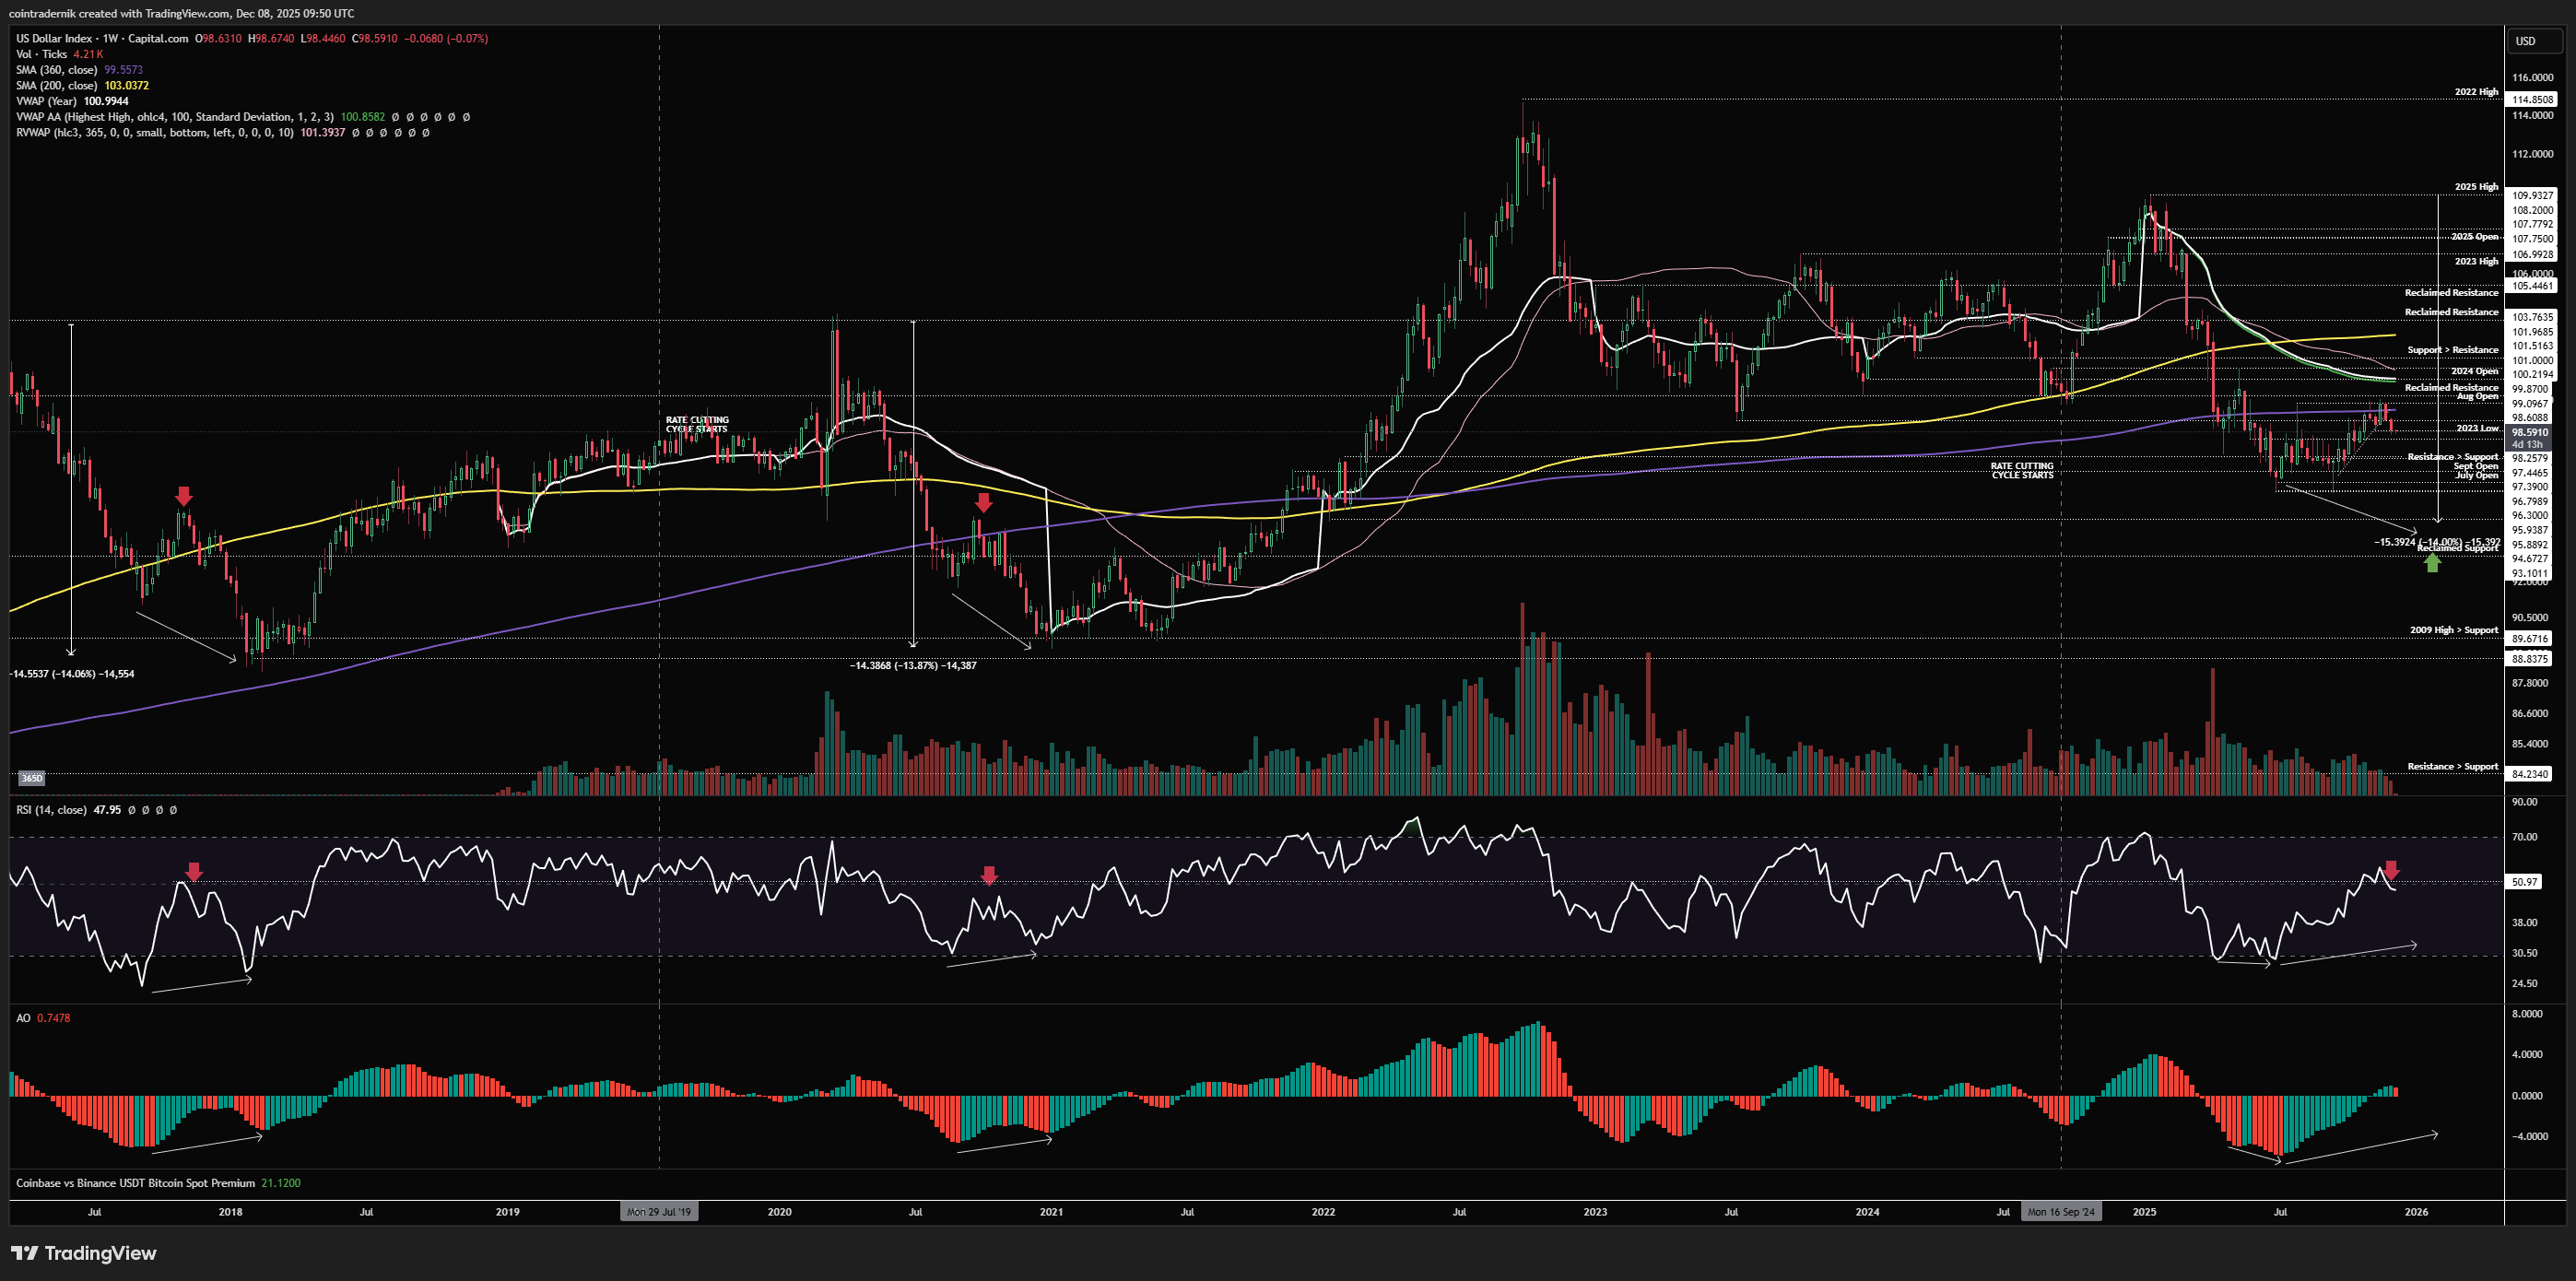
Looking at the weekly timeframe, we can see that price continued the downside momentum following the prior week's price-action, confirming a momentum breakdown (on both the weekly and daily timeframes). We saw price sell off from the open, finding resistance below 99 and pushing into 98.6, around which it closed. I would now expect to see continuation lower into Q1, though we may see some volatility this week around FOMC and a potential whipsaw move, but I expect any push higher to be fade into next week and DXY to break lower towards 97.4k as the next major support. Below that level, we get a sweep of the range lows and the reaction there will determine whether we have juice for the next leg lower that I am anticipating or just more consolidation around 96. One thing I want to mention here is that DXY is still a long way away from recent cyclical lows, with both prior cycle bottoms occurring around the 89 handle. I explicitly do not expect weakness in the dollar from the 99 handle into 96 or even 93-94 (which is where I expect formation of a cycle low at present) to lead to weakness in risk appetite, contrary to some of the stuff I'm reading on the timeline. DXY and USDCNH down another leg at this stage of the broader cycle and from these levels would just ease global financial conditions further and allow for a continuation of the broadening out of risk appetite and outperformance further out the risk curve, in my opinion: obviously, if we see DXY trade into the 89 handle and then start breaking below it, we are seeing a break of a 16-year bull trend for the Dollar that has seen cyclical higher-highs and higher-lows - and that would be more indicative of this time being different and more damaging geopolitical implications. Unless (and until) we see that, I continue to expect a marginally weaker dollar to lead to an improved global growth outlook, a rebound in liquidity conditions and a bottoming out in inflation expectations into 2026, all of which should help fuel further upside a la 'higher for longer'.
Daily:
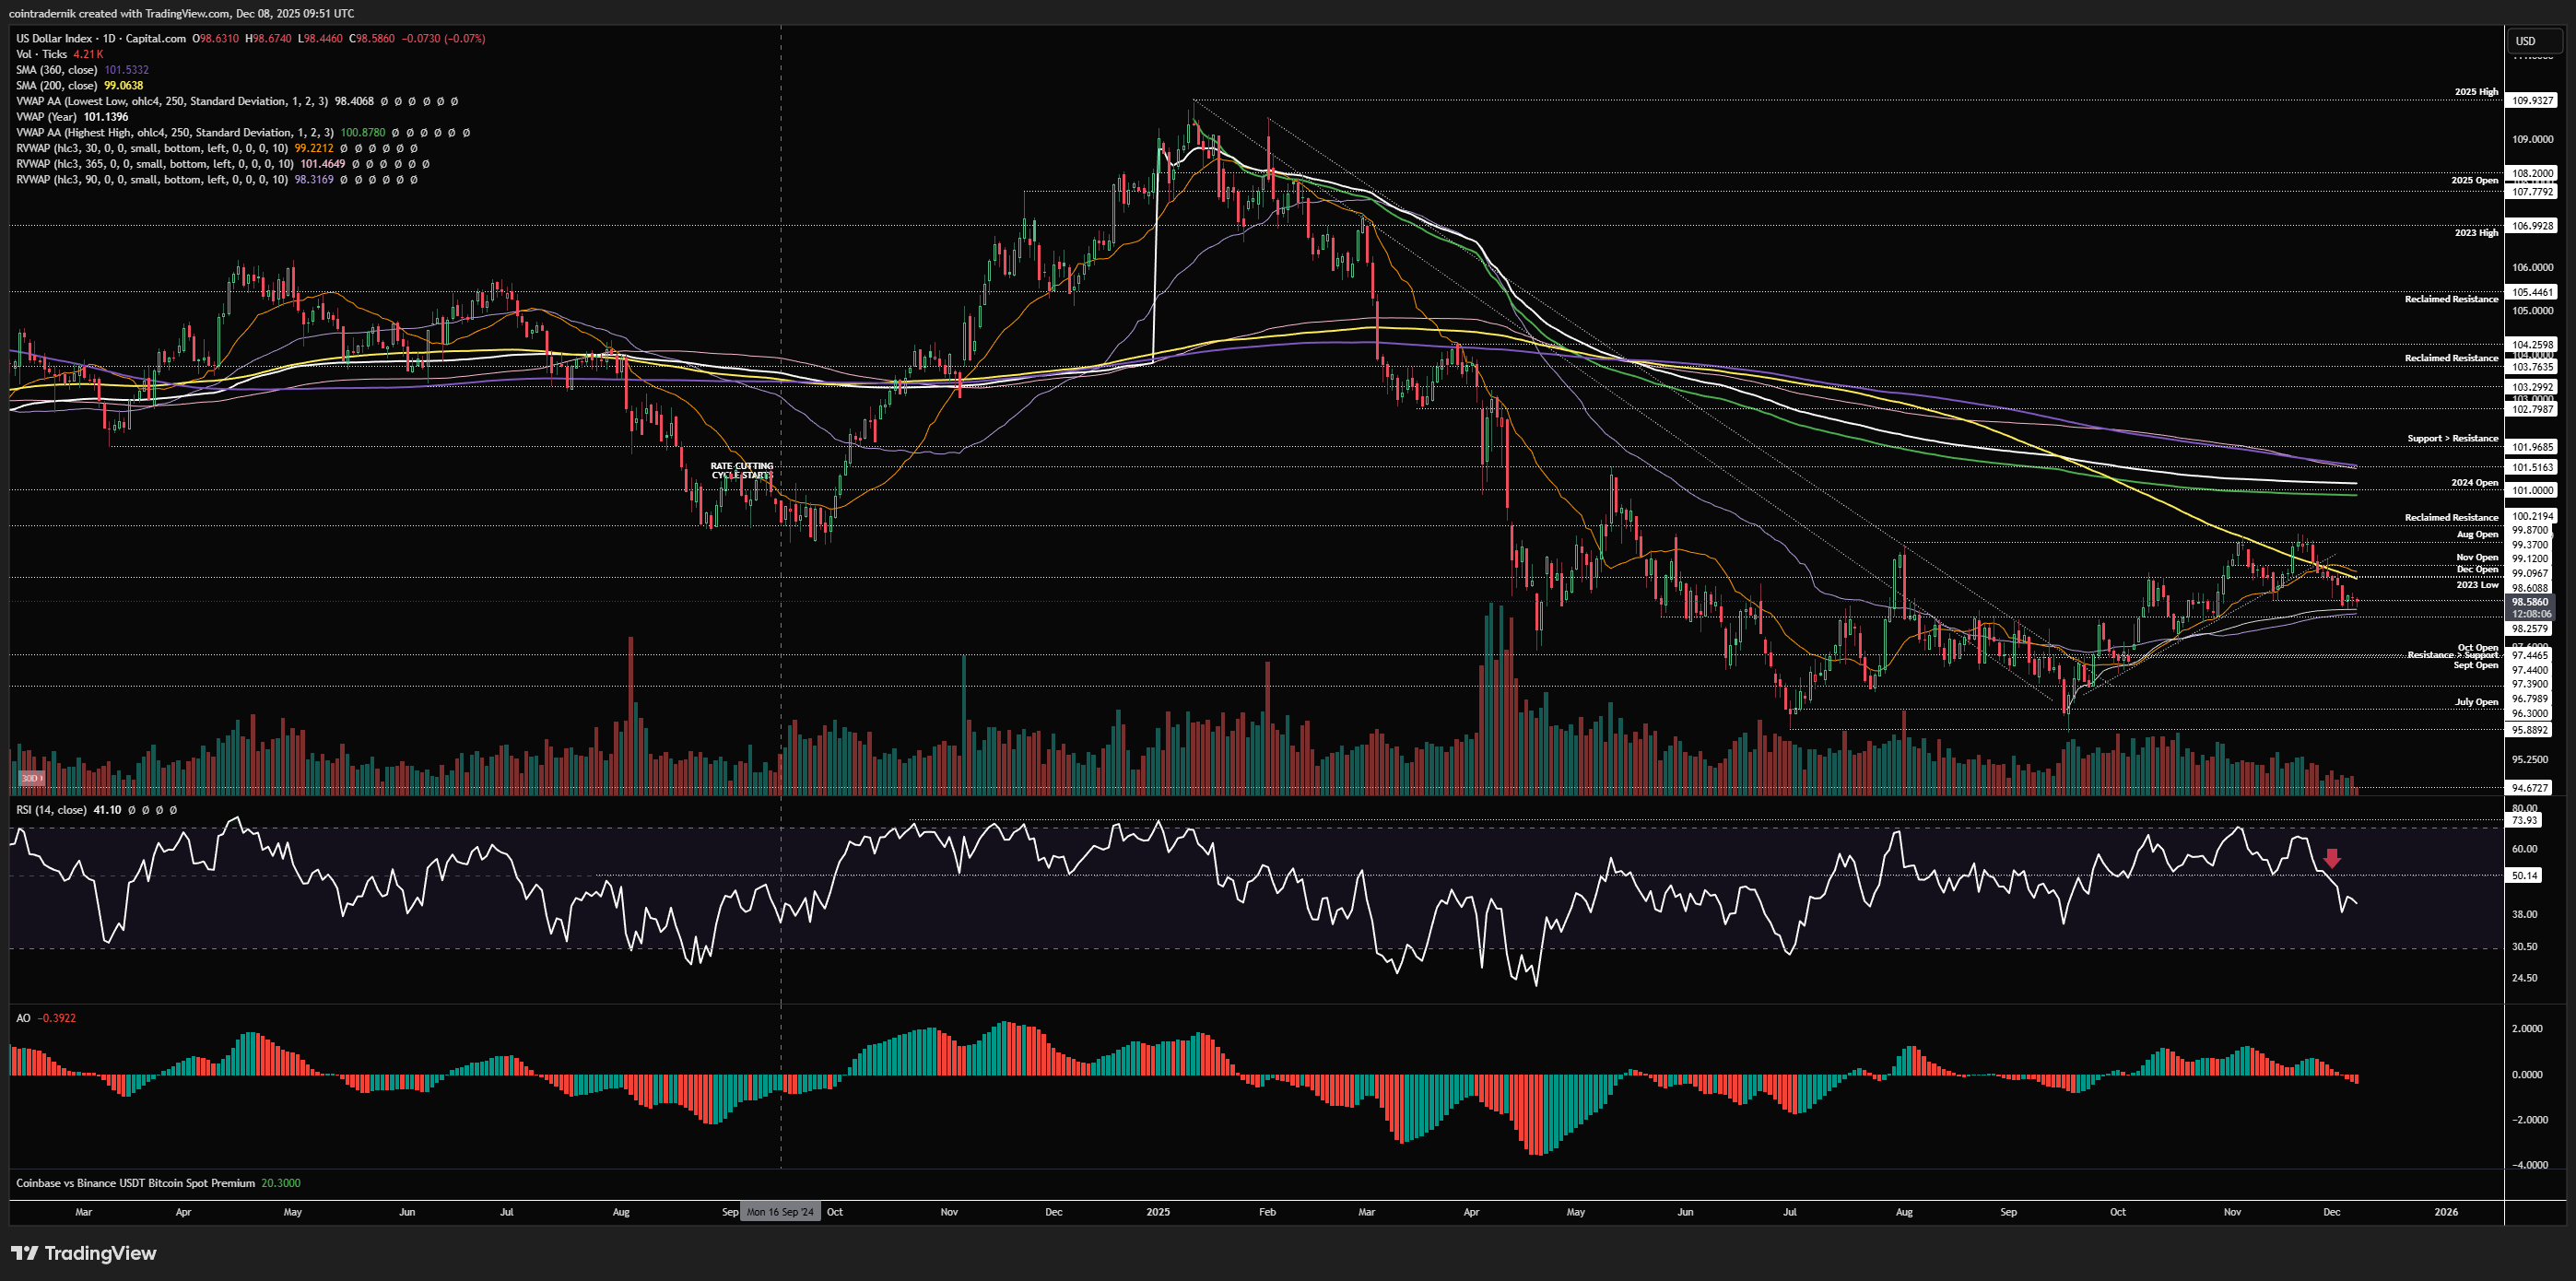
Dropping into the daily, we can see daily structure has shifted bearish and this has been confirmed by a breakdown in momentum, with daily RSI back below 50 and AO flipping negative. In some sense, it mirrors the price-action and momentum around the January top going into February. I would like to now see the 30d rolling VWAP at 99.2 act as resistance and then DXY break and close below the confluence of support at 98.2, below which I think we accelerate into 97.44, where there is more support but where I think demand will be faded for a retest of range lows. Acceptance above 101 remains the key signal that the Dollar cycle has shifted in favour of a longer-term uptrend, in my view, though if we mark a low here and close above 100 I would see that as an early sign of this dynamic and would not really expect much resistance out of 101.
Price: $5.45
Weekly:

Beginning with the weekly view for Copper, I first want to state that there is nothing about this chart that should make you bearish more broadly on growth and inflation into 2026 - we have a multi-year uptrend and within that we have a multi-month uptrend from the July lows and within that we have broken above resistance at $5.30 and closed firmly through it as of last week, with no resistance from here to the $6 2025 highs. If Copper is looking extremely bullish into Q1 2026, I just don't think it looks like global recession is imminent - and if there is no imminent global recession, I believe that's another point of confluence for my 'higher for longer' view over the coming months. Now, if this marks out a lower-high below $6 and then breaks down on the higher timeframes, we can start thinking about what that means for growth and inflation, but for now this looks like it wants to rip beyond those highs into price discovery, marking out higher-lows on every local pullback. If we do get a dip here, I think $5.17 is a nice level for bids with invalidation on a close below the anchored VWAP from the $6 high. I expect we continue towards that high into January, with strong seasonals into late April for a major peak.
Daily:
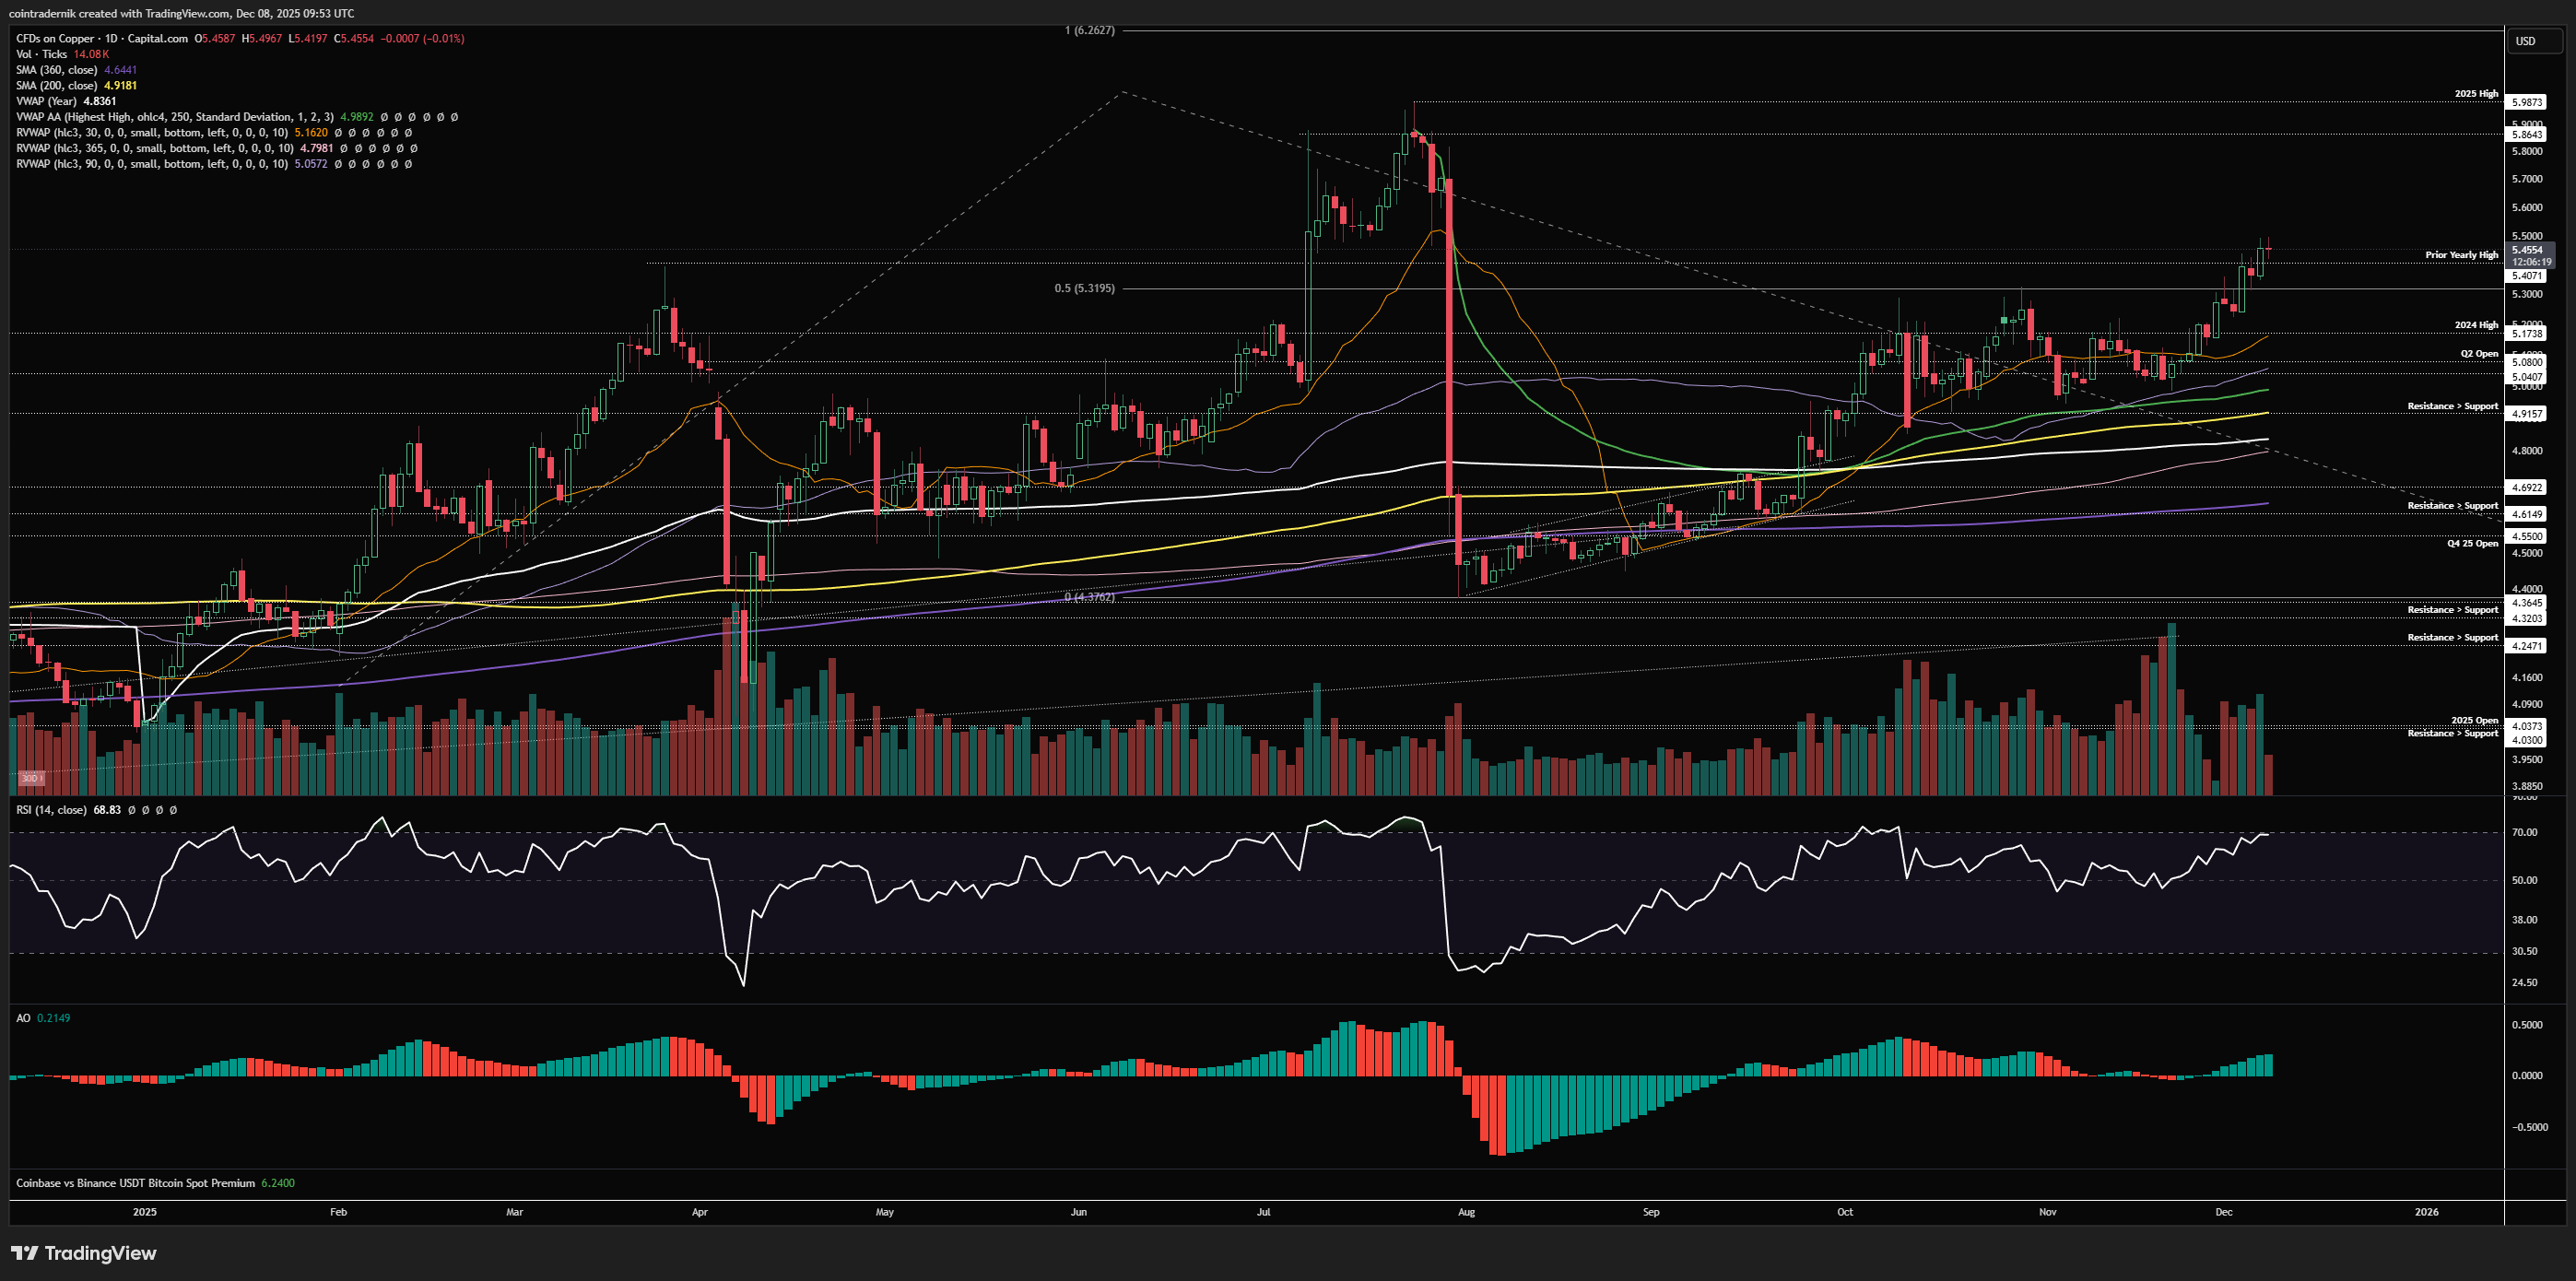
Turning to the daily, we have no signs of trend exhaustion here and momentum looks good for higher, with daily structure very much bullish as price flips resistance levels into support. We are currently above all of the key MAs, VWAPs and price levels, with that 2024 high at $5.17 confluent with the 30d rolling VWAP as an area of interest for longs on a retracement. We have zero resistance levels above last week's high into $5.85, so I do think dips continue to be relatively shallow until we tag those upper levels. Don't overthink this one - longs are favourable unless we're trading back below $4.90.
Price: $59.64
Weekly:
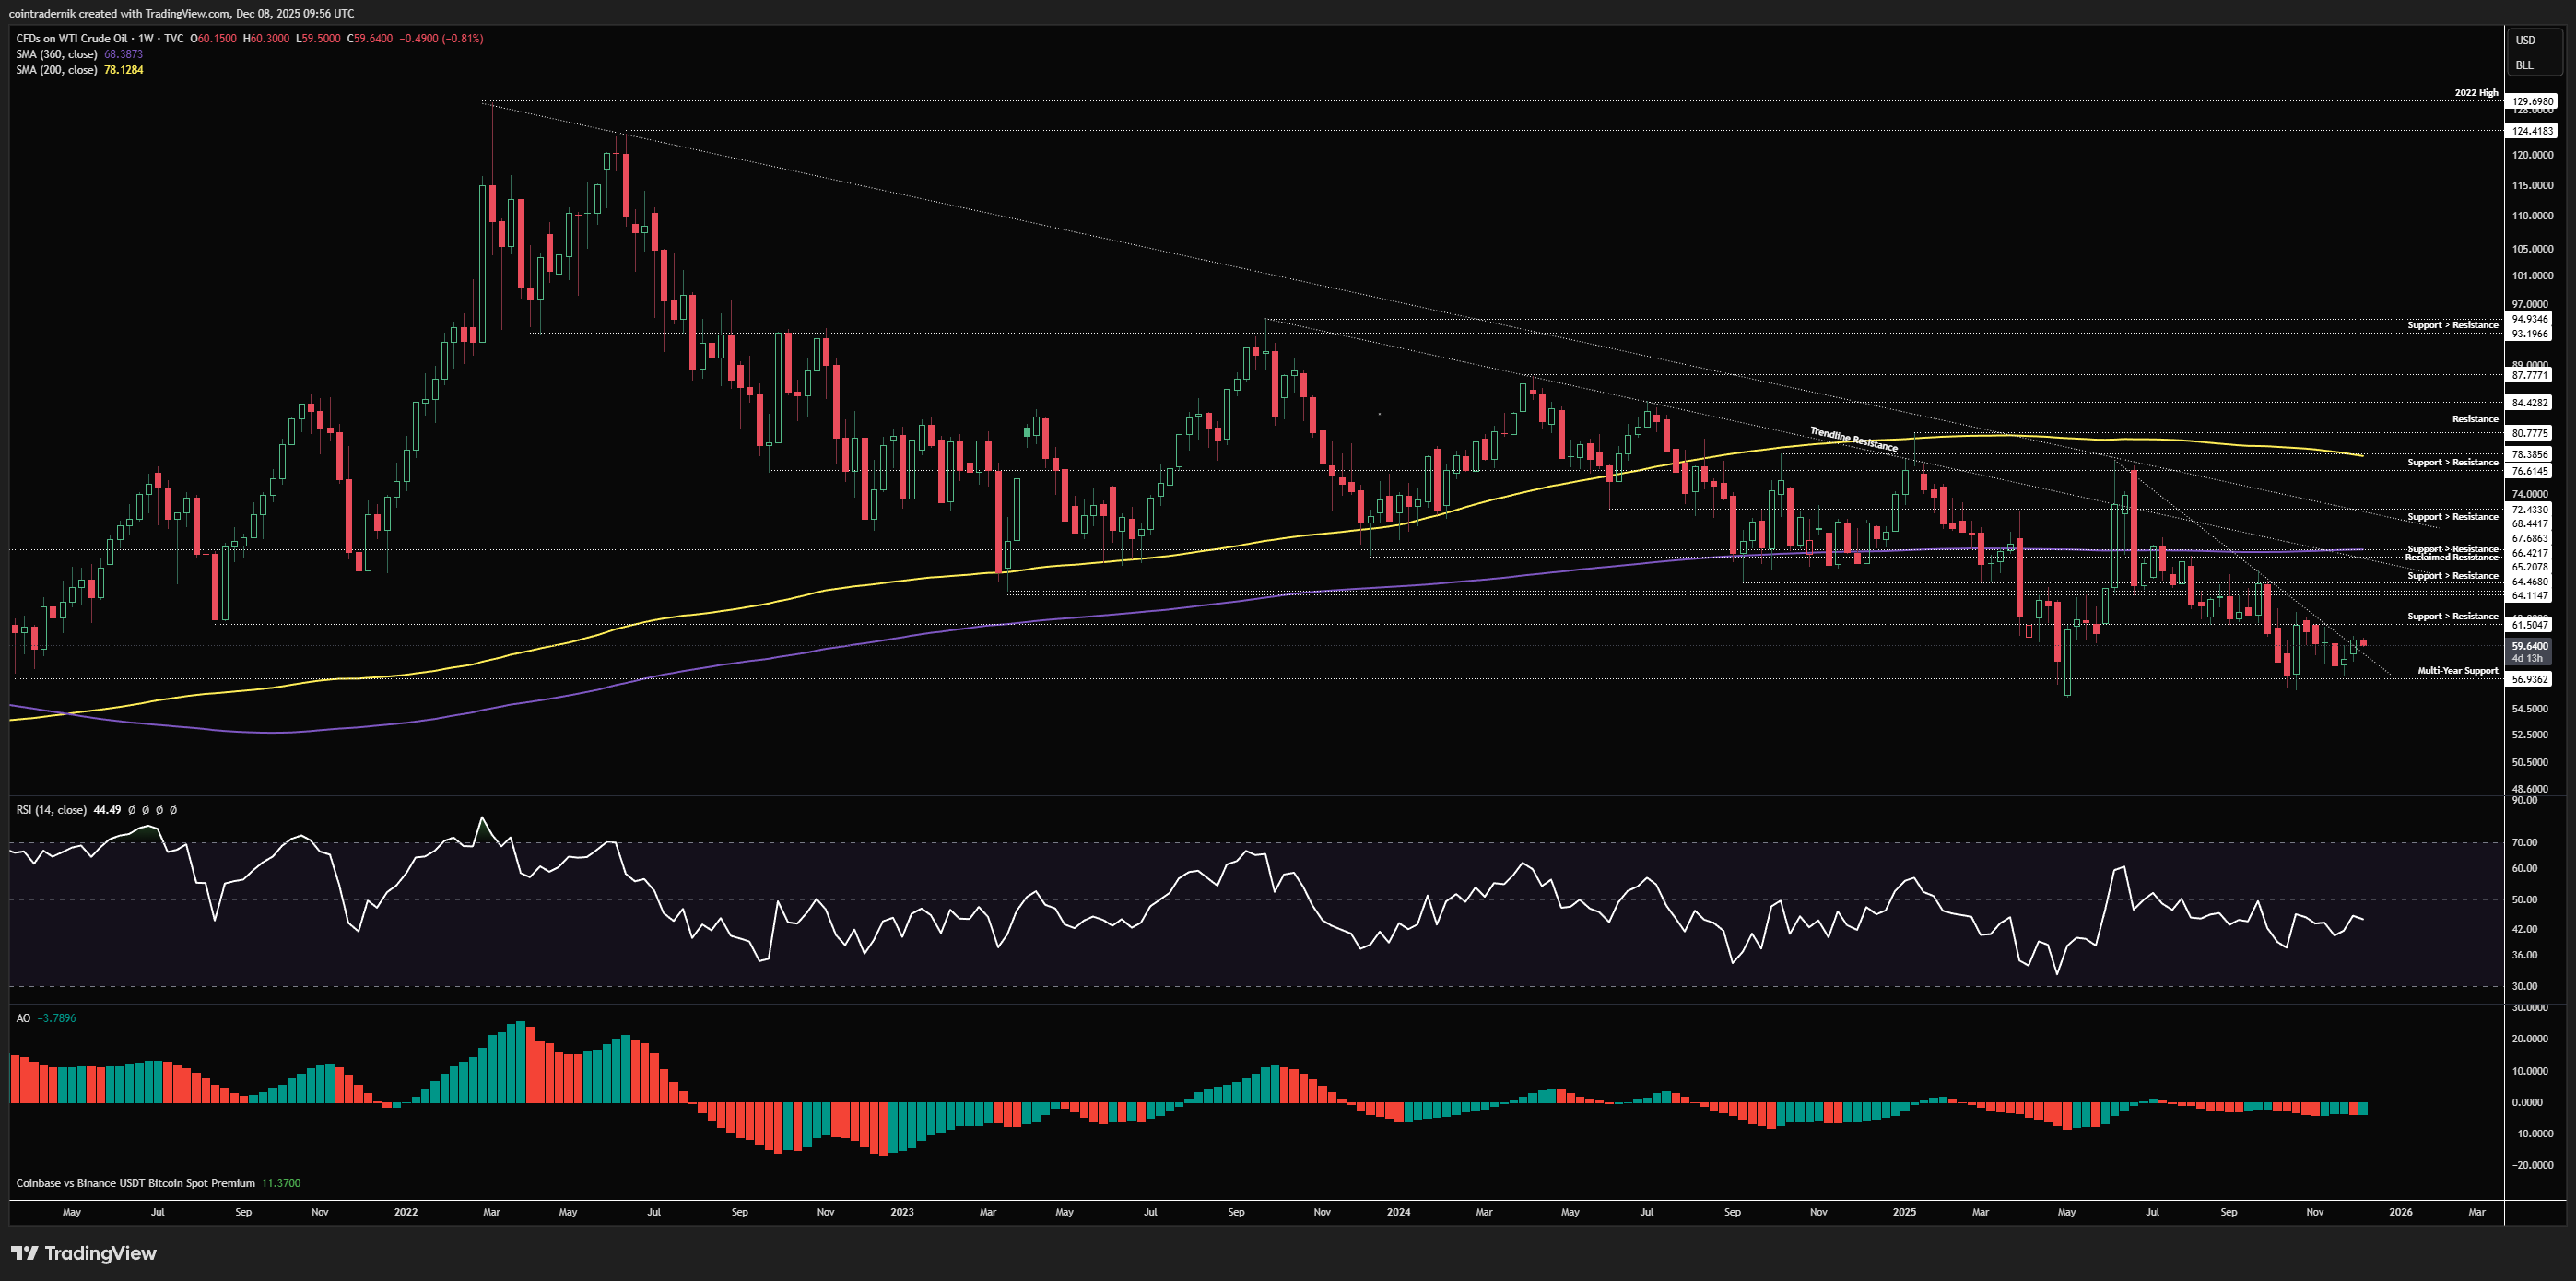
Beginning with the weekly view for Crude Oil, we can see that price is basing right around multi-year support holding above that key $57 level that has basically capped the downside since 2021. We wicked below the level a couple of months ago and then formed a higher-low above it and as of last week marginally broke above trendline resistance from the summer highs. I would expect to see some continued chop here but if we can flip $61.50 into support, we have weekly structure shifting bullish from higher-timeframe support and I would then expect to see Crude push towards that first trendline around $65, where I think there will be significant resistance on the first test. Generally, I think oil price-action is going to be very choppy from here into Q1 unless we break and close below that multi-year support, below which we can start looking at shorts being favourable for further downside.
Daily:
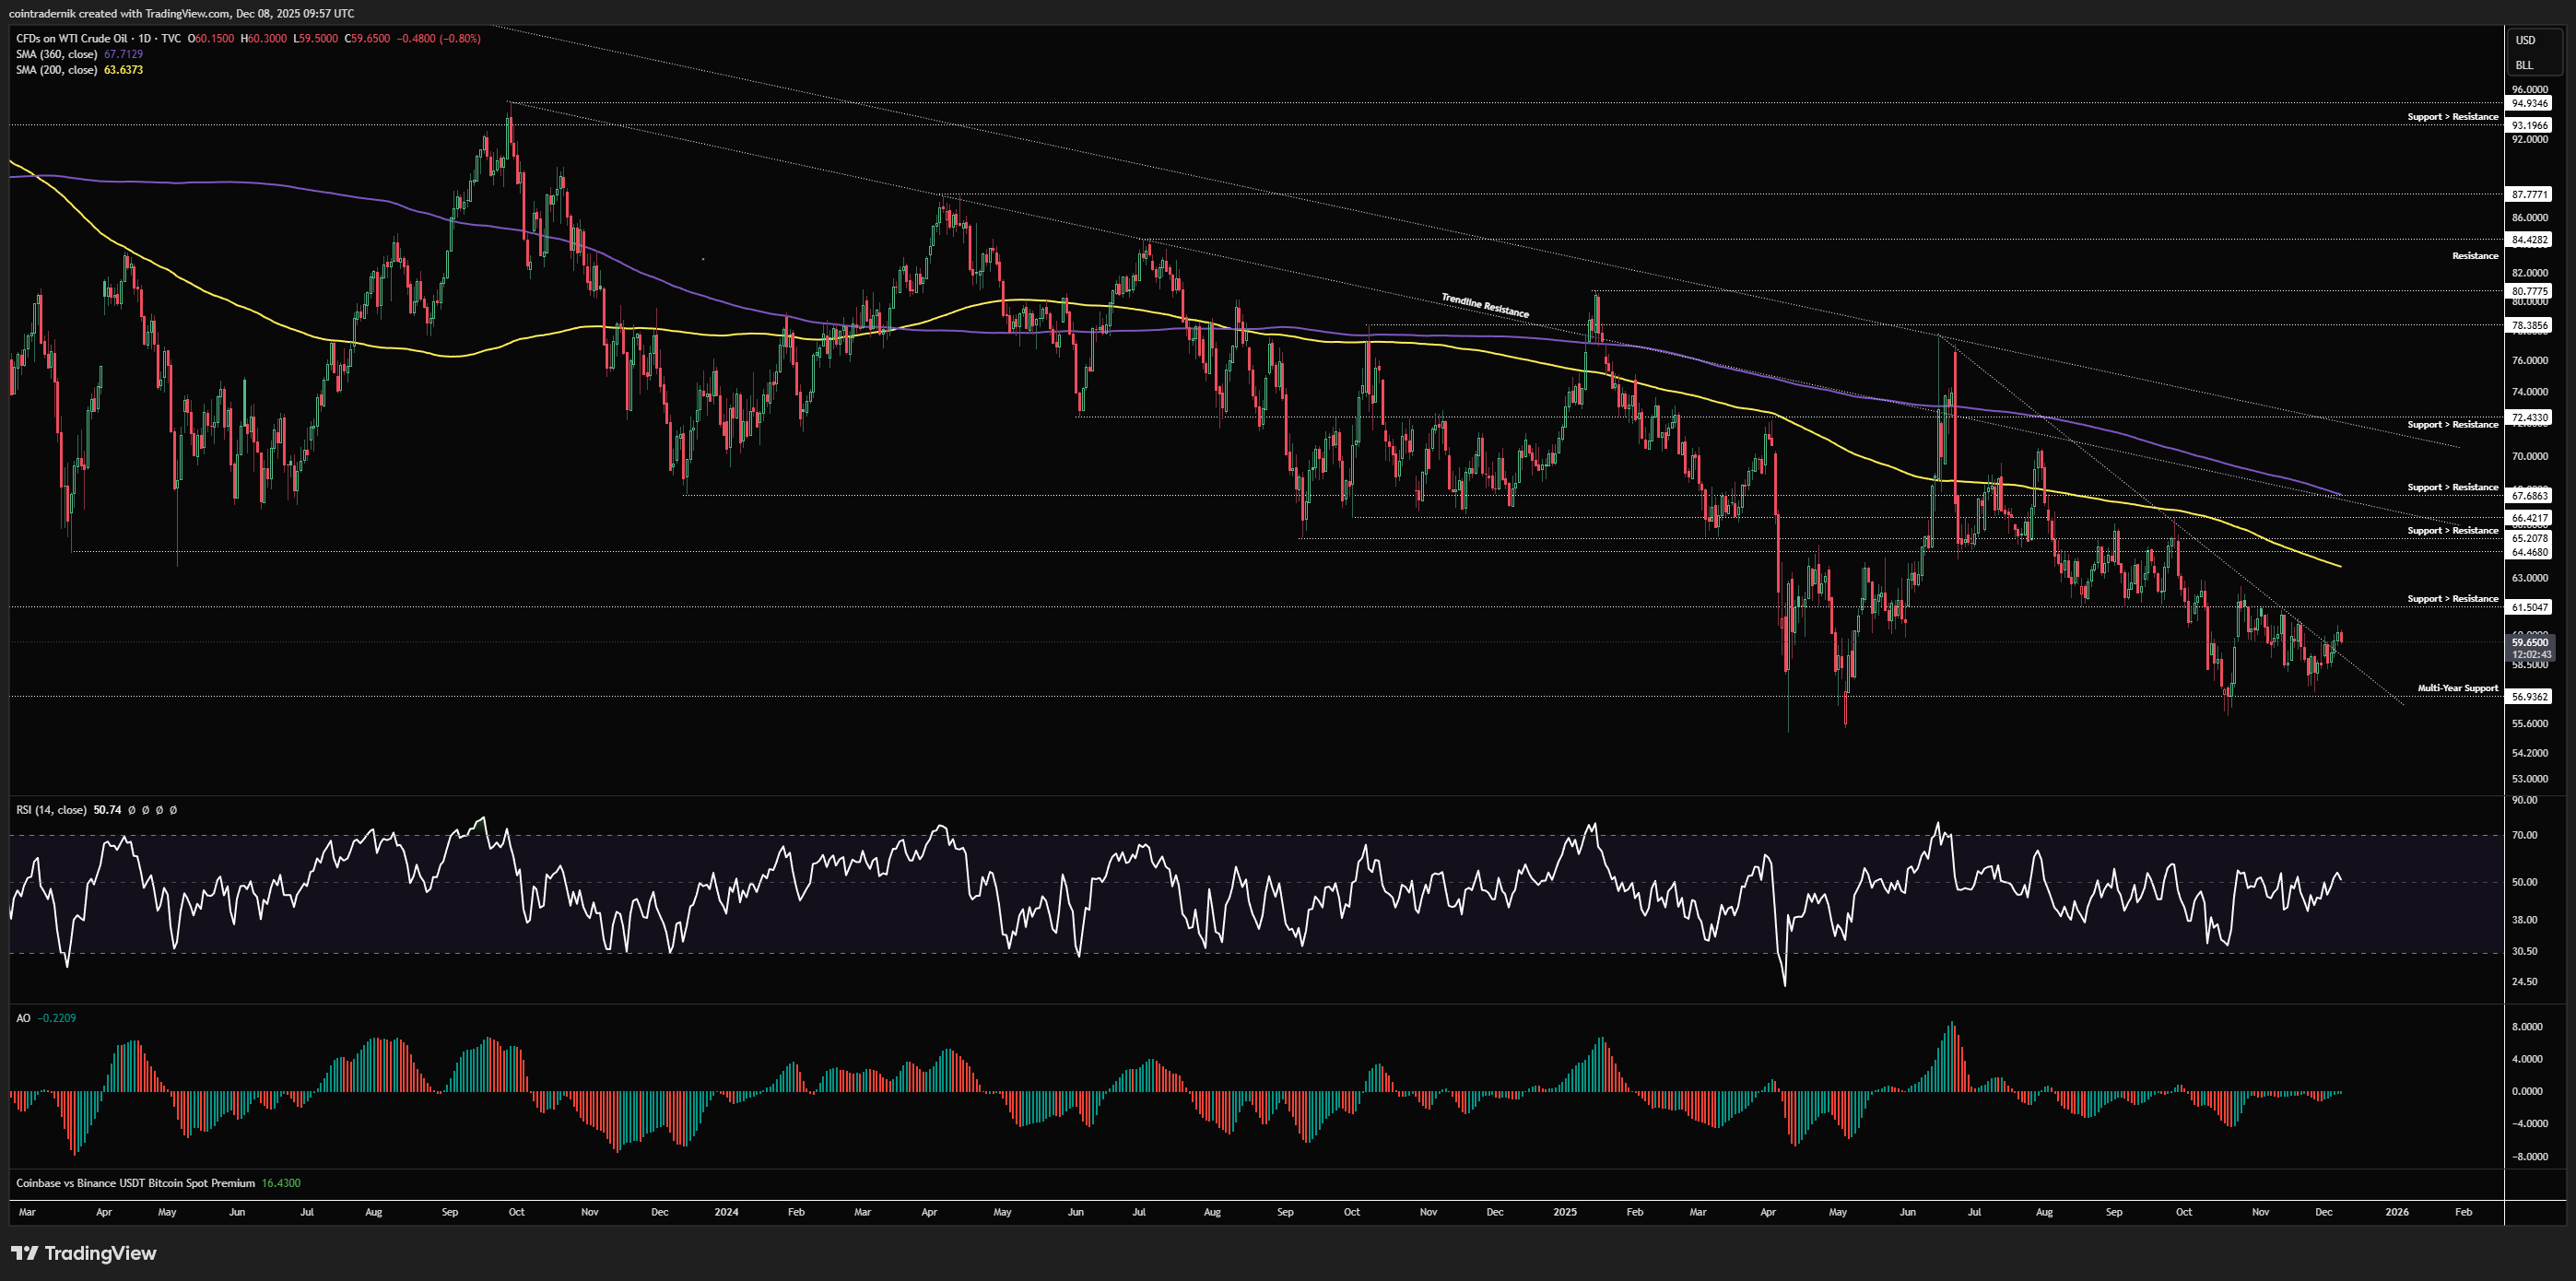
Finally, turning to the daily, we can see that momentum is very choppy around here and whilst we do have that higher-low formation above $57 and the subsequent trendline breakout, we still have bearish structure on the daily, which is why I wouldn't rush into any longs here. I would want to see buyers continue to step in here, because it could be a false breakout before a break lower below that key support (which itself would be a nice setup if we see it develop). If we can find a floor here this week and then break and close above $61.50, I'd look for intraweek pullbacks the following week for longs into that $65 area into January. Not much else to add here for now....
I hope you've found some value in the read this week!
And if you've not already signed up for Ostium, please do so and test out some of the recent updates, including:
Sign up here (you don't have to use my ref link, of course): https://ostium.app/trade?from=CL&to=USD&ref=CTNIK

.avif)