

Market Outlook #61 - Single Stocks
November 24, 2025
-
12
min read


This blog references an opinion and is for entertainment and informational purposes only. It is not intended to be investment advice. Seek a duly licensed professional for investment advice.
In this 61st Market Outlook here at Ostium Research, I'll be doing something a little different this week, providing analysis on a number of single-stock names directly tradable on-chain here at Ostium, including NVDA, MSFT, GOOG, TSLA, MSTR, COIN and GLXY.
Later this week - likely on Wednesday - I will also be publishing the standard weekly Outlook, looking at where we are at as we move towards the November close on BTC, ETH, DXY, Gold and SPX...
Firstly, let's take a look at the calendar, which is stacked into Wednesday with growth and inflation data:
MONDAY: VARIOUS ECB SPEECHES
TUESDAY: US PRODUCER PRICE INDEX EX FOOD & ENERGY (YOY) (SEP): (CONSENSUS N/A VS PREVIOUS 2.8%)
TUESDAY: US ADP EMPLOYMENT CHANGE: (CONSENSUS N/A VS PREVIOUS -2.5K)
TUESDAY: US RETAIL SALES (MOM) (SEP): (CONSENSUS 0.4% VS PREVIOUS 0.6%)
WEDNESDAY: RBNZ INTEREST RATE DECISION: (CONSENSUS 2.25% VS PREVIOUS 2.5%)
WEDNESDAY: US DURABLE GOODS ORDERS (SEP): (CONSENSUS 0.2% VS PREVIOUS 2.9%)
WEDNESDAY: US CHICAGO PMI (NOV): (CONSENSUS N/A VS PREVIOUS 43.8)
WEDNESDAY: US INITIAL JOBLESS CLAIMS: (CONSENSUS N/A VS PREVIOUS 220K)
WEDNESDAY: FED'S BEIGE BOOK
THURSDAY: TOKYO CPI (YOY) (NOV): (CONSENSUS 2.7% VS PREVIOUS 2.8%)
Now, let's dig into asset-specific price-action for the week ahead, looking firstly at NVDA:
Price: $178.88
Weekly:
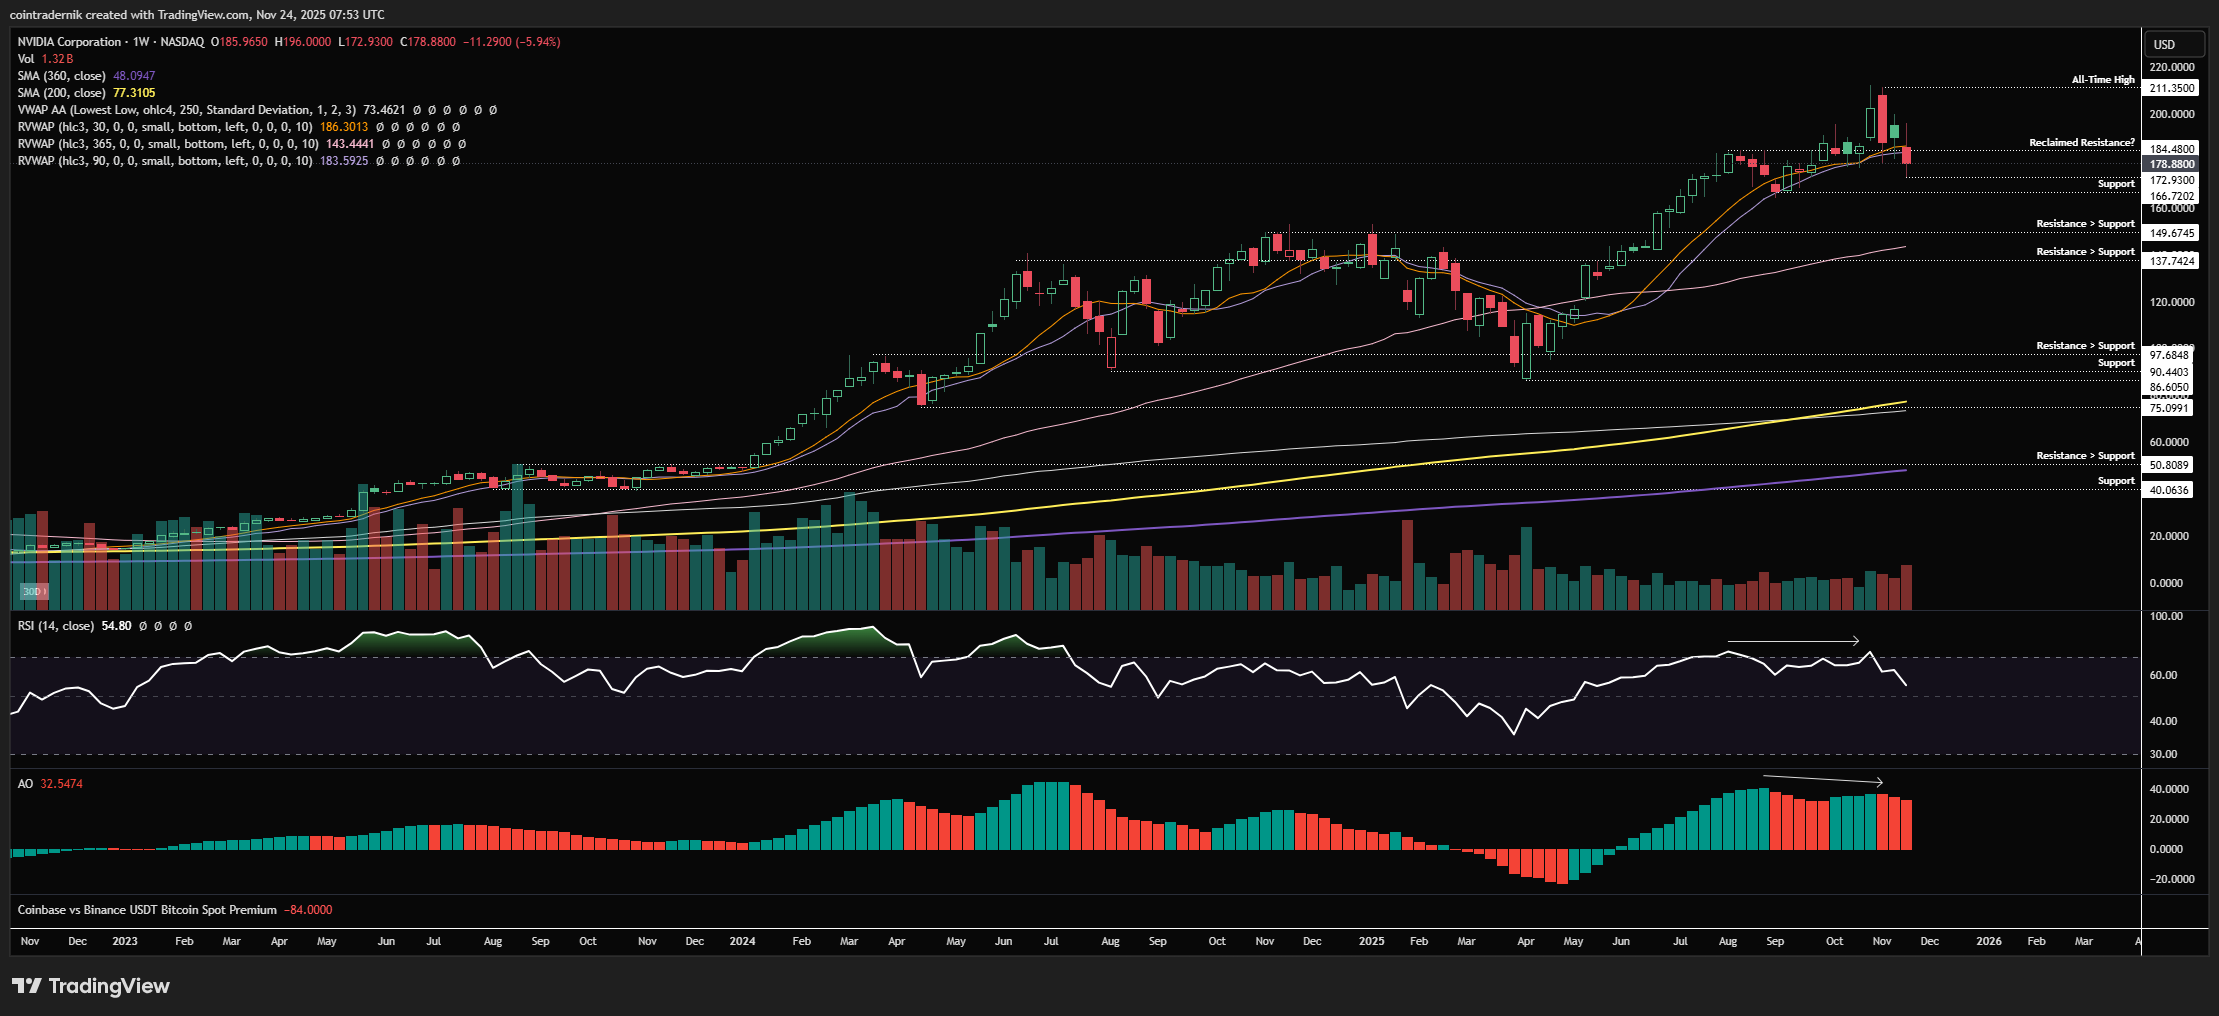
Beginning with the weekly for NVDA, we can see that price rejected all-time highs at $211 a couple of weeks ago and broke lower, selling off into prior resistance at $184.48, bouncing and then rejecting to close back below that level last week despite the positive earnings report. We have marginal bearish divergence into the highs and the break and close back below a key level last week suggests lower prices from here, but we do still have bullish structure whilst the swing-low at $166.72 is held above. I think this week is massive for NVDA off the back of the post-earnings volatility, especially into month-end: if NVDA can shake off the initial rejection, mark out a higher-low here above $166 and close the month back above $185, last week then looks like a particularly nasty bear trap before continuation higher to fresh highs; if, instead, we see price reject $185 as resistance this week and push below last week's low, I do not think $166 holds and we likely get another leg lower into that major resistance turned support level at $150, which would be confluent with the 365d rolling VWAP and where I would look for fresh long setups.
Daily:
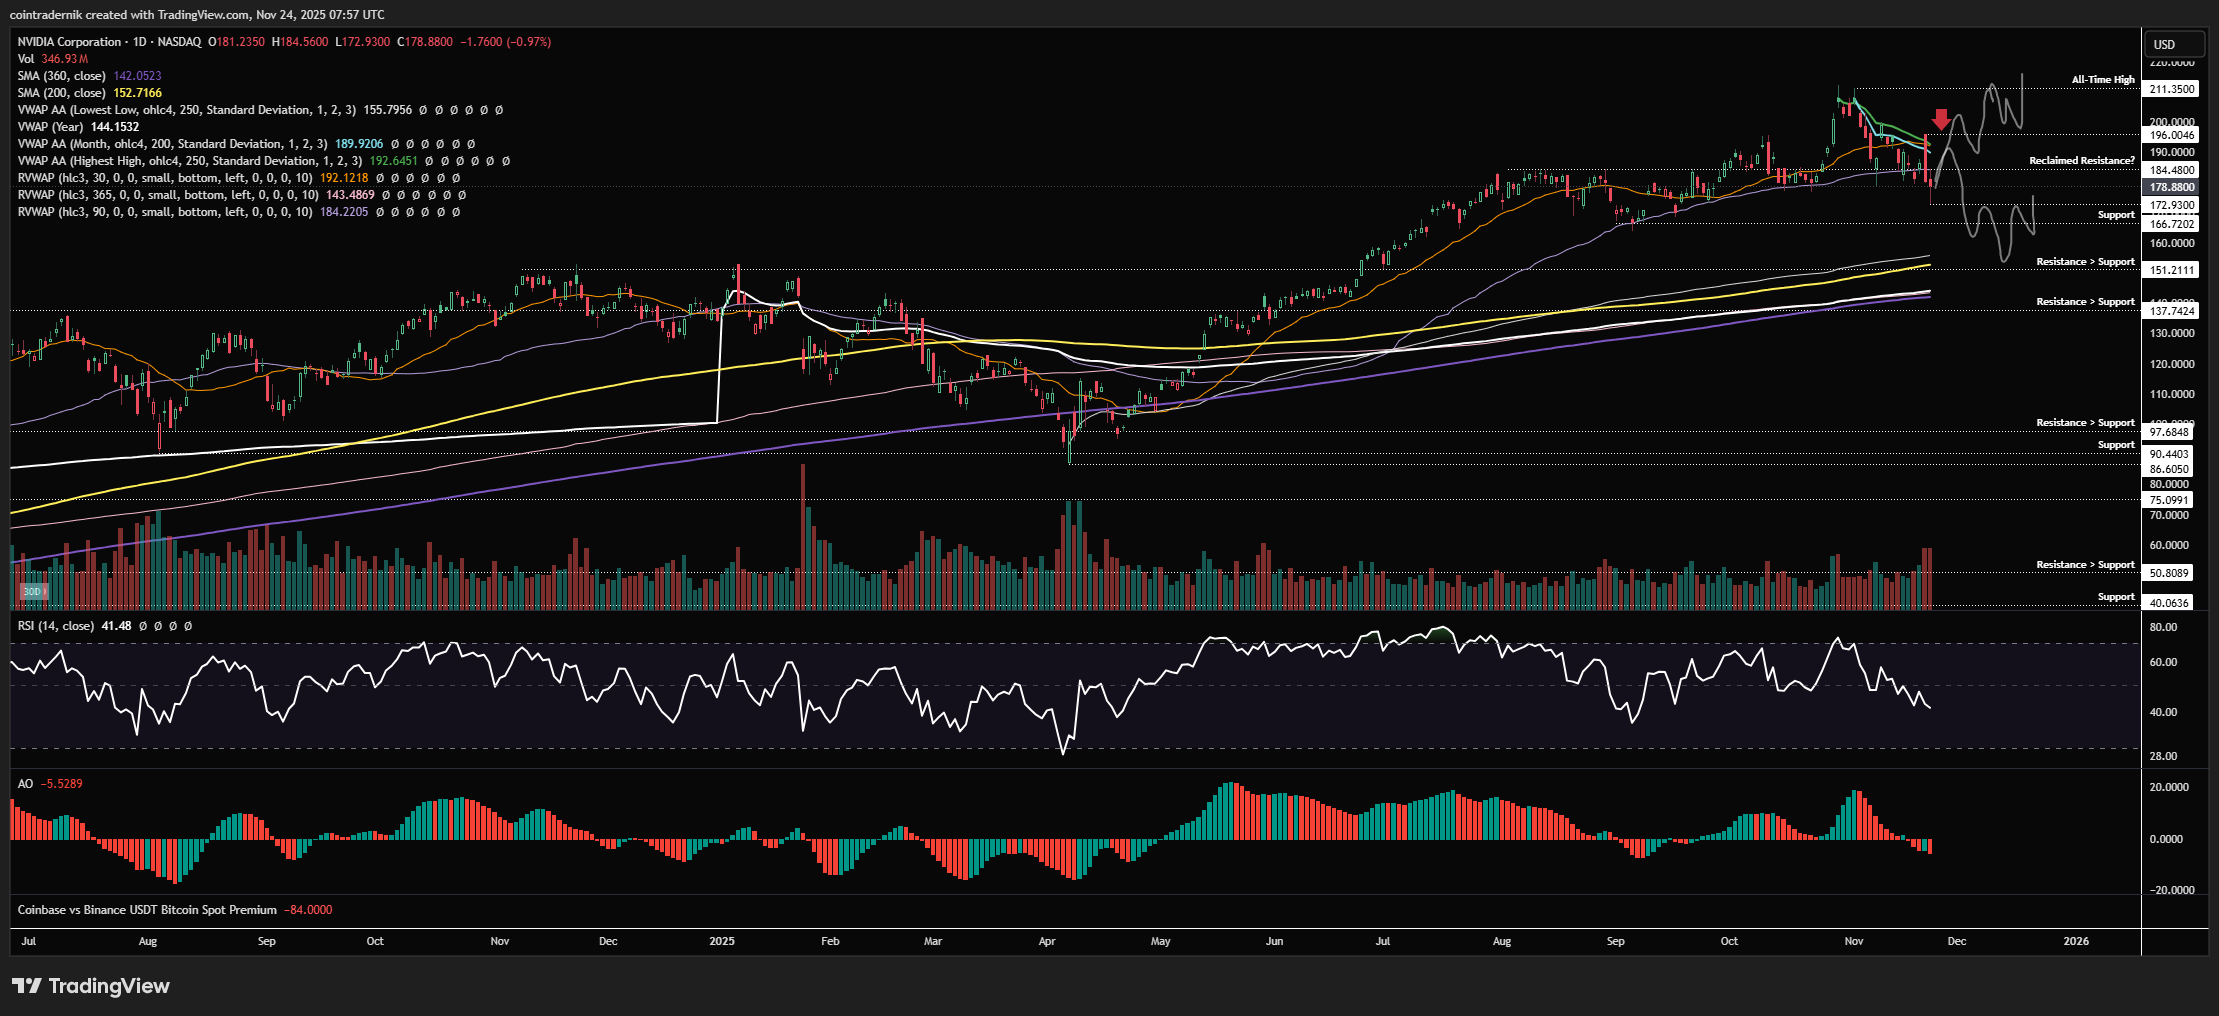
On the daily timeframe, I have marked out these two trajectories, where last week's post-earnings high is a huge level to overcome, particularly as it is confluent with the anchored VWAP from all-time highs. If the Friday low holds and we push back above $185 early this week, we should see that Thursday high retested, where rejection below the VWAPs and a push back below $185 (which is also confluent with the 90d rolling VWAP that marked all the recent lows) would be very bearish and lead to that $150 area being retested as support, where there is a lot of confluence for a durable low to form. If, instead, we do not reject below $196 and instead close the daily above that high, we should see a higher low form above $185 that then leads to continuation beyond the $211 all-time high into year-end.
Price: $472
Weekly:
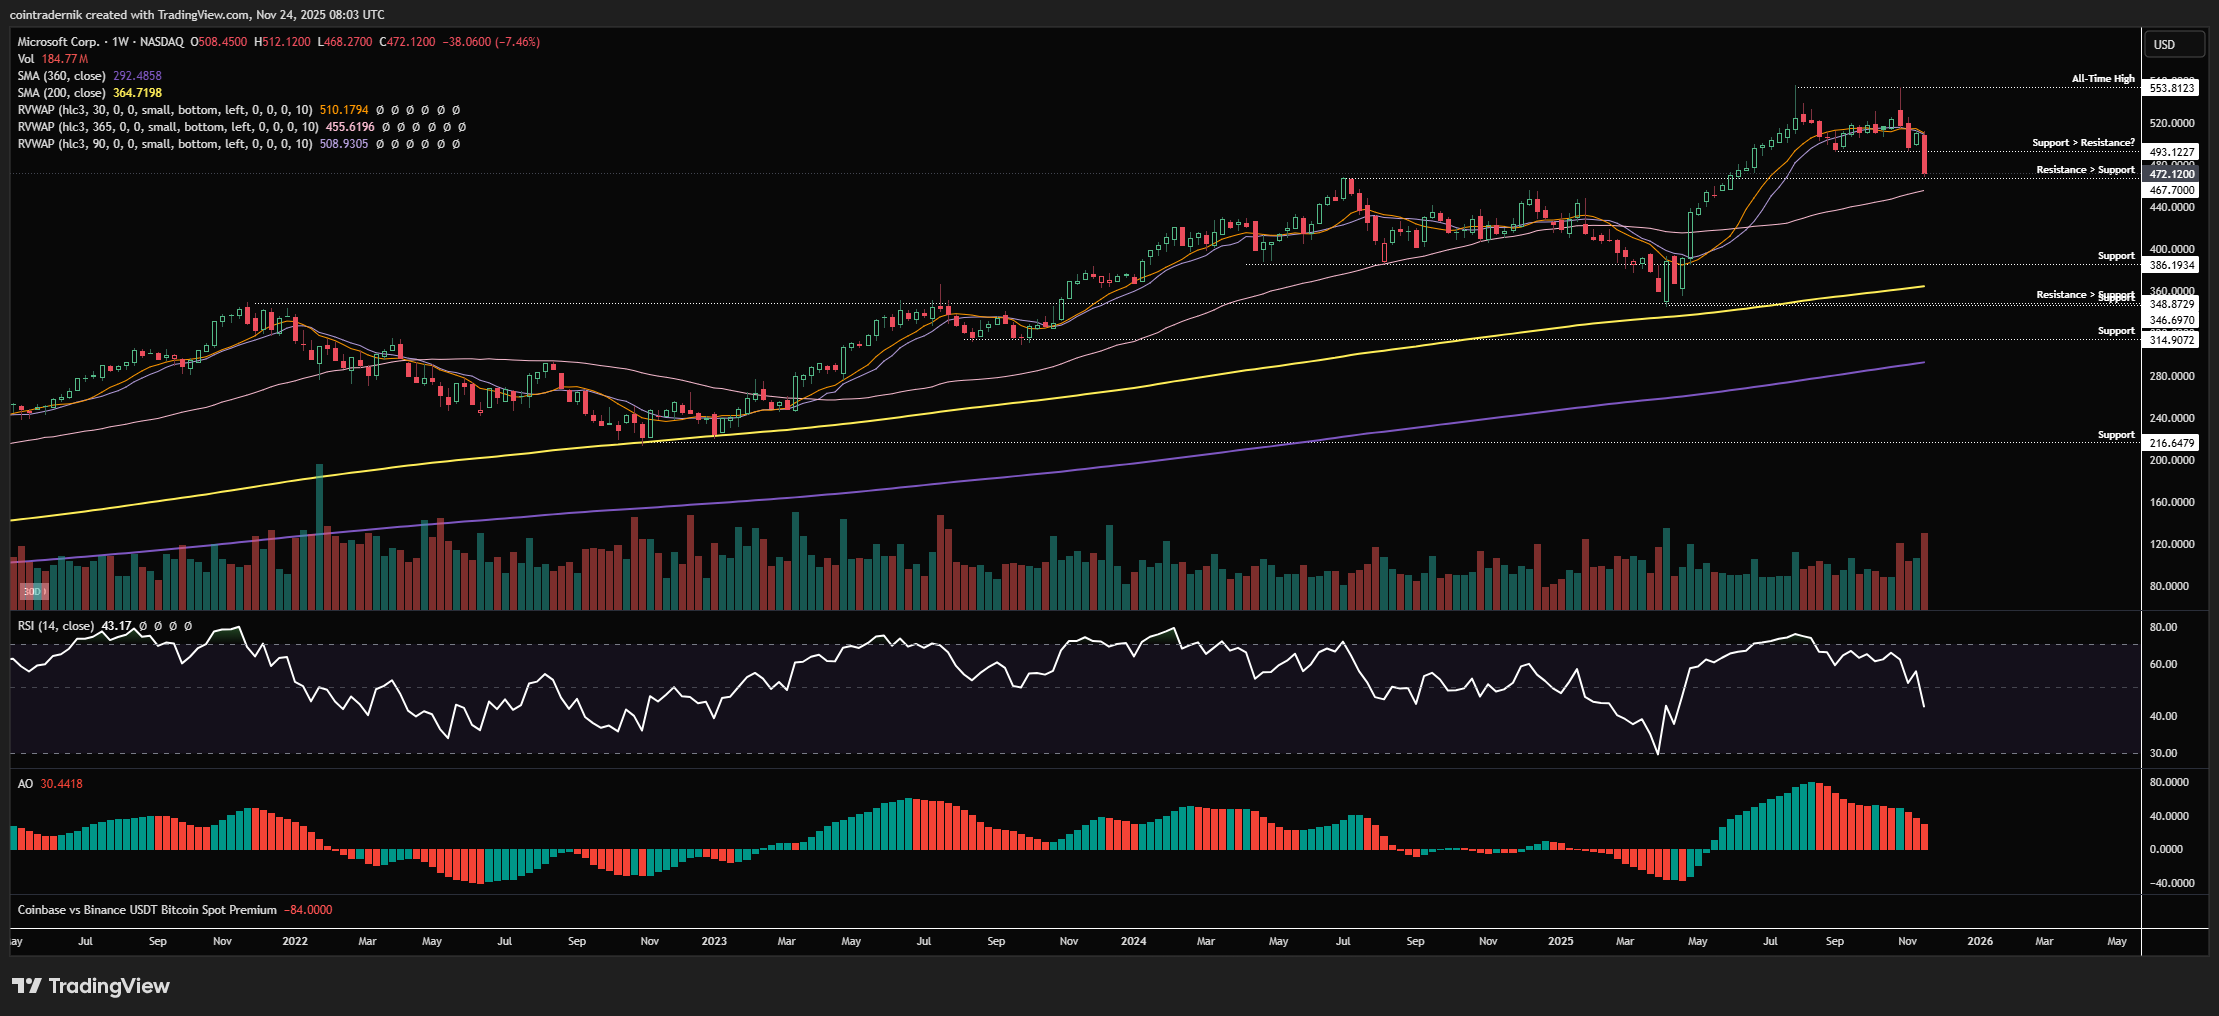
Beginning with the weekly for MSFT, we can see that price printed a double top into $553 and rejected a few weeks ago, selling off through support at $493 to turn (internal) weekly structure bearish as of last week, where price closed at the lows of $472, marginally above prior resistance at $467. Momentum is bearish here on this timeframe but we are trading right into support with the 365d rolling VWAP below, so I don't think shorts right here are favourable. If we flipped $467 into resistance, you could look for shorts back towards $386 as major support above that April low. If this week sees price bounce off this support and reclaim $493 into the monthly close, things look a little better for continuation higher but this is not one of the stronger setups among the tech names.
Daily:

Looking at the daily, we have bearish structure and bearish momentum, with daily RSI as low as the April tariff lows and the yen carry unwind low. This has tended to historically precede a bounce and given the confluence of support below, I would be more interested in taking longs if we flushed last week's low into the yearly VWAP and 365d rolling VWAP around $460, for a move back into $494ish. The beauty of this setup would be the ability to flip bias if you're stopped, because we would then be looking at shorts on a retest of $457 from below back into at least a gap fill above $386.
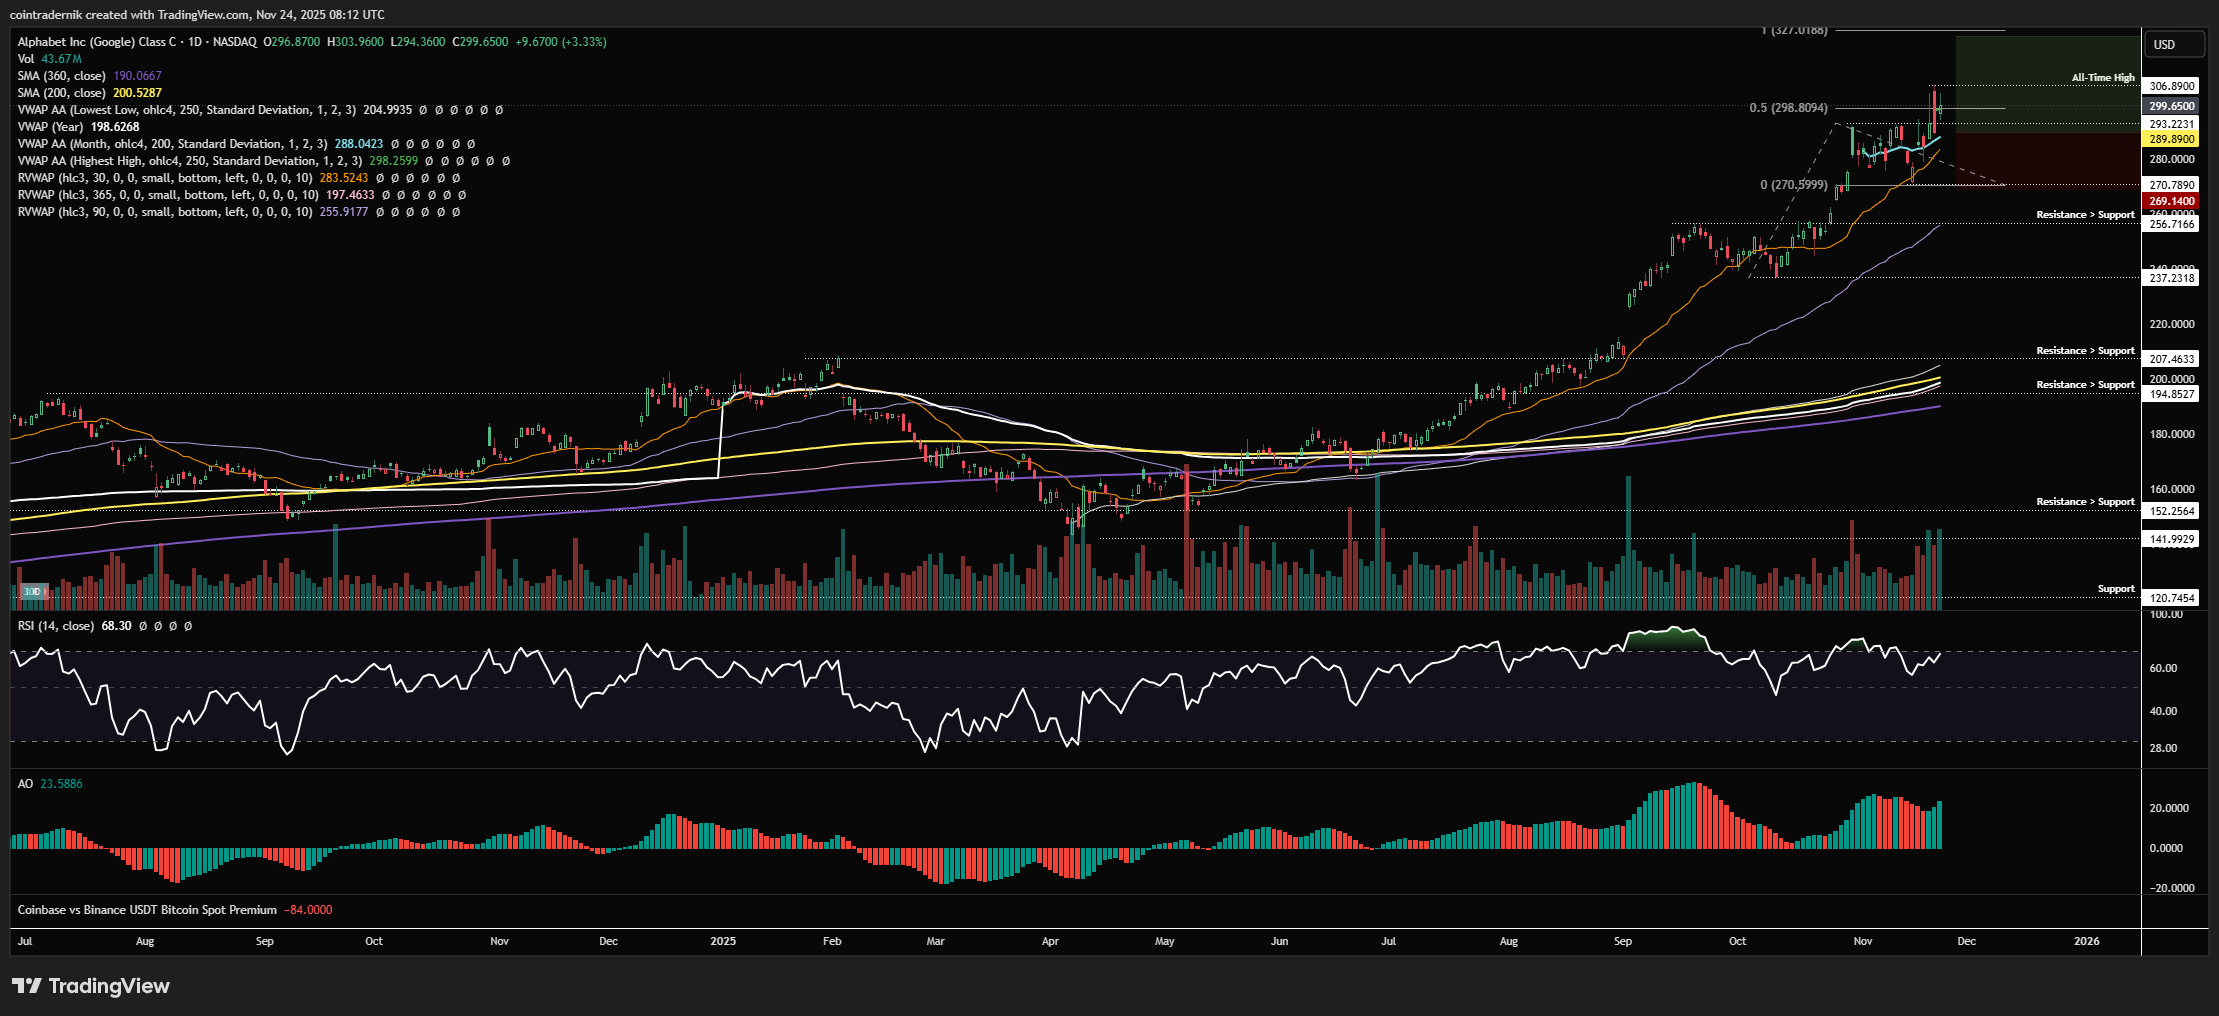
Price: $299.65
Weekly:
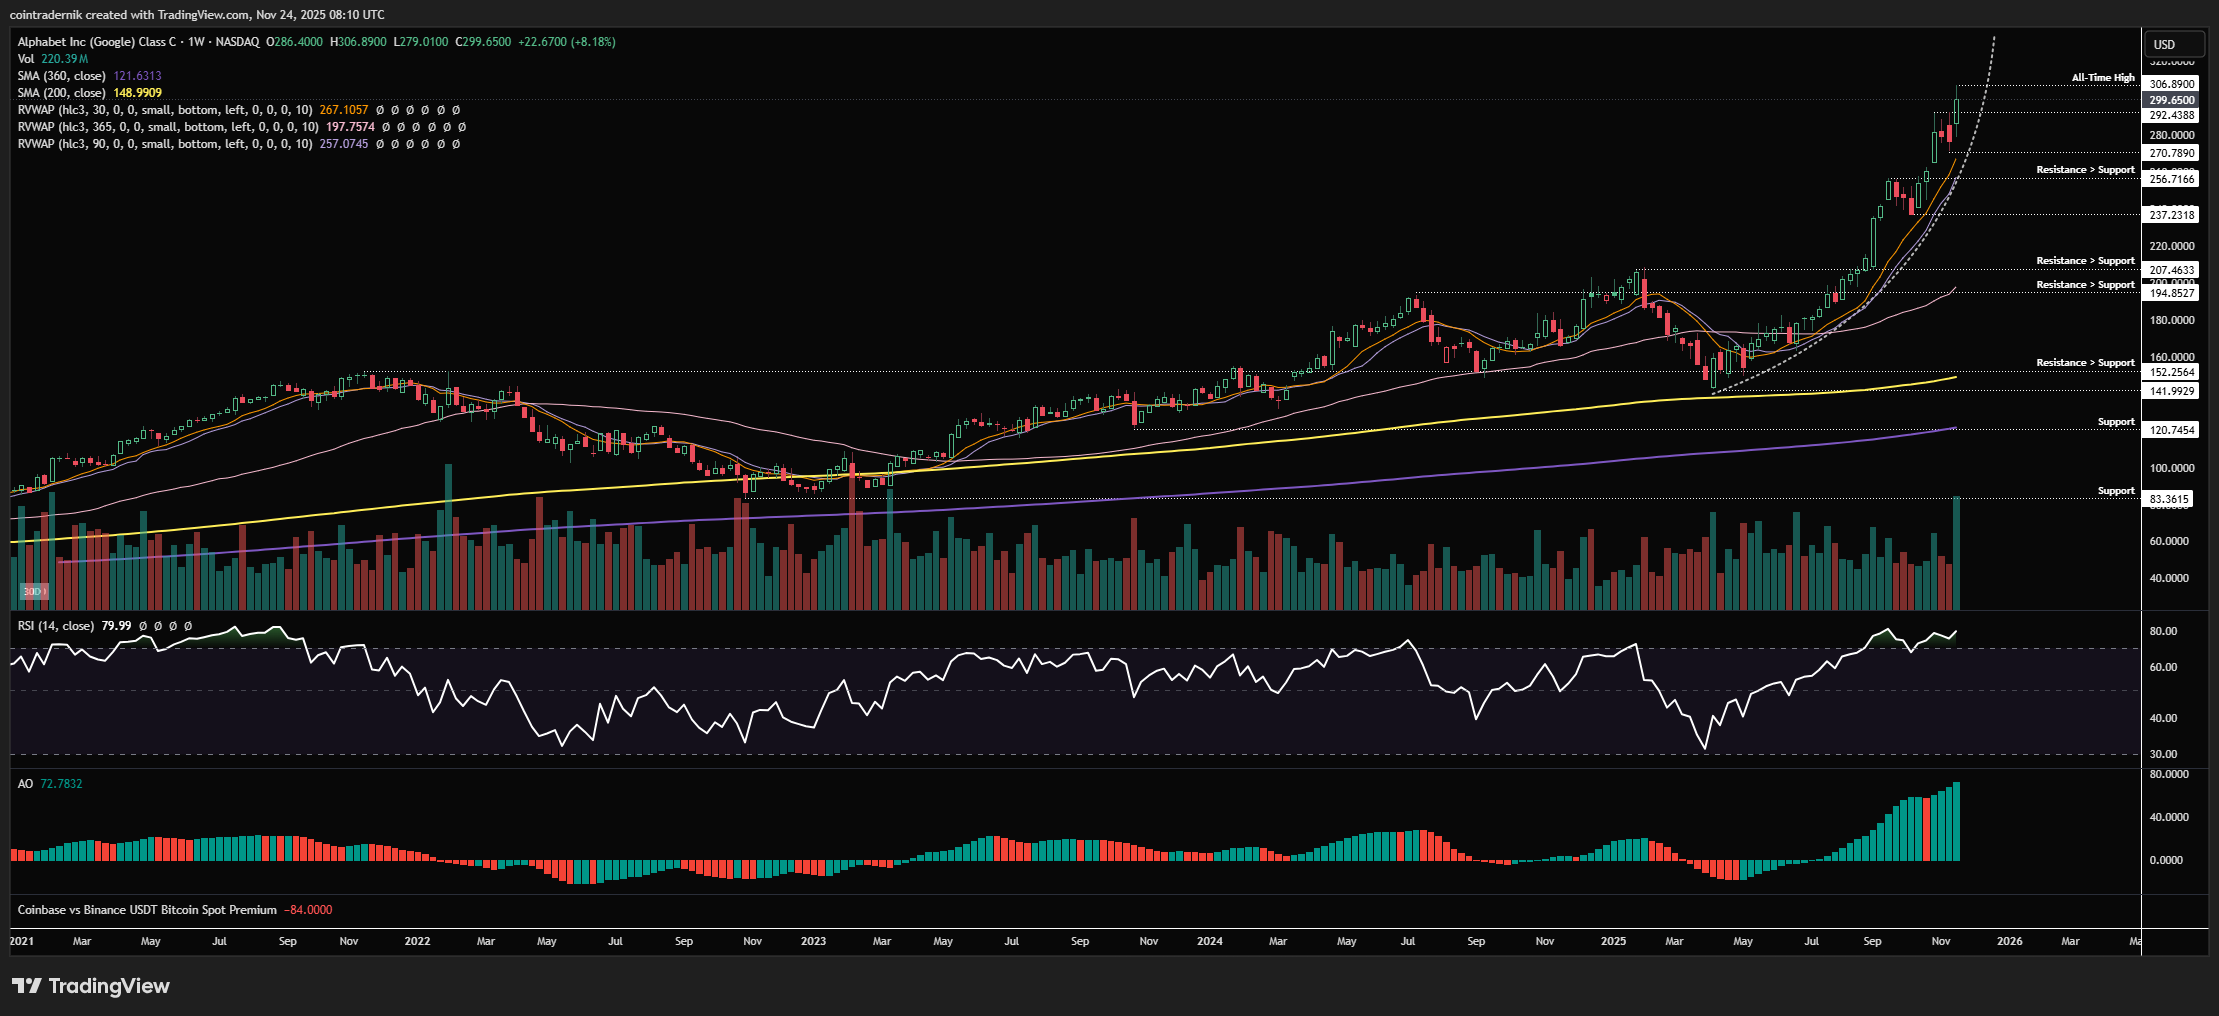
If we begin by looking at GOOG on the weekly, we can see the parabolic ascent since the post-Liberation Day lows, with the 30d rolling VWAP holding as support and forming all-the higher-lows on the way up, include the week before last at $270.78. We then pushed off that low last week to close at fresh highs above $292, rejecting marginally below $307 on the highest weekly volume since 2023. Momentum is bullish across RSI and AO with no signs of trend exhaustion here, and this likely continues to be an outperformer amongst outperforms until we see some momentum divergence appear. If we trade back into $292 this week, that could be a nice buy-the-dip area with clear invalidation on a loss of the 30d rolling VWAP with a view to ride this into price discovery.
Daily:
I have marked out this potential setup here on the daily, where we had some momentum exhaustion into $293 but invalidated that after forming the swing-low at $271 and pushing to new highs. We now want to see $290ish act as resistance turned support, so a sweep of the Friday inside day low into that support and the monthly VWAP would be a nice entry with $269 as the stop and the 100% extension of the trend the TP up near $327. Pretty clean structure here with a tight invalidation - you could even cut on a daily close below $283 for a partial loss as it would look more like a fakeout above the highs if we start accepting below that 30d rolling VWAP and the monthly VWAP.
Receive the latest updates directly to your inbox

Price: $391.09
Weekly:
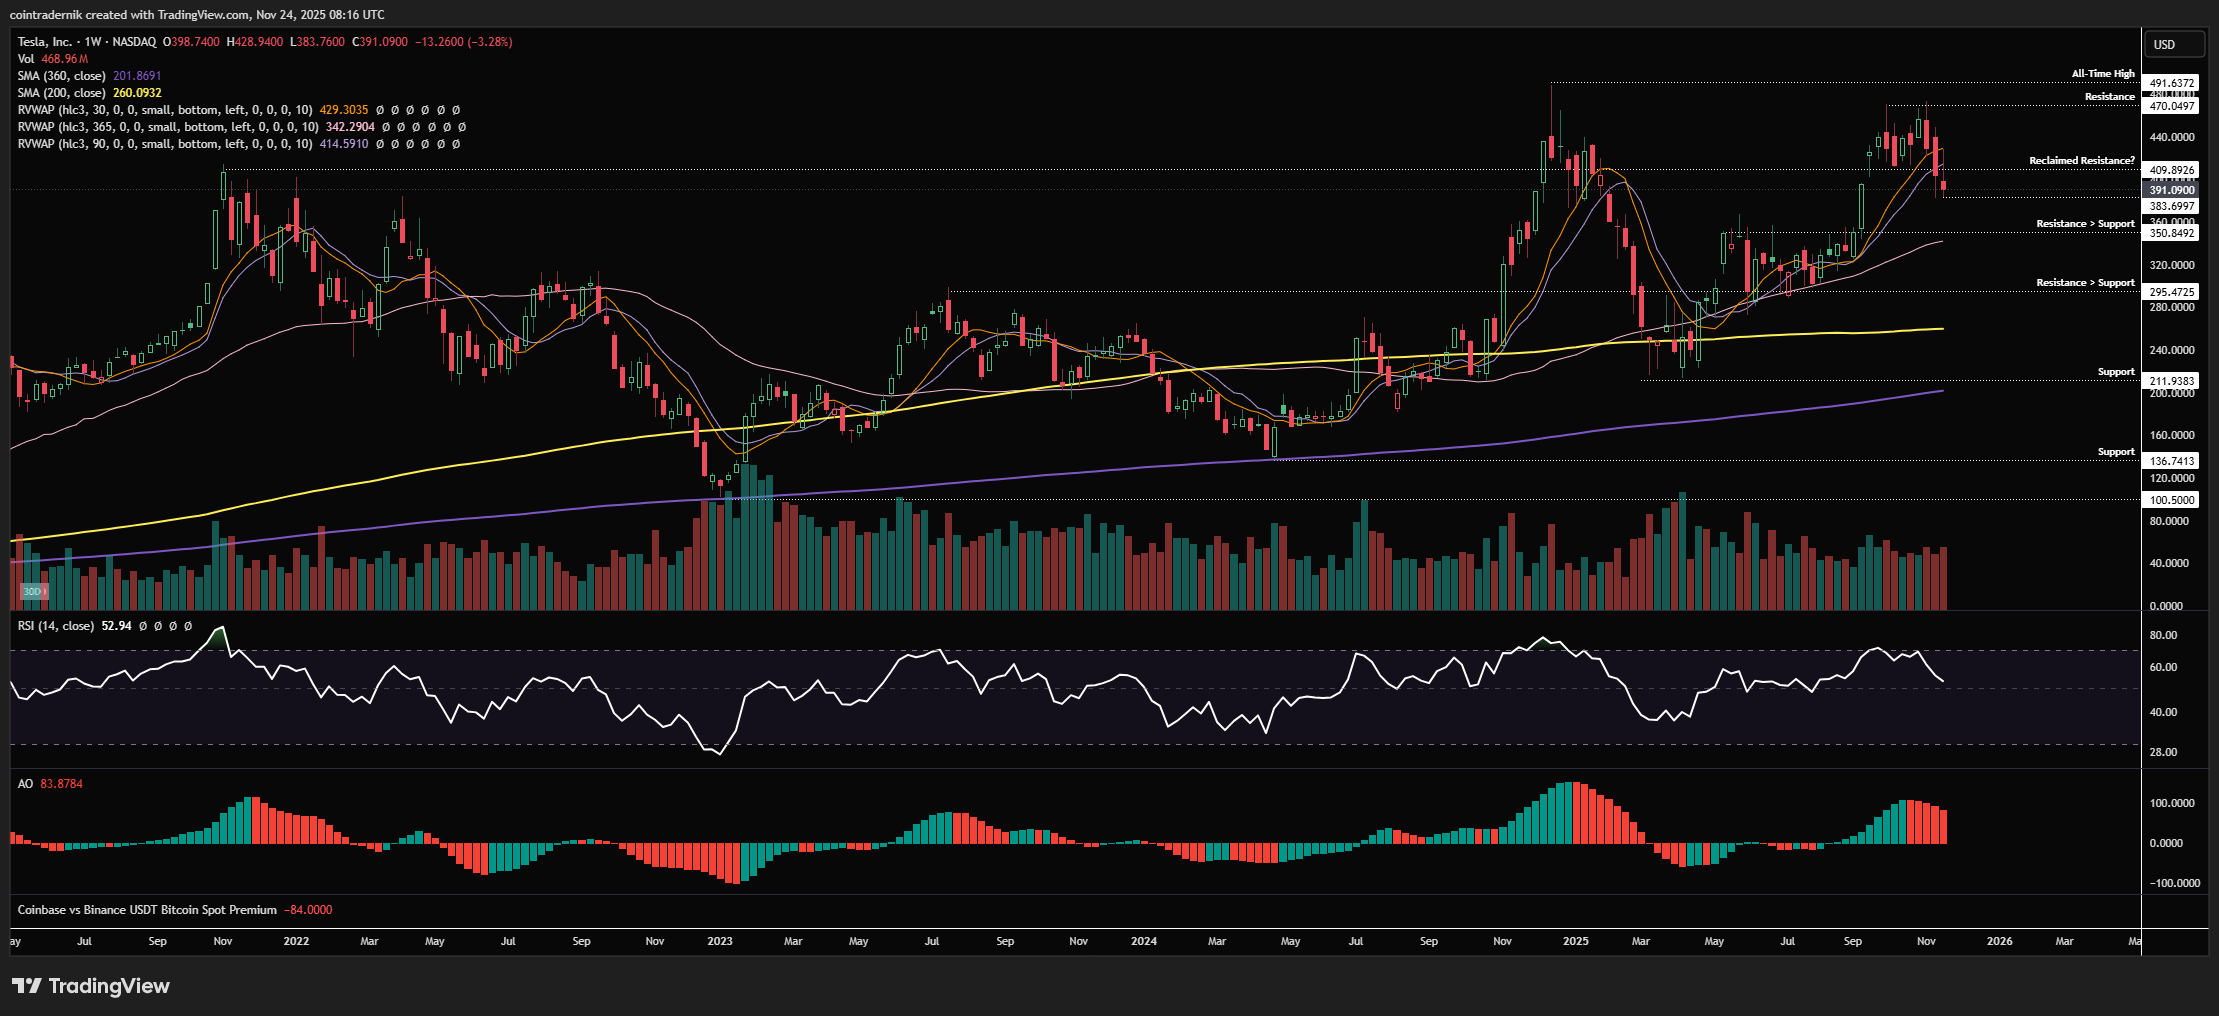
Beginning with the weekly for TSLA, we can see that price rejected below its all-time highs of $491 in September at $470, then wicked above that high a couple of weeks ago and rejected again, closing with a bearish engulfing that led to a break and close back below the 2021 highs at $410. We then wicked back above that level last week and rejected again, reclaiming it as resistance, with price now in no man's land between overhead resistance and the next support at $350. I wouldn't be looking to take any trades right here, to be honest, but if we go that next leg lower into $350 then there is plenty of confluence for demand at that level, at least for a bounce. If we reclaim $410 this week and close the monthly above it, there is a non-zero chance that the move below the level has been a bear trap, though there is nothing particularly clean here with high R/R for longs unless we move lower, at least not right now. We could look for shorts this week into that leg lower if the setup presents itself, but let's look at the daily timeframe for clarity on this...
Daily:
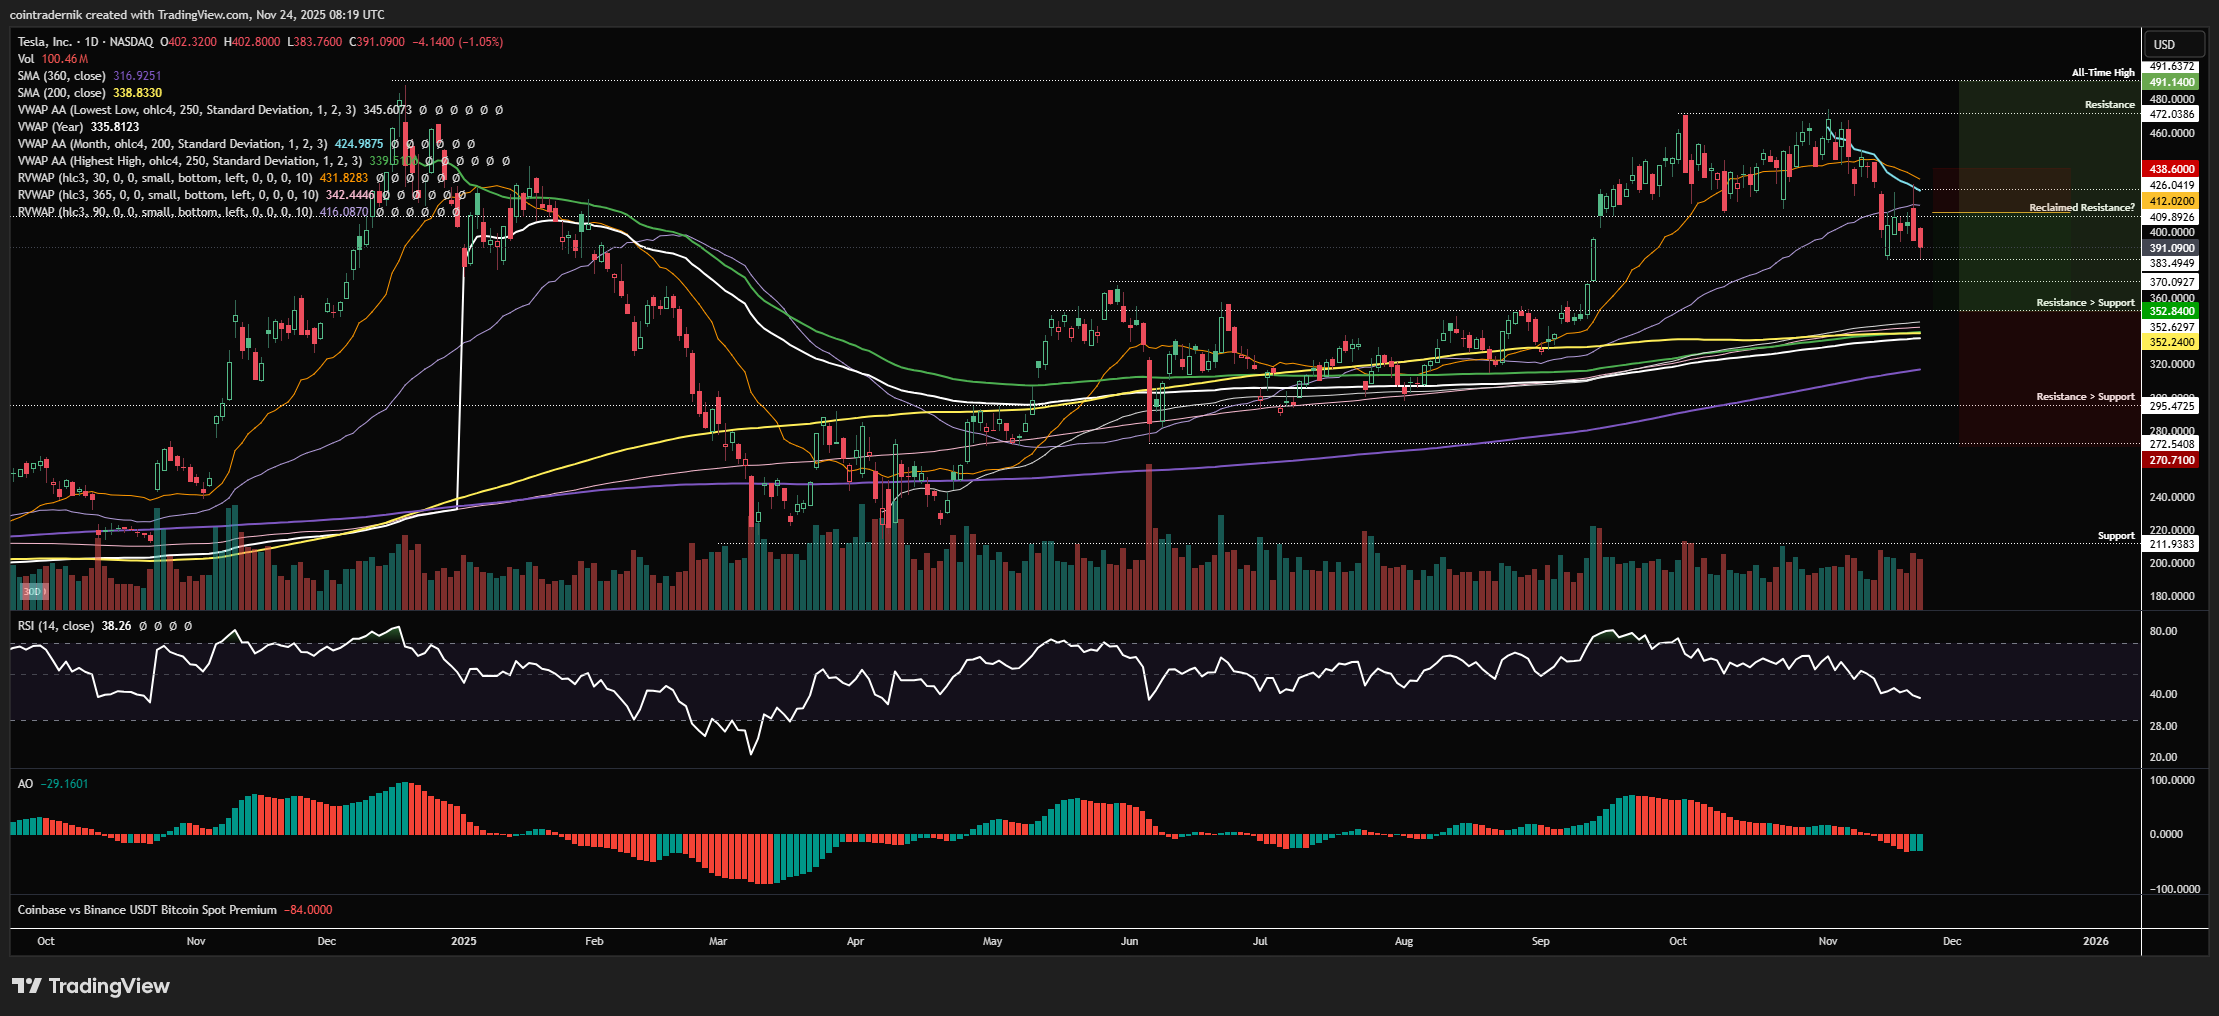
On the daily, we can see how price has been rejecting right around the monthly VWAP on pushes higher and has flipped the 30d and 90d rolling VWAPs into resistance, with momentum showing no signs of exhaustion as of yet. As such, if we pop higher early this week back into $410, you could take that short with a stop above the 30d rolling VWAP, looking for a move into that confluence of support around $350, which is a really nice R/R setup, especially since if you are stopped it is likely because we're reclaiming bullish structure and the trend has shifted back towards a bullish bias, thus we could then look for longs back to the highs from there (kinda the inverse of the MSFT setup). If we do get the leg lower into $350, that's absolutely where I would be looking for long setups, especially since we are still in a long-term uptrend from the April lows and therefore the June low at $270 should hold - this could be a nice area for a swing-long back into all-time highs next year...
Price: $170
Weekly:
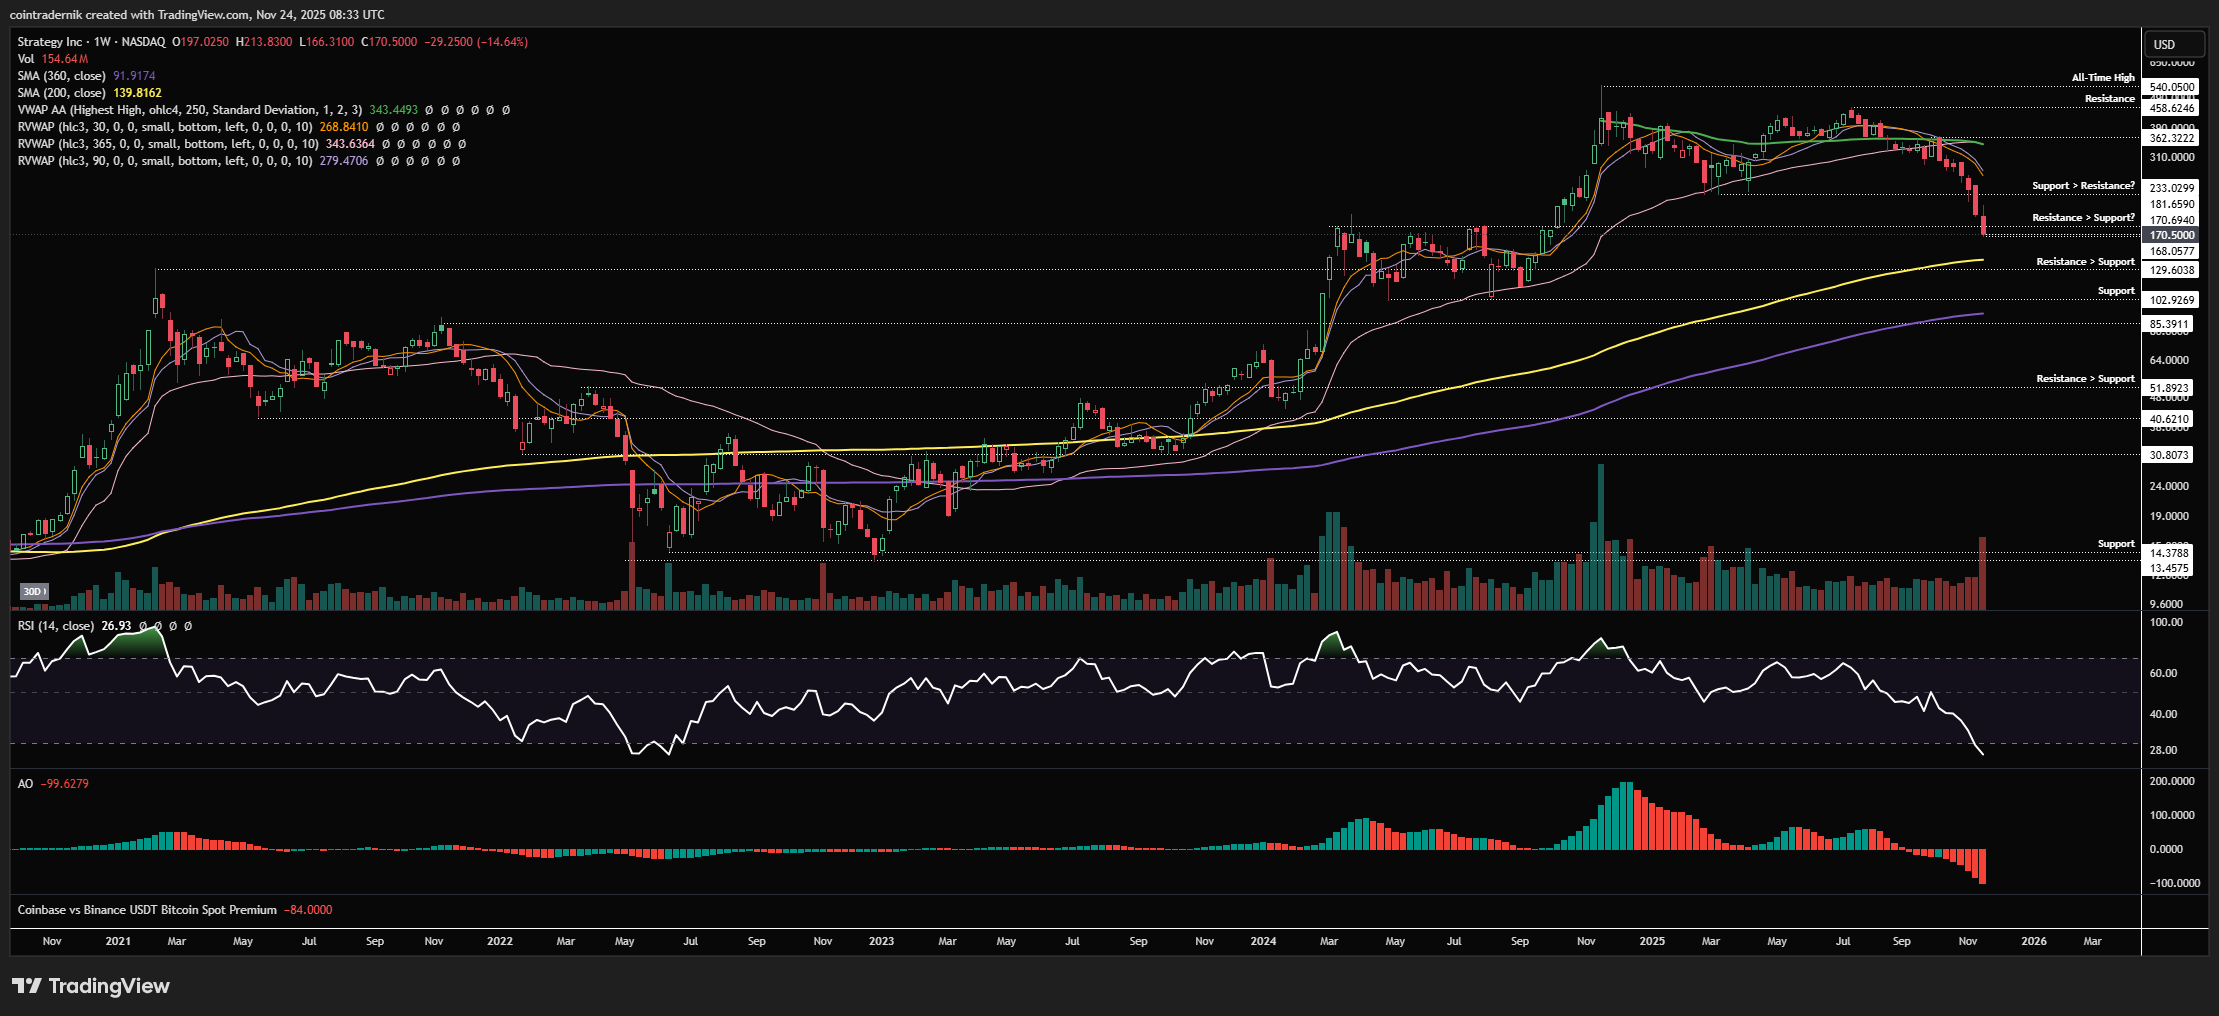
Beginning with the weekly for MSTR, my god does this look atrocious. I am in disbelief at how similar the topping structure was to the last cycle, and weekly RSI is now marginally lower than during the 2022 bear market bottom. Price broke and closed below support at $233 and continued to fall, pushing below prior resistance at $181 to close last week at $170. Whilst weekly RSI is at all-time lows, this does not necessarily mean we have bottomed yet nor we will immediately bounce, as this just shows the strength of the momentum to the downside here, but it does make me begin looking for signs of capitulation and trend exhaustion on the lower timeframes that could provide good long setups. We are sat around 20% above the 200wMA, and given how similar the structure is to the prior cycle if we look to Jan 2022 we can see how MSTR bounced above the 200wMA, back above that broken support that had preceded the complacency shoulder, pushed into the space between the 30d and 90d rolling VWAPs and the 365d rolling VWAP above that, and then finally capitulated lower into a cyclical bottom. Whilst we cannot be certain this is exactly how it plays out again, I do think we're approaching the bounce zone here as sentiment around MSTR has also been obliterated. If we see signs of exhaustion on the lower timeframe, we could look for longs back into $233 and potentially higher for a short squeeze and then looks for signs of trend exhaustion in the other direction to play the next leg lower into $130 and potentially lower.
Daily:

On the daily, we can see how there is not yet trend exhaustion on the daily, but we are very much in the troughs of bearish momentum, where if we see a reclaim of $181 as support alongside daily RSI back above 30, we could get that squeeze higher, at the very least into the 30d rolling VWAP and prior support turned resistance at $225ish but with the potential to hold that long into the $270 area, where we could be pushing into a number of key VWAPS. Up in that area around $270 - if we see it traded again over the next few weeks - that is where I would be interested in short setups forming for a leg lower, with $130ish as a first TP with a view to hold for $102 support being retested. Let's see how this shapes up over the next week, but yeah don't just blindly take the long until we see some lower timeframe structure and only then we can look to last week's low as invalidation.
Price: $240
Weekly:

Looking at the weekly timeframe for COIN, we can see how price is kind of trading like Nov 2024 into April 2025, but within this much larger long-term uptrend from the 2022 lows. We wicked above the all-time highs into $444 and rejected in summer, then forming a lower-high a few weeks ago at $400 and selling off from there, closing firmly below the 365d rolling VWAP and prior support at $282 last week, with a weekly close at $240. Momentum looks pretty much identical to that period from late 24 into spring 25 and whilst the $143 swing-low that preceded the high is intact, the longer-term trend remains pointing towards higher-lows and higher-highs over the coming months. If we trade lower from here into $206, I would look for long setups in that area as a high probability area for at least a strong bounce. If we front-run that level, I would only be interested in longs above $282 for a move back to the highs.
Daily:
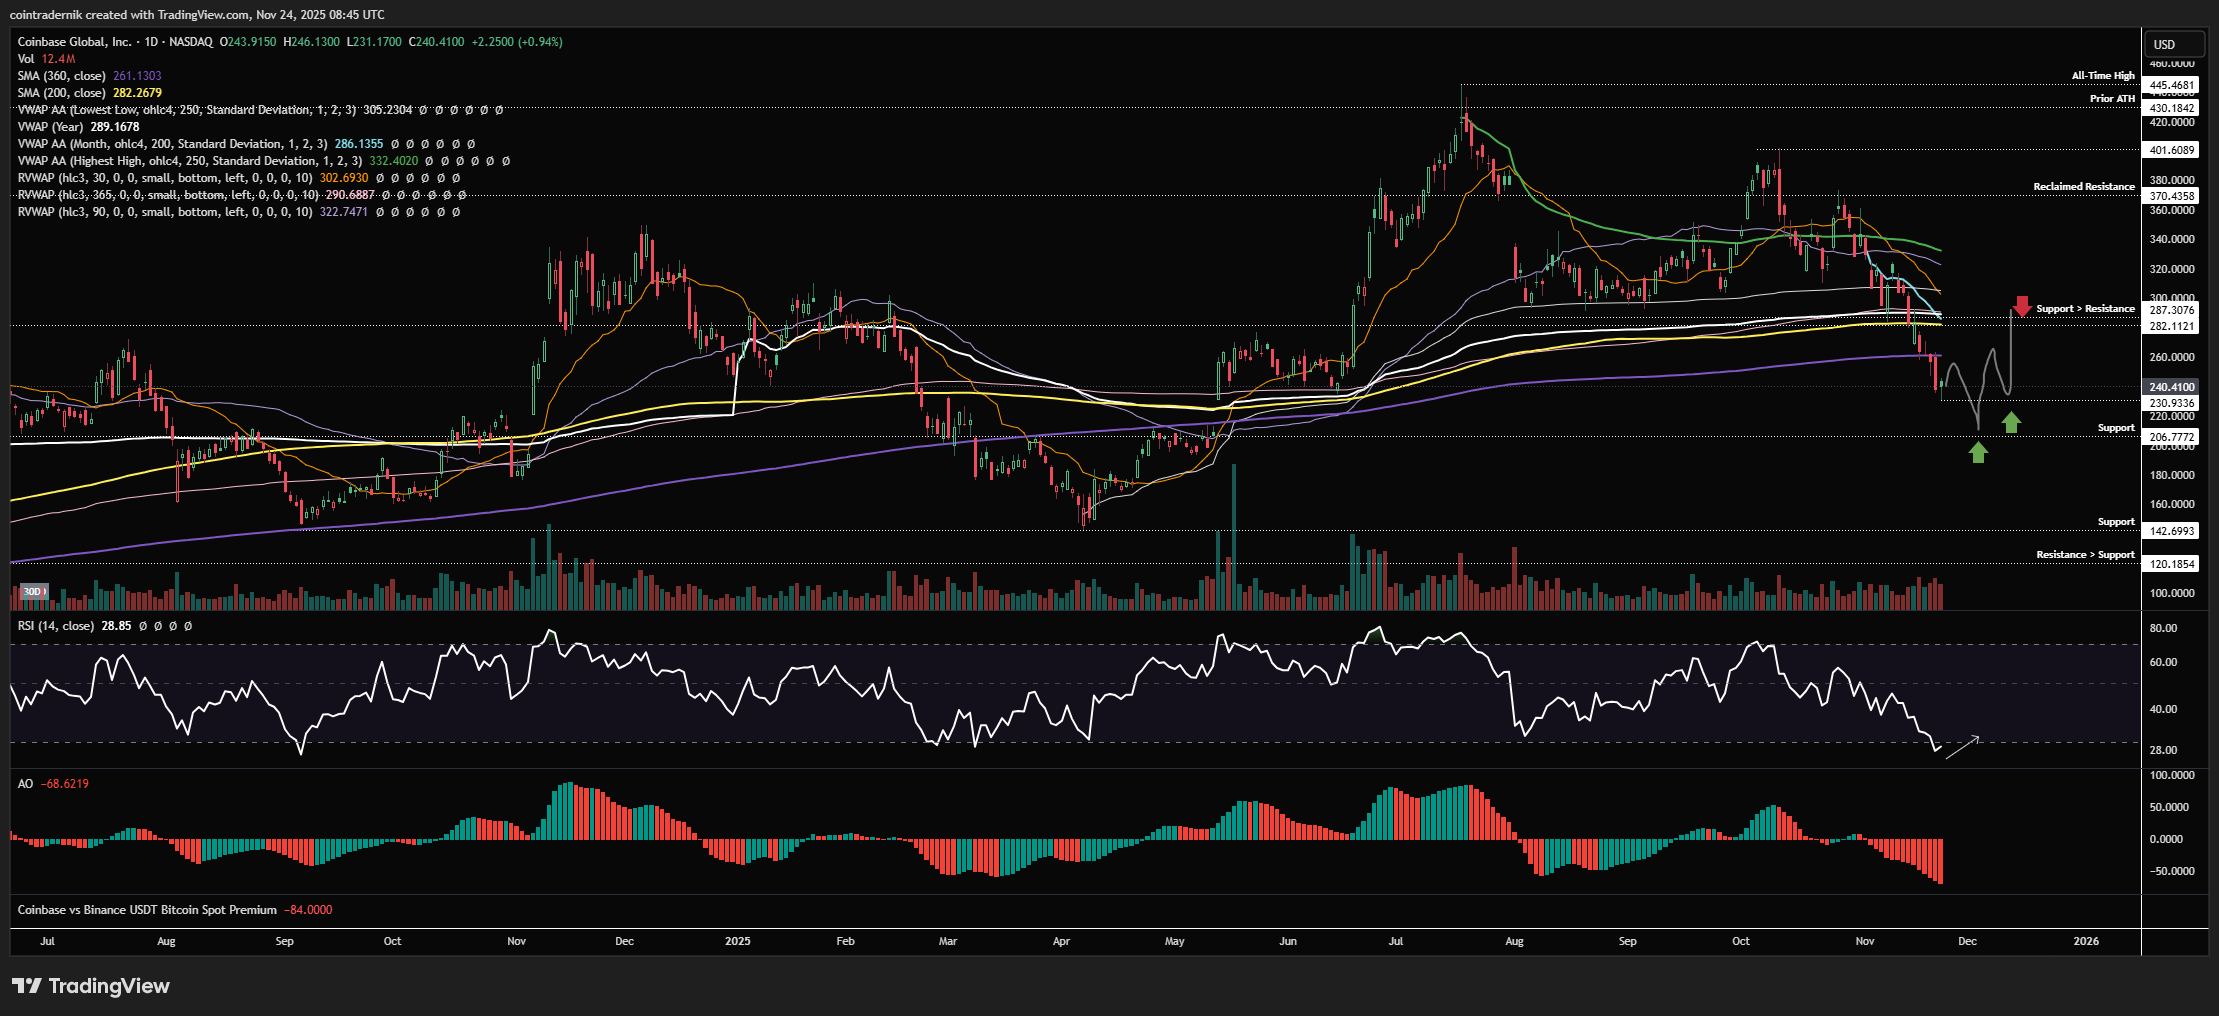
Looking at the daily, we can see how this might transpire, where another leg lower into early Dec - should we get it - could form bullish divergence across RSI and AO, with a view to bid $206 and add back above $230, looking for at least $282 as a confluence of prior support turned resistance. Flip that area back into support and it's game on for a run at the highs. On the short side, depending on how things are shaping up around $283 if and when we next trade it, that's obviously where you could look to fade this lower again, as I would expect we'd be able to get a very tight invalidation up there. Acceptance below $206 opens up a flush of $143 as the double bottom, and you'd really need to see a brief wick and immediate reversal for it to look bullish into that level to be honest.
Price: $23.42
Weekly:

Beginning with the weekly timeframe for GLXY, we can see how the trend has been very strong from the 2022 bottom and despite three multi-weeks legs higher following the Liberation Day lows we are yet to see trend exhaustion into the highs, with both weekly RSI and AO still just showing bullish momentum. We did wick above the 2021 highs into $45.90 and reject, with price since retracing back into resistance turned support at $21.87, which is also the swing-low that preceded the move to yearly highs. If we close below this swing-low on the weekly, weekly structure turns bearish and we should then expect the formation of a lower-high and a trend shift, but whilst this area is holding as support I would expect a bottom to form here and price to start trending higher again. We can wick below $21.87 and close above it but I wouldn't really want to see a weekly close below the level, particularly as weekly RSI has pushed below 50 here. It kind of feels like a mini April 25 or August 24 situation here for GLXY, with the longer-term trend very much intact.
Daily:

Finally, looking at the daily, we can see we have traded into the 200dMA and the sell-off has been very orderly, with momentum stair-stepping lower. We don't have bullish divergence here into the lows, but if we can catch a bid this week and close back above last week's bearish engulfing (and the yearly VWAP and monthly VWAP confluence at $28.50), then I think we've bottomed and I would expect GLXY to trend back to the highs into 2026 and beyond. If we reject above last week's highs and then close below $21.87, it looks cooked to be honest and I would expect those flat lows at $17.60 to be taken out at the very least, if not a larger move lower into major support around $12. Big week or two ahead for GLXY.
I hope you've found some value in the read this week!
And if you've not already signed up for Ostium, please do so and test out some of the recent updates, including:
Sign up here (you don't have to use my ref link, of course): https://ostium.app/trade?from=CL&to=USD&ref=CTNIK

.avif)