

Market Outlook #48
August 26, 2025
-
12
min read


This blog references an opinion and is for entertainment and informational purposes only. It is not intended to be investment advice. Seek a duly licensed professional for investment advice.
In this 48th Market Outlook here at Ostium Research, we'll be taking a look at the week ahead in markets, focusing specifically on price-action, positioning and event risk for Bitcoin, Ethereum, Gold, DXY and SPX.
Firstly, let's take a look at the calendar for the week ahead:
TUESDAY: US DURABLE GOODS ORDERS (JUL): (CONSENSUS -4% VS PREVIOUS -9.3%)
THURSDAY: US INITIAL JOBLESS CLAIMS: (CONSENSUS 230K VS PREVIOUS 235K)
THURSDAY: US GDP ANNUALIZED (Q2): (CONSENSUS 3.1% VS PREVIOUS 3%)
THURSDAY: FED'S WALLER SPEECH
FRIDAY: US CORE PCE (YOY (JUL): (CONSENSUS 2.9% VS PREVIOUS 2.8%)
FRIDAY: US CHICAGO PMI (AUG): (CONSENSUS 45.5 VS PREVIOUS 47.1)
FRIDAY: US PERSONAL SPENDING (JUL): (CONSENSUS 0.5% VS PREVIOUS 0.3%)
Now, let's dig into asset-specific price-action for the week ahead, looking firstly at Bitcoin:
Price: $110,367
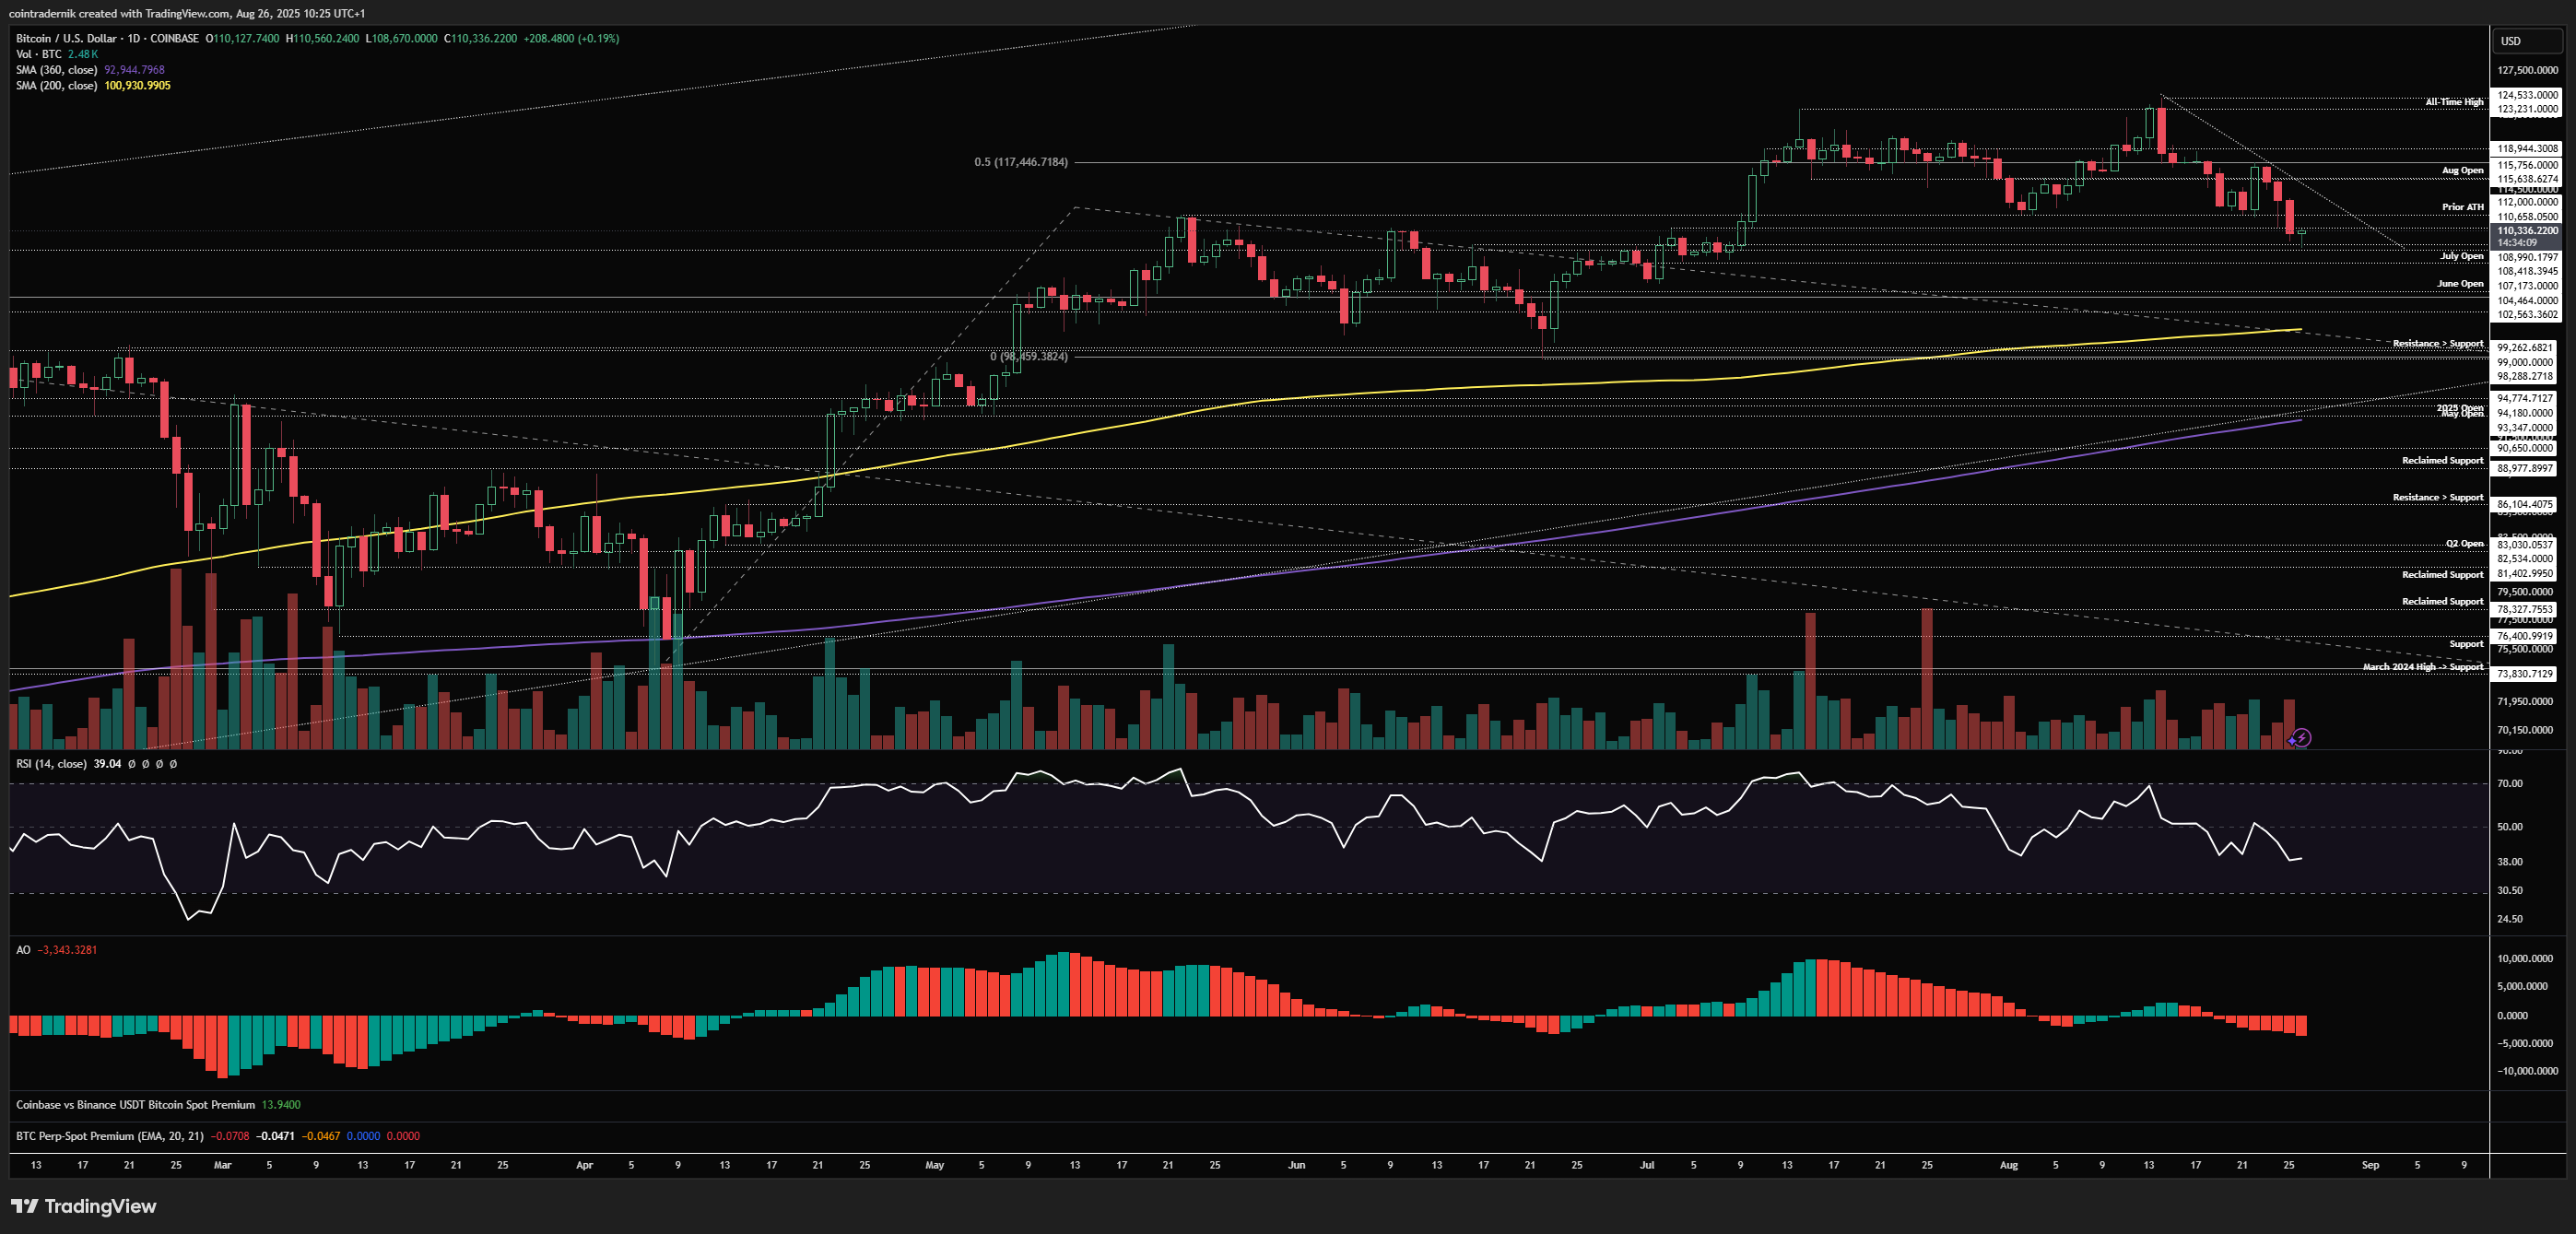
Weekly:

If we begin by looking at the weekly, we can see that despite the late rally into Friday's close post-Jackson Hole, Bitcoin gave up significant ground over the weekend to close the week back at $113.5k, firmly in the red and only marginally above prior all-time highs at $112k. Early price-action this week has seen that momentum continue to the downside, pushing through $112k into $108.7k, above the July open and significant historical resistance turned support. This should now be where we see demand start to step in after this multi-week correction given that the range between the July open at $107.2k and $109.4k prior highs acted as resistance for most of 2025 before the breakout, and after this amount of time away from the level the rounded retest should find support. If we close back below the July open, things look much more bearish short-term and we would expect to see the swing-low at $99k retested and likely swept into longer-term trendline support before a bottom is found. If we do find support here above the July open, as I am anticipating, we should mark out a higher swing-low over the next couple of weeks into September and then continue higher back into all-time highs and beyond from there. Given the current momentum and structure on this higher timeframe, my view is that we mark out that swing-low into the first week of September, then retesting the highs into September FOMC, around which we likely get another smaller shakeout before continuation through $124k towards $136k into the end of September, or early October. If we close the week below $107k, this view will change and I will be in the camp of a few more weeks of chop and consolidation into $99k before continuation in Q4; and if we close the weekly below $99k I think we go all the way back into ~$90k-$92k, which is basically the last stand area for the longer-term uptrend in my view. My probabilities of each of these scenarios are currently 75%/20%/5%.
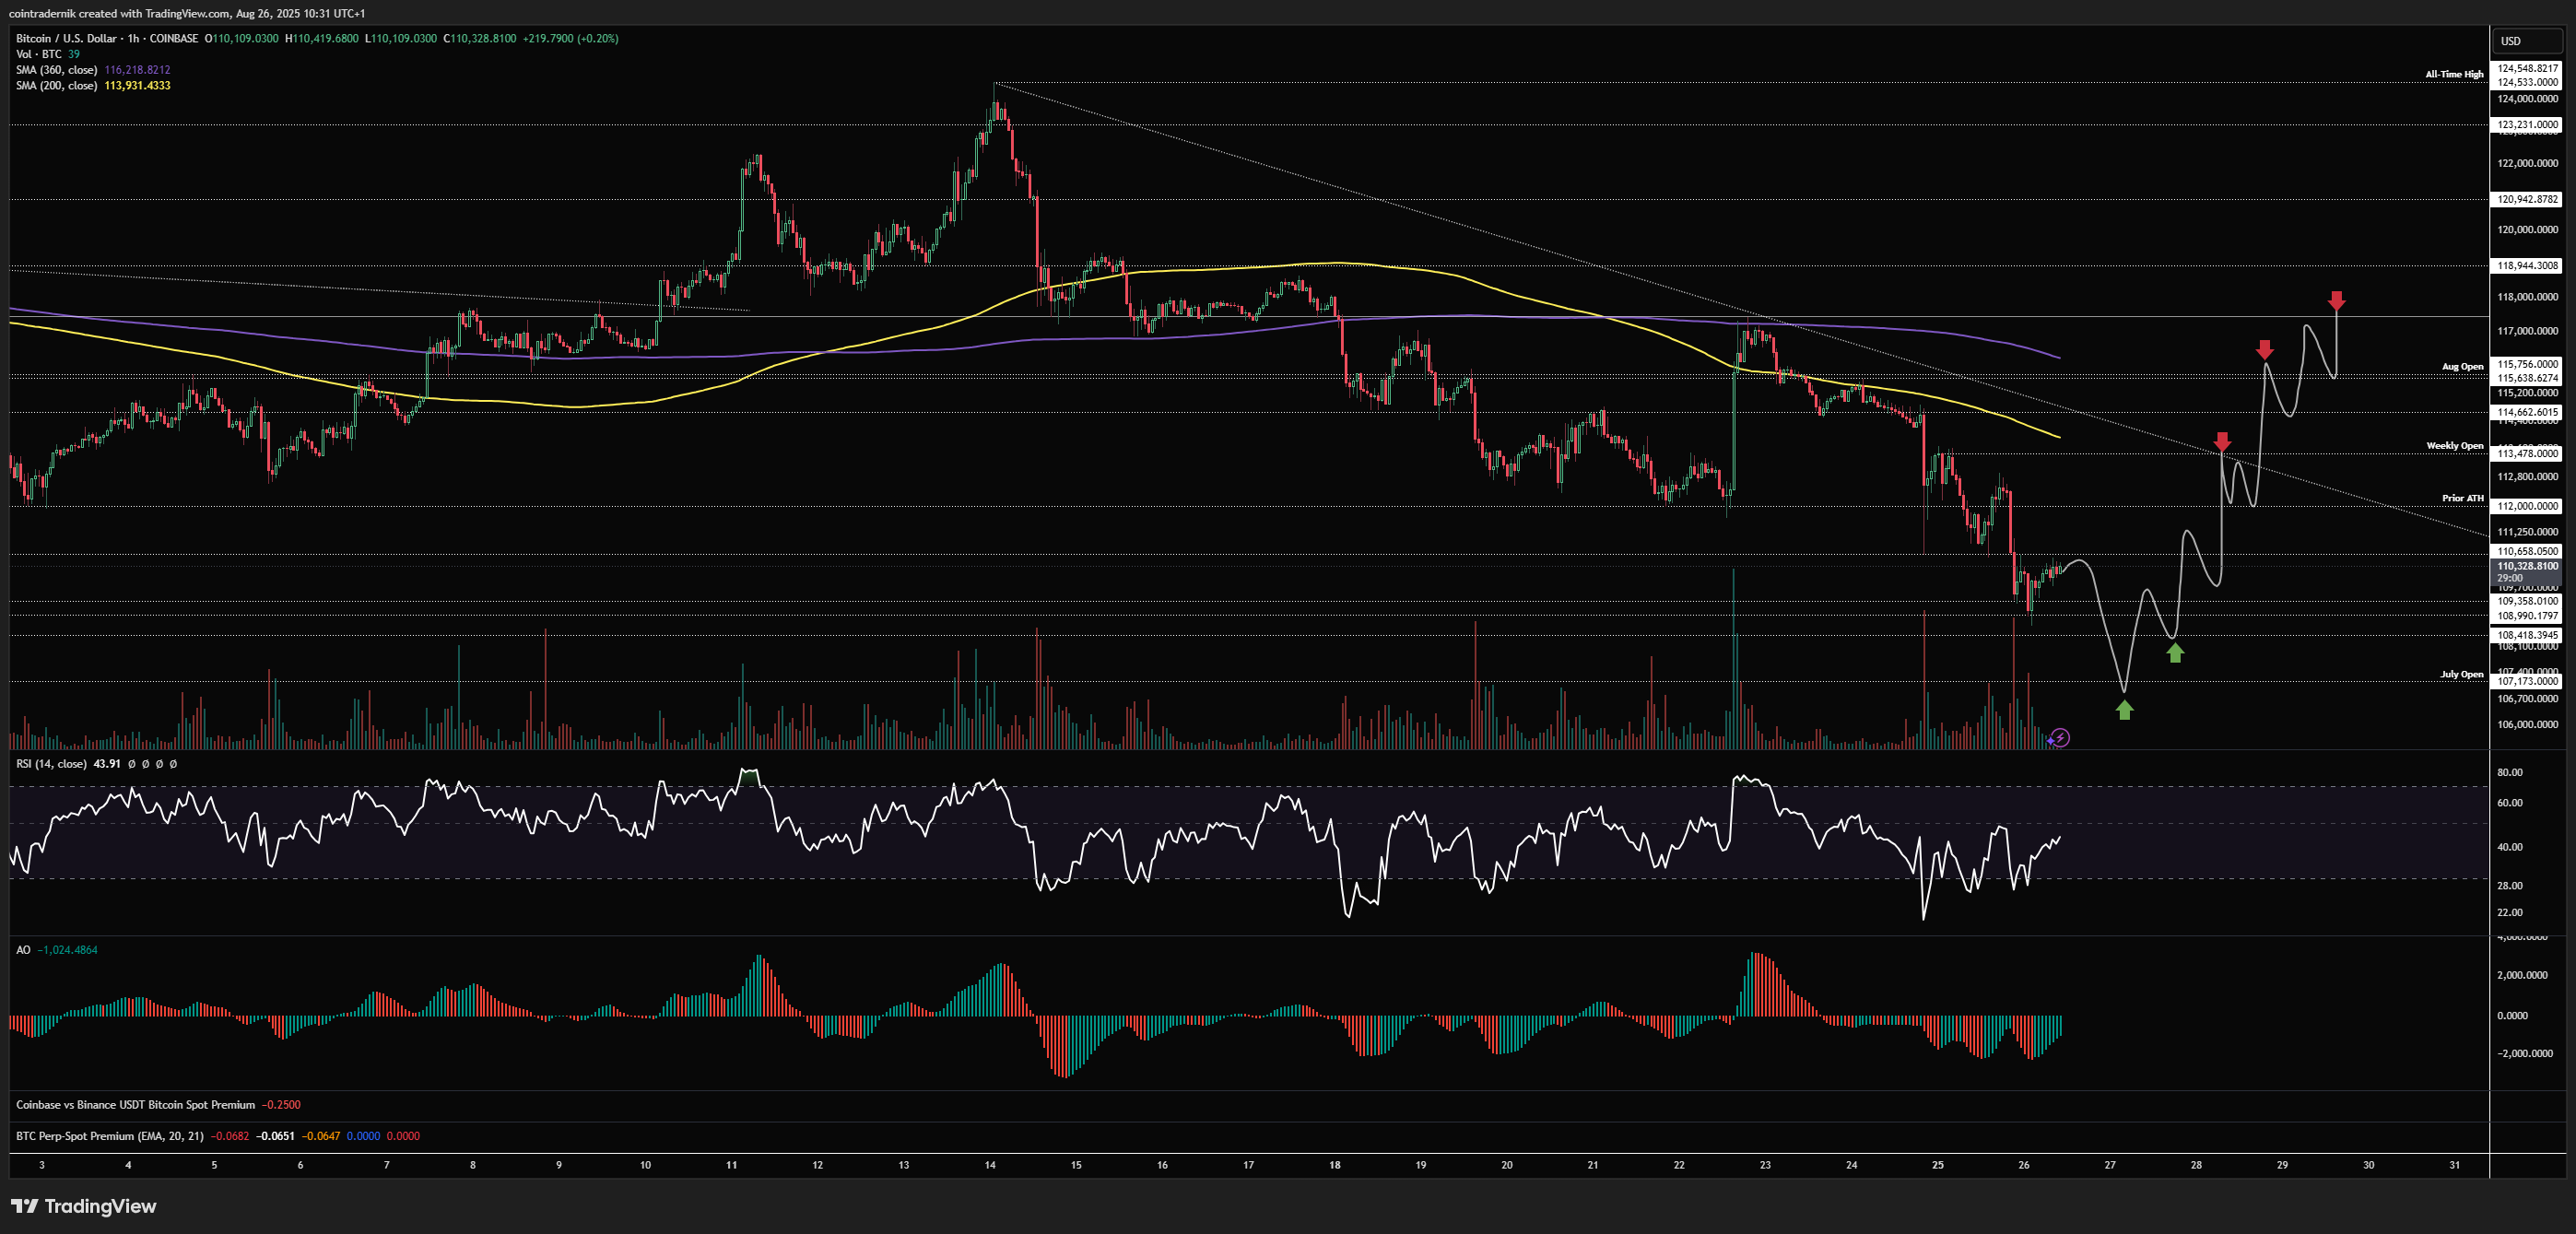
Daily:
Turning now to the daily, we can see that daily momentum is bearish, as is daily structure following that break and close below $112k. Now, if this is a bear trap following the Jackson Hole bull trap, we should see late shorts in this area get trapped this week and price reclaim $112k as support swiftly, providing fuel for a local trendline breakout and a move back towards the August open at $115.7k, which is obviously a super important level this week as we head into the monthly close. Closing August above that level to me would signal a non-consensus green September in the face of all the seasonality lovers (which has been utterly unreliable this calendar year). Bouncing from here and rejecting below the August open and then breaking below the July open would confirm the more bearish path back into $99k. Daily structure does not turn bullish again unless we close the daily above $117.5k.
Now, looking at setups for the rest of the week, we have sold off from the weekly open at $113.5k, with a nice CME gap back into $117kish, so that would be a good target for longs if this is not a bearish breakaway gap within a more protracted correction. If we take out today's low into the July open I would blindly bid that area and add on a reclaim of the Monday low around $109.4k, with a view to TP a little back at the weekly open, then at the monthly open and finally at $107.5k, taking out that post-Jackson hole high and filling the CME gap:
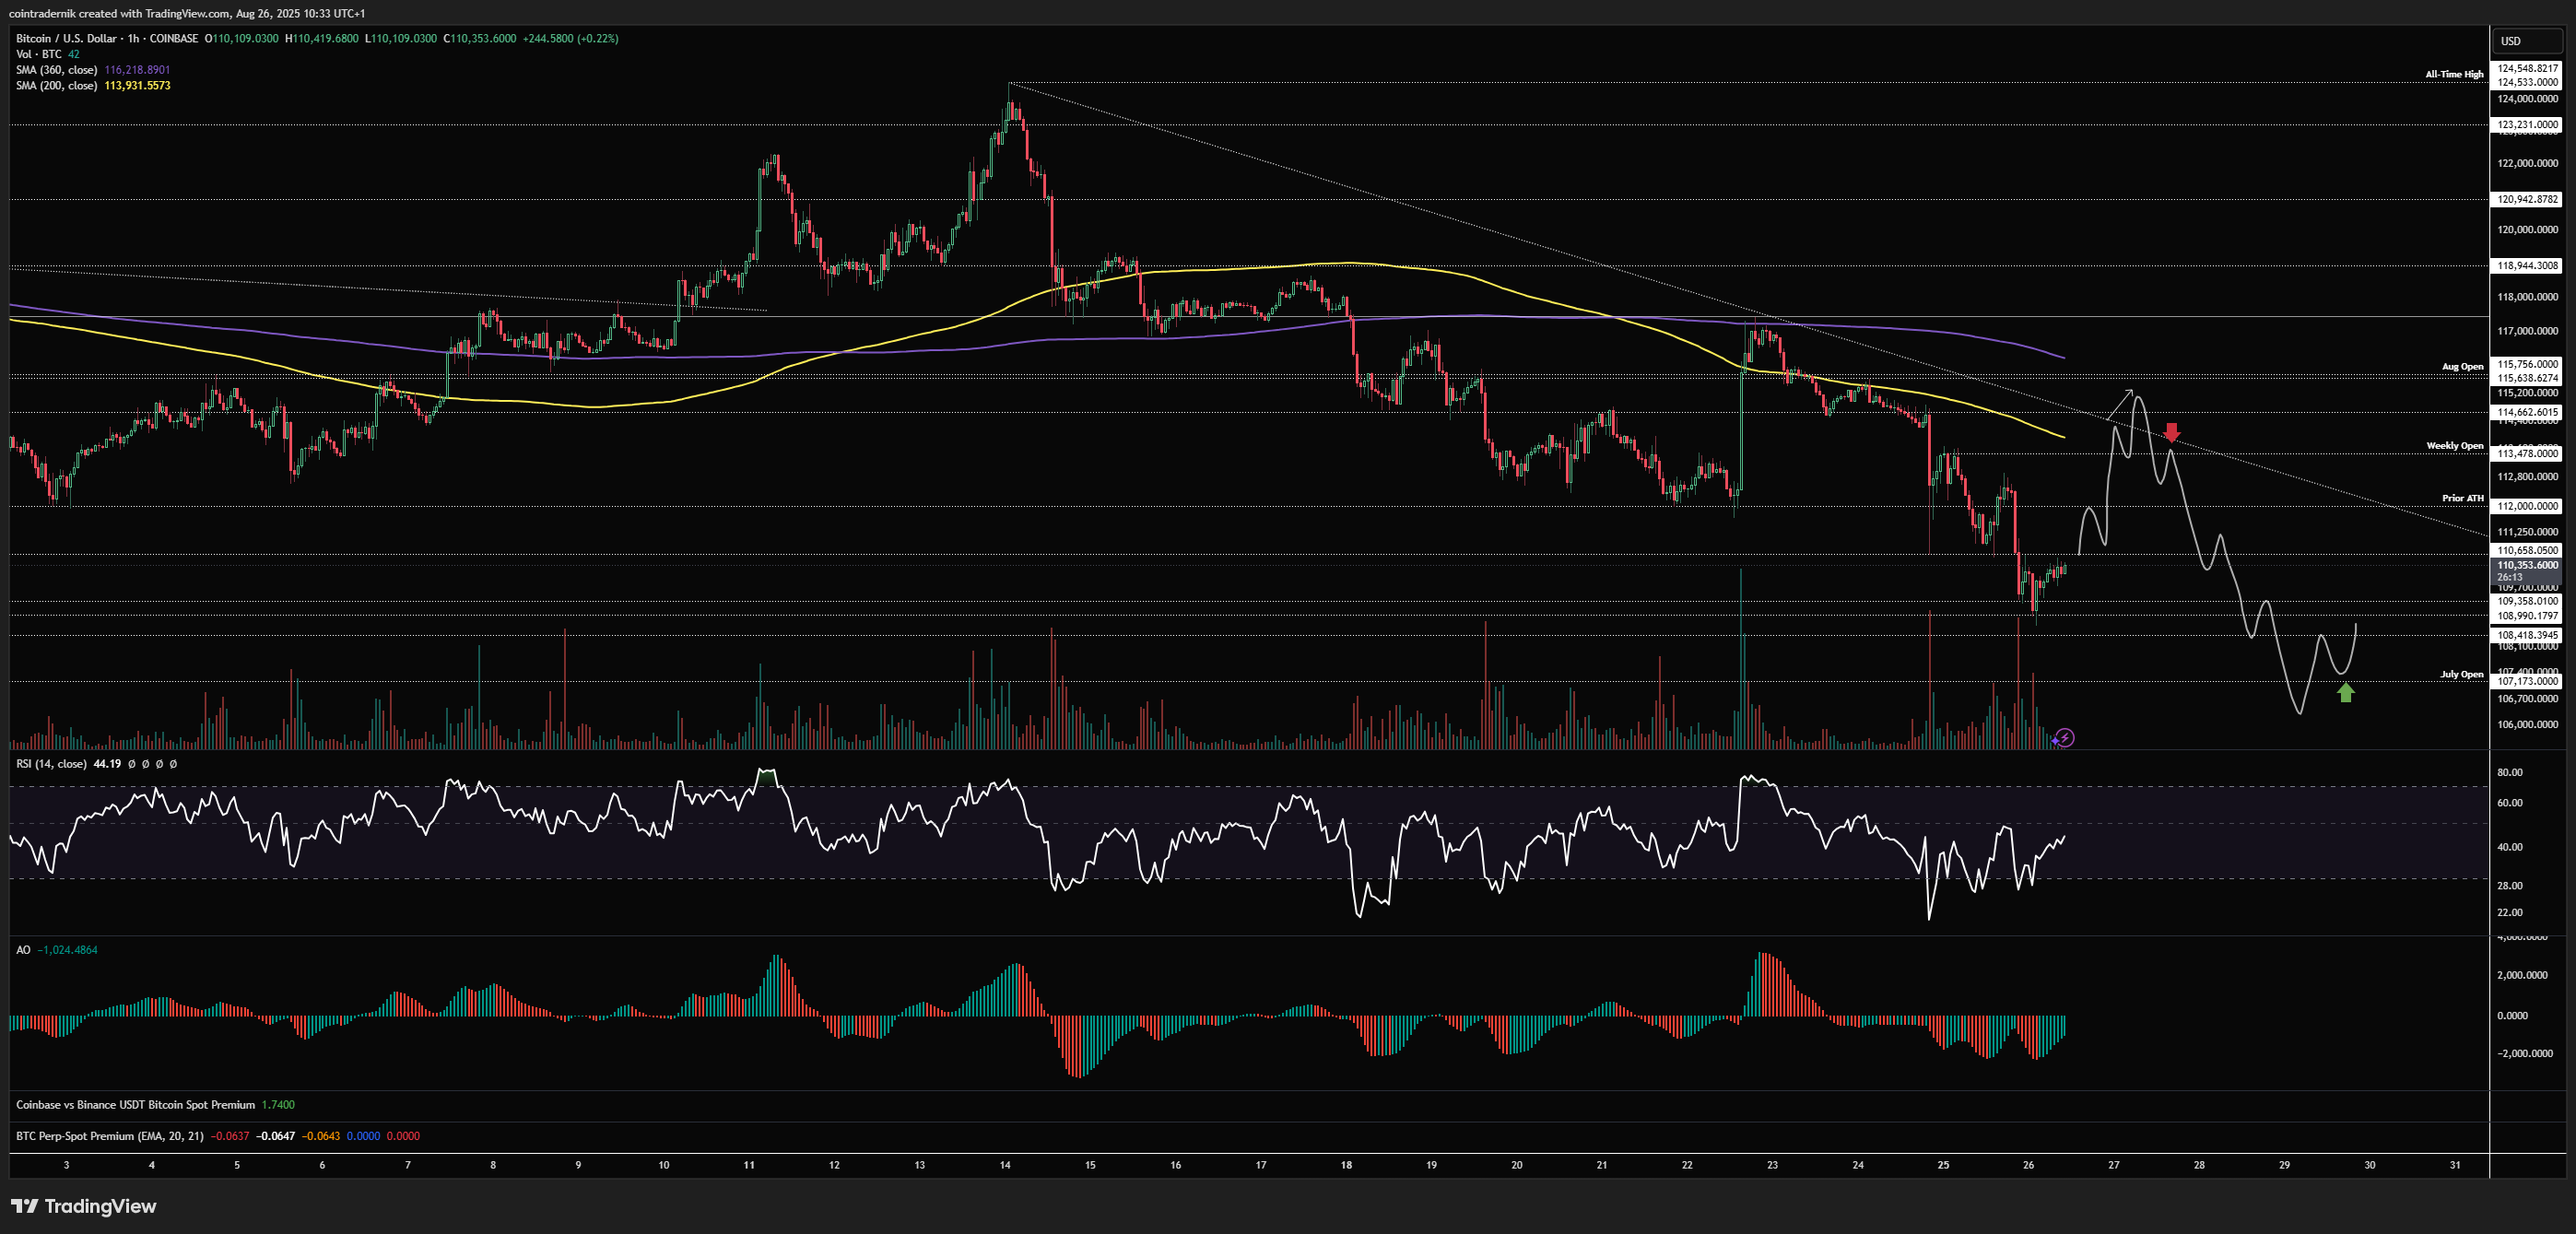
On the short side, you want to see price hold the lows here and rally higher into trendline resistance, forming bearish divergence above the weekly open and then breaking back below it, where you would look to short a retest of that area and fade it back into July open:
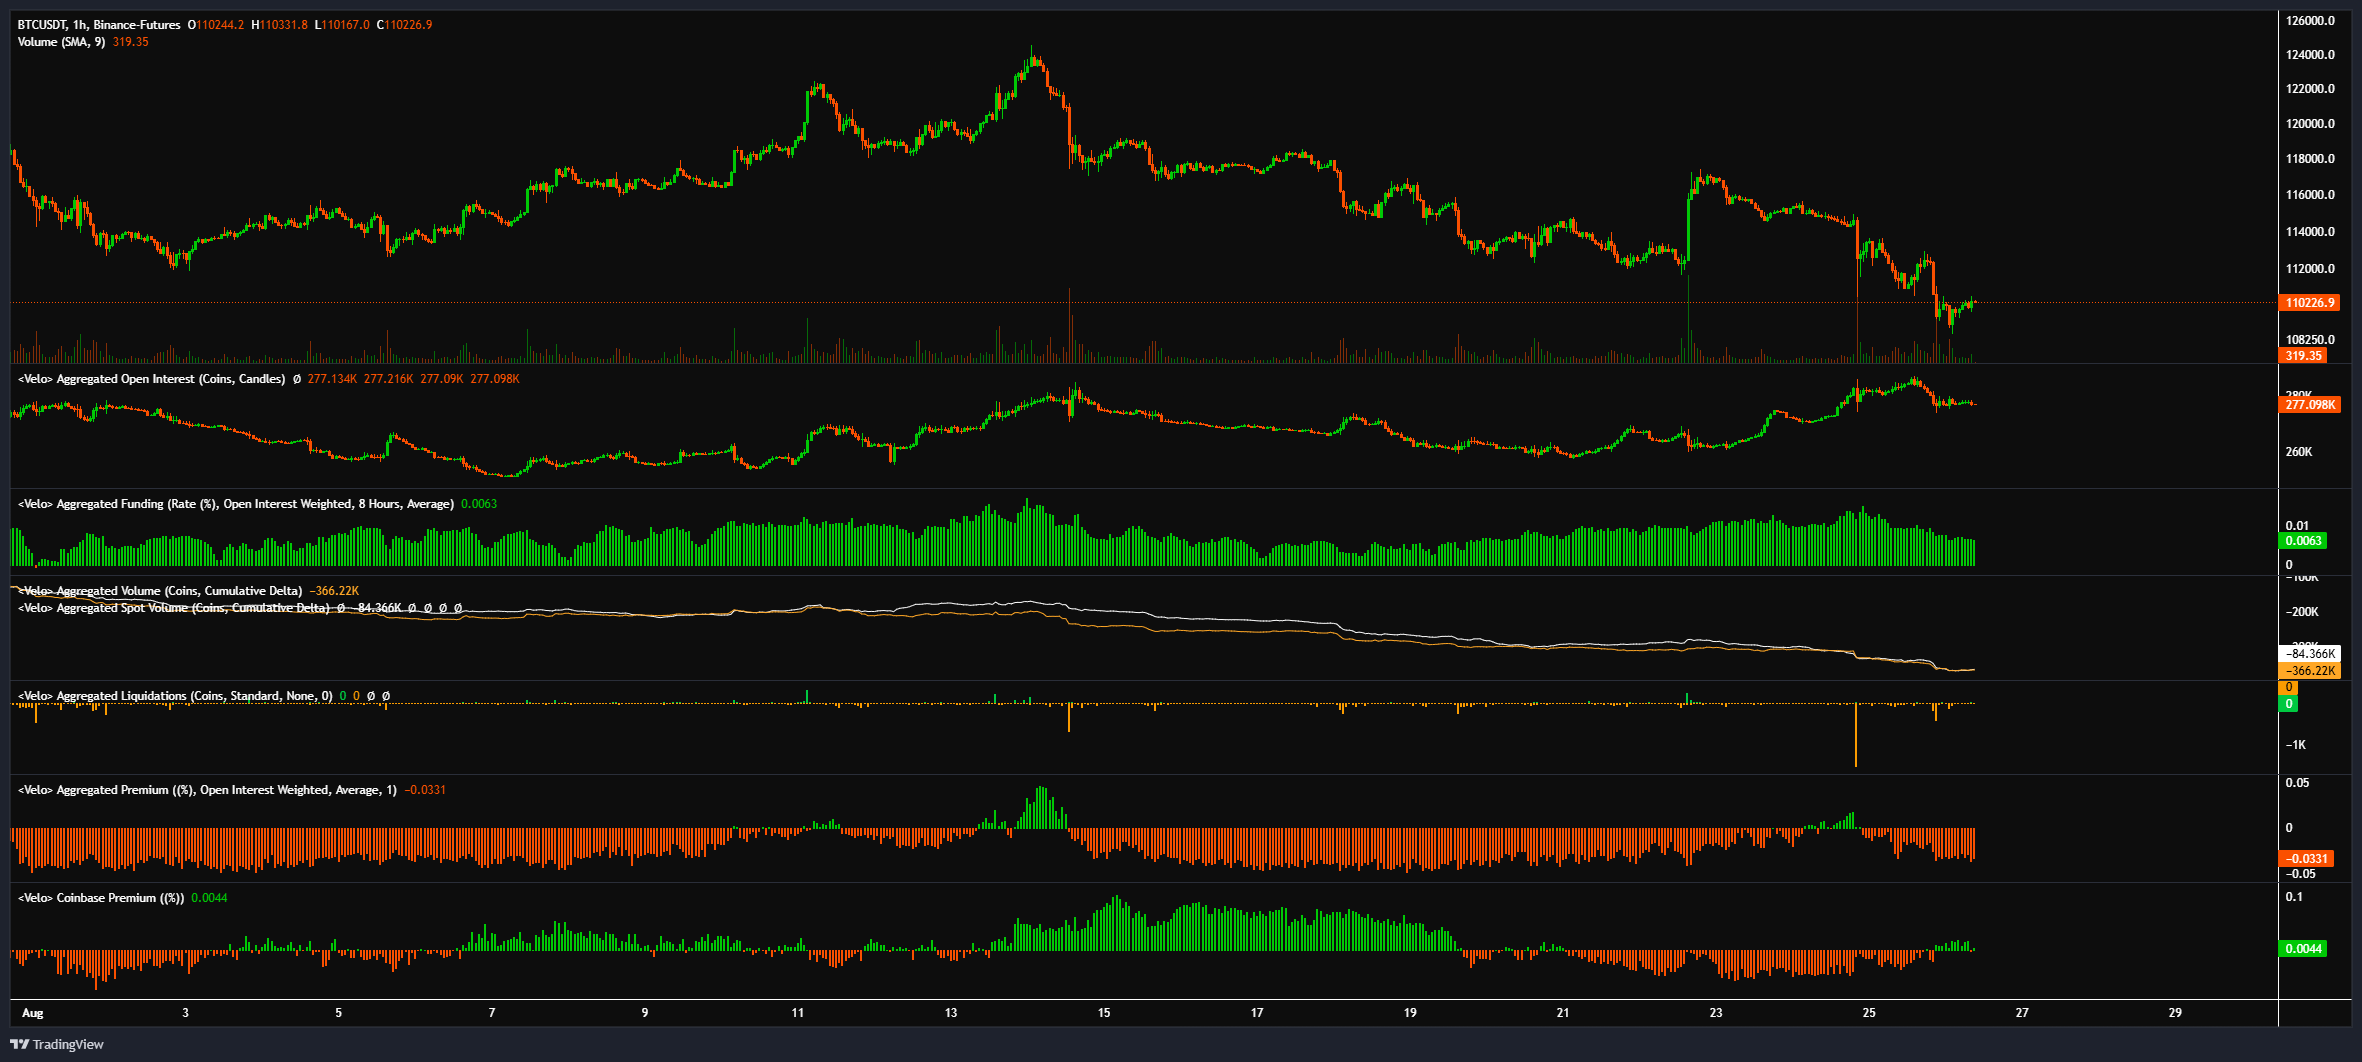
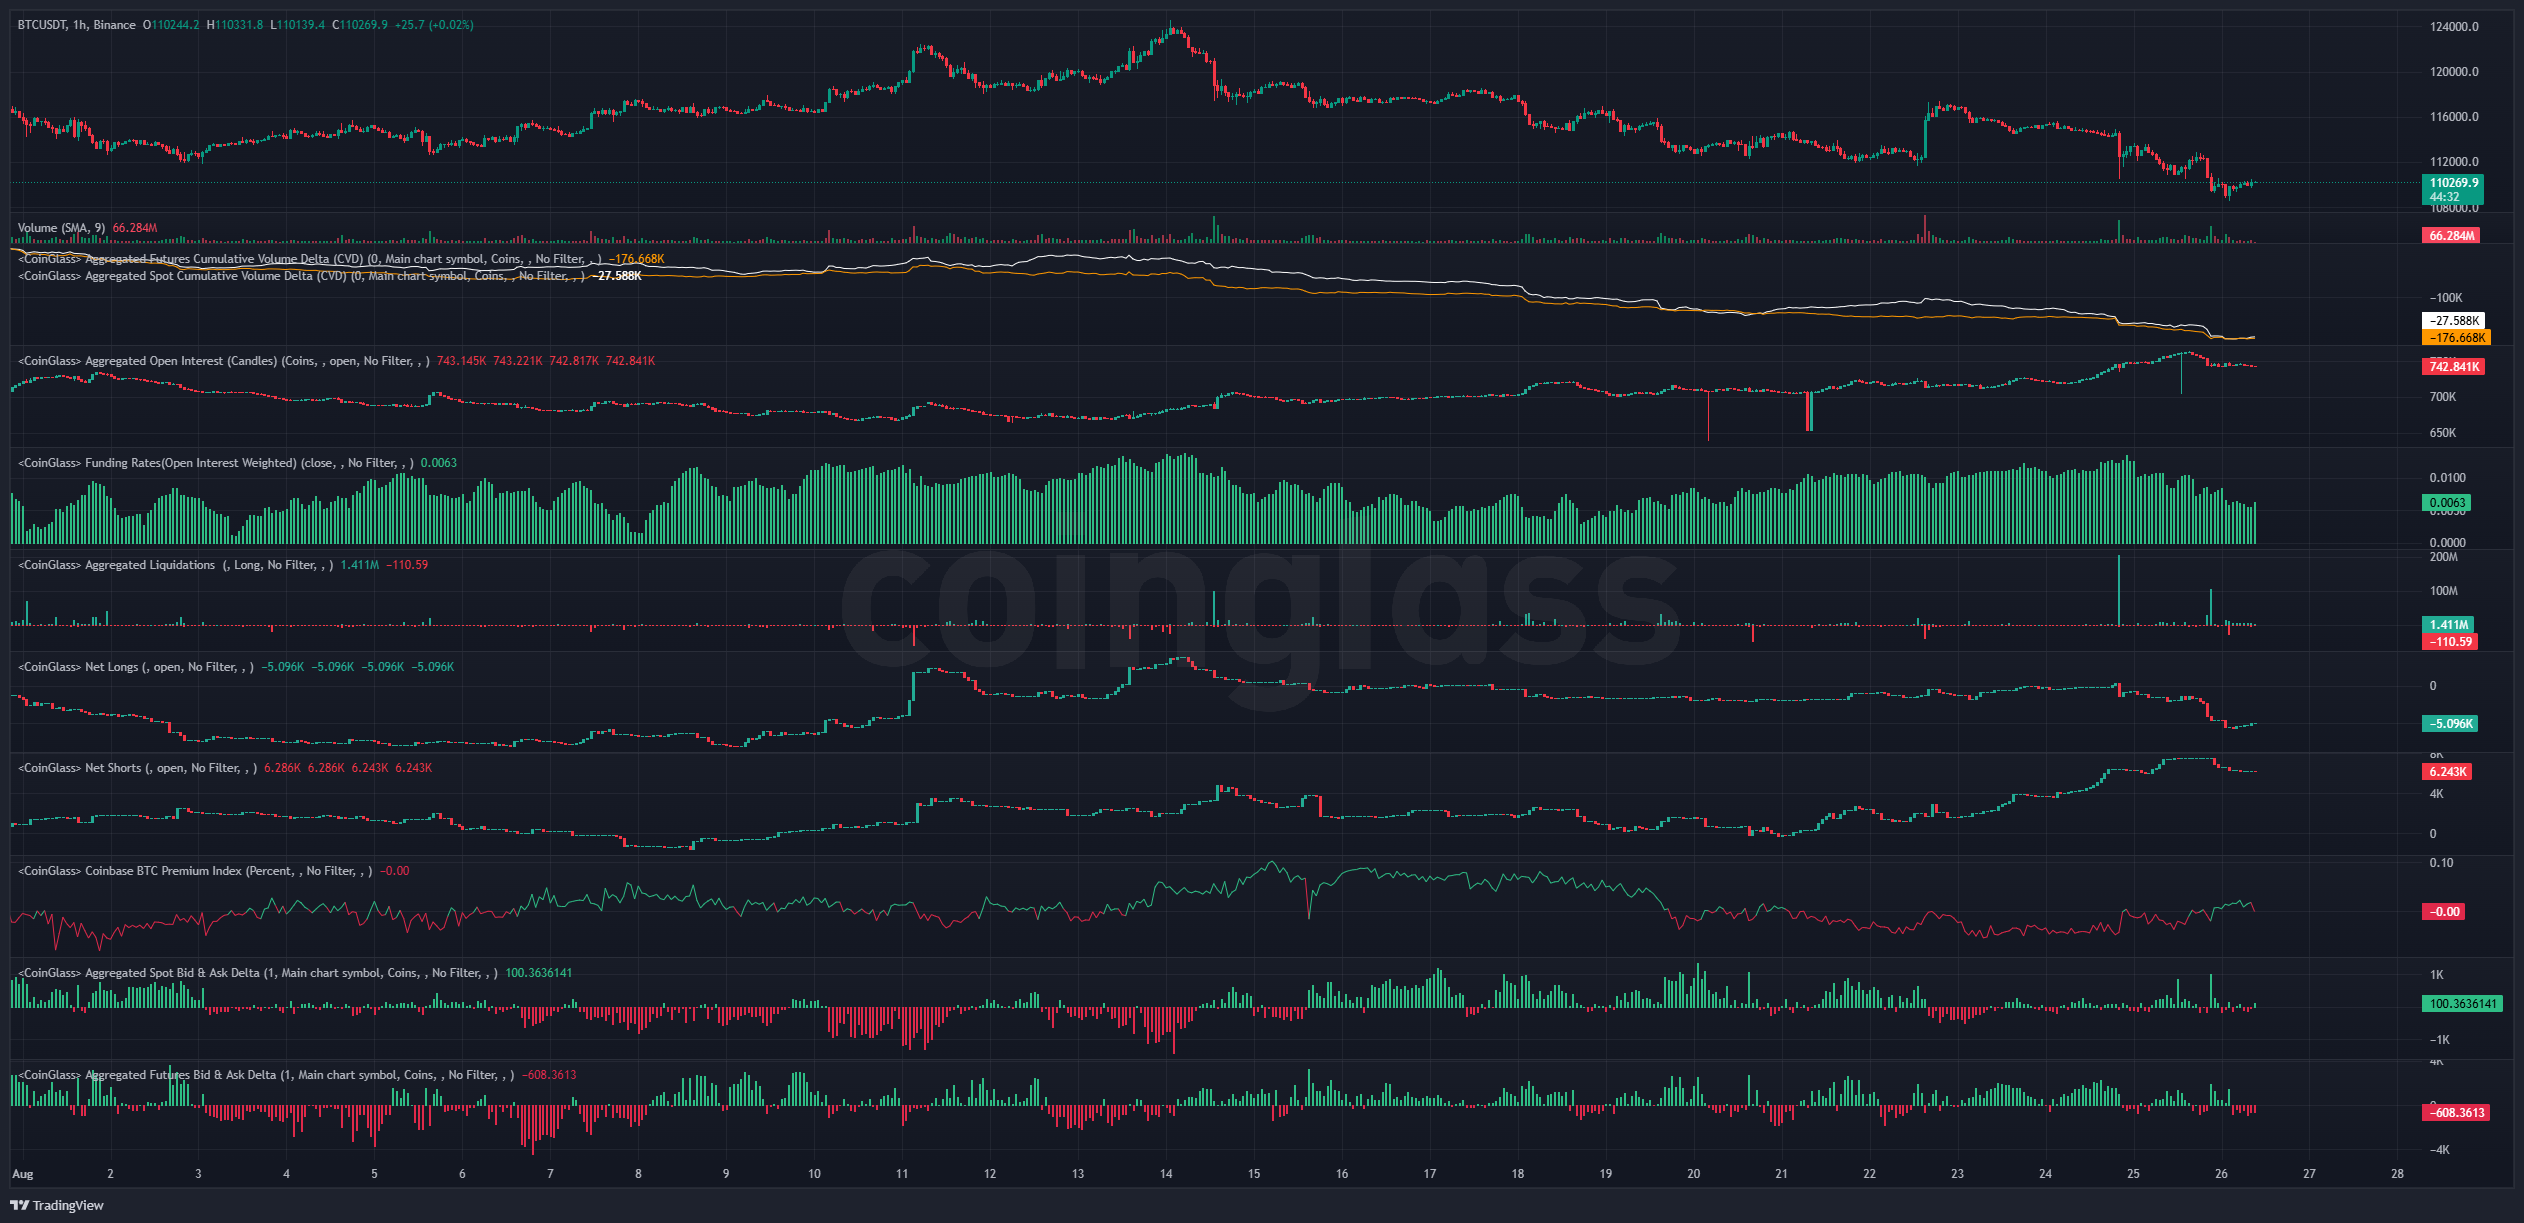
And here's a snapshot of positioning across Velo and CoinGlass:
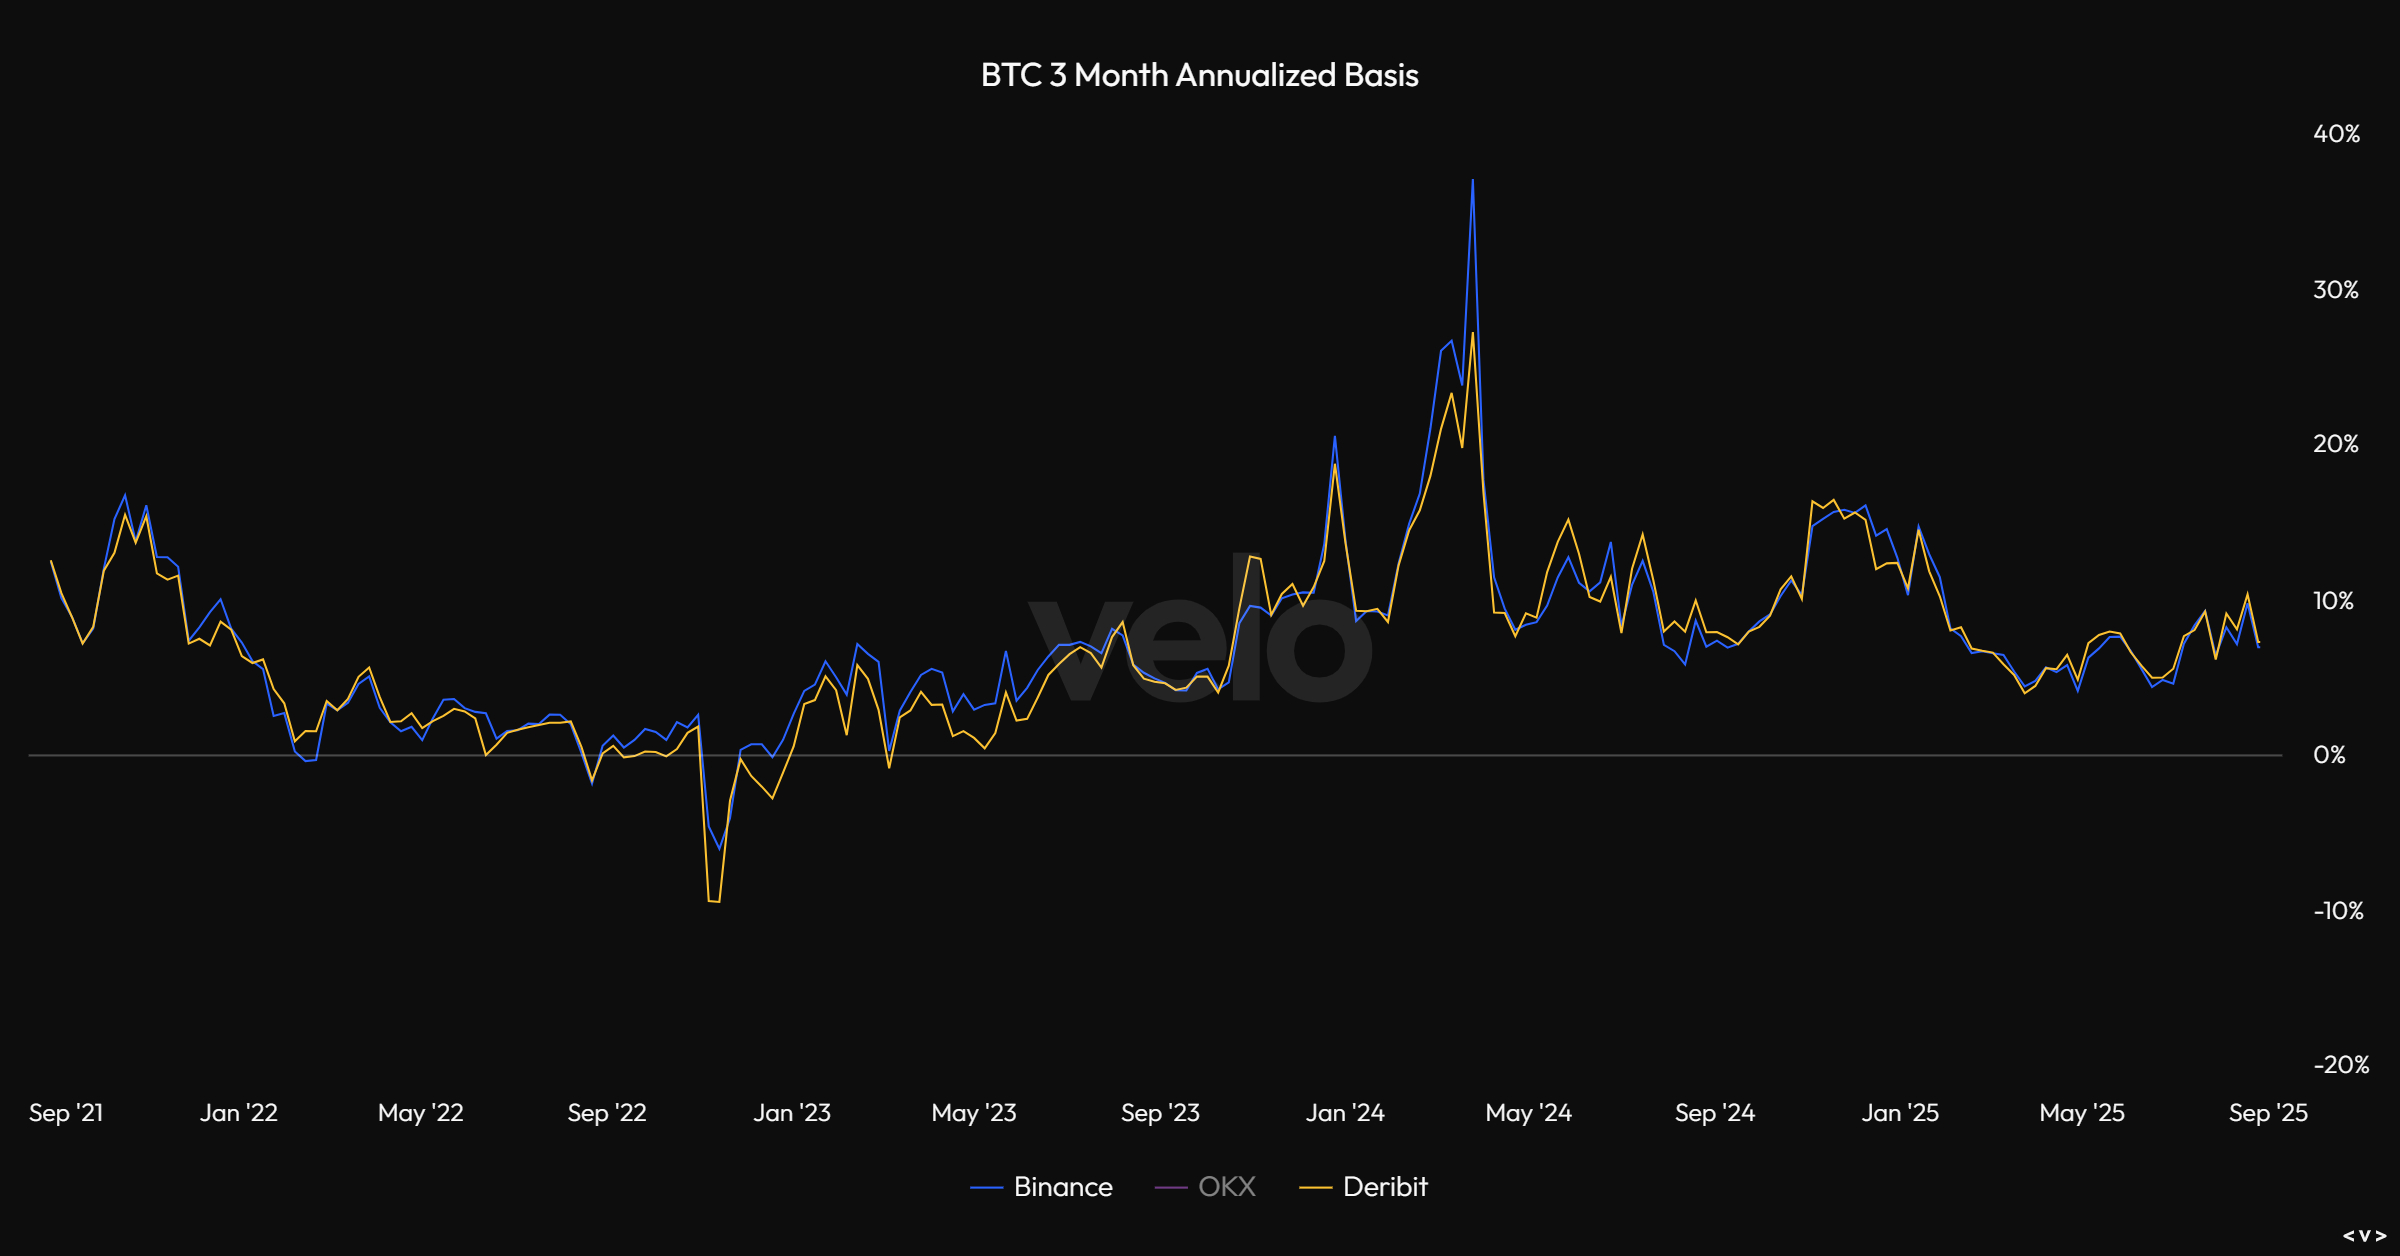
And here's 3-month annualized basis:
And Bitcoin OI vs Altcoin OI:
.png)
And finally some of the expected 1-week and 1-month liquidation levels:
-2025-08-26_09_31_04.png)
-2025-08-26_09_17_23.png)
Price: $4410
ETH/USD
Weekly:
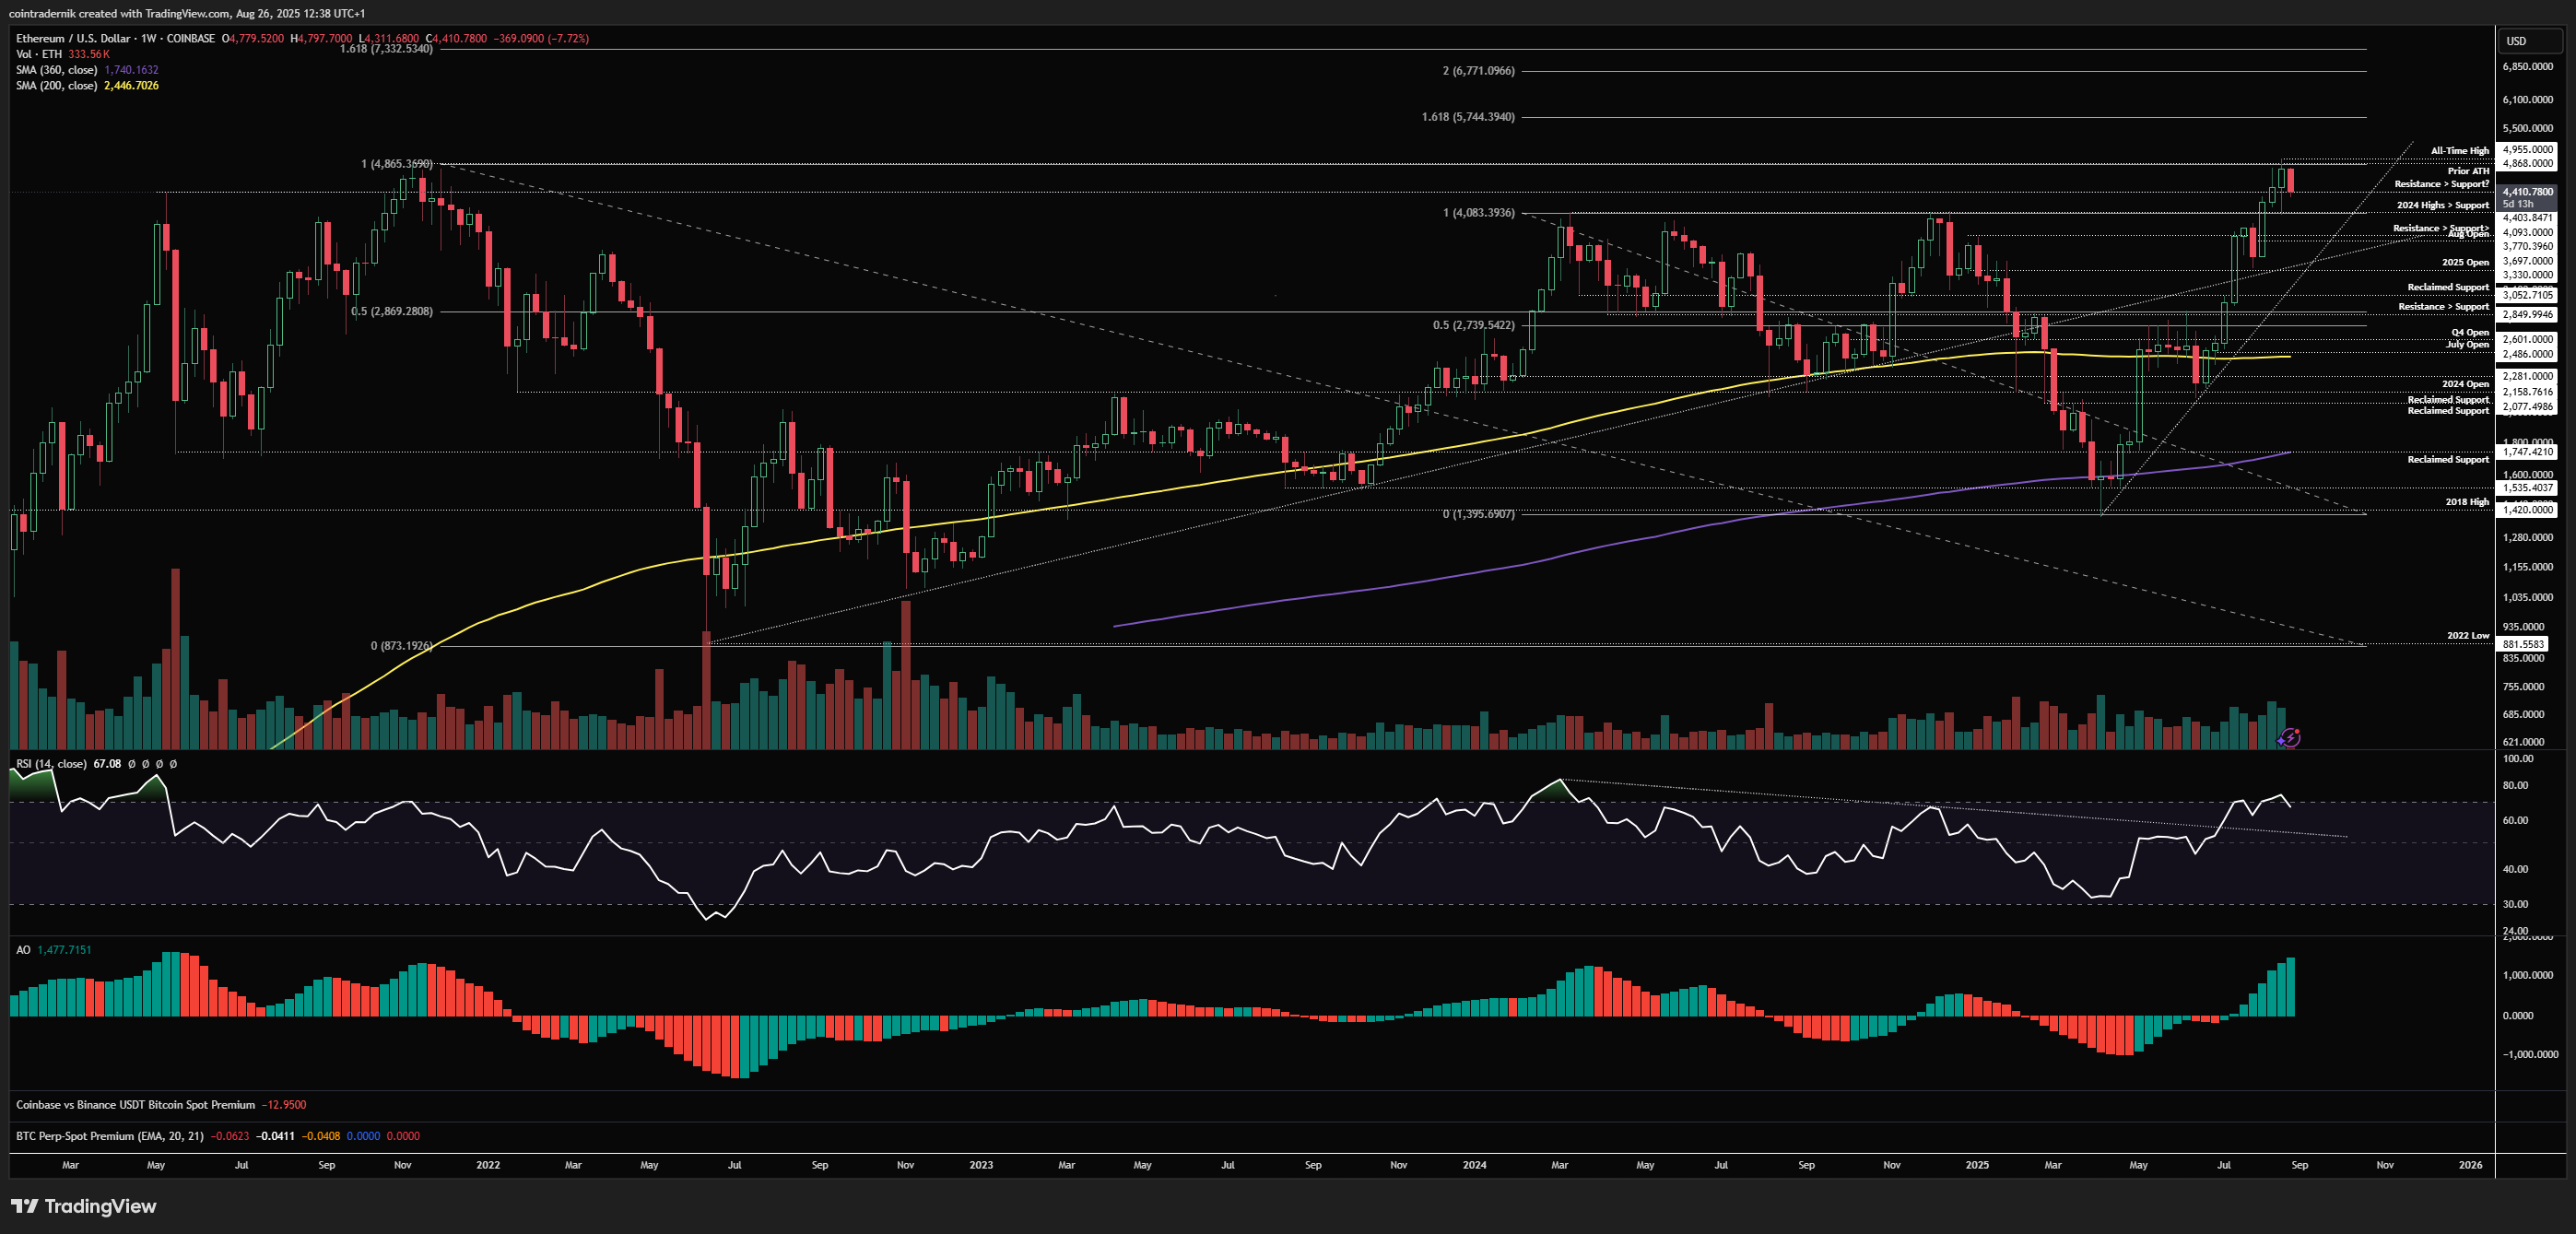
If we begin with the weekly view for ETH/USD, we can see that last week saw ETH make fresh all-time highs for the first time since 2021 above $4868 into $4955, closing the week at $4779 - an all-time high weekly close. This is not bearish. We can expect some late longs to be flushed out as often occurs around key swing-points, but I am fully expecting a period of price discovery to follow. Last week did see 2024 highs at $4093 act as support on a retest, so we want to see that support hold now if the price discovery is to be sooner rather than later; losing $4090 opens up a deeper pull-back into September, where price discovery is likely pushed out into Q4, but please don't mistake an all-time high weekly close as anything but bullish on the higher timeframes. A weekly close above $5000 will begin that continuation leg higher, with the 1.618 extension of the 2024 mini-bear market at $5744, followed by the 200% extension at $6771 and then the 1.618 extension of the previous cycle at $7332. Those are the major levels I am looking at as we head into the end of year for ETH, and as long as we do not close the weekly back below the 2025 open the structure looks absolutely fine, as brutal as a pullback into that area might seem.
Daily:
Looking at the daily, we can see that we having waning momentum locally on the more recent push into that all-time highs, but structure is still bullish and price-action has yet to validate this trend exhaustion. Remember, in strong trends, divergences get invalidated, and if that is the case a higher-low above $4090 should lead to the next leg higher through $5000 and this divergence being broken, where price then climbs towards $5600 before potentially putting in a local top. If this momentum breakdown is to be validated, we will see a breakdown through $4093 and daily RSI back below 48.7, opening up a much deeper correction in my opinion if that $4090 level then acts as resistance and is not immediately reclaimed. We would then expect to see that 2025 open at $3330 taken out and price to v-reverse off that area into Q4. I don't think that is a very likely trajectory at present but the higher timeframe bias would still be bullish even if we did see something like that play out. If we think back to the January 2021 breakout after the all-time high weekly close for ETH, we did not get that more brutal liquidation cascade until February, when we had firmly pushed through the highs, and I think it is more likely we see something like that occur closer to $6000.
ETH/BTC
Weekly:
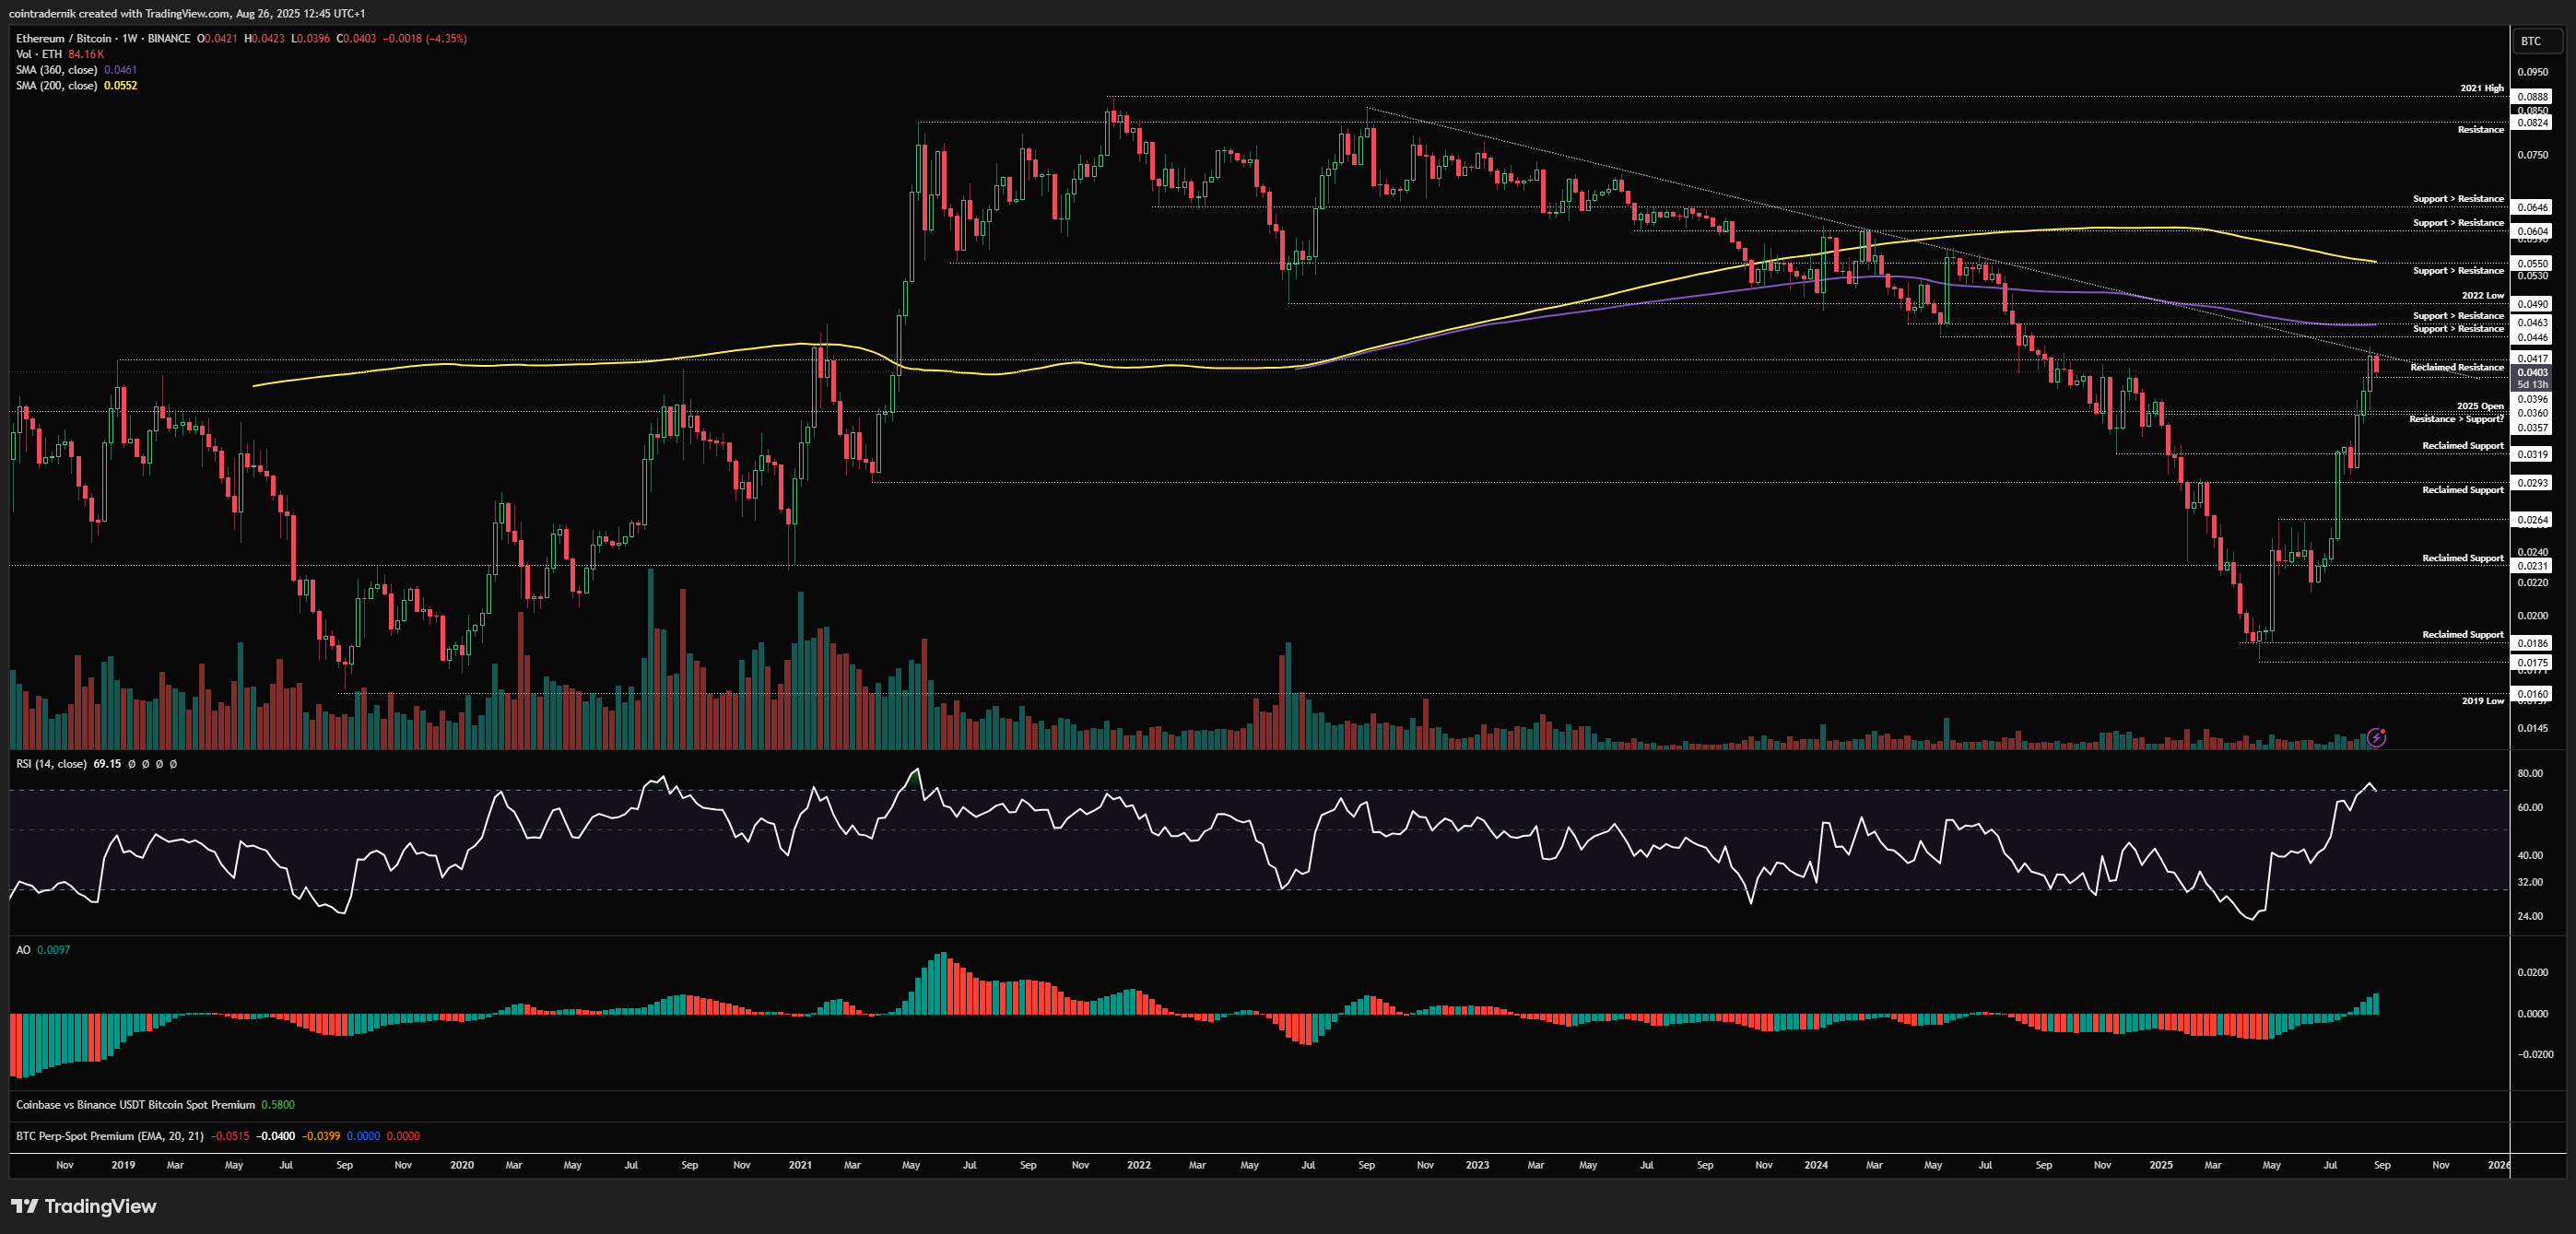
Looking at ETH/BTC on the weekly, as anticipated last week saw the pair rally at long last into the multi-year trendline resistance around 0.0417, closing the week marginally above that level but below the trendline. Weekly structure and momentum remain bullish here with no trend exhaustion at present, but I would not be surprised to see the pair pull back here to form a higher-low before breaking through the trendline and moving higher. If we do close above the trendline, it is likely the pair pushes towards the 2022 lows at 0.049 followed by the 200wMA at 0.055. Not much else to add on this timeframe.
Daily:

Looking at the daily, we can see again that momentum is waning a touch into these highs but resistance continues to be flipped as support and so structure remains bullish. We pushed into 0.0417 and then rejected, but price is currently holding above prior resistance at 0.0397. If this level holds, and price then breaks through 0.0417, turning the trendline into support, I would expect to see another leg higher into 0.049 from there. If we reject and break lower, the first level of interest is obviously a sweep of last week's low into the 2025 open at 0.036, but I could see a flush below that level on a wick reaching towards 0.033 before marking out a major low. In any case, unless we flip the yearly open into resistance on this timeframe, daily structure is bullish.
Receive the latest updates directly to your inbox

Price: $3379
Weekly:
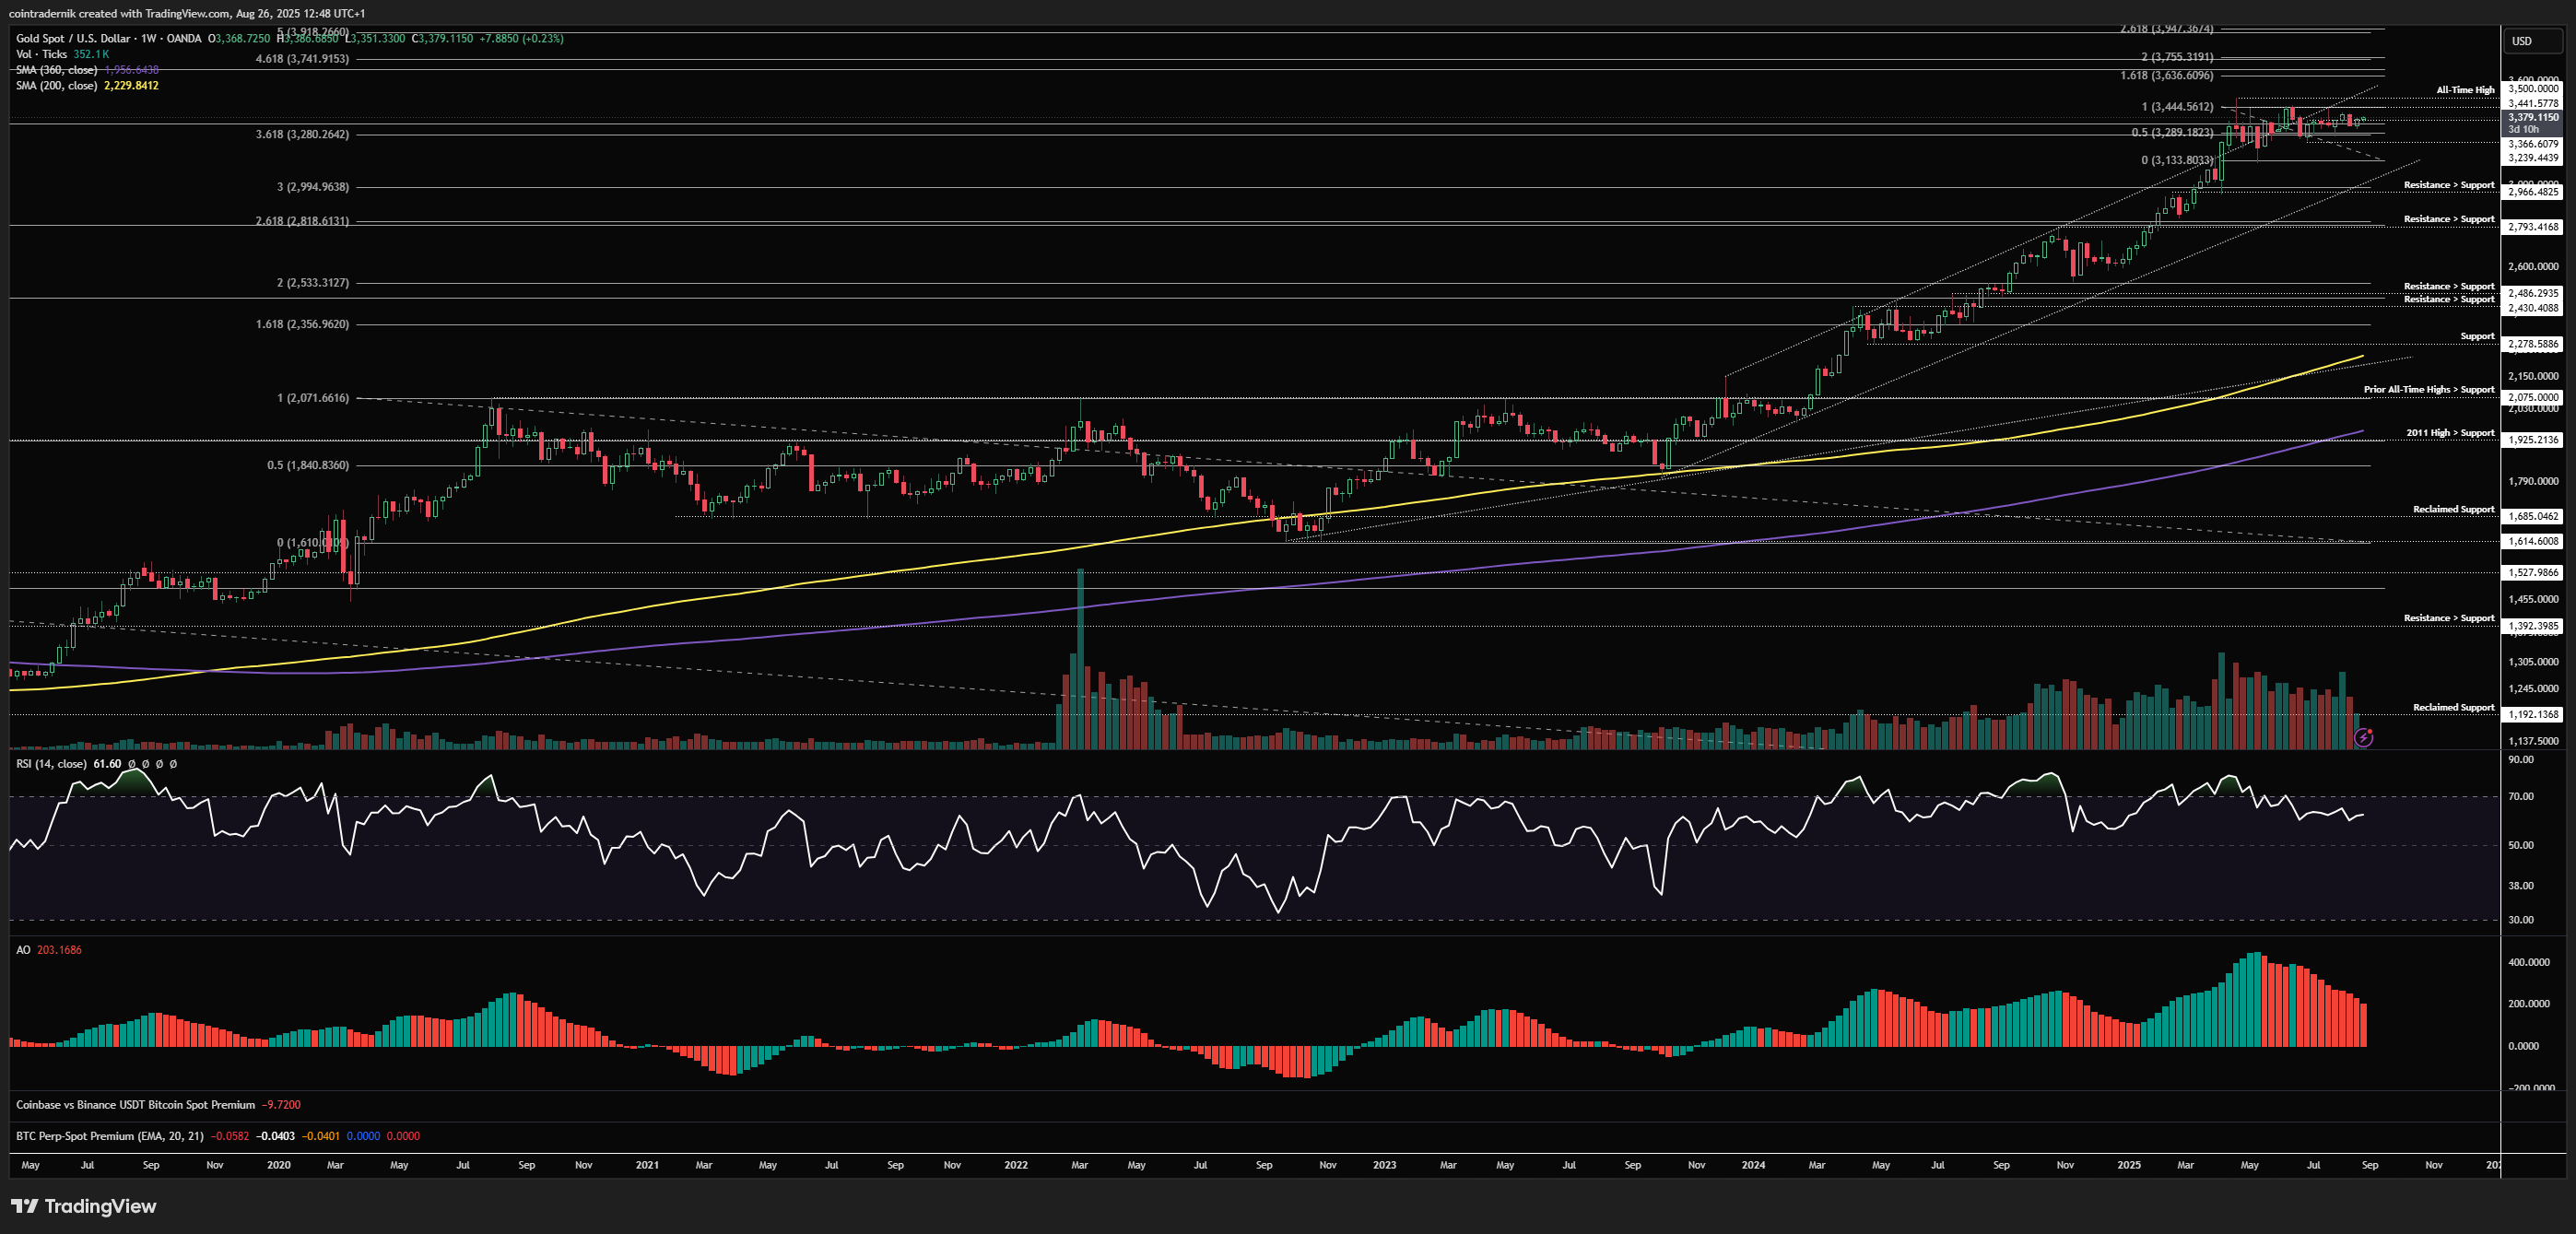
Beginning with the weekly for Gold, we can see that price continues to consolidate within the range below $3444 as it has done for months, with weekly momentum having reset from the highs and price now making higher-lows on any moves lower. As mentioned a few weeks ago, whilst $3444 is capping price, I do not expect anything beyond boring sideways chop for Gold, but I also mentioned that I no longer expect the second leg lower through $3133 into $29xx. The reason I changed my mind was because of my forward expectations for the Dollar, which after the multi-week short squeeze reverted to bearish into year-end. This view remains, and I am expecting continued consolidation for Gold that leads to expansion through range highs into fresh all-time highs as opposed to a major correction from here. This view hinges on DXY breaking below 96 into September, and if instead we see the Dollar mark out another higher-low and then continue to squeeze short positioning I will change my bias and look for Gold breaking $3240 as confirmation of another leg lower. Acceptance above $3444 = $3636.
Daily:
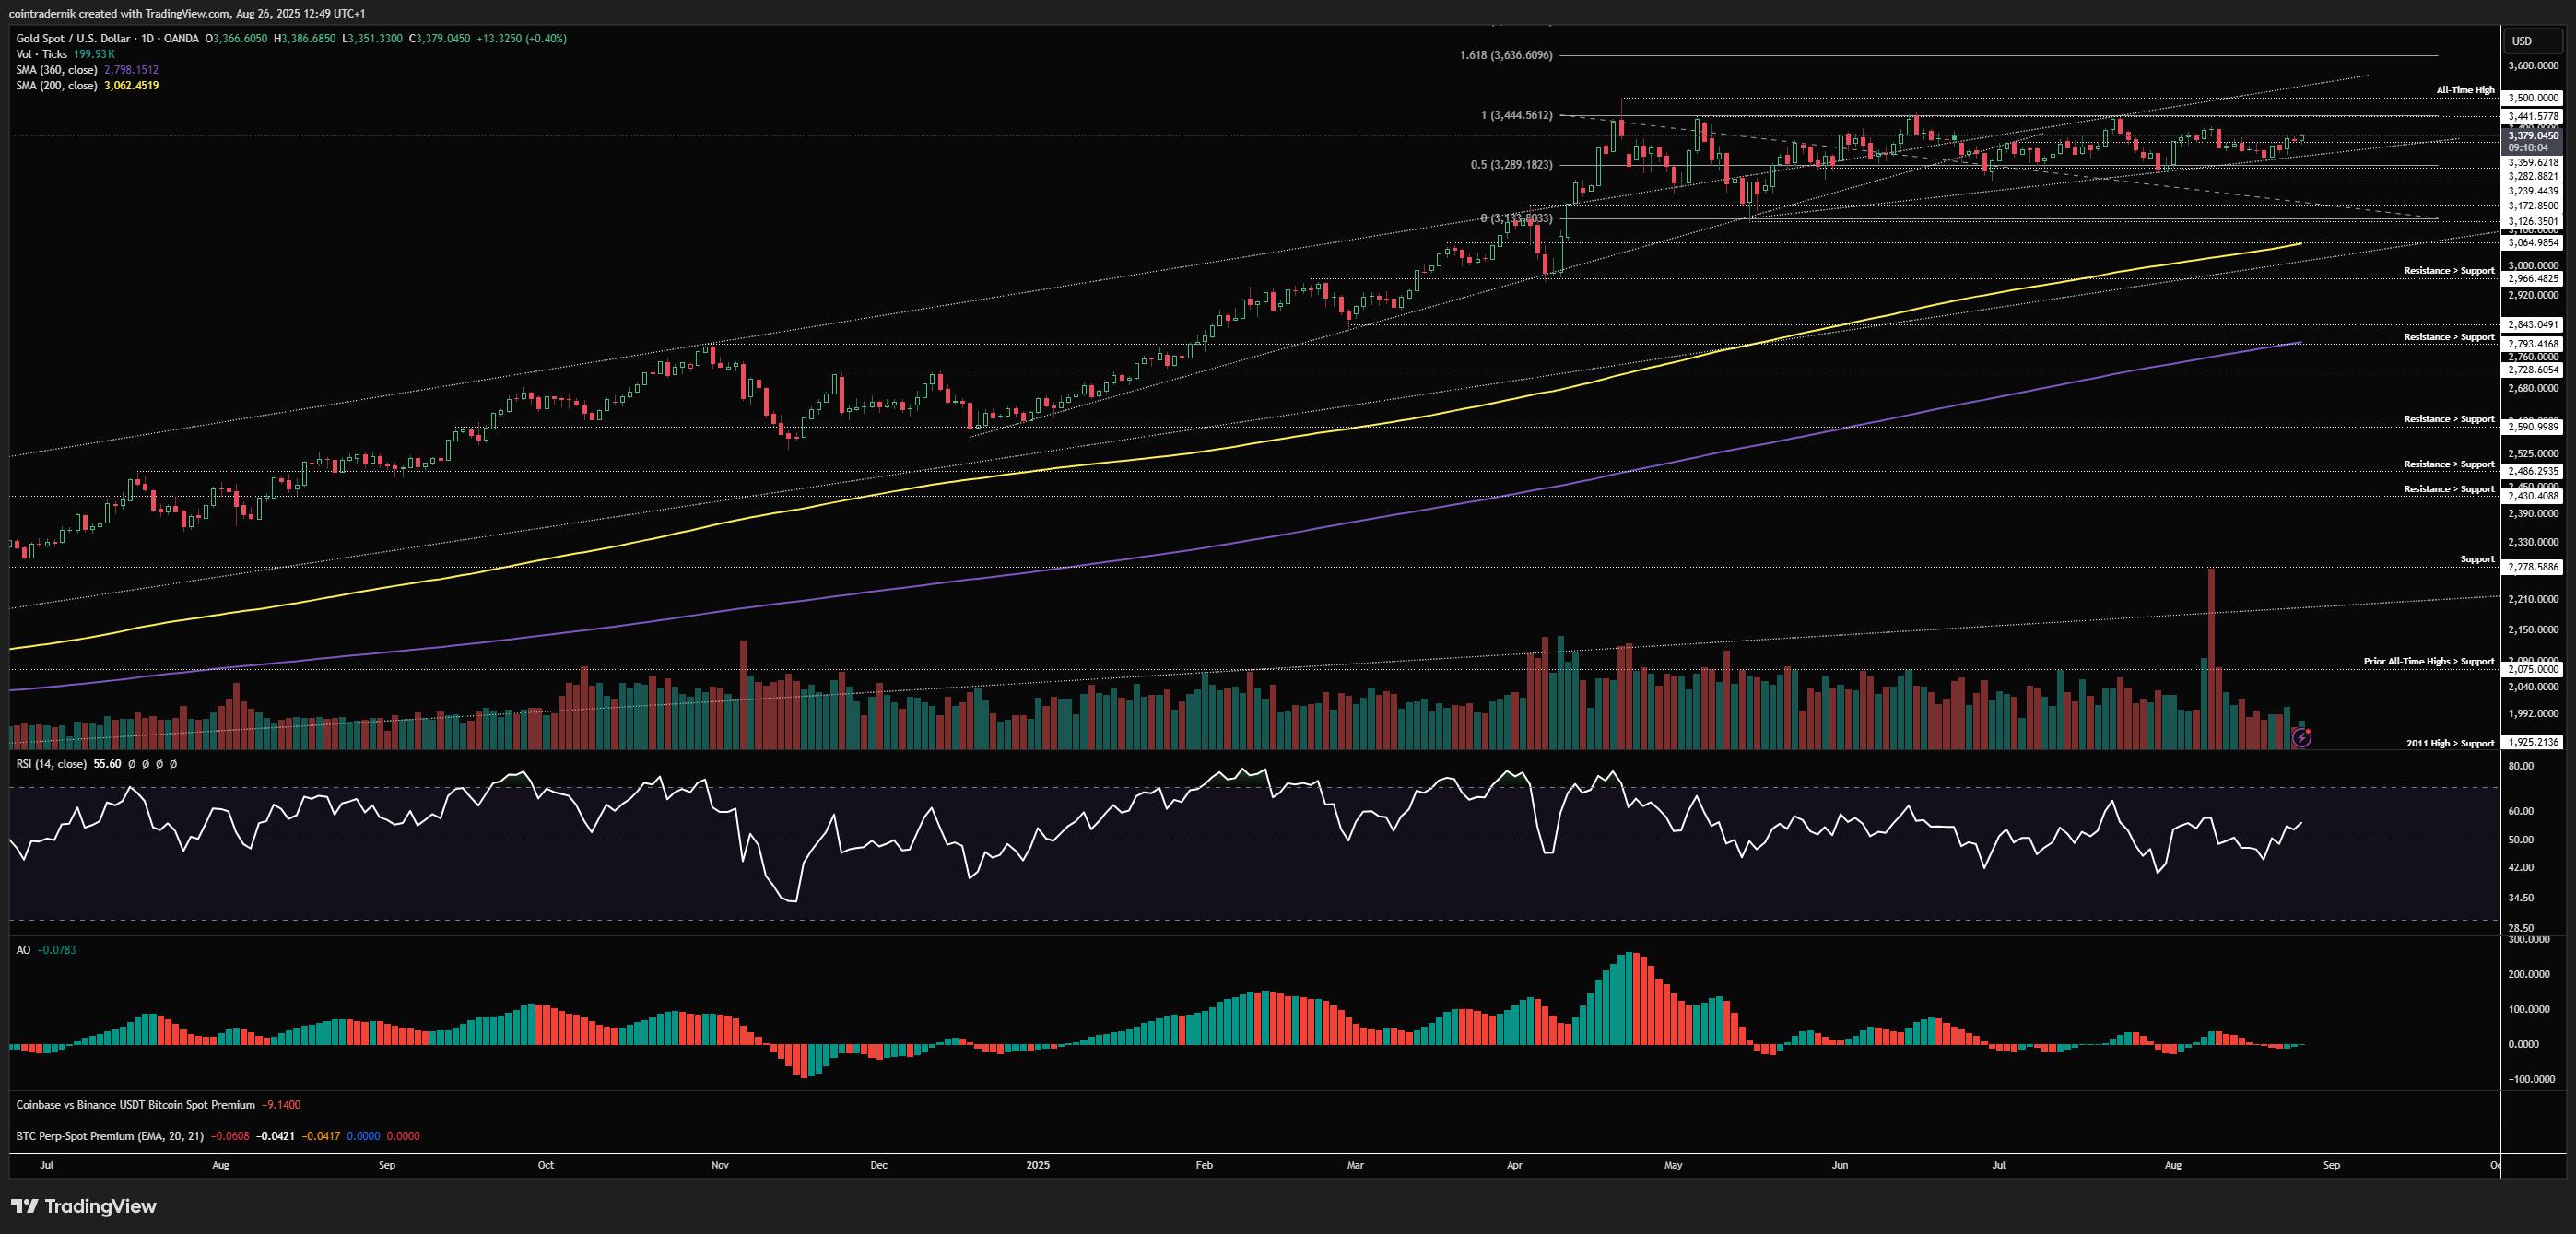
Looking at the daily, we have higher-lows forming into $3444 as major resistance, in a sort of ascending triangle. Often what we see is a false breakdown below these triangle patterns before resumption of the trend and the real mover higher, and in that scenario we might expect $3282 to be swept and price to then push higher from there. Unless we see the Dollar break higher and Gold then turn $3239 into resistance, however, I am not expecting much more downside here. I think consolidation continues to be the more likely path, but when that $3444 level gets flipped into support I don't think you want to fade that and we likely begin another leg higher from there. The 200dMA is also now slowly but surely moving higher and playing catch up, similar to the Q4 2024 range for Gold, so I do think the expectations of a $29xx print is meaningfully lower now.
Price: $97.7
Weekly:
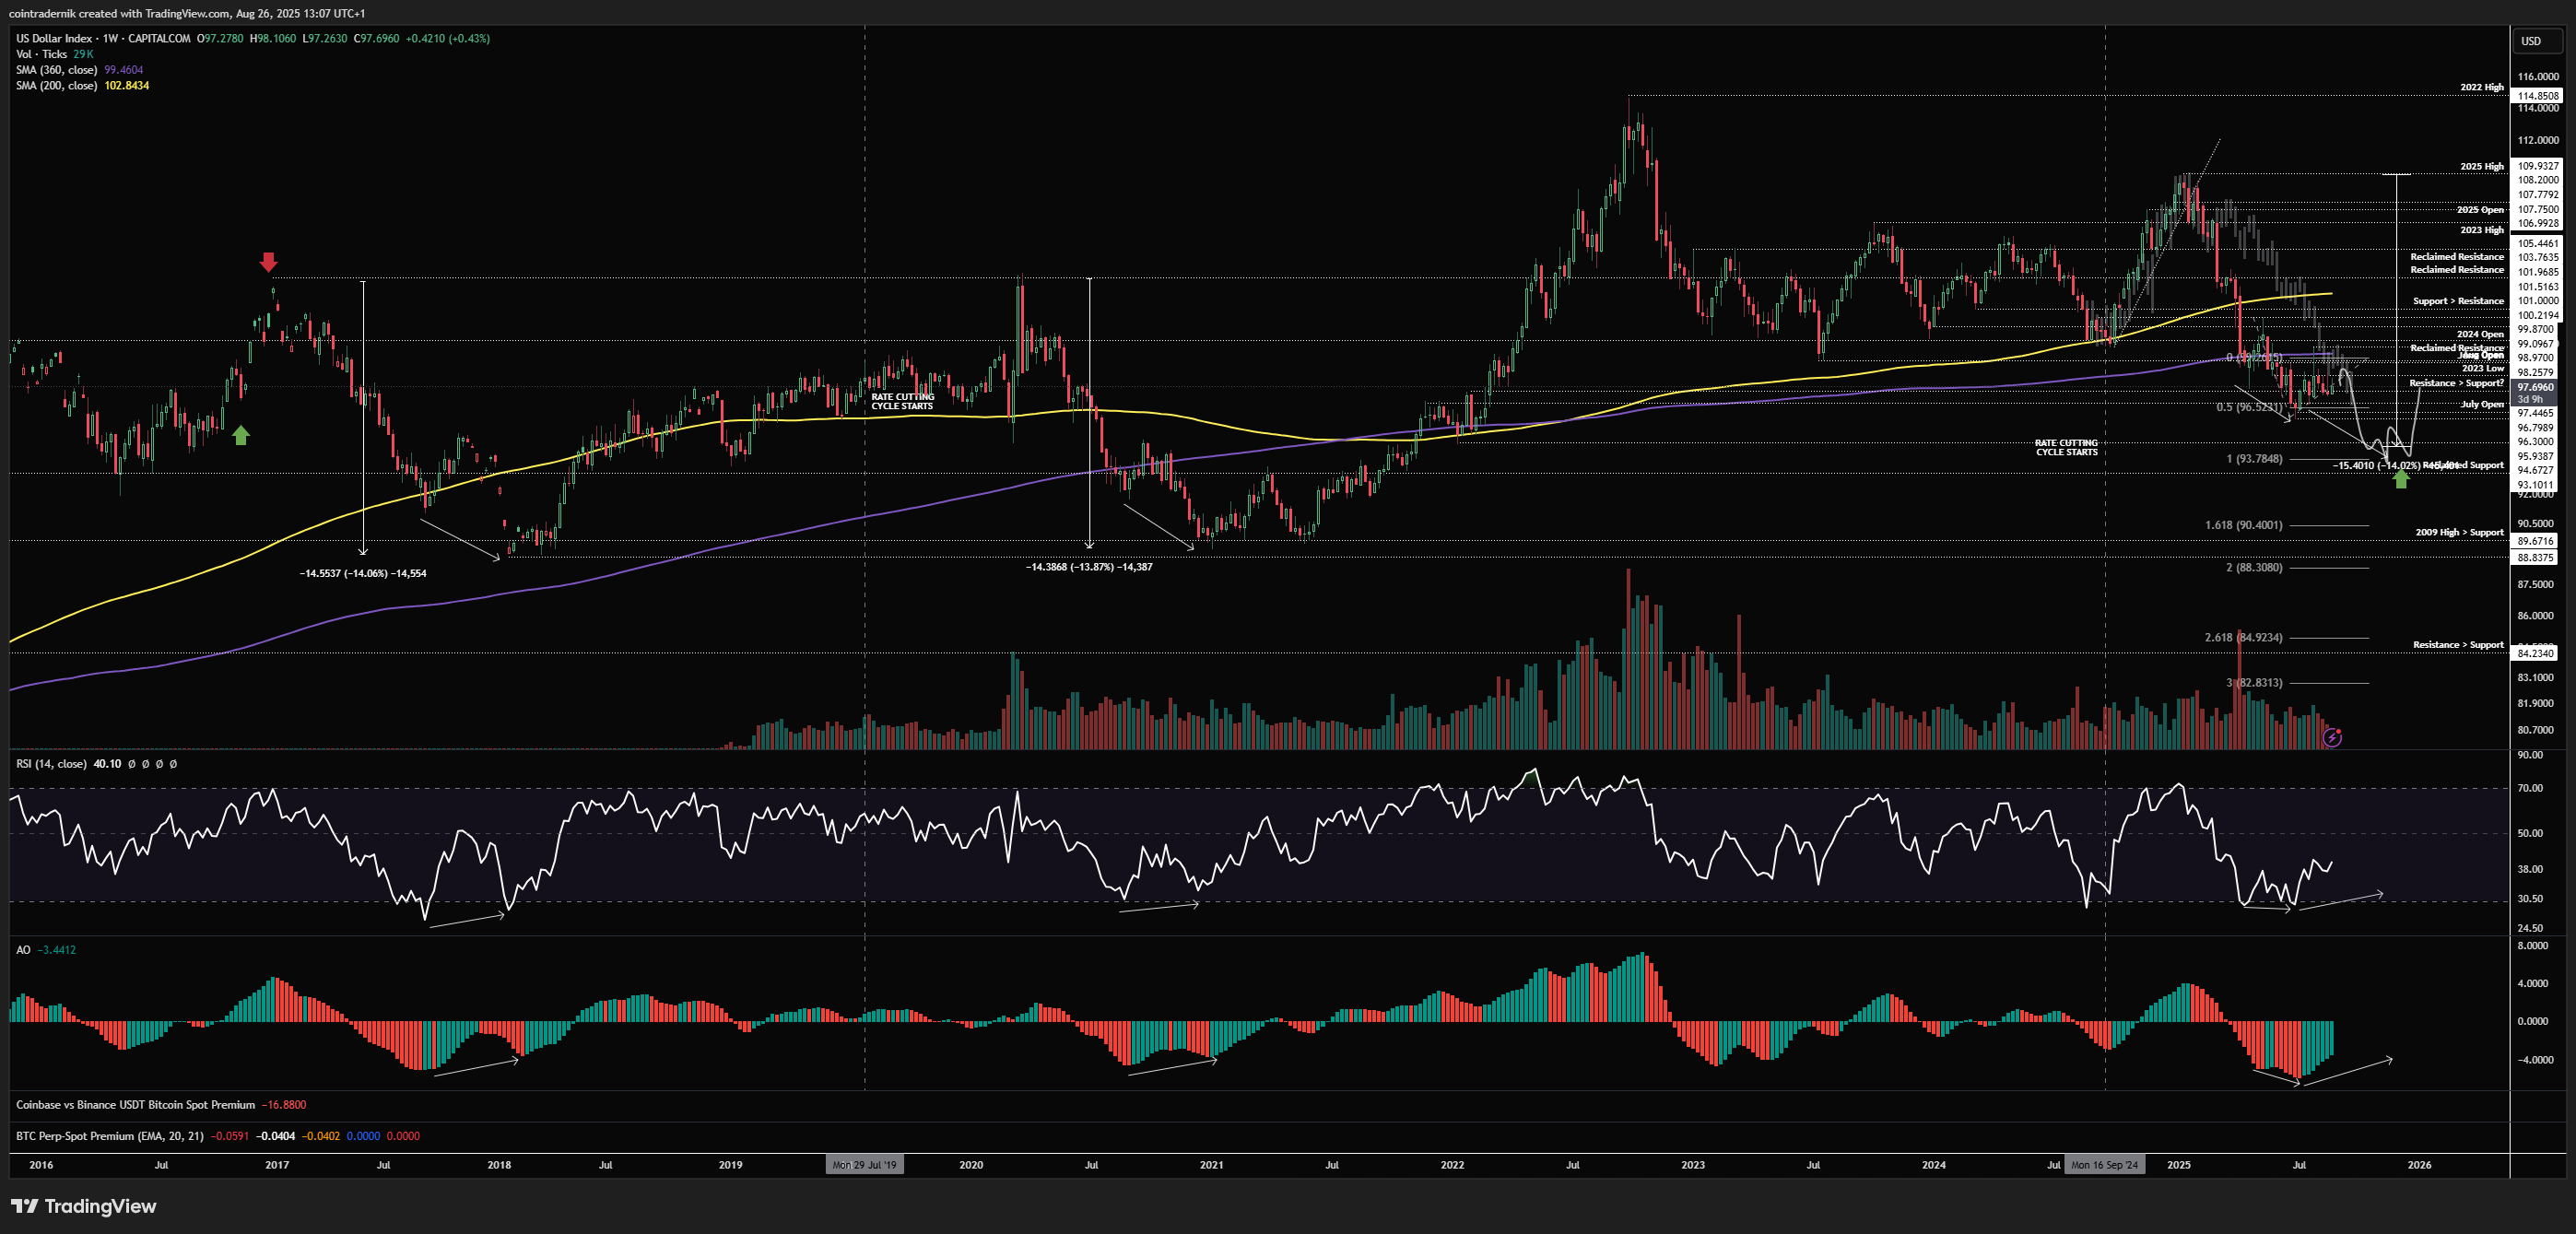
Beginning with the weekly, we can see that DXY wicked into the 360wMA and rejected a few weeks ago, but remains in this consolidation pattern above yearly lows but below historical range support turned resistance. Unlike prior cyclical lows, we did not see trend exhaustion into the bottom a couple of months ago, which is why my expectation was that a positioning-related short squeeze would ultimately fail to reclaim the range and lead to one (likely final) leg lower, If this is to be the case, we should see the 100 handle continue to cap rallies and DXY break lower from here through 96 towards 94, which would be an equivalent ~14% drawdown from the 2025 high to prior cycles. Not that these cyclical bottoms on the Dollar are going to perfectly align, but it's something to keep an eye on. If we do get that next leg lower, what you are looking for is trend exhaustion into the lows on this higher timeframe, from which we are then likely to mark out a major bottom and begin a sustained reversal into 2026. If this time is different, the next leg lower will see weekly momentum also make fresh lows and price accept below 94, opening up another leg down into 89 - the GFC highs turned support on both the 2017 cycle low and the 2020 cycle low. Reclaiming the overhead range support at ~100 would invalidate this view of another leg down in Q4.
Daily:
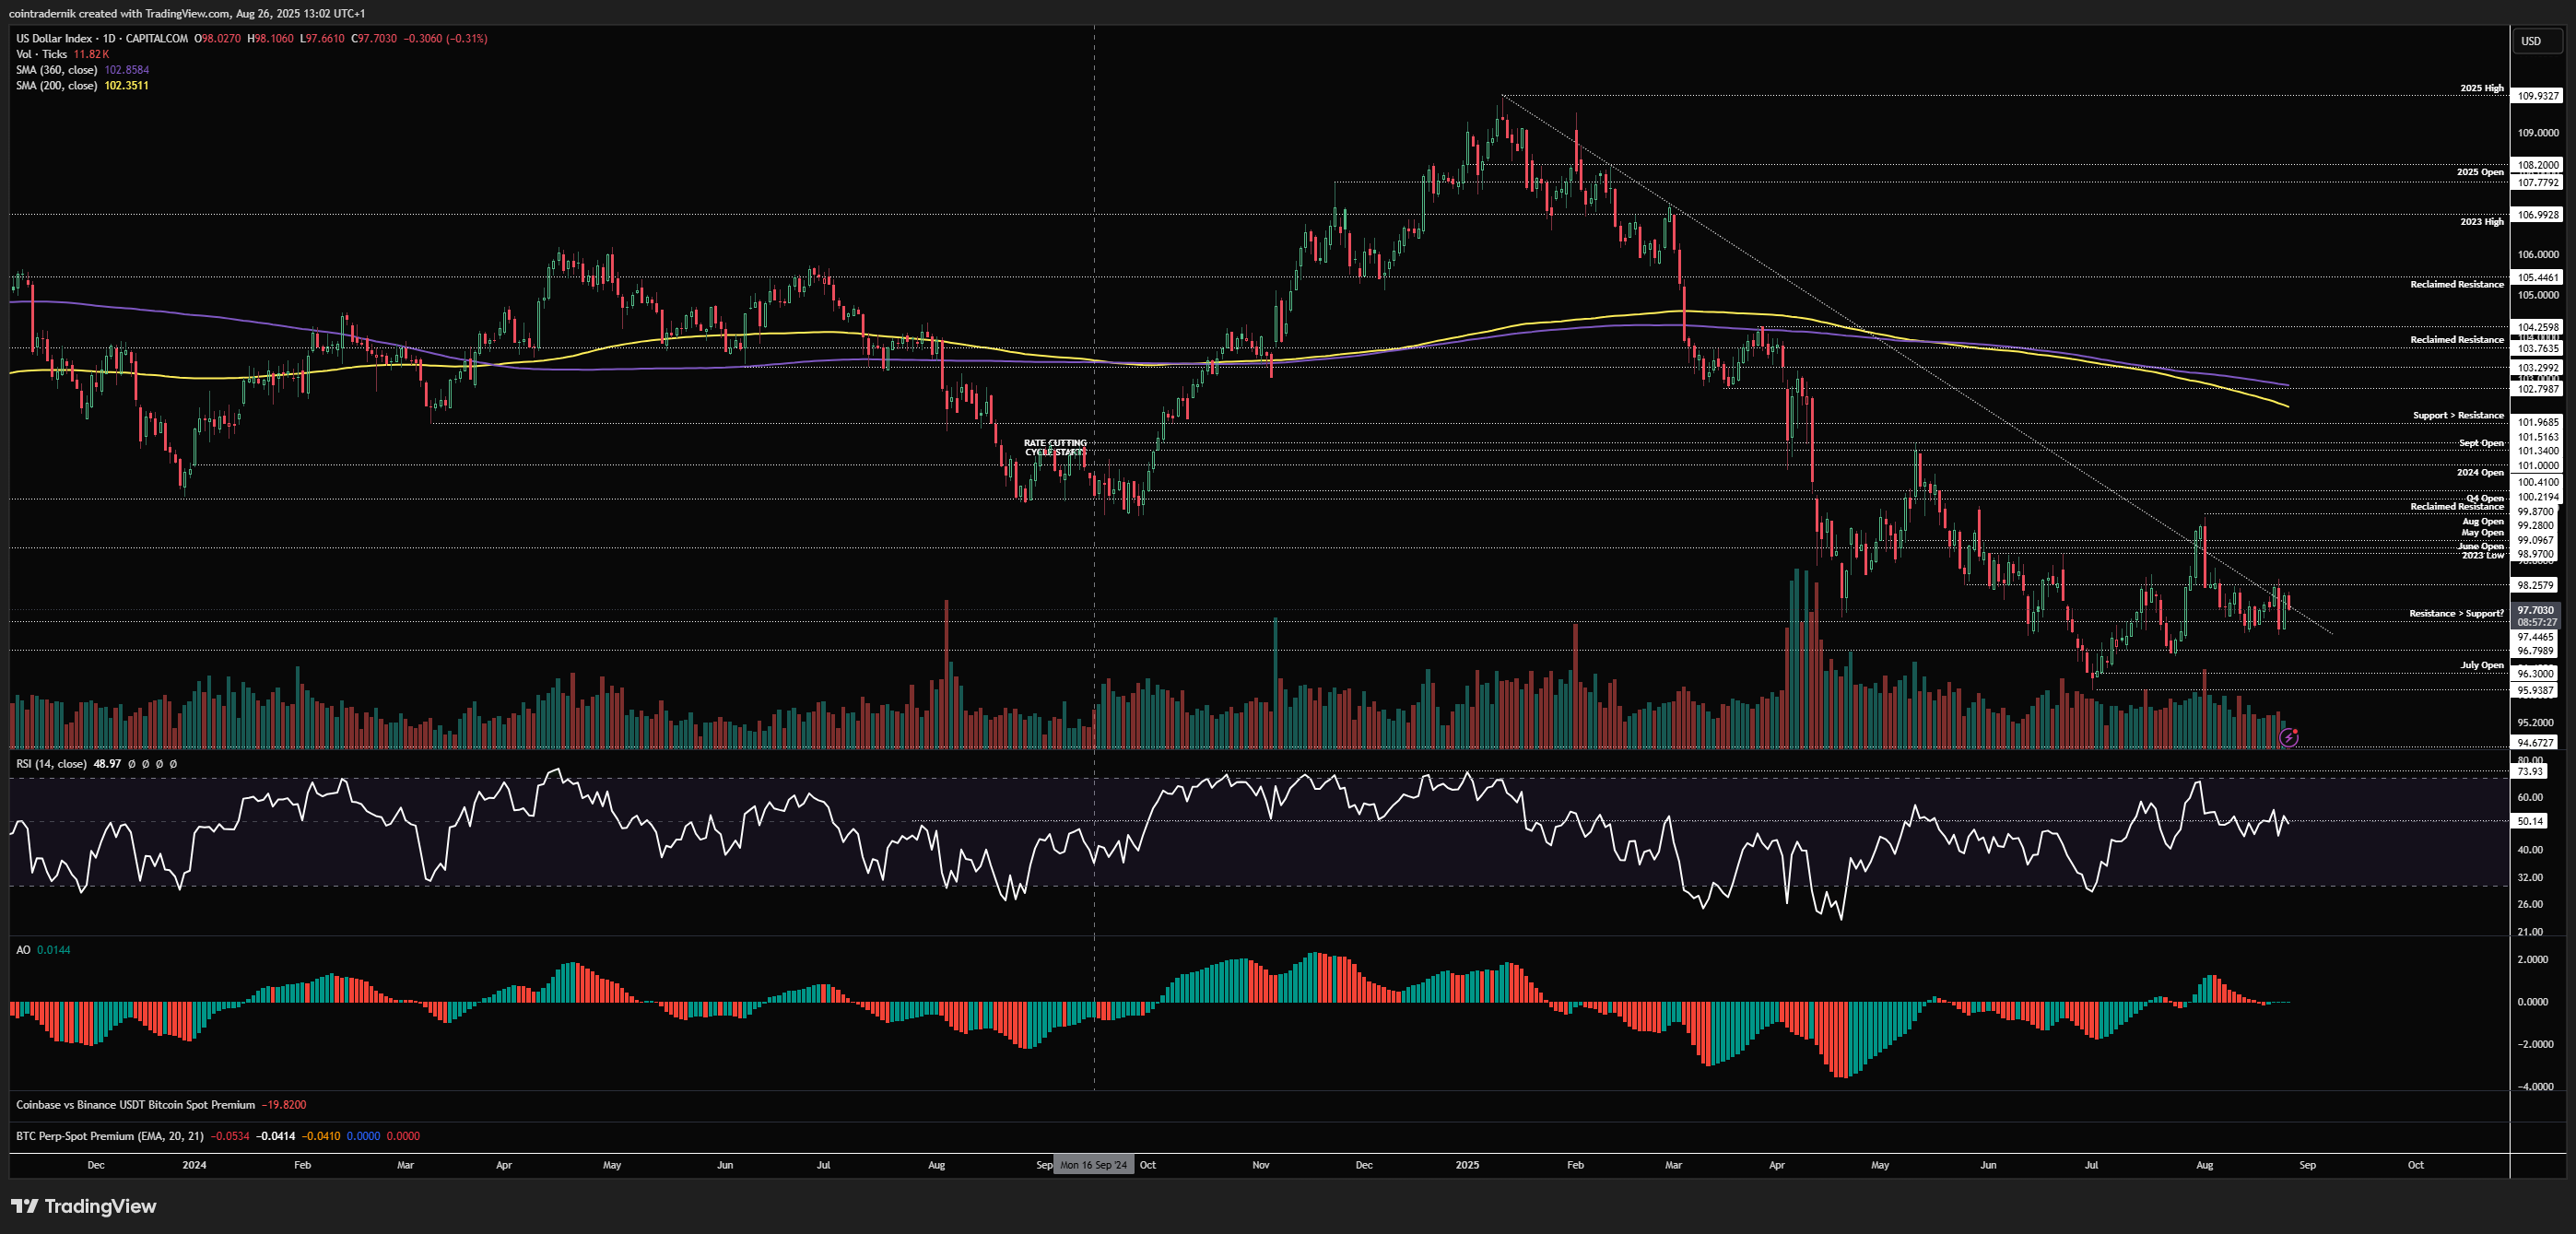
Looking at the daily, we can see that price faked out above trendline resistance from the yearly highs then rejected and turned lower, now consolidating right around prior resistance turned support at 97ish. We pushed higher into 98.3 last week and then rejected on Powell's dovish pivot (relative to consensus expectations), but we have since retraced most of that move and price is contending with the trendline again, trapped in this range between 07 and 98.3. Acceptance above 98.3 would open up another test of that 100 handle and a deeper short squeeze, where acceptance back inside the multi-year range would confirm a more significant bottom for DXY. Rejection here this week and a break below last week's low leads to that next leg lower over the coming weeks, in my view, with a daily close below 96.8 opening up fresh lows through 96 and beyond. Daily RSI here is suggesting momentum has turned to the downside, for what it's worth.
Price: $6434
Weekly:

Beginning with the weekly for SPX, we can see that price wicked lower last week into the August open at $6341 but bounced hard to close the week at an all-time high weekly close of $6472, but marginally below the all-time high of $6489. If we are to break higher from here, that August open should now hold as a low and price should close this week through $6489, opening up the next leg higher. On this higher timeframe, there is no major technical resistance all the way into that big $7000 level, which would be the 1.618 extension of the Tariff crash, but I would expect some pull-backs en route to that level. If we are bearish here and last week's close was a trap, we should move below August open this week and close below $6341, opening up that more typical September pull-back towards the prior all-time highs at $6150 as the first level of interest.
Daily:
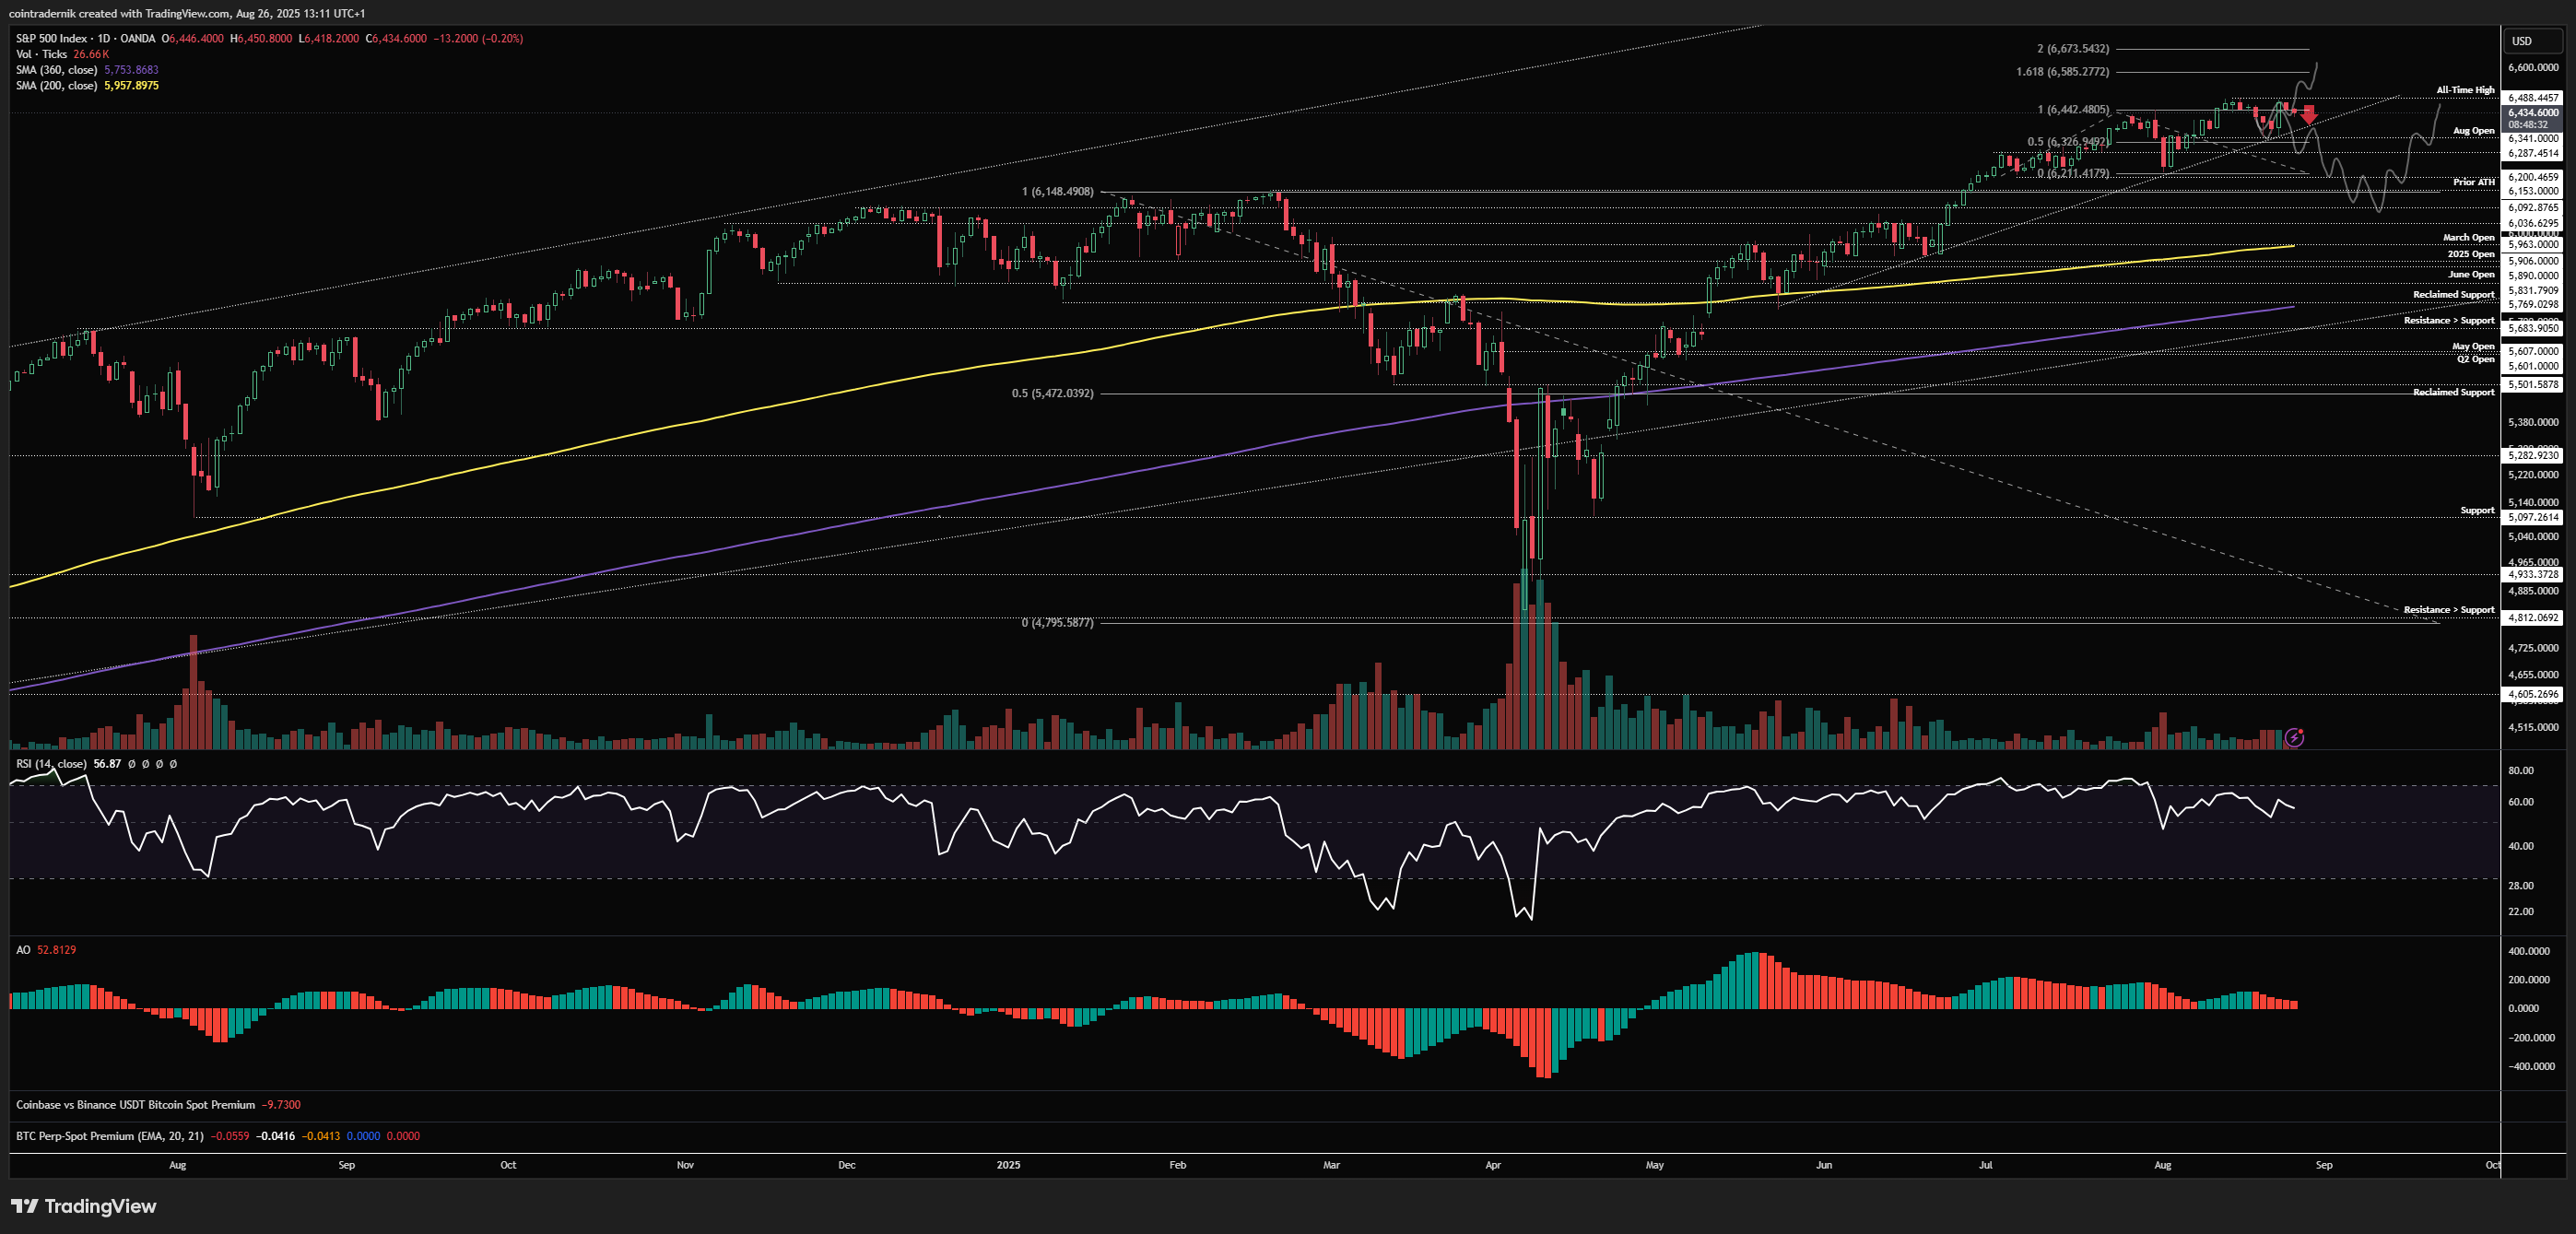
Finally, looking at the daily, we can see those trajectories from last week marked out here, with trendline support continuing to hold form now alongside the August open after that retest, and we should now see acceptance through all-time highs if we are to break seasonal weakness and move higher into the 1.618 extension of the current trend at $6585, where we may find some resistance. As mentioned above, if this is a trap, we will see rejection this week and a break and close below trendline support and the August open, leading to a multi-week correction towards $6150, followed by $6092 and potentially as low as the 200dMA. In that scenario, I fully expect us to be back at the highs in October, to be honest, as there continues to be a huge wall of worry in equities despite price-action.
I hope you've found some value in the read this week!
And if you've not already signed up for Ostium, please do so and test out some of the recent updates, including:
Sign up here (you don't have to use my ref link, of course): https://ostium.app/trade?from=CL&to=USD&ref=CTNIK

.avif)