

Market Outlook #84
May 31, 2026
-
12
min read


This blog references an opinion and is for entertainment and informational purposes only. It is not intended to be investment advice. Seek a duly licensed professional for investment advice.
In this 84th edition of the Market Outlook here at Ostium Insights, we'll be taking a look at the week ahead in markets, looking at price-action, positioning and event risk for Bitcoin, USDJPY, AUDUSD, Silver and WTI.
Trade and earn double points this week on BTC, SPX, USDJPY, XAU and WTI at Ostium: https://ostium.app/trade?from=CL&to=USD&ref=CTNIK
Let's first take a look at the very busy week ahead on the macro calendar, particularly relating to growth and the labour market:
MONDAY: US ISM MANUFACTURING PMI (MAY): (CONSENSUS 52.6 VS PREVIOUS 52.7)
TUESDAY: US JOLTS JOB OPENINGS (APR): (CONSENSUS 6.87M VS PREVIOUS 6.866M)
TUESDAY: BOE GOVERNOR BAILEY SPEECH
WEDNESDAY: BOJ GOVERNOR UEDA SPEECH
WEDNESDAY: US ADP EMPLOYMENT CHANGE (MAY): (CONSENSUS 116K VS PREVIOUS 109K)
WEDNESDAY: US S&P GLOBAL COMPOSITE PMI (MAY): (CONSENSUS 51.7 VS PREVIOUS 51.7)
WEDNESDAY: US ISM SERVICES PMI (MAY): (CONSENSUS 53.6 VS PREVIOUS 53.6)
WEDNESDAY: US FED'S BEIGE BOOK
THURSDAY: ECB PRESIDENT LAGARDE SPEECH
THURSDAY: US INITIAL JOBLESS CLAIMS: (CONSENSUS 211K VS PREVIOUS 215K)
FRIDAY: US NONFARM PAYROLLS (MAY): (CONSENSUS 96K VS PREVIOUS 115K)
Now, let's dig into asset-specific price-action for the week ahead, looking firstly at Bitcoin:
Price: $73,564
Weekly:
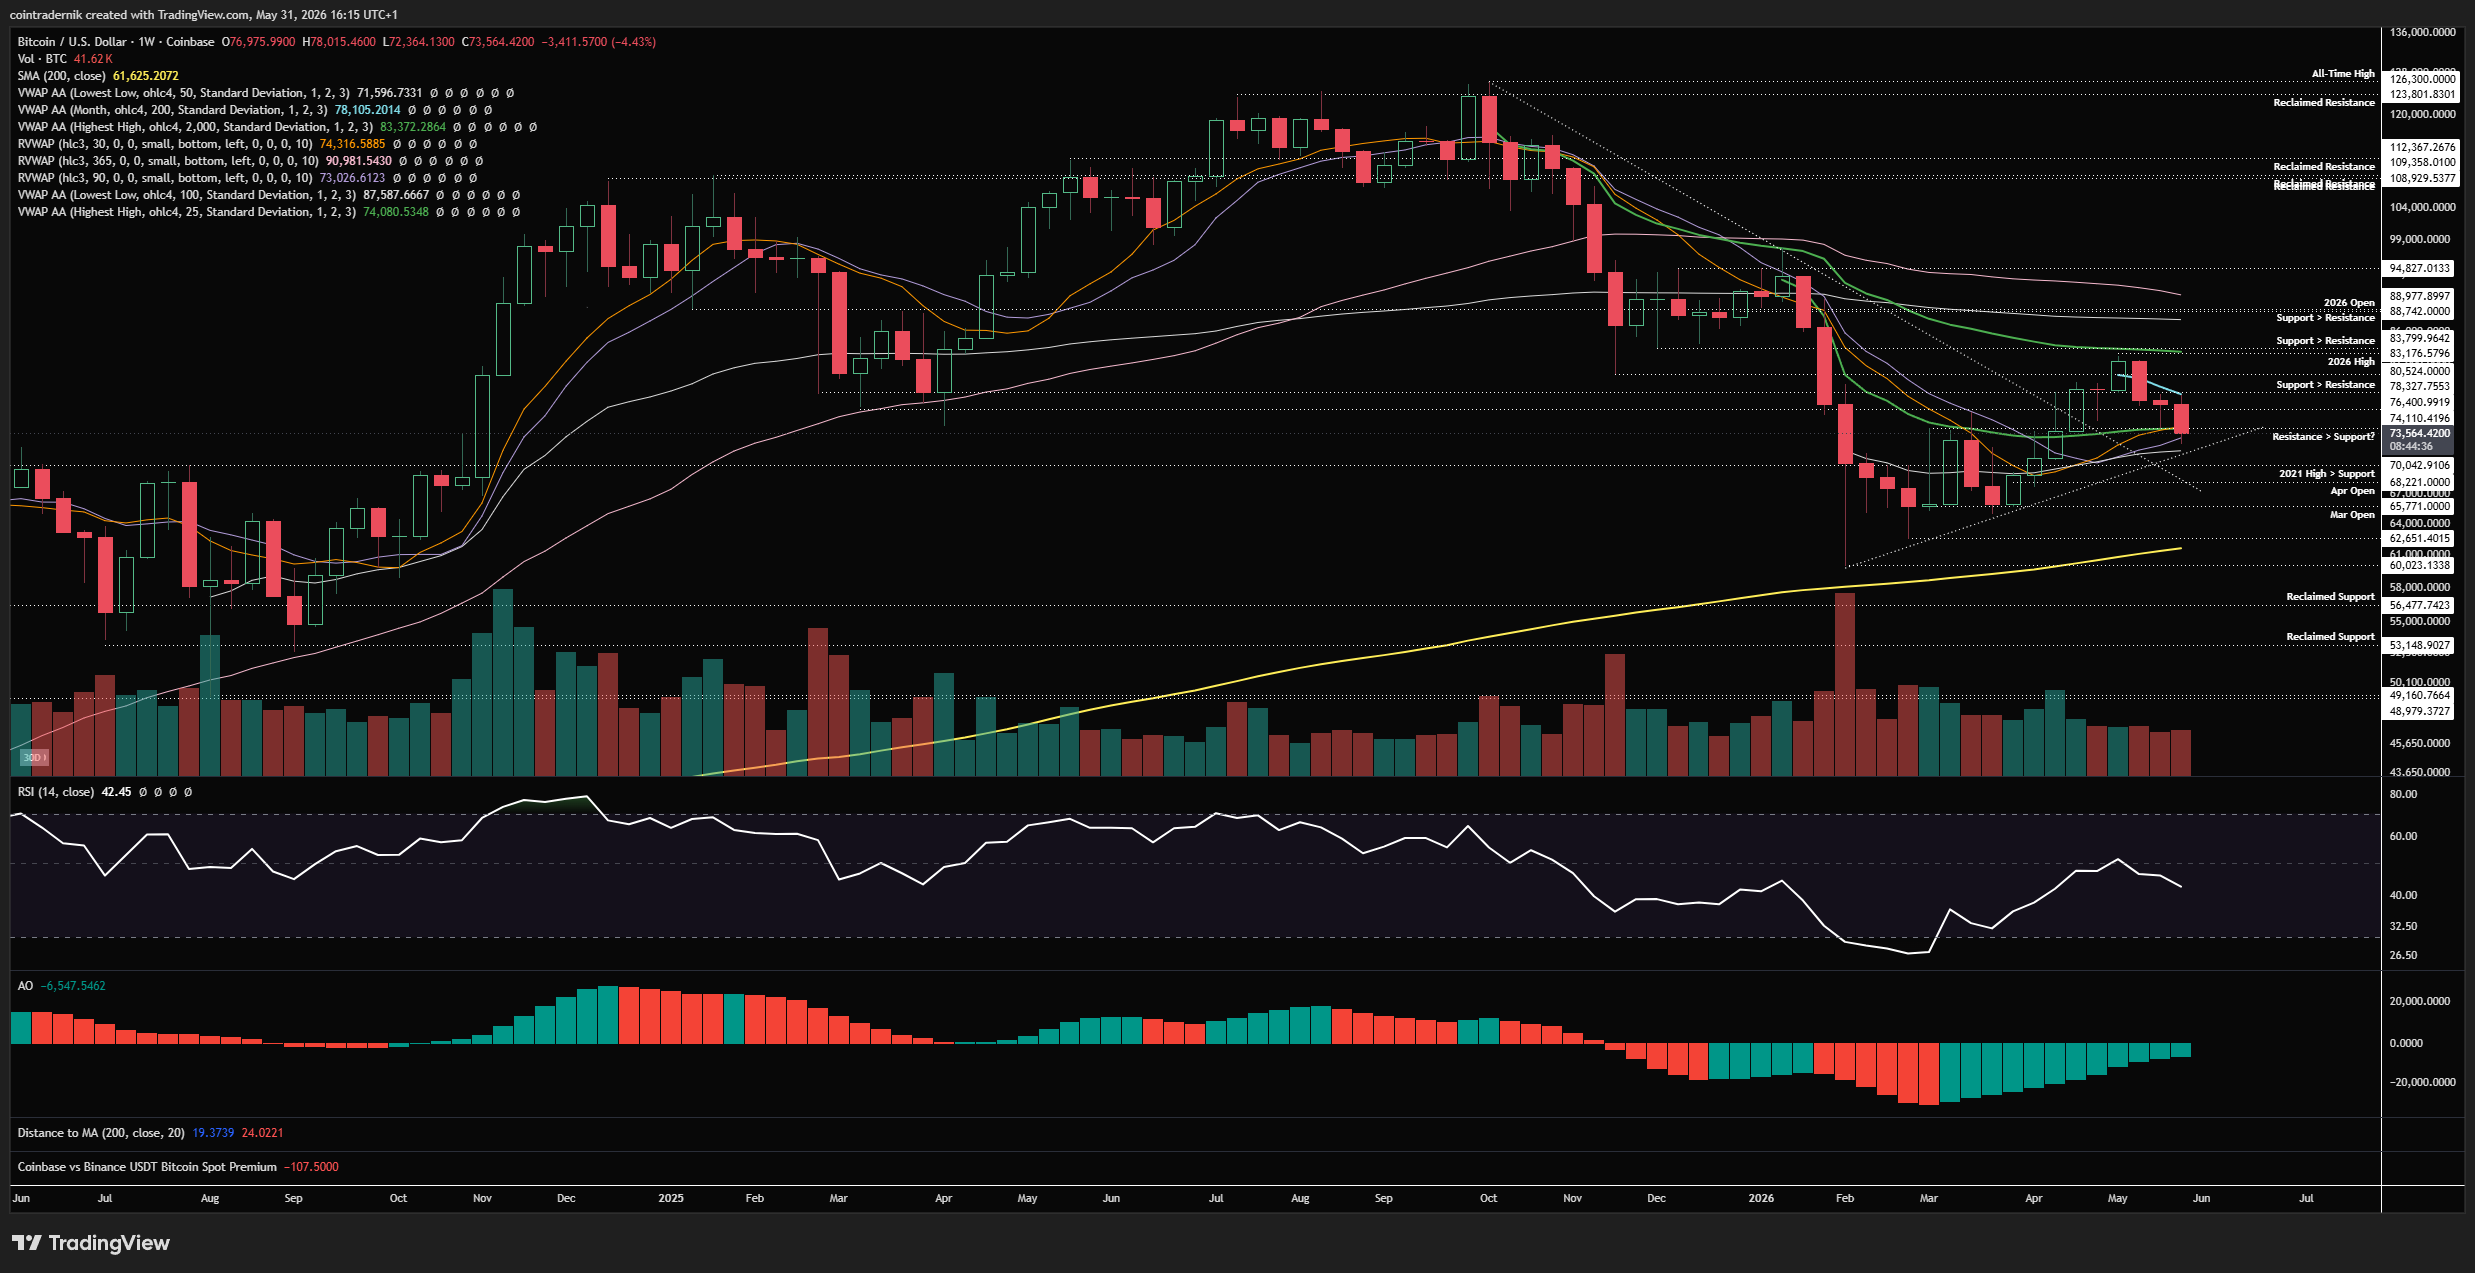
If we begin by looking at the weekly for BTC, we can see that price rejected at the anchored VWAP from all-time highs just shy of $84k, marking a swing-high as expect and then turning lower, retracing this past few weeks back into the 90d rolling VWAP at $73k, above which it is currently holding. We have trendline support below from the $60k low, as well as the anchored VWAP from that low, and I am currently expecting this confluence of support between $70k-$73k to become the next higher-low, within which I would not expect more than a deviation below that bottom end. If we accept back below $70k and flip it into resistance, the probability of continuation from here back towards the AVWAP from all-time highs for a second test becomes greatly diminished, and I would instead expect the 200wMA to be retested at $61.6k. Until we flip $70k into resistance, we should expect a higher-low to form, because weekly structure is bullish and we are above key VWAPs here. From there, assuming we hold this range as support, we should see price push above the May VWAP at $78k back into the $83.4k region, where I would expect the second test of the AVWAP from all-time highs to give way - above which, in my opinion and based on a lot of statistical evidence - we would be in a confirmed bull market on the path to new all-time highs. Whilst we remain below that, there remains a greater probability of further downside. I did rebuy some spot last week at $73.3k that I sold at $82.4k and will exit this if we flip $70k into resistance.
Daily:
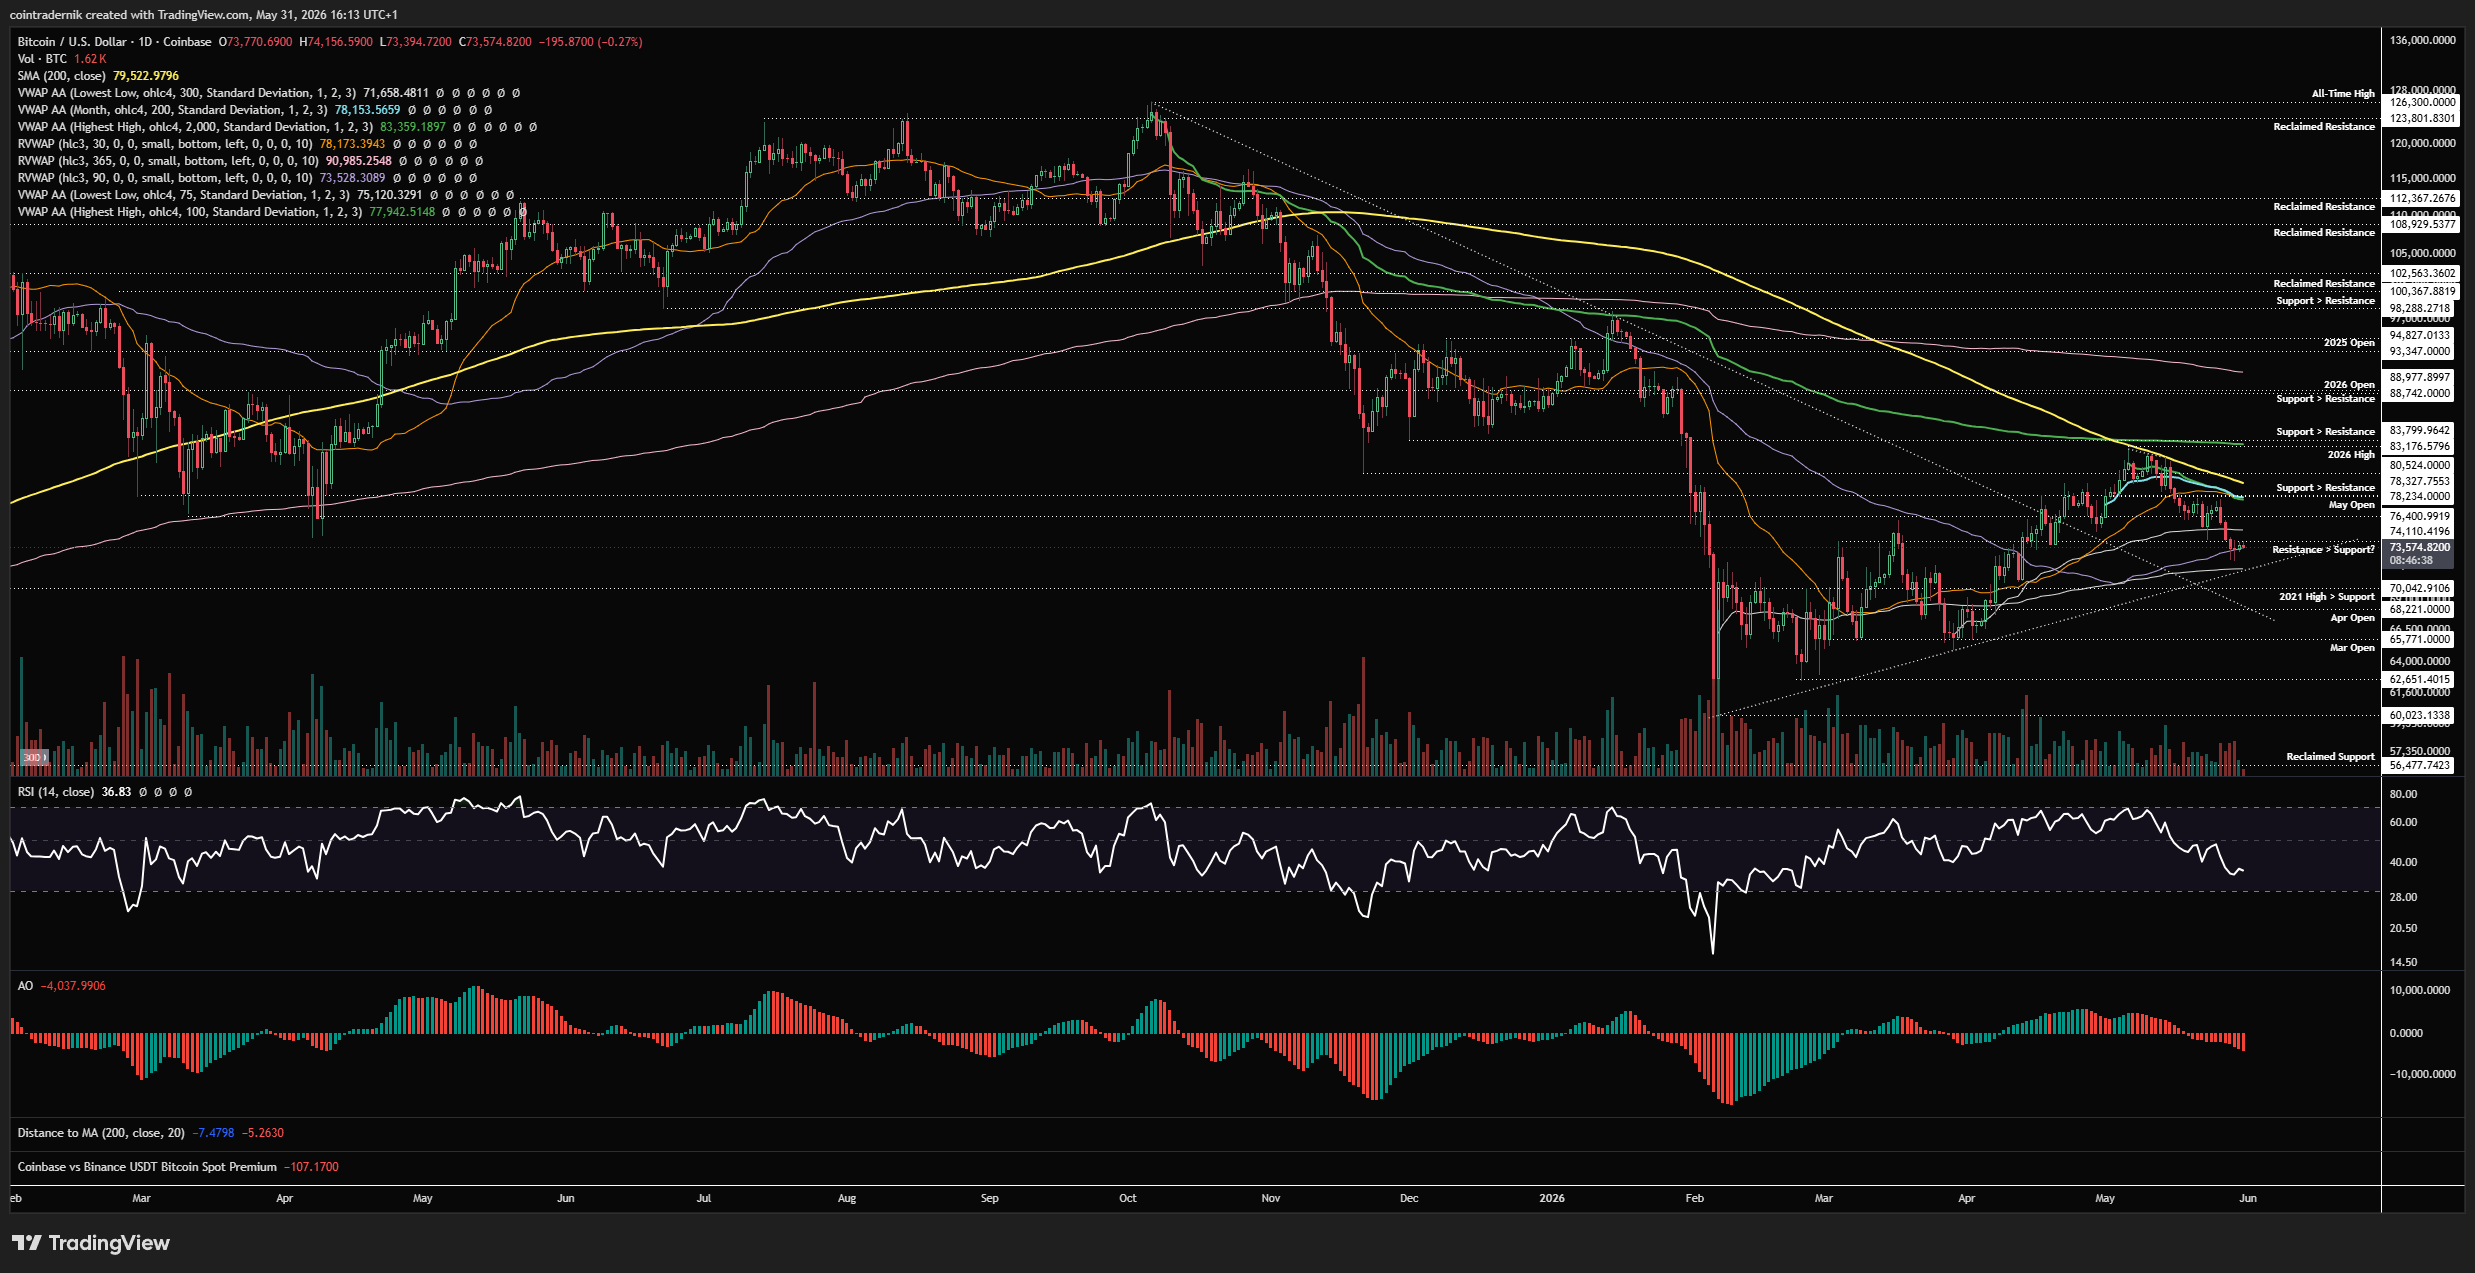
Turning to the daily, we can see that price is sat right a0orund the 90d rolling VWAP and above the anchored VWAP from the $60k low, as well as that trendline support, with momentum back towards the lows but with no trend exhaustion as of yet. As someone who is actively looking for the formation of a higher-low, I would love to see one more push lower towards $70k and some trend exhaustion to form early in June, from which price then marks out that bottom and pushes higher, reclaiming the 90d rolling VWAP as support: that would be the clearest sign for me that a higher timeframe bottom is in and we are headed back to the 80s. Acceptance below $70k = no bueno and those lows at $65.8k come into view as a first target for downside, followed by low 60s. I remain firmly in the camp that even some further downside here is likely to be limited - and whilst I will cut my discretionary buys below 70, I would be looking to jump back in in the 62.5k area, as I do not expect a material break of the bottom of the range here. If you've been following some of the stuff I have shared on X, there is much that is stacking up in favour of higher prices into Q4 vs lower prices, but let's see what price-action gives us early in June. A fakeout below 90d rolling VWAP followed by a reclaim into the weekly close would be a good start.
Price: 159.23
Weekly:
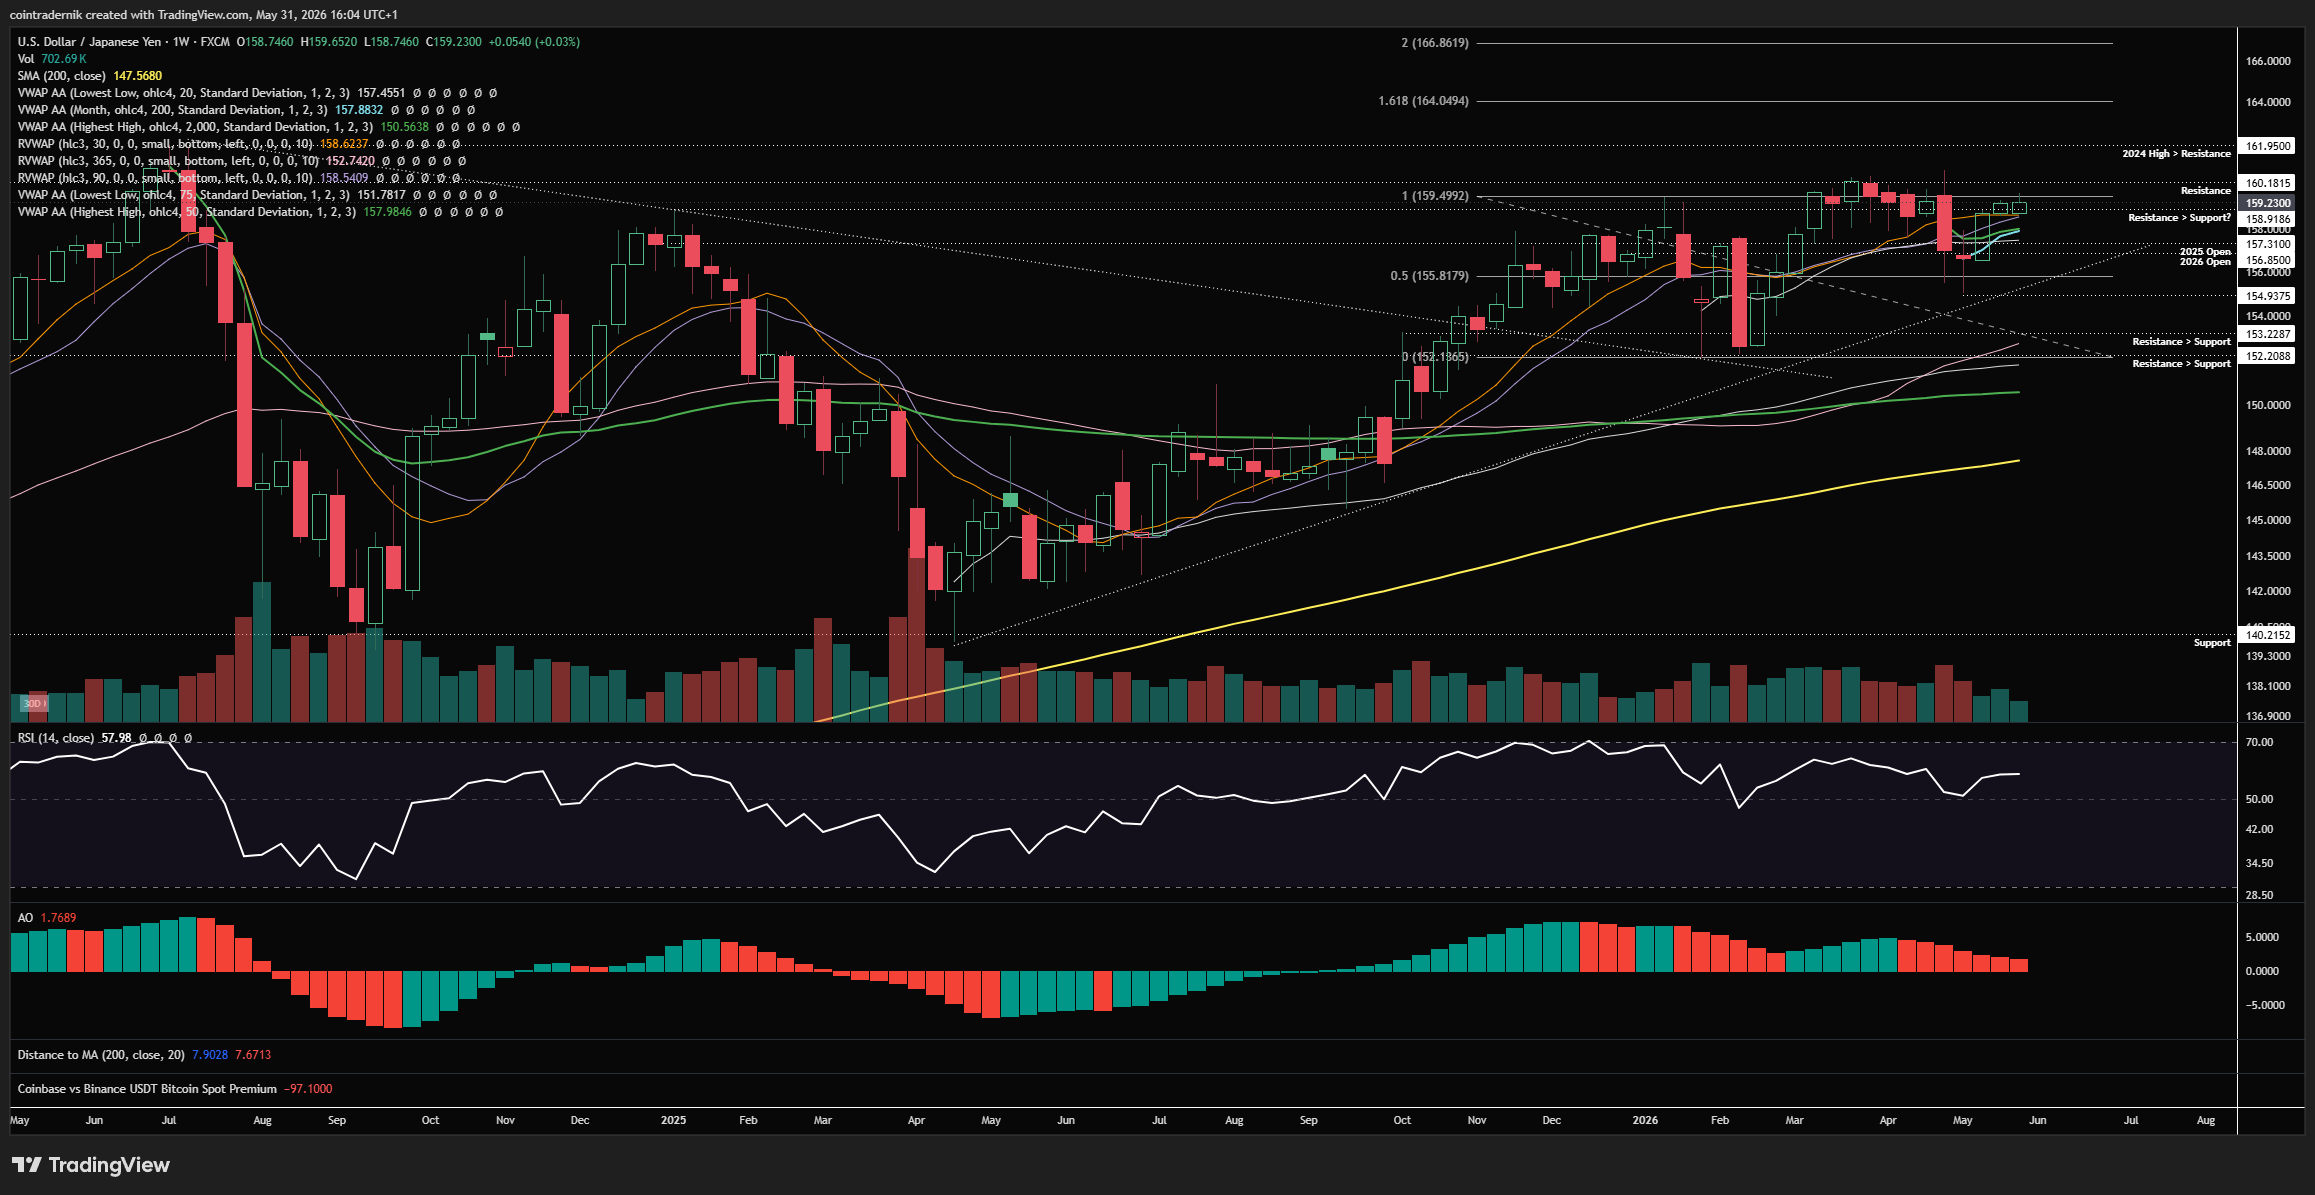
Looking at the weekly timeframe for USDJPY, we can see that price is consolidating above all the key VWAPS but right at multi-month resistance again at 160, having marked out another higher-low above long-term trendline support and held above 50 on weekly RSI. We are in a bit of a no man's land here with regards to positioning, as technically we have an uptrend, bullish structure and momentum, and support being found above the yearly open and the rolling VWAPS - but we are also pressing right up against the level where the intervention card gets played, albeit with diminishing returns. I would prefer to be long back near trendline support after some intervention, or on a clean break above 160, given how long this level has held as resistance, where 2024 highs at 162 become the final level of resistance before escape velocity above that.
Daily:
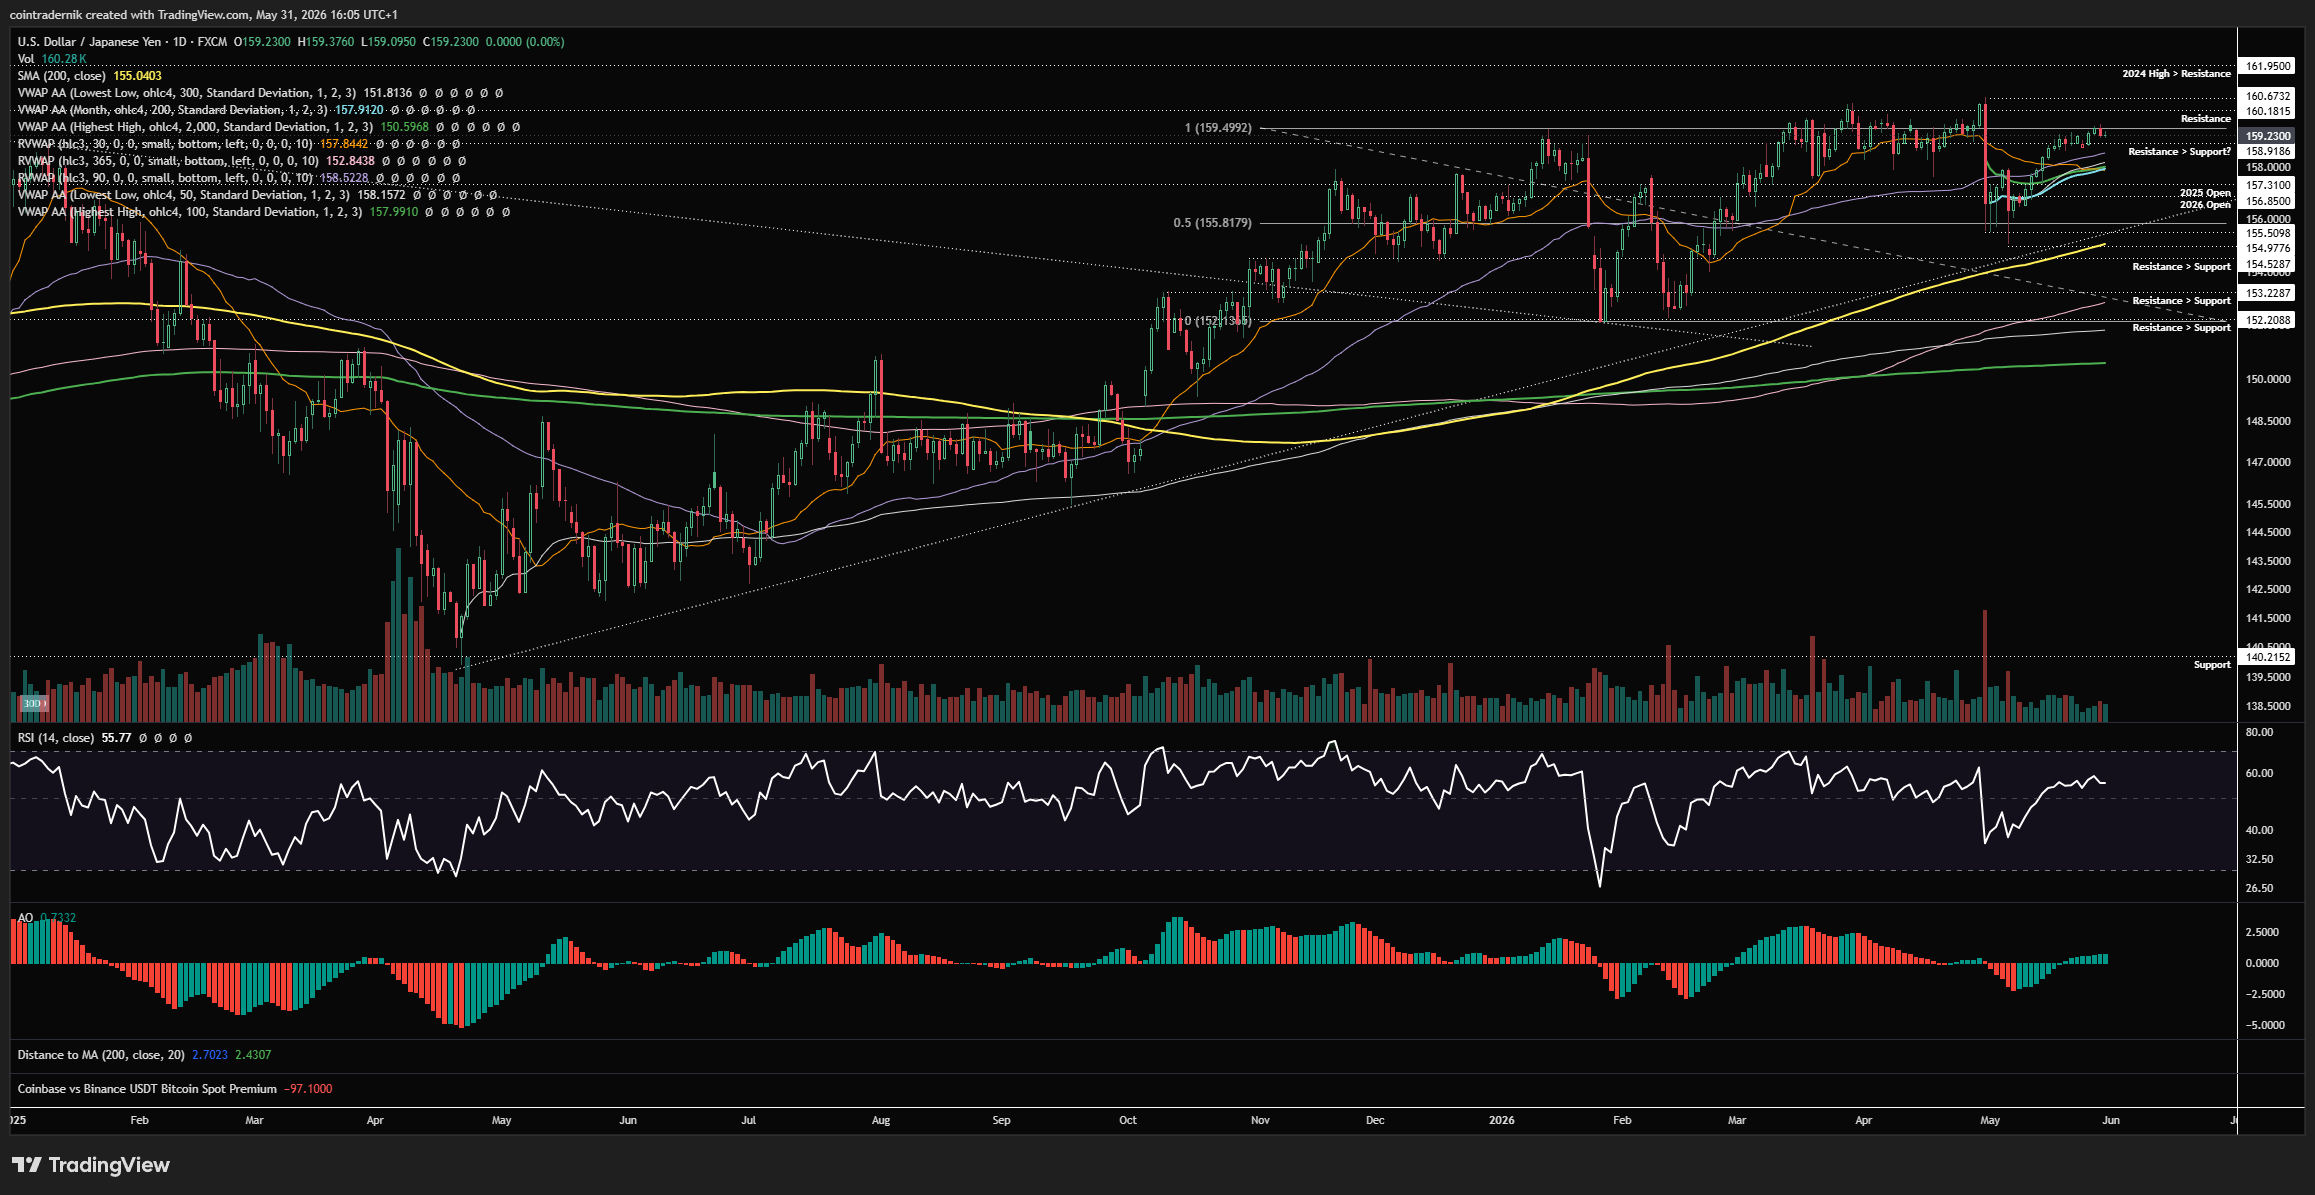
Dropping into the daily, we can see that price is pressing right up against all that resistance, consolidating in a tight range above the 90d rolling VWAP but below 160.18. Momentum on this timeframe is bullish and I think there's a good chance here for a breakout, but I am not stepping in up here for a fresh long. Rather, I want to see 90d rolling VWAP hold early in June and price then break and close above 160.67, then looking to bid a pullback into 160.18 with a TP of 161.95, if the setup presents itself. If instead we sweep 160.67 and immediately break down, that could also be a high R/R short setup. There is potential here, but nothing concrete yet. Alternatively, if neither presents itself and we roll over from here, I would be looking to bid somewhere below 156.
Price: $0.718
Weekly:
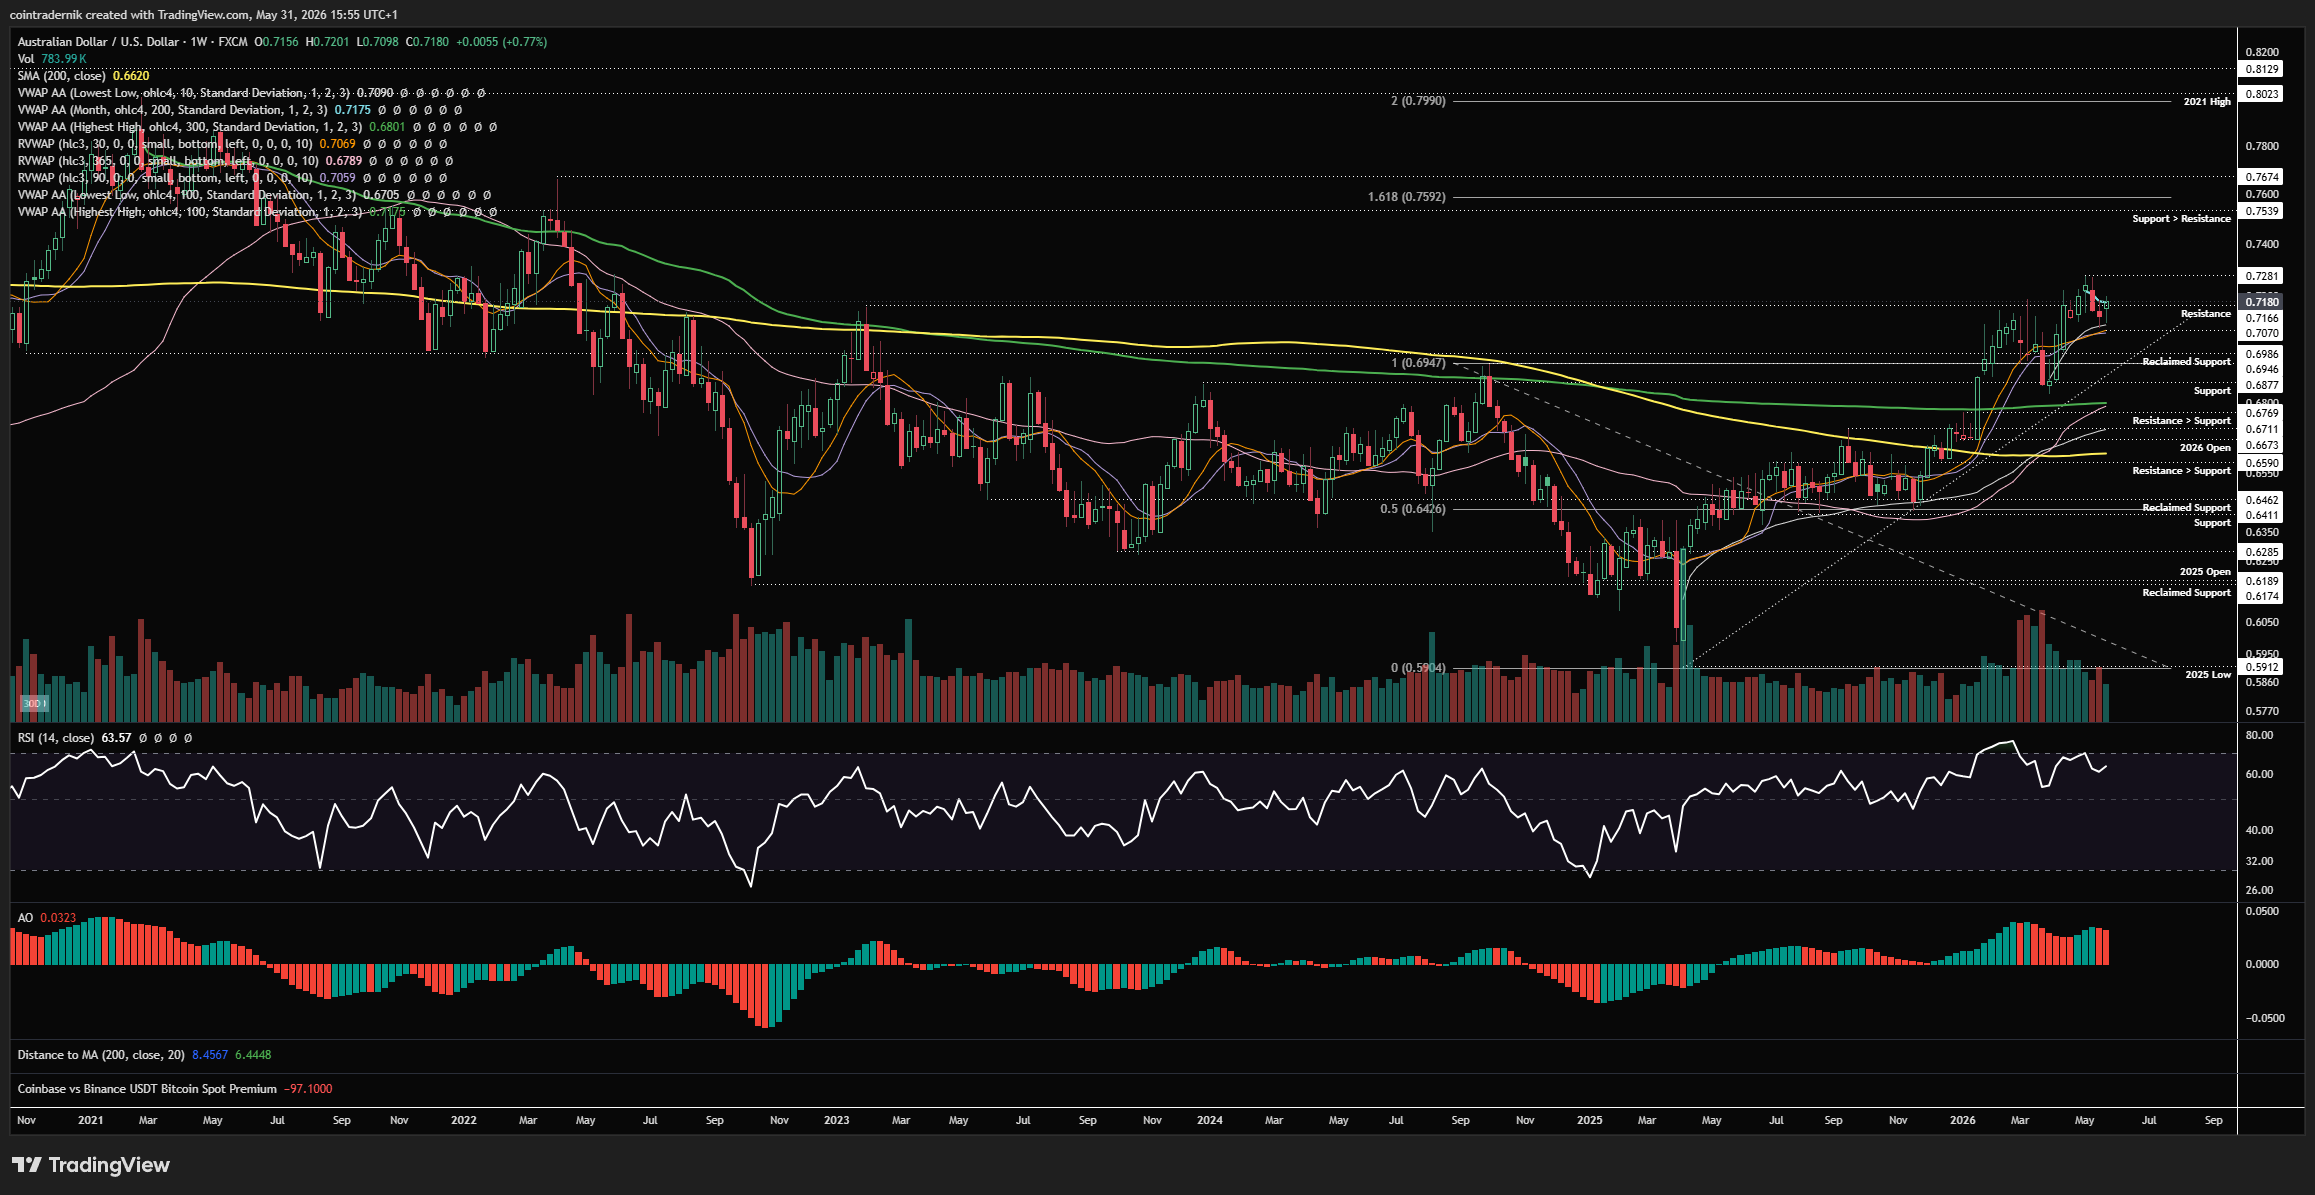
Beginning with the weekly for AUDUSD, we can see that price continues to form higher-highs and higher-lows above trendline support, last week marking out a low above the 30d and 90d rolling VWAP at $0.707 and push higher, into local resistance around $0.717. We do have some bearish divergence right up here too to be wary of, but in strong trends we should expect that divergence to be invalidated. If we break and close above $0.728, with weekly RSI above 70, I would expect to see continuation towards my 2026 target of $0.75, from many hundreds of pips lower, where this has been a wonderful trend to ride for most of this year. I do not think the trend is close to being over, but as mentioned we now have weekly bearish divergence at resistance after a long rally off post-Liberation Day decimation. If this divergence validates with price breaking down here and flipping support into resistance as weekly RSI breaks below 50, I would not be so confident in upside and would book profits on Aussie. $0.707 has to hold as support on this timeframe else I will begin to get nervous on the structure.
Daily:
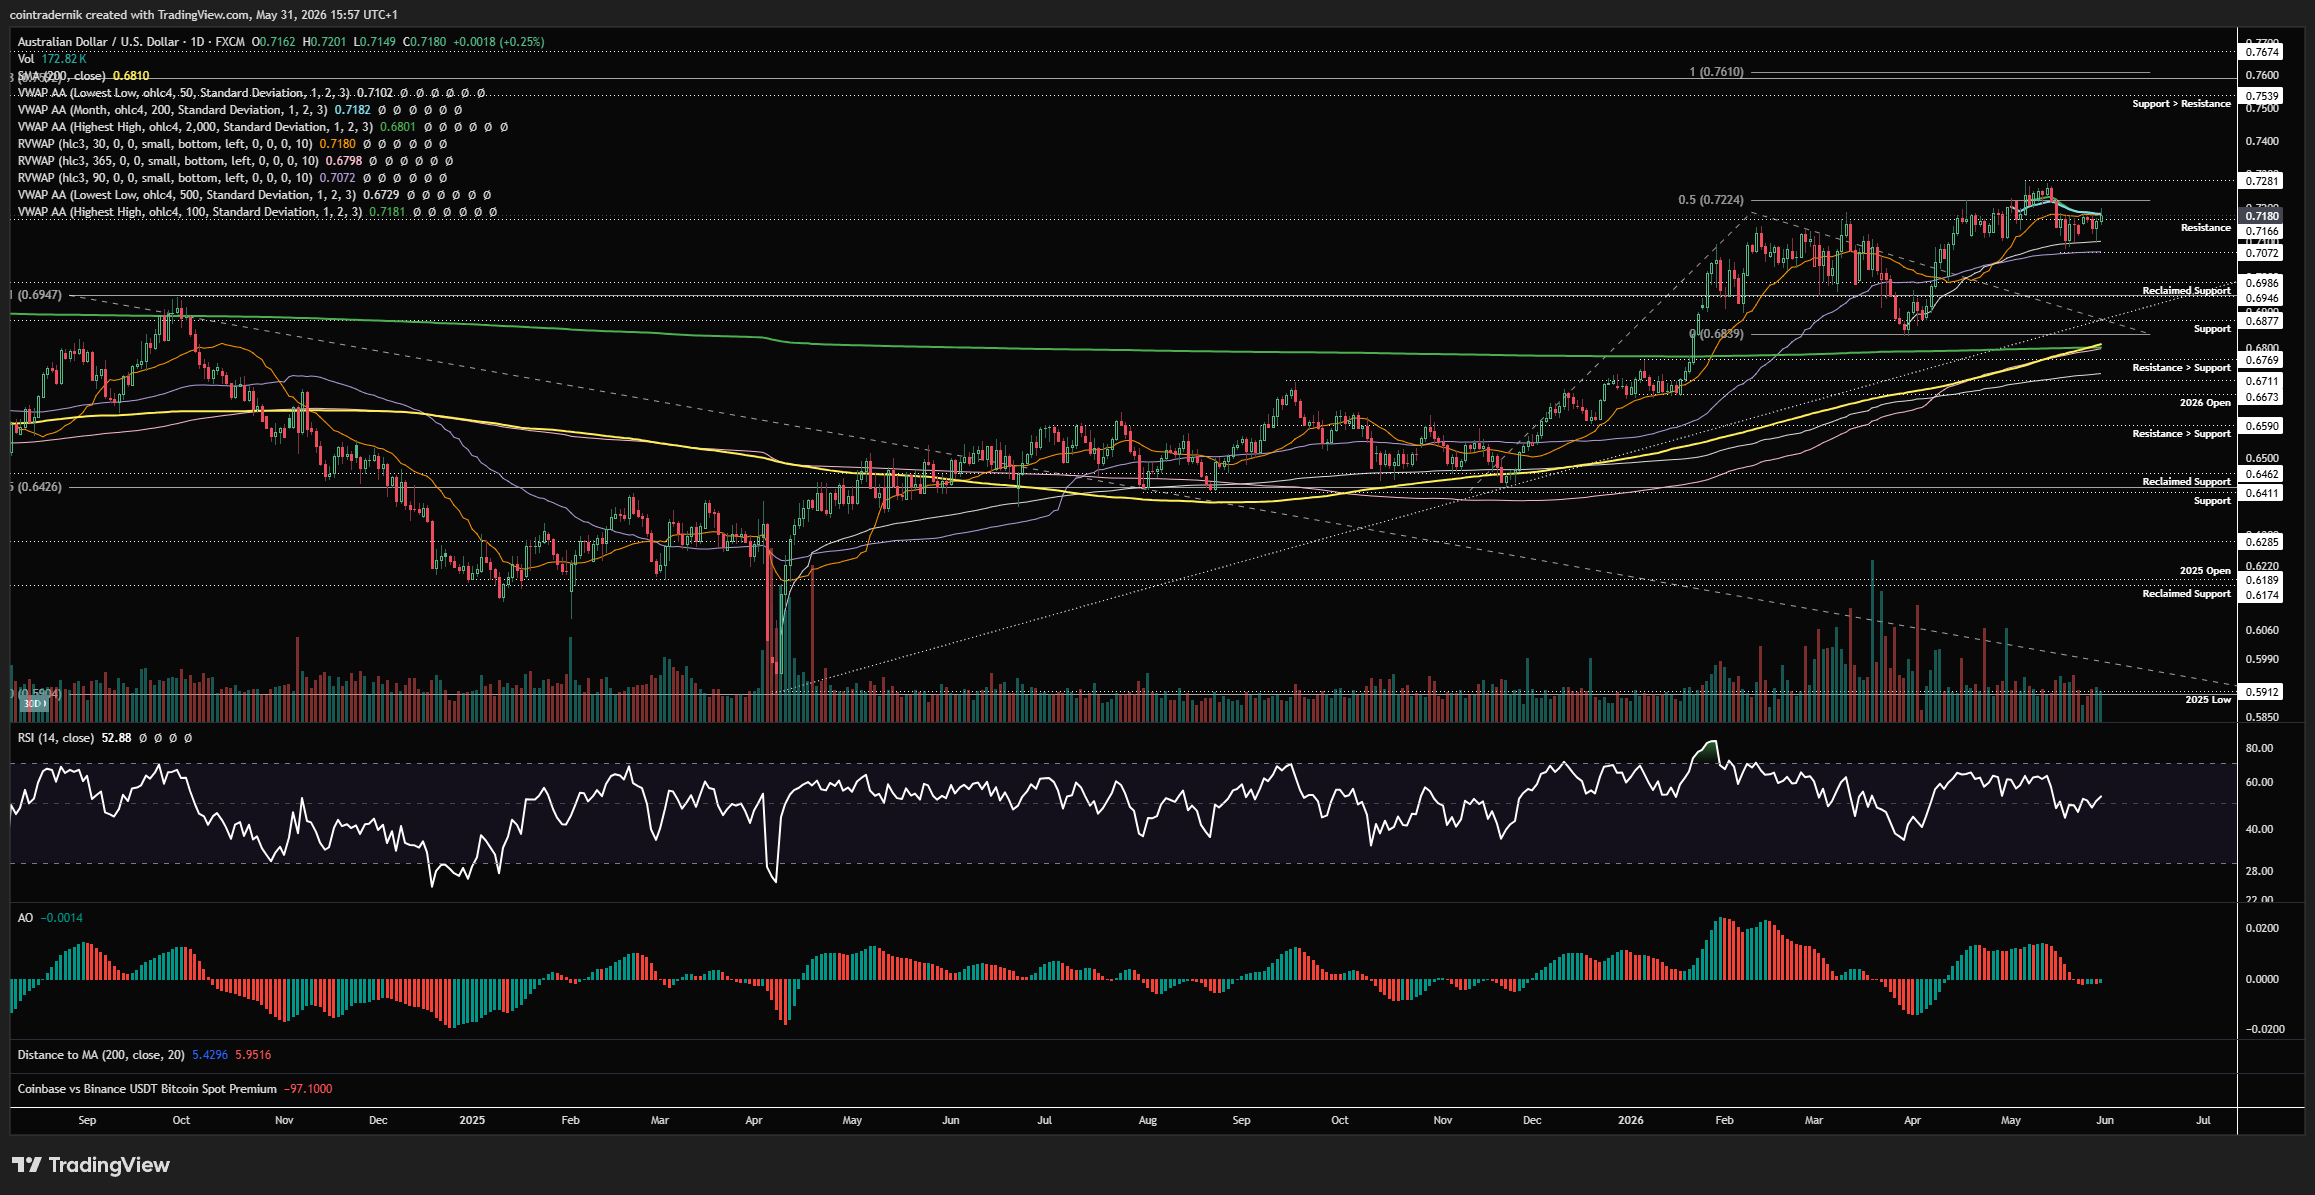
Looking now at the daily, we can see that price is holding 90d rolling VWAP as support, as well as the anchored VWAP from the prior swing-low in April, which is a good sign. We have some choppy momentum and structure up here and price is below the May VWAP, but if we can break and close above $0.72ish and flip that into support, I think we take out the May highs through $0.728 with momentum pushing higher - and that drives the next leg of this trend into $0.75-$0.76, where I will be looking to exit all Aussie exposure for 2026 from $0.669. What would also be a really clean signal for trend exhaustion on this timeframe would be a break above $0.728 but momentum diverging again and price then closing below $0.707 with daily RSI breaking a fresh low - that would be my gtfo signal (and potentially the sign to start looking to sell rips, not buy dips). Let's see how this next week plays out...
Quick one: if you're enjoying the read and want to make the most of the setups shared, you can earn double points all this week on BTC, SPX, USDJPY, XAU and WTI at Ostium: https://ostium.app/trade?from=CL&to=USD&ref=CTNIK
Receive the latest updates directly to your inbox

Price: $75.28
Weekly:
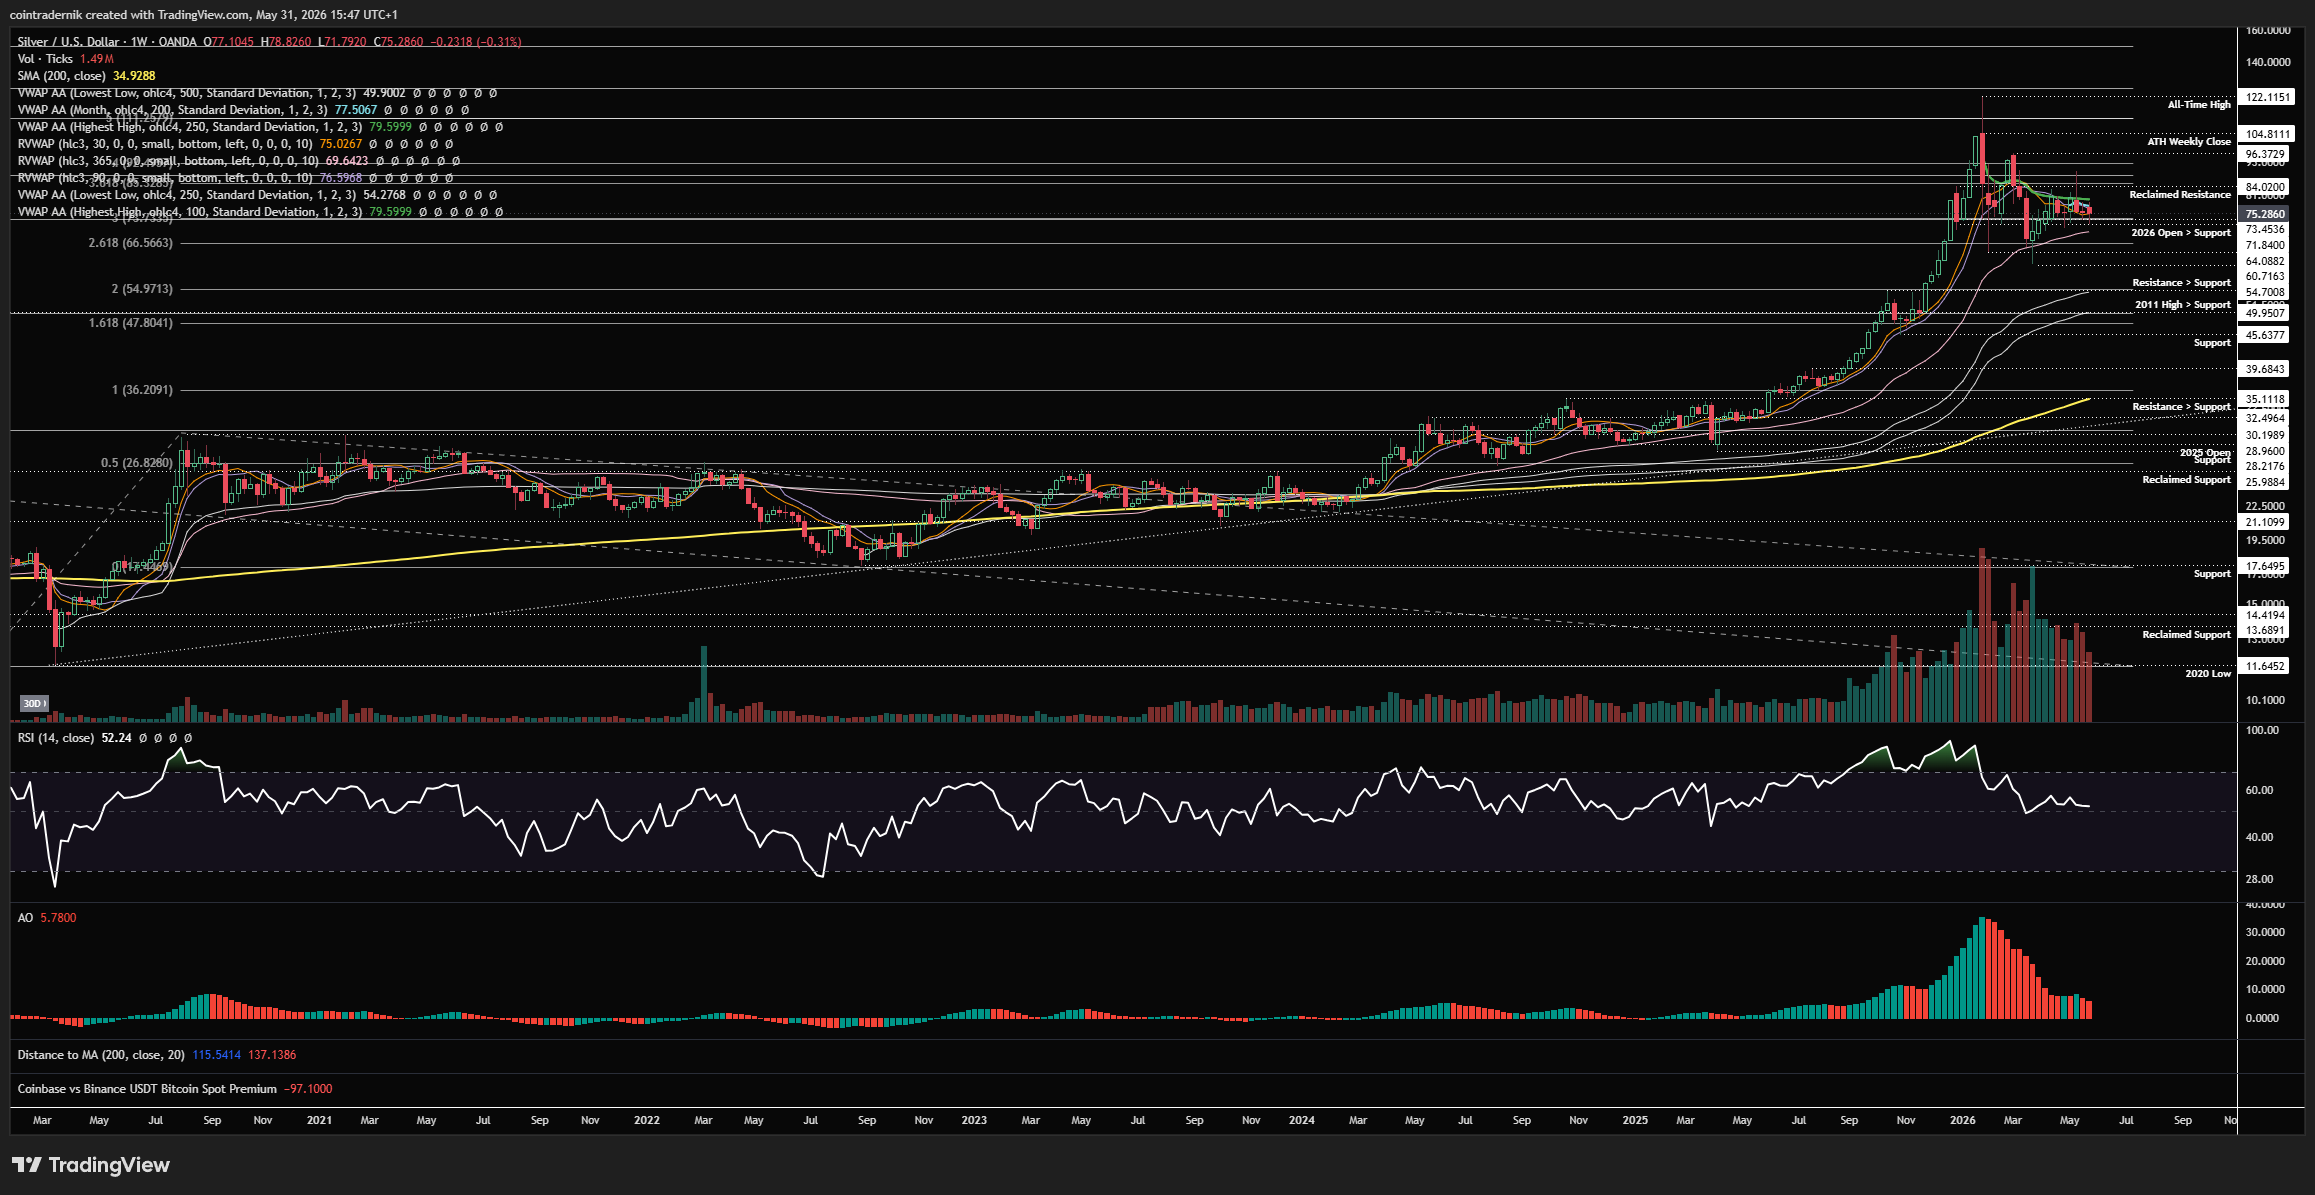
Looking at the weekly timeframe for Silver, it feels like it has been a lifetime since I said 'buying Silver above $100 is like buying Bitcoin at $20k in Dec 2017'. We had all the hallmarks of the classic parabola, culminating in the fundamentalists waxing lyrical in multi-thousand-word X articles about Silver having infinite bid into the Jan highs, all while trading at historic extremes in both price and volatility. Then we got the capitulation and it has been classic volatility compression since then, with price sweeping the capitulation wick lows through the 365d rolling VWAP into $60.70 a couple of months ago and then marking out yet another lower-high, all while capped by the anchored VWAP from all-time highs. Weekly momentum has now reset and is sat around 50 whilst we have price compressing within a tighter range. Famous last words, but I do now think the worst of the price capitulation is likely behind us on silver and what is playing out now - much like on Gold - is time compression, where rather than price moving lower through $64 support into the anchored VWAPs down near $55, instead we see price just chop around between $64 and $84 for a few more weeks at least, with longs favourable nearer that bottom-end of the range; though I would not now be looking silver shorts. What I do think is possible here, if we are to speedrun the consolidation, is price marking out a higher-low here above the 365d rolling VWAP and then flipping $84 into support: if we see that, I am looking for longs aggressively, with a view towards a retest of the ATH Weekly Close at $105 later this year - and that's where we will find out whether there is juice for continuation of the longer-term trend or the makings of a longer-term top...
Daily:
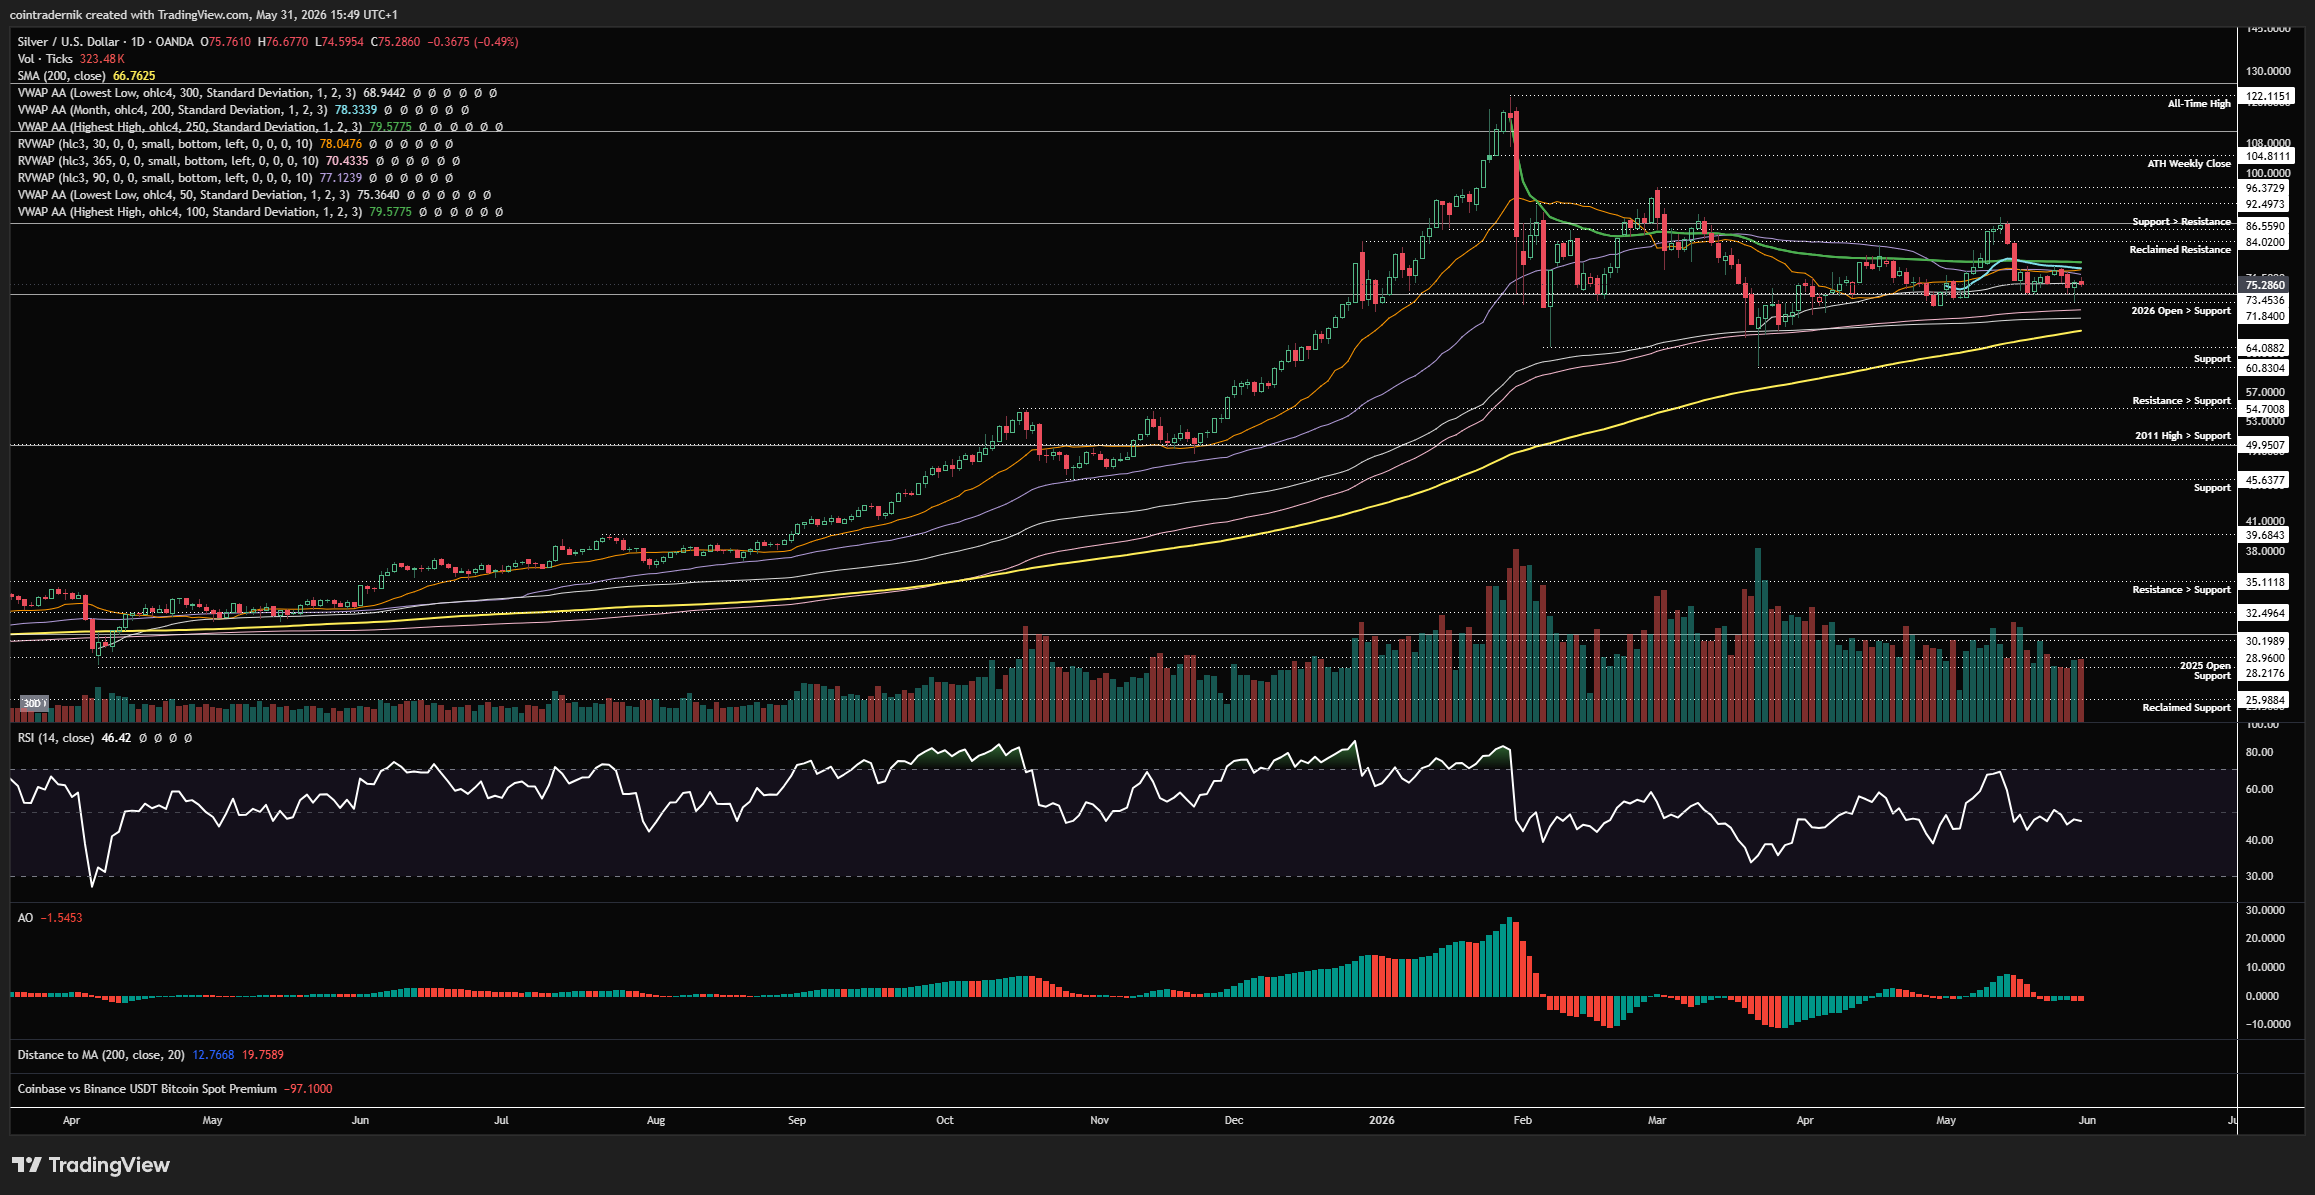
Looking now at the daily, we can see that price has turned daily structure and momentum bullish since marking out the higher-low above the 365d rolling VWAP and then temporarily breaking and closing above the anchored VWAP from all-time highs into $86.55. Price made that higher-high and turned lower, and is now consolidating right at the 2026 open turned support. If we sweep the prior daily low into $69ish, I would be looking for longs there with invalidation on a daily close below $64 and a TP1 of $86 to retest that resistance, acceptance above which obviously opens up that scenario I mentioned above re: $105. Not interested in shorts unless we convincingly break $64 to the downside...
Price: $87.67
Weekly:
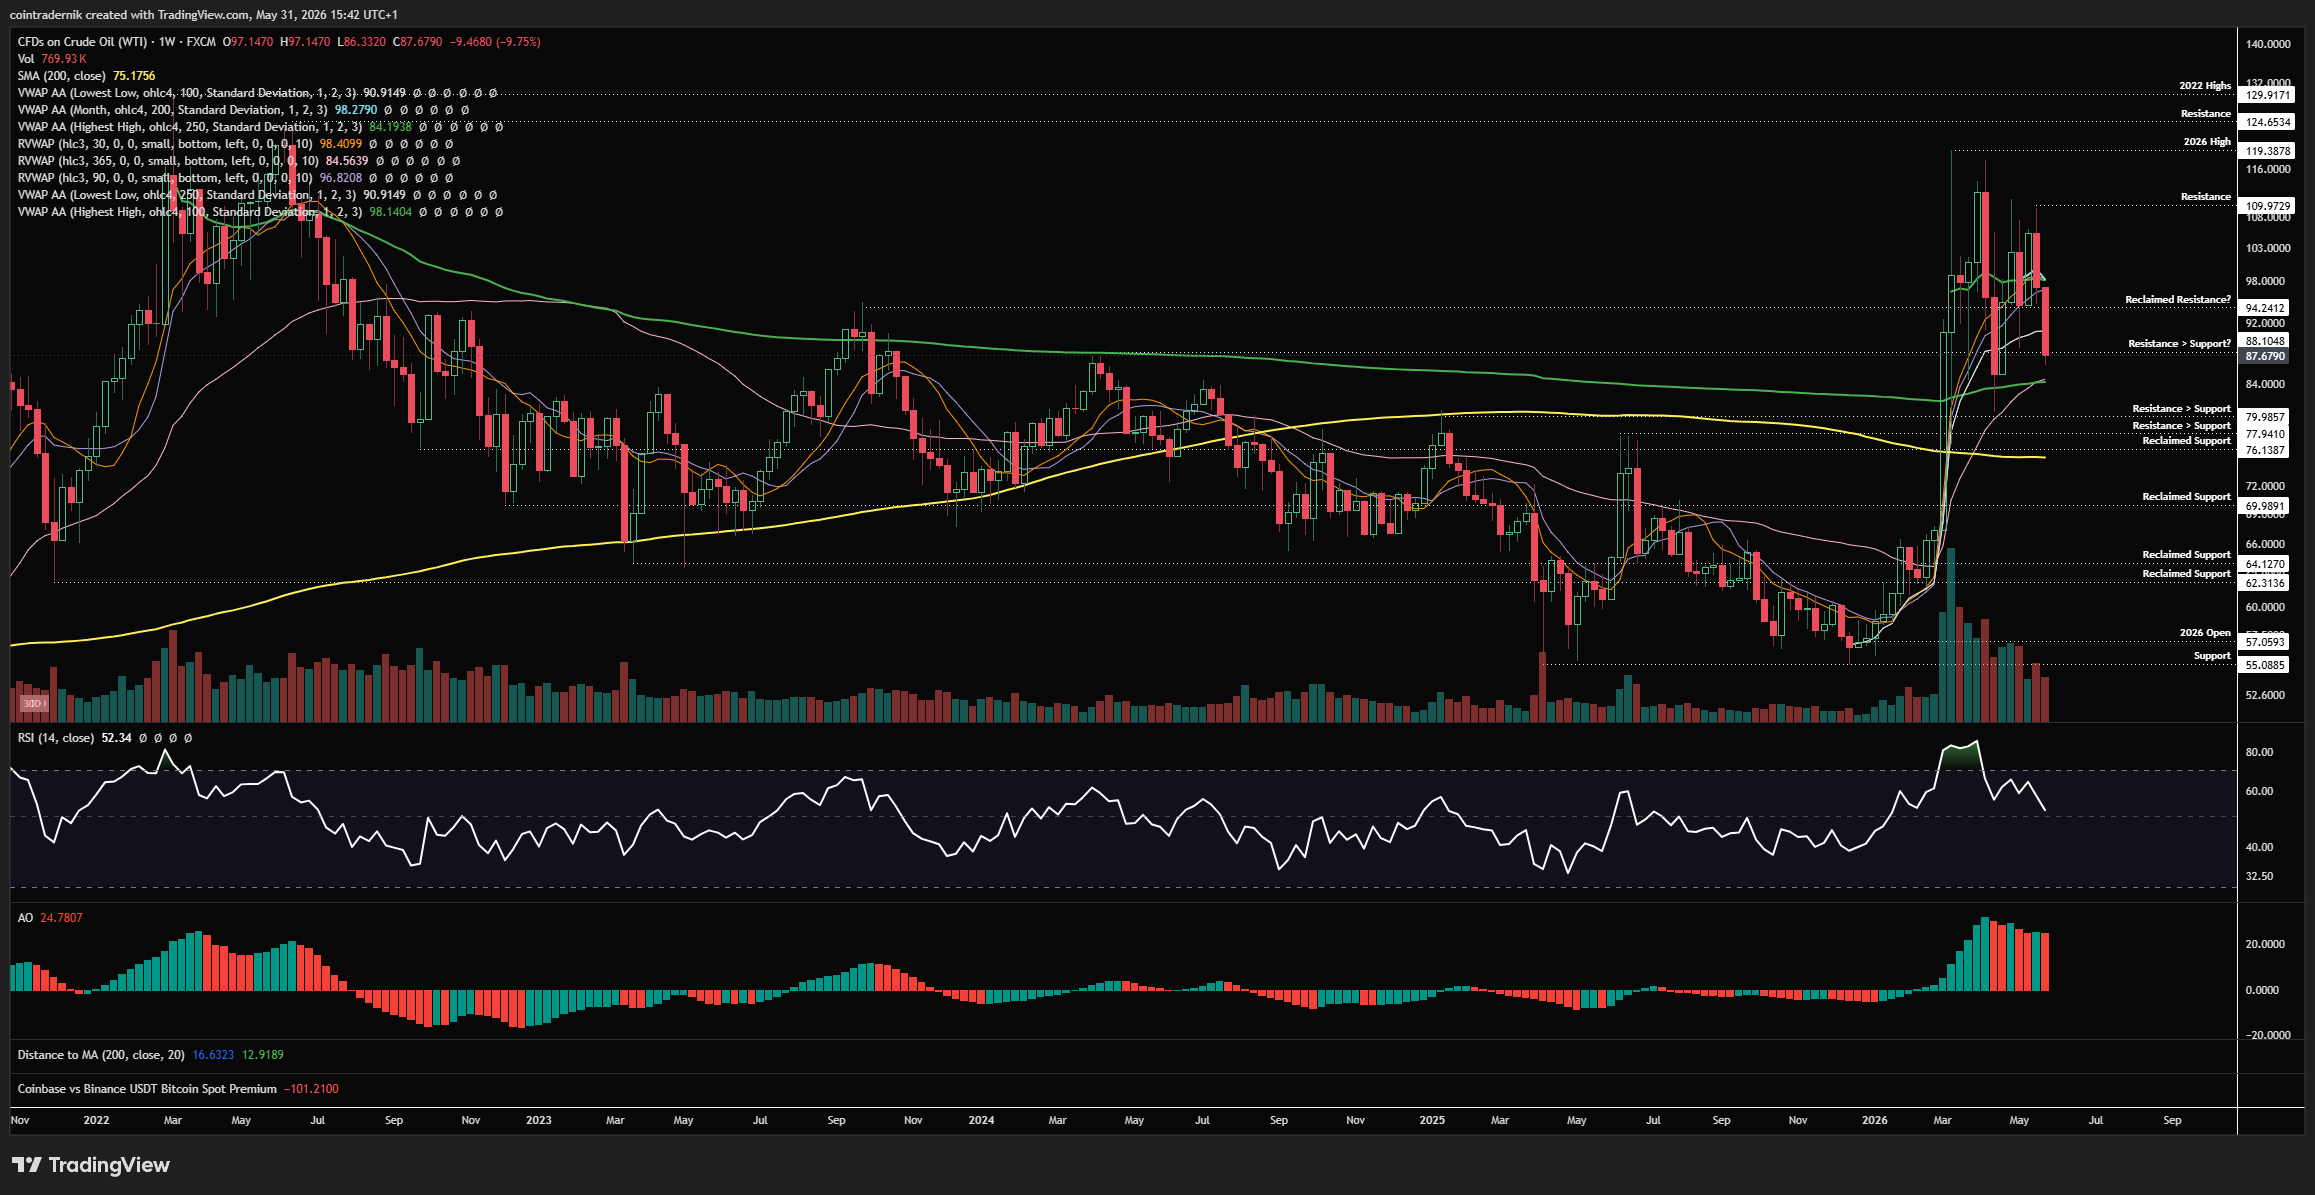
Beginning with the weekly for WTI, we can see that price has been doing a 'Silver' following its epic blowout into $120 in March, where we had a strange experience of deja vu from the infinite bid calls and the $300 Oil targets and 'the fundamental reasons why there was no way oil could trade back below $100 any time soon'. Again, this happened at historic oil vol when everyone was already positioned for continuation higher, and instead the market continued to dump harder on de-escalation than it pumped on escalation, which was a very clear tell. I mentioned in March that for the foreseeable future I would be longing the bottom quintile of the range and shorting the top quintile of the range - and that WTI would be a range trader's dream for some time to come. This has been almost exactly how price-action has played out since and I hope some of you who read this regularly have capitalised on that. But where now? Well, I don't think the compression is over, and I do think it remains range-bound, but I think you want to be favouring longs just a touch now, particularly down near $80 if we get that price again near-term. What would be ideal is further de-escalation leading to further capitulation leading to forced selling into that range between $75-$80 - and we fill longs there in the knowledge that there remain fundamental reasons for an Oil bid longer-term and now all the excitable Oil doomers have been forced out. Let's see what happens early this month - look for that capitulation leg lower on positive headlines, if it comes.
Daily:
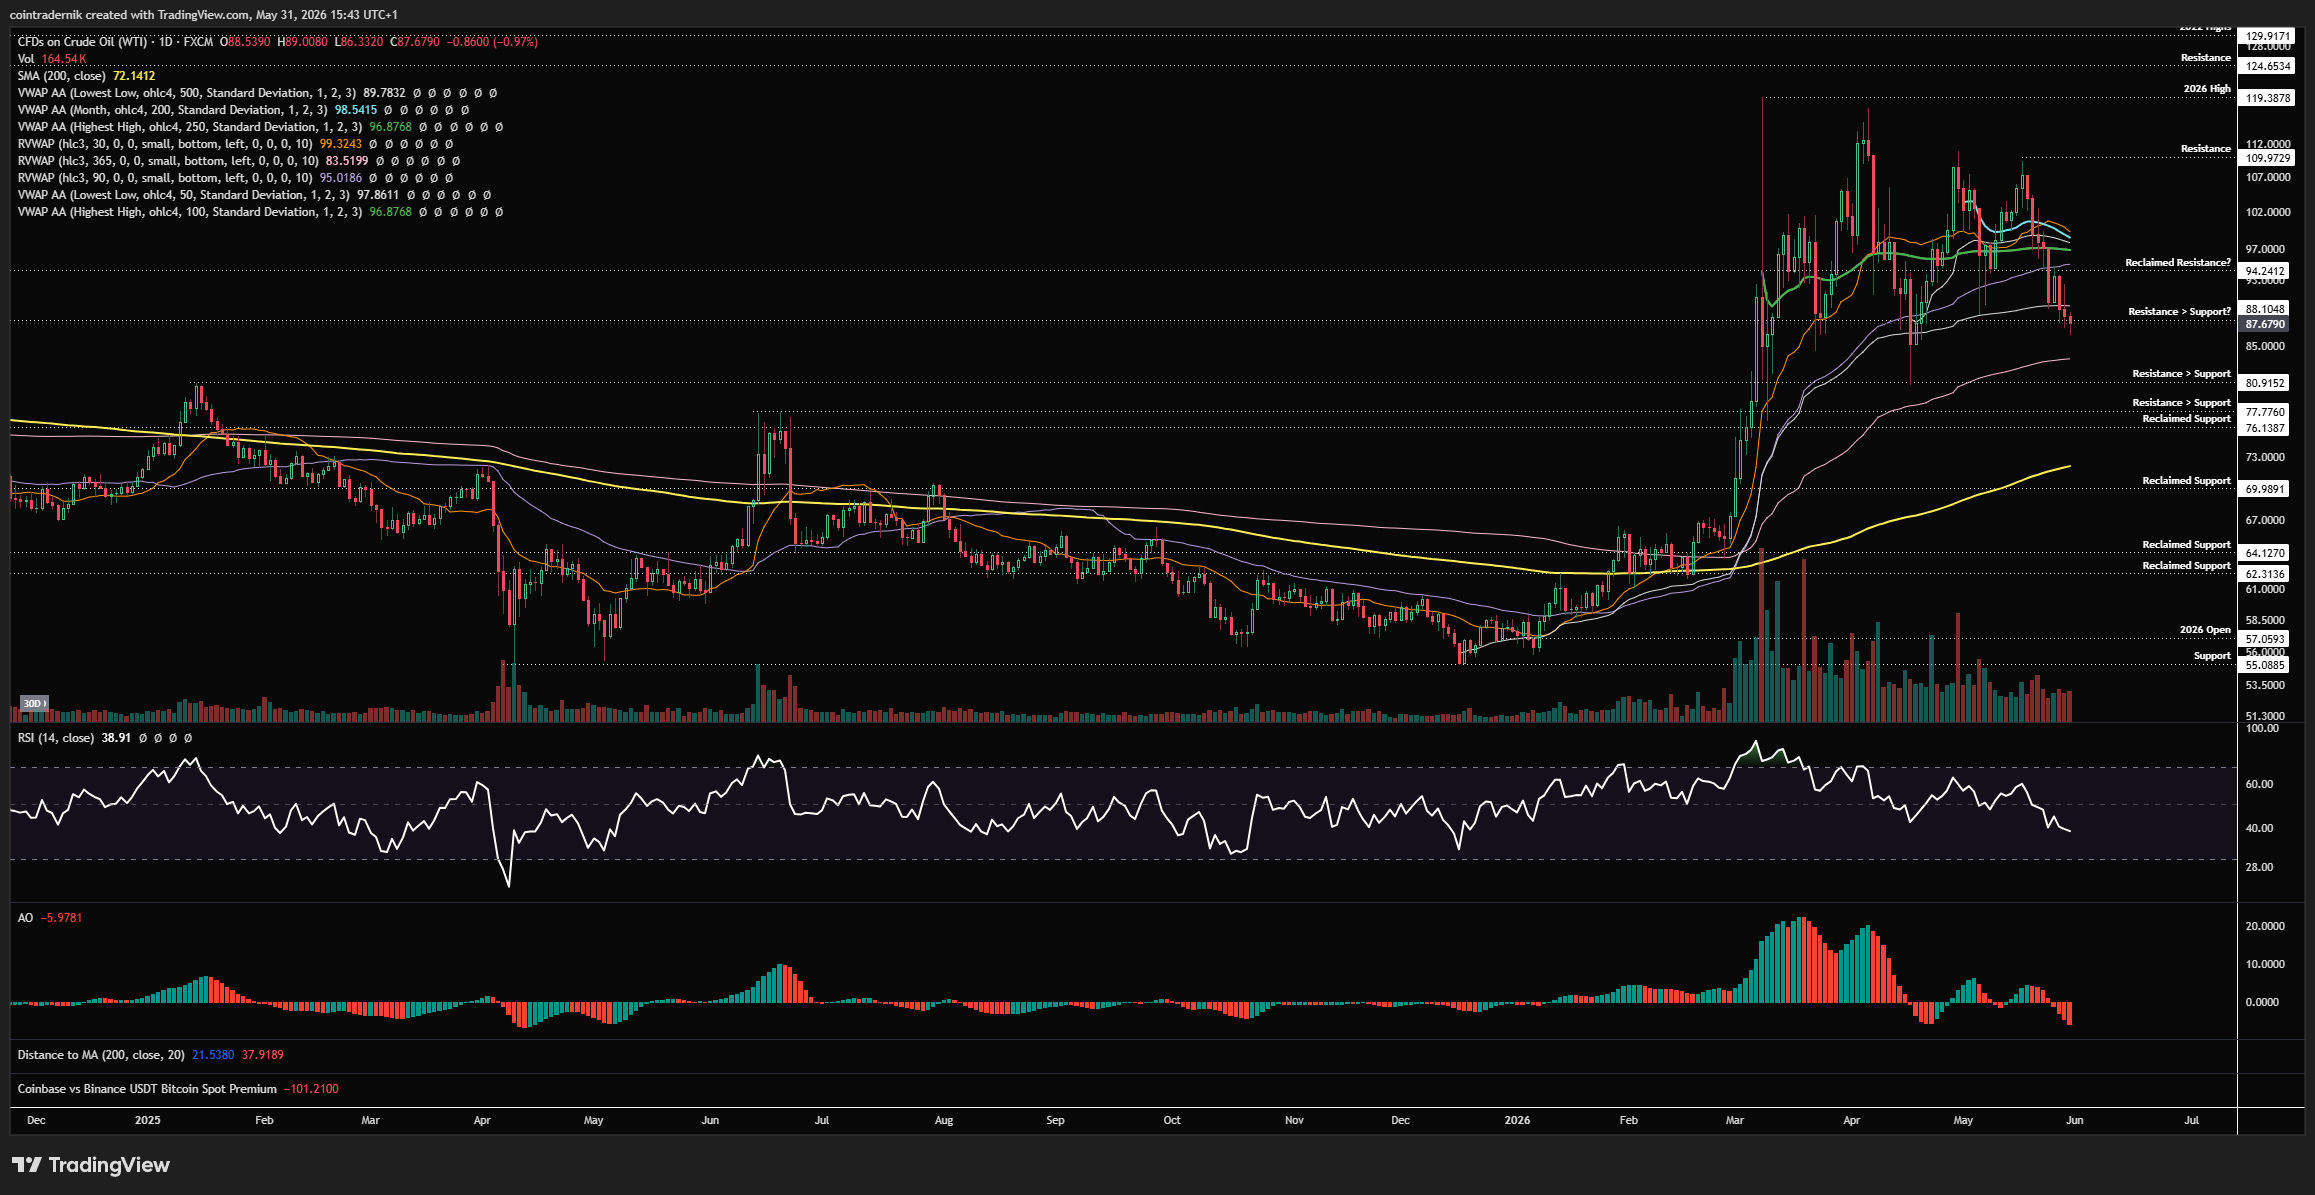
Turning finally to the daily, there's not much else to add here, except that momentum has turned a little bearish following recent rejections and breakdowns, with daily structure now bearish and price trading below key VWAPs, particularly the 90d rolling VWAP and anchored VWAP from the yearly high. Whilst price is holding below $96ish, I think a breakout to the top end of the range is unlikely here and near-term downside is more probable, ideally in the form of that capitulation as mentioned above, with a washout in momentum. Bids figuratively set for $75-$80.
I hope you've found some value in the read this week - please RT, share, engage etc. if so!
And if you've not already signed up for Ostium, please do so and test out some of the recent updates, including:
Sign up here (you don't have to use my ref link, of course): https://ostium.app/trade?from=CL&to=USD&ref=CTNIK

.avif)