

Market Outlook #81
April 20, 2026
-
12
min read


This blog references an opinion and is for entertainment and informational purposes only. It is not intended to be investment advice. Seek a duly licensed professional for investment advice.
In this 81st edition of the Market Outlook here at Ostium Insights, we'll be taking a look at the week ahead in markets, looking at price-action, positioning and event risk for NDX, Gold, WTI, Copper and Bitcoin.
Trade and earn double points this week on NDX, TSLA, NVDA, GOOG and BTC at Ostium: https://ostium.app/trade?from=CL&to=USD&ref=CTNIK
Let's first take a look at the relatively quiet week ahead on the data front, though busier for US growth, with the focus remaining squarely on the US-Iran geopolitical situation:
TUESDAY: US RETAIL SALES (MOM) (MAR): (CONSENSUS 1.3% VS PREVIOUS 0.6%)
TUESDAY: FED'S WALLER SPEECH
WEDNESDAY: ECB PRESIDENT LAGARDE SPEECH
THURSDAY: US INITIAL JOBLESS CLAIMS: (CONSENSUS 212K VS PREVIOUS 207K)
THURSDAY: US S&P GLOBAL MANUFACTURING PMI (APR) (PREL): (CONSENSUS N/A VS PREVIOUS 52.3)
THURSDAY: US S&P GLOBAL SERVICES PMI (APR) (PREL): (CONSENSUS N/A VS PREVIOUS 49.8)
FRIDAY: US MICHIGAN CONSUMER SENTIMENT INDEX (APR): (CONSENSUS 47.6 VS PREVIOUS 47.6)
Now, let's dig into asset-specific price-action for the week ahead, looking firstly at NDX:
Price: $75,214
Weekly:
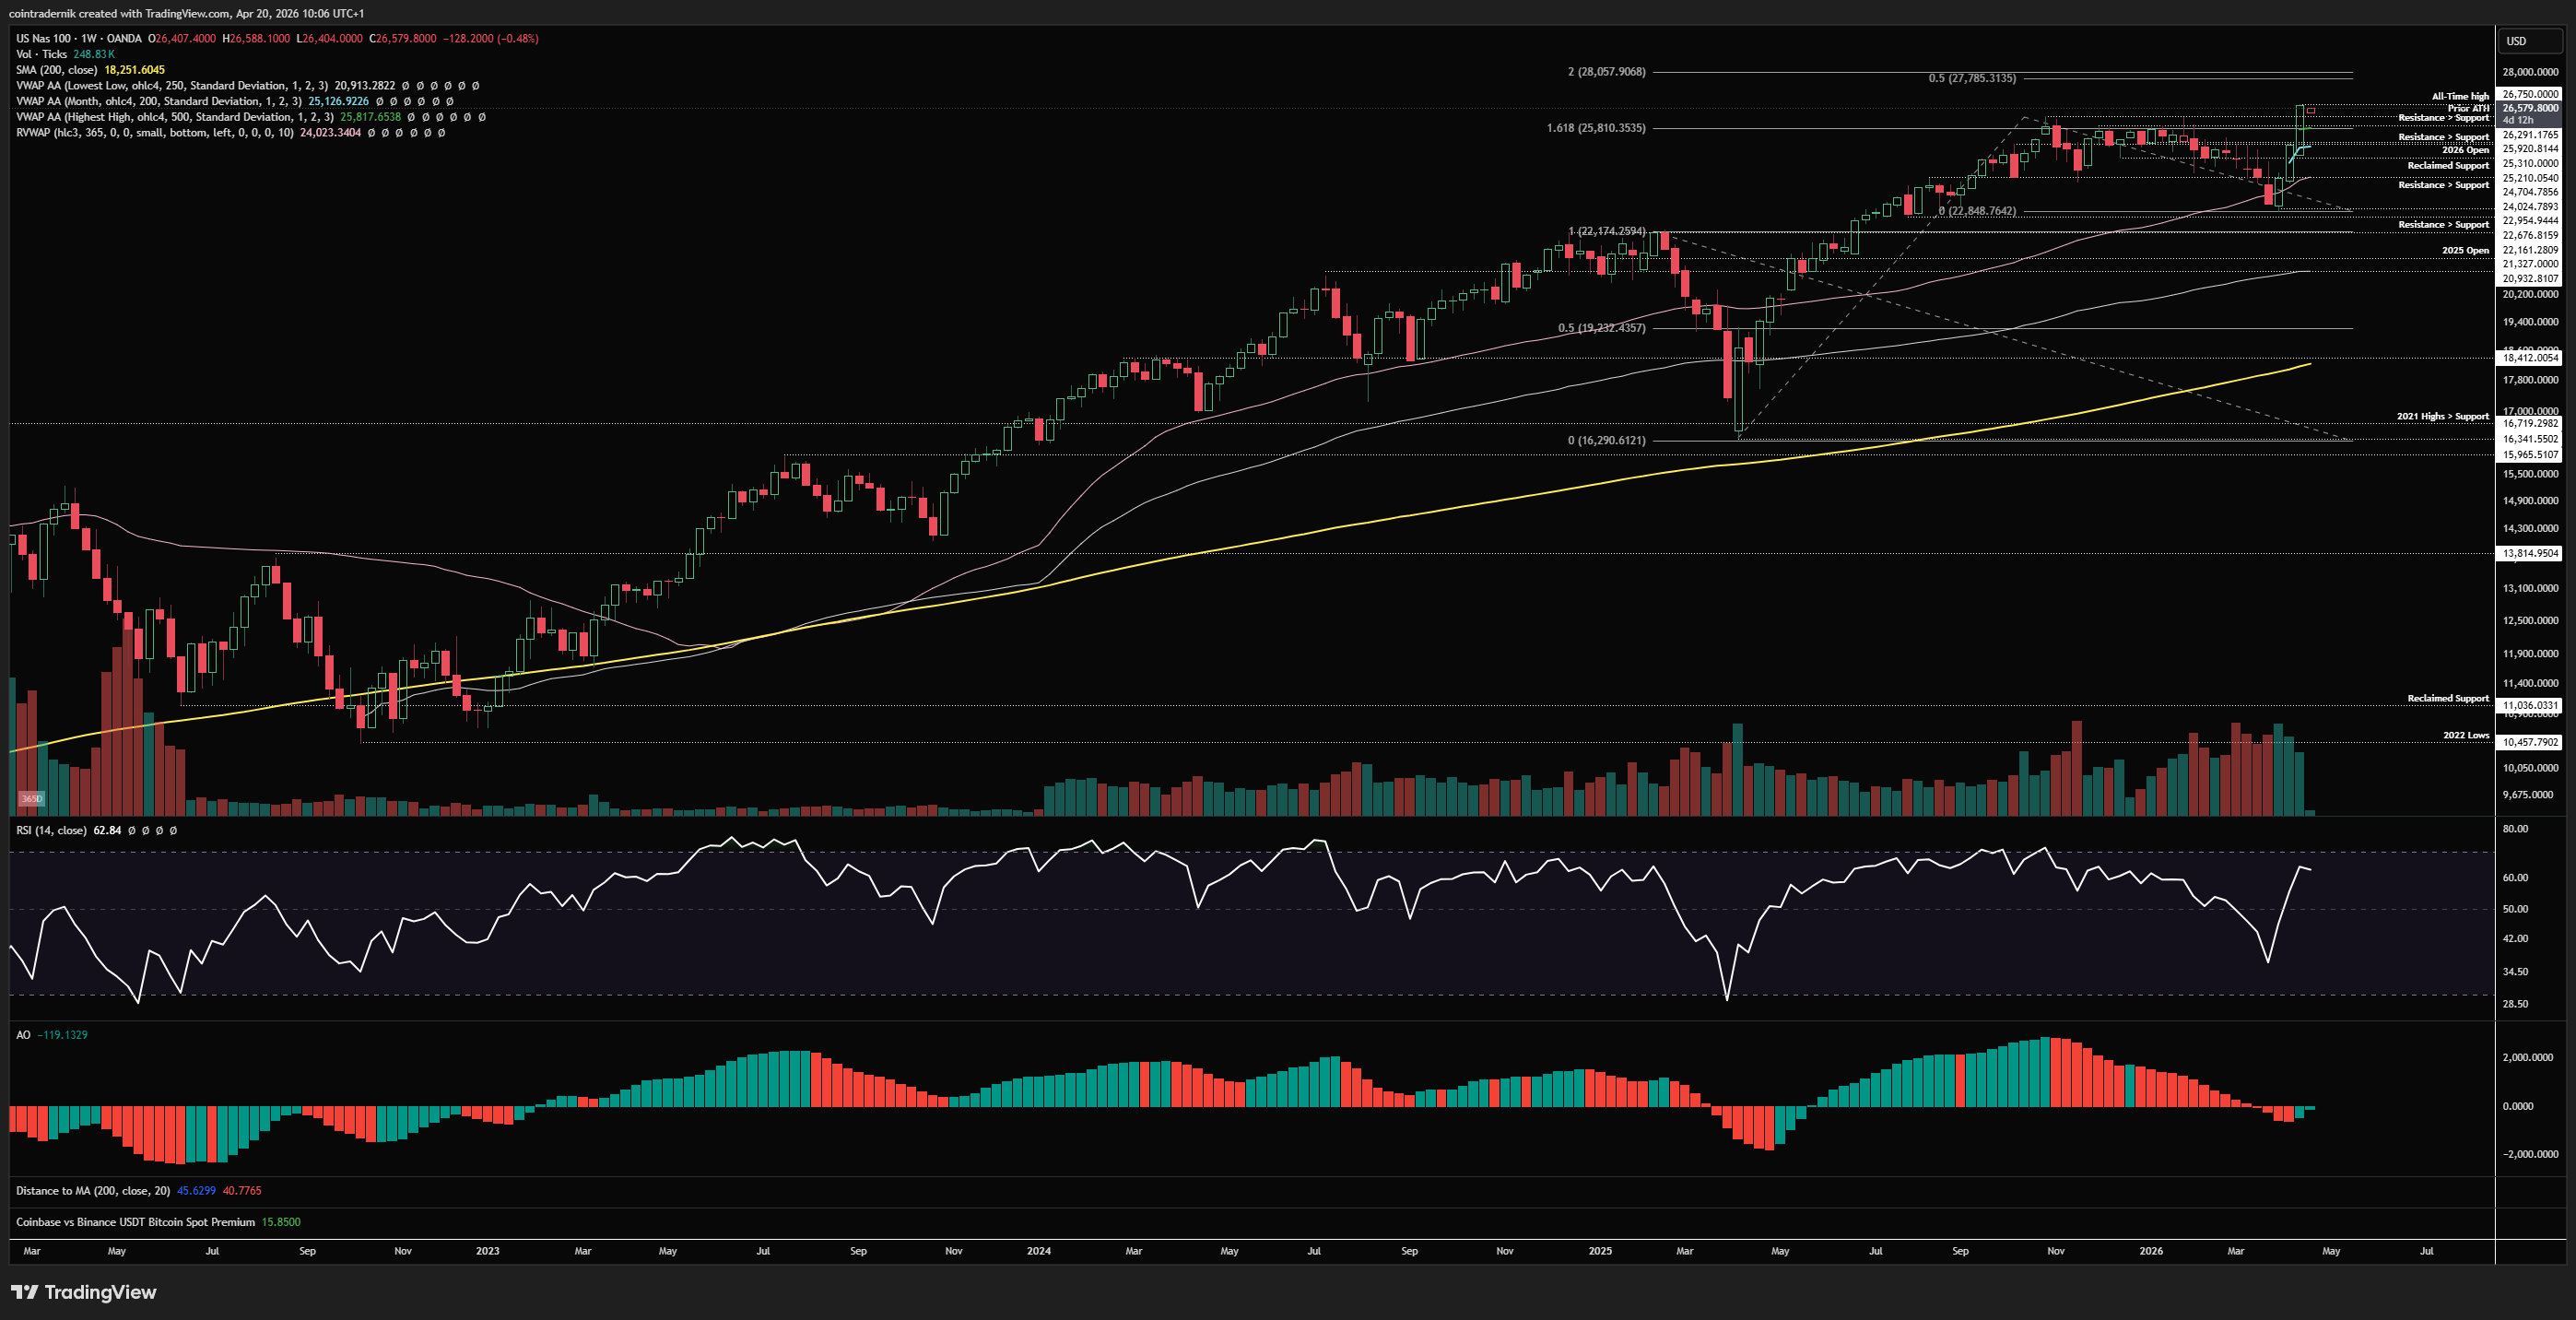
If we begin by looking at the weekly for NDX, we can see that last week was historic, with price bouncing off the weekly open above the April VWAP at $24,700 and pushing higher through every level of resistance straight into fresh all-time highs above $26,290, tagging $26,750 and closing the week right at those highs. That's about an 8% rally on the week for NDX. This was the culmination of the move off that March 30th low, with the index having rallied around 17% since then. It's safe to say the speed and relentlessness of this v-reversal surprised all but the most extreme optimists, and certainly even I was not anticipating such absurd strength, expecting instead that price had indeed marked out a major low but that it would take a couple of months before we were back in price discovery. Nonetheless, by every measure this has been an historic reversal - and, as I highlighted on X, this is now an n=1 instance, deviating from the prior 3 instances of a 20% or greater drawdown in a calendar year that led to 10% or greater full-year gains that then led to a consecutive 20% drawdown in the next calendar year. Further, there is much statistical evidence now pointing towards continued strength into next year given the momentum of the reversal and the move into a new all-time high. But, that path may well be treacherous and if anyone was bearish into the 365d rolling VWAP but is bullish short-term here, I would urge caution. I think chasing up here is extremely poor R/R and whilst we may well continue to rip higher short-term, with the confluence of fibs above at $27,800ish the likely next target if we do, if ever we were going to get some profit-taking and a shakeout I would imagine it would happen here given the confluence of perceived 'good news' headline saturation and a 17% rally in 3 weeks. If we take out last week's high and then reject and break lower, I think we see price retest the anchored VWAP from the all-time high at $25,800, which is also prior resistance. Holding that would then open up a move higher towards $27,800. If we lose $25,800, I think price retests $25,200, near the 2026 open, where I expect there to be a lot of demand and where the R/R for those who remain sidelined is much more favourable.
Daily:
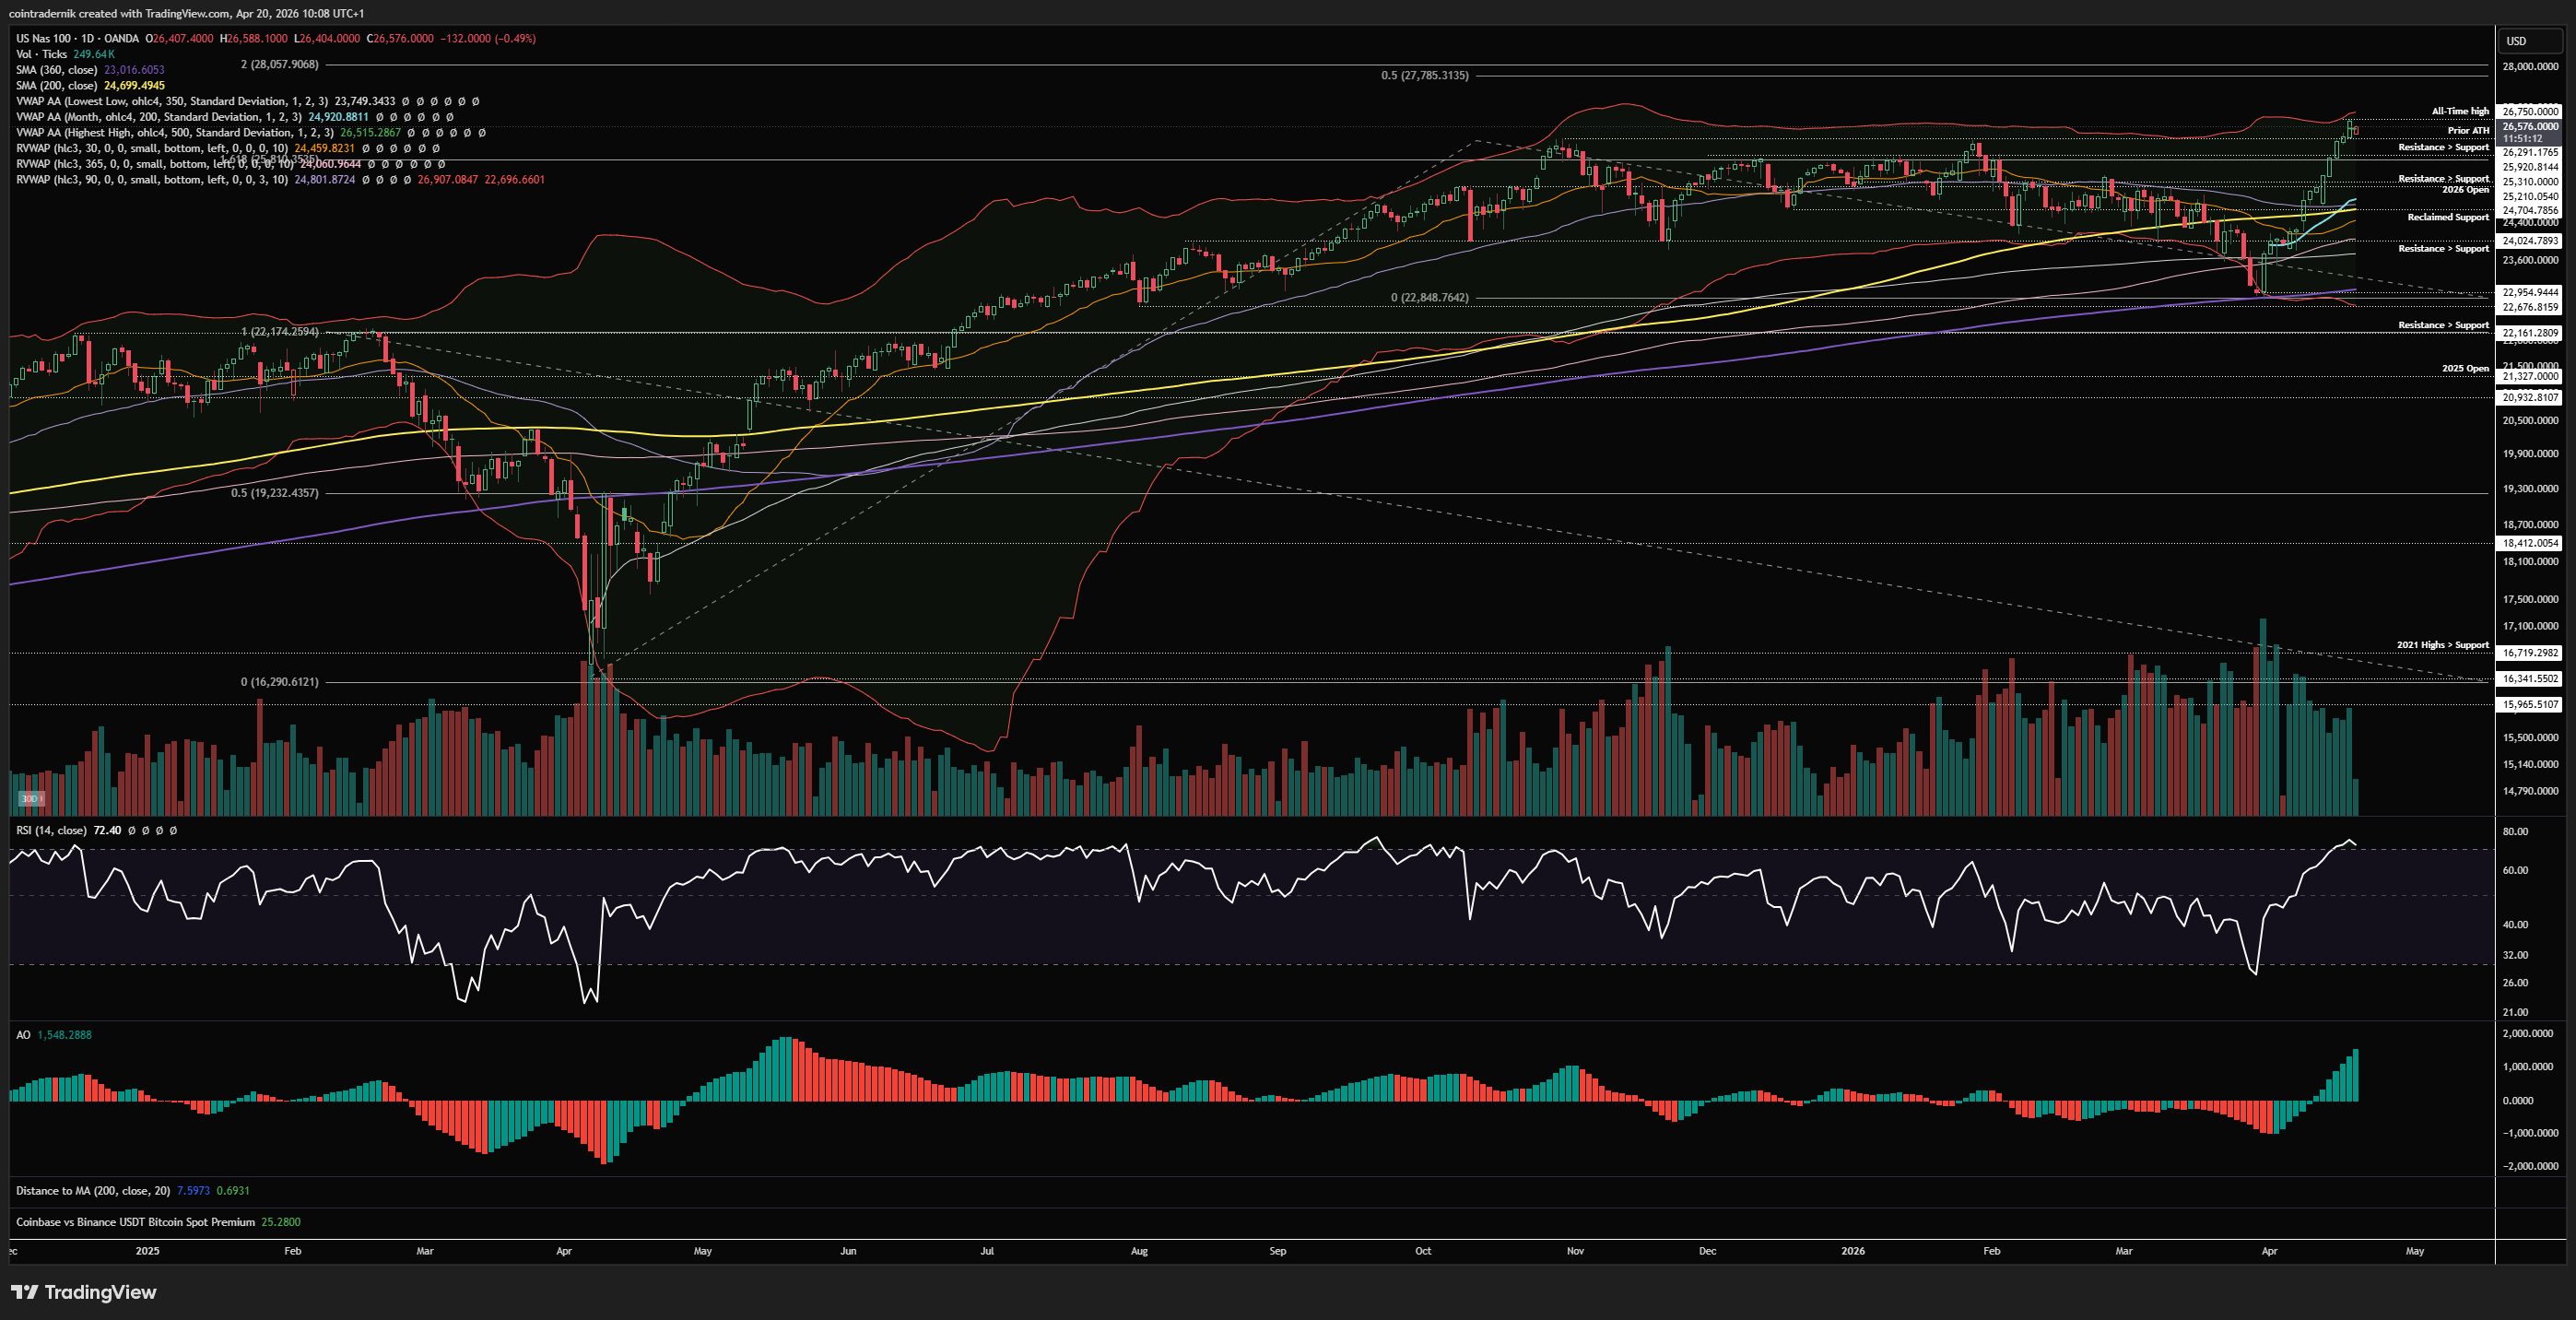
If we look at the daily, we can see the strength of the rally much more clearly here - and. as a brief aside, please ignore every single person talking about volume here, because basically every v-reversal to new all-time highs occurs on declining volume. Now, what is a point of confluence for the poor R/R in chasing up here is that we are 3 std devs above the 90d rolling VWAP, which tends to be a pretty firm upper bound. Obviously, this does not necessitate a pullback, but rather that we could just chop around up here even for a little while before price continues higher. Acceptance above last week's high would lead me to believe that we are going for a bit of a local blow-off top, which would align with that $27,800 area. Now, looking ahead, if we do reject below $26,750 and price flips $26,300 (prior highs) into resistance, I would be looking at that $25,800ish area for long setups with invalidation on a daily close below that prior resistance, as below that there is no support back into the yearly open, where, as mentioned above, I think the much more favourable R/R longs become apparent. If you want to step in front of this to short, look for a sweep of last week's high and then a breakdown to trap longs into those highs. That's where you could be a bit more confident in a pullback.
Price: $4794
Weekly:
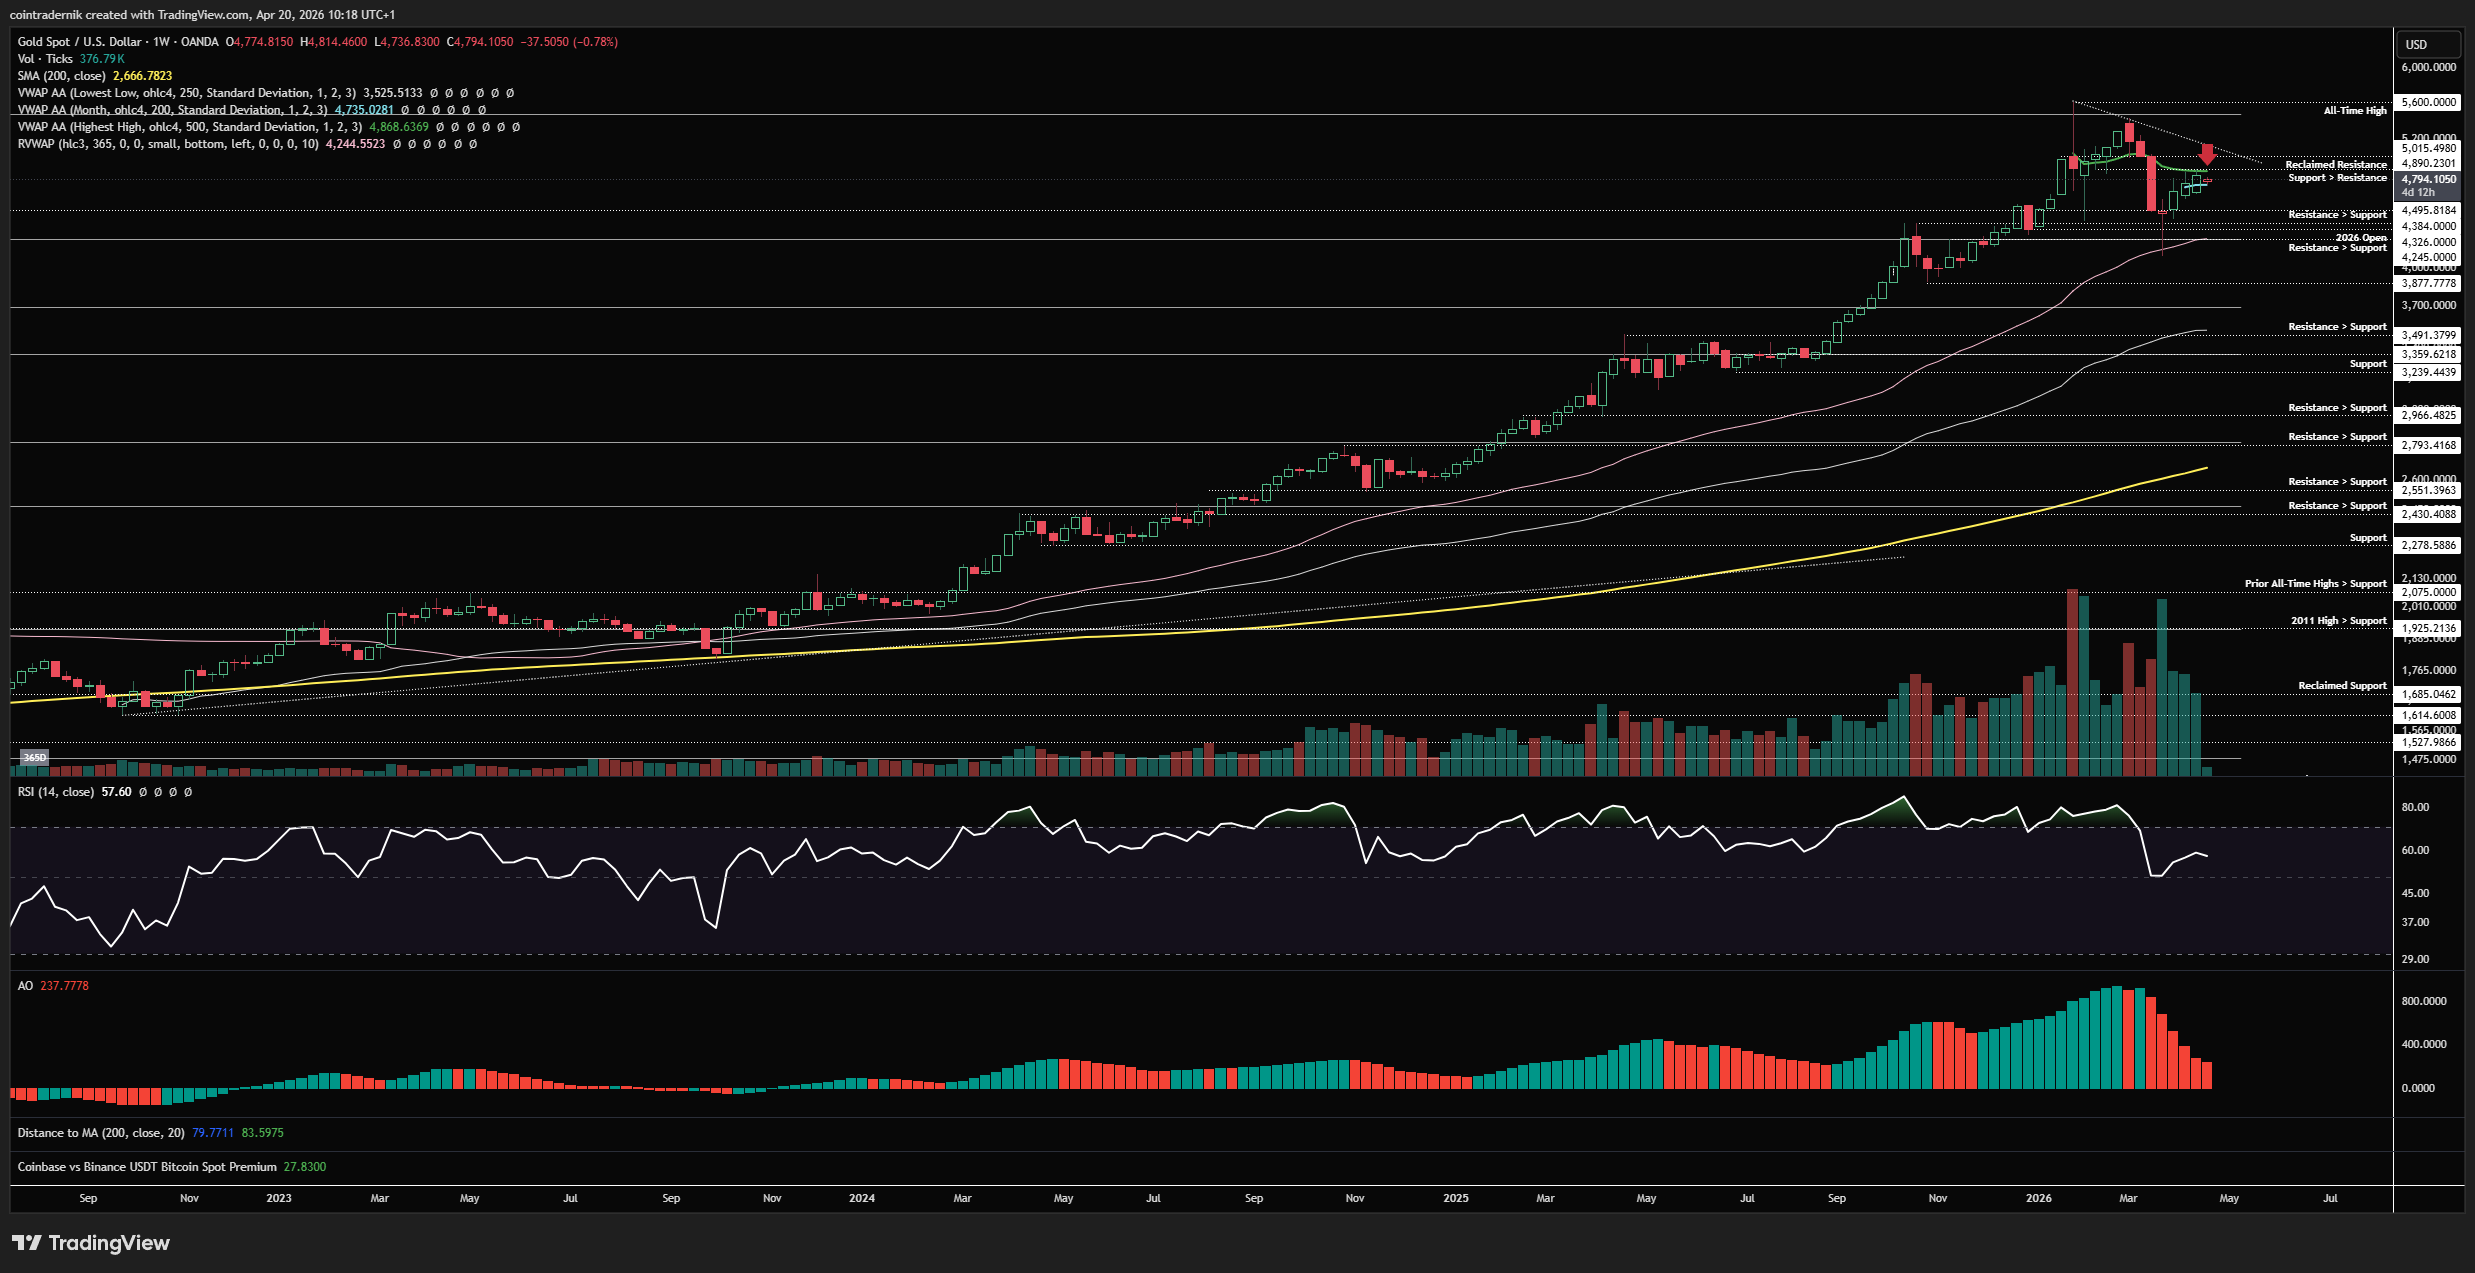
Beginning with the weekly view for Gold, we got that bounce into the anchored VWAP from all-time highs around $4900, as mentioned a couple of weeks ago, and this is where I think Gold could see some sellers step in if we are going to form a lower-high and then retest range support into that 365d rolling VWAP at $4244. If this week sees price pop higher through last week's high, reject at $4900 again and break down, I will be looking for shorts from there into May with acceptance above $5000 as invalidation on this bearish outlook. If we do flip $5000 into support, I think we're looking for longs back to new highs. And there's no reason to get giga-bearish (i.e. long-term bear market and prices below the 365d rolling VWAP) unless we close below $4200 on the weekly timeframe with weekly RSI below 50, which would be pretty conclusive as to a long-term top being in, in my view. Until then, it is a range trader's market and we are approaching the maximal R/R short area here for a 10-15% move lower.
Daily:
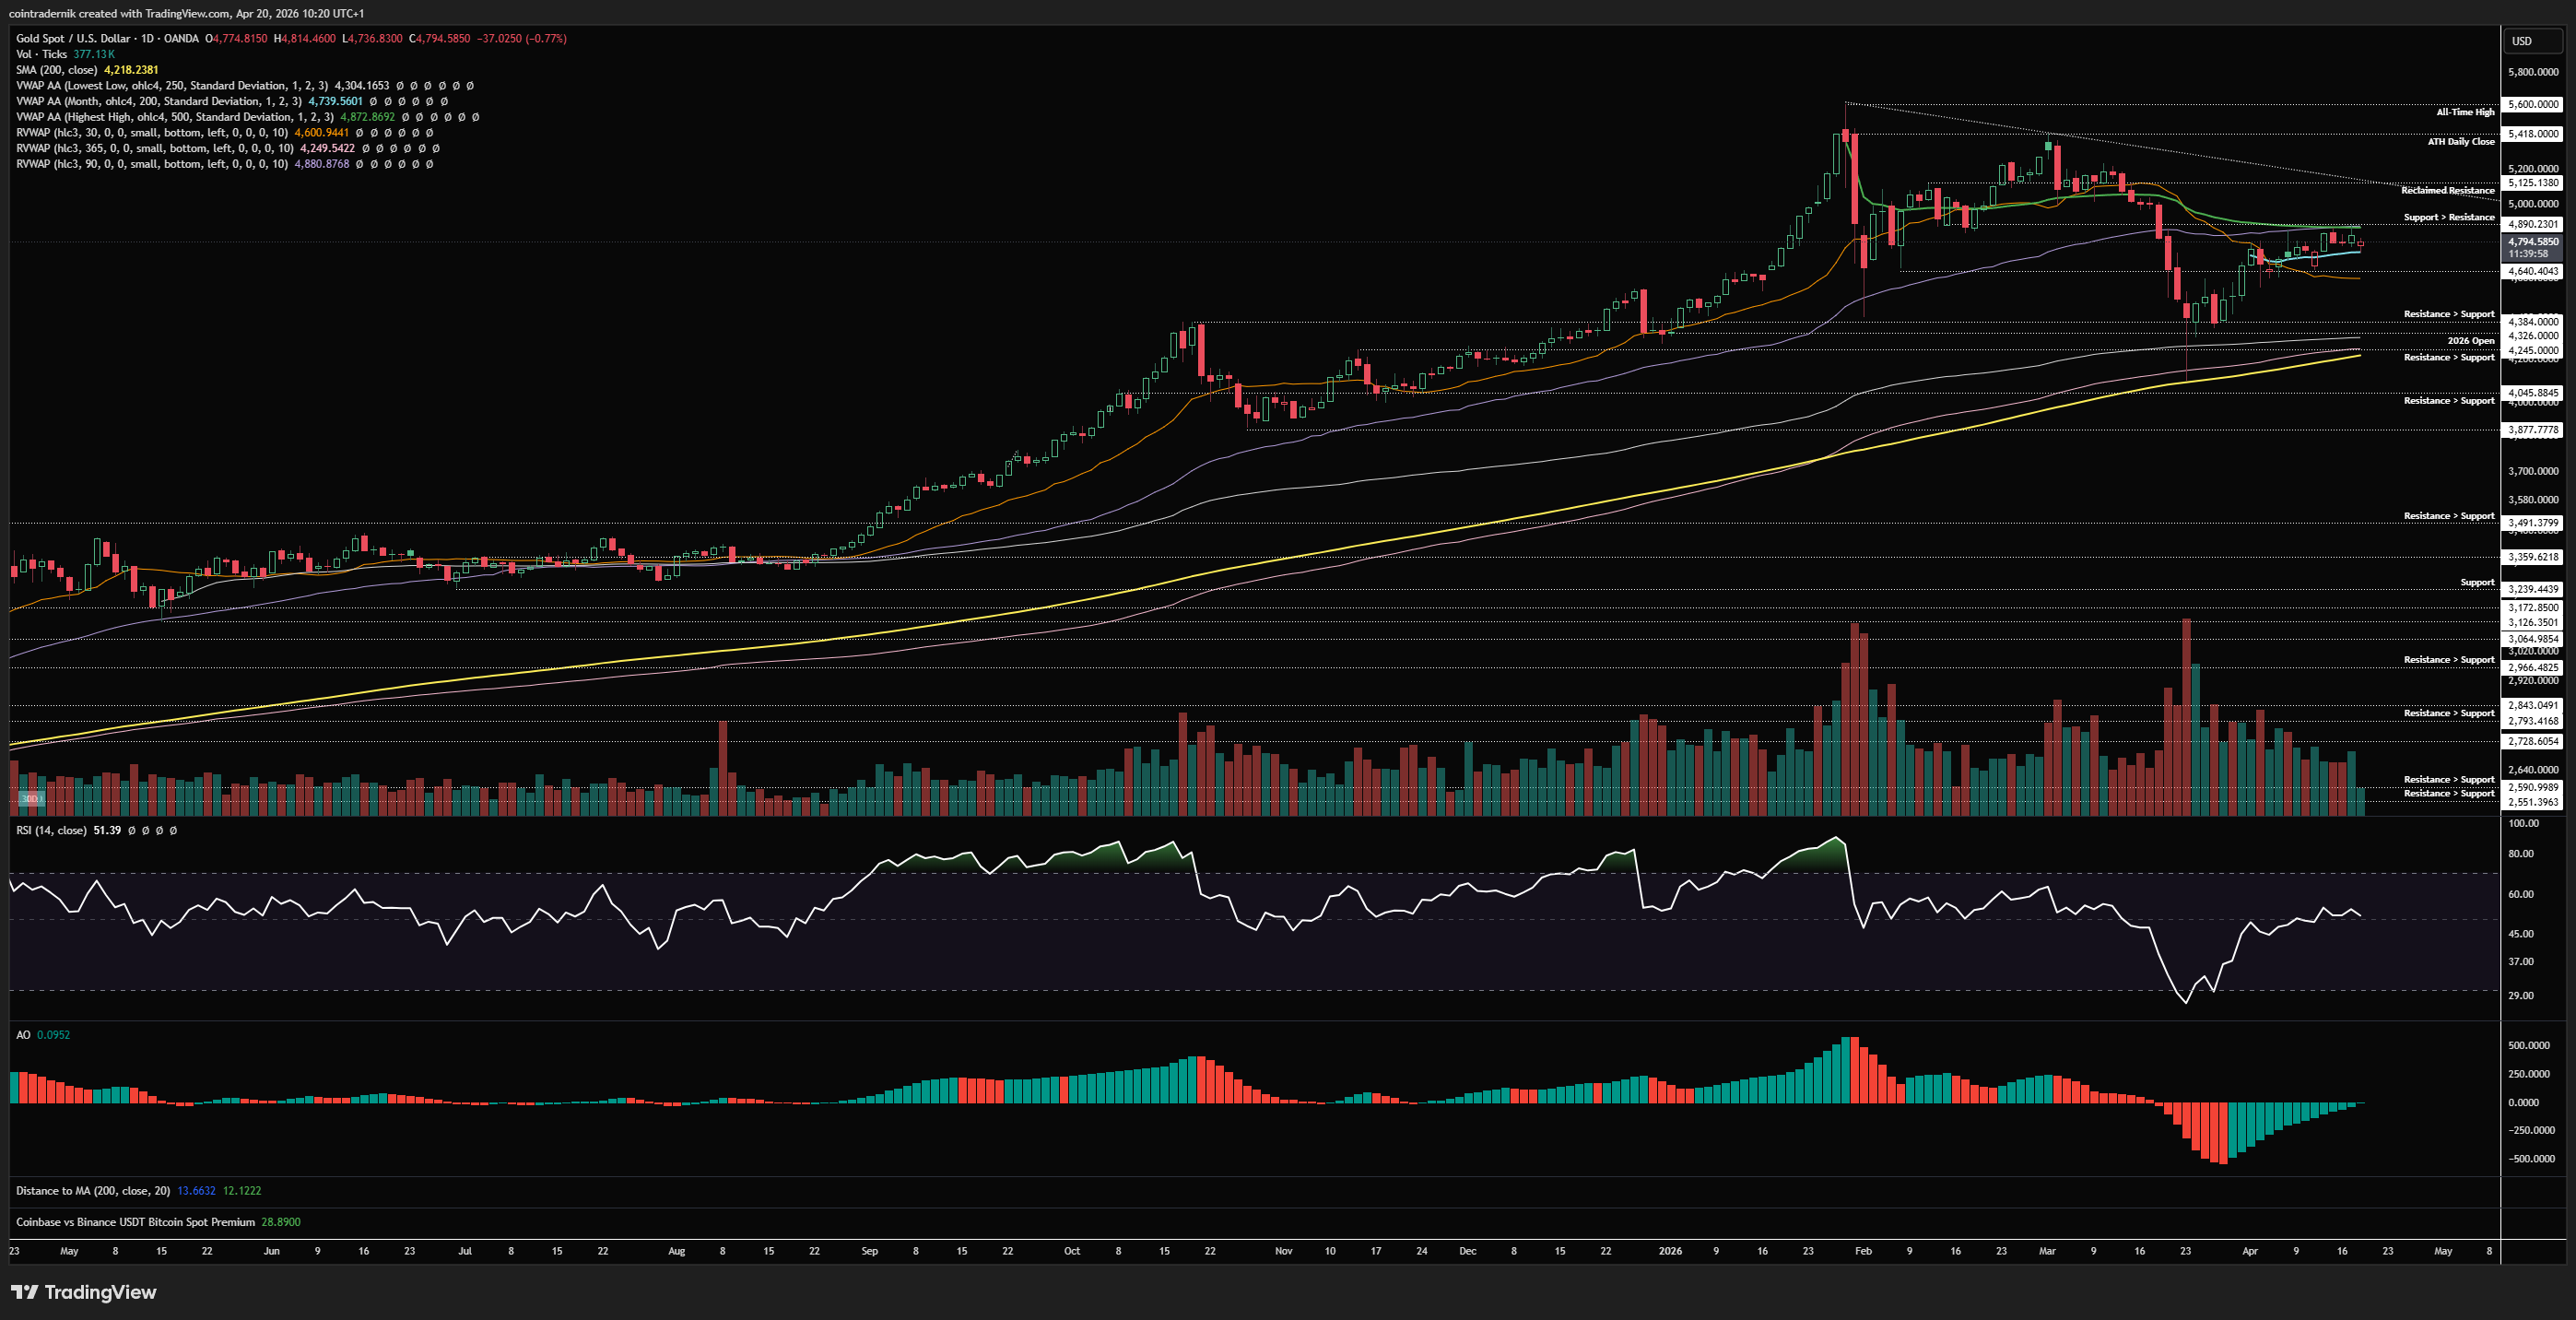
Now, looking at the daily, we can see that daily RSI has pushed marginally back above 50 as price continues to reject every attempt at a breakout beyond $4890, where the anchored VWAP from all-time highs and the 90d rolling VWAP are sat. If we do sweep last week's high, break down and price loses the April VWAP and daily RSI gets back below 50, that's a 'short any intraday rip' scenario for me with invalidation on a close above $4900, looking for $4400ish as major support to be retested in that scenario. I think the most probable path here is that one - where we reject $4900 -> trade into $4250-$4400 -> consolidate and re-accumulate and chop for while -> resume higher from there in the second half of this year and that's the attempt that flips $5000 into support and runs back towards new highs. Obviously, if we flip $4900 here and start pushing higher, that does not appear to be the case and I would reassess and likely look for longs on a pullback into that level as resistance turned support.
Price: $87.45
Weekly:
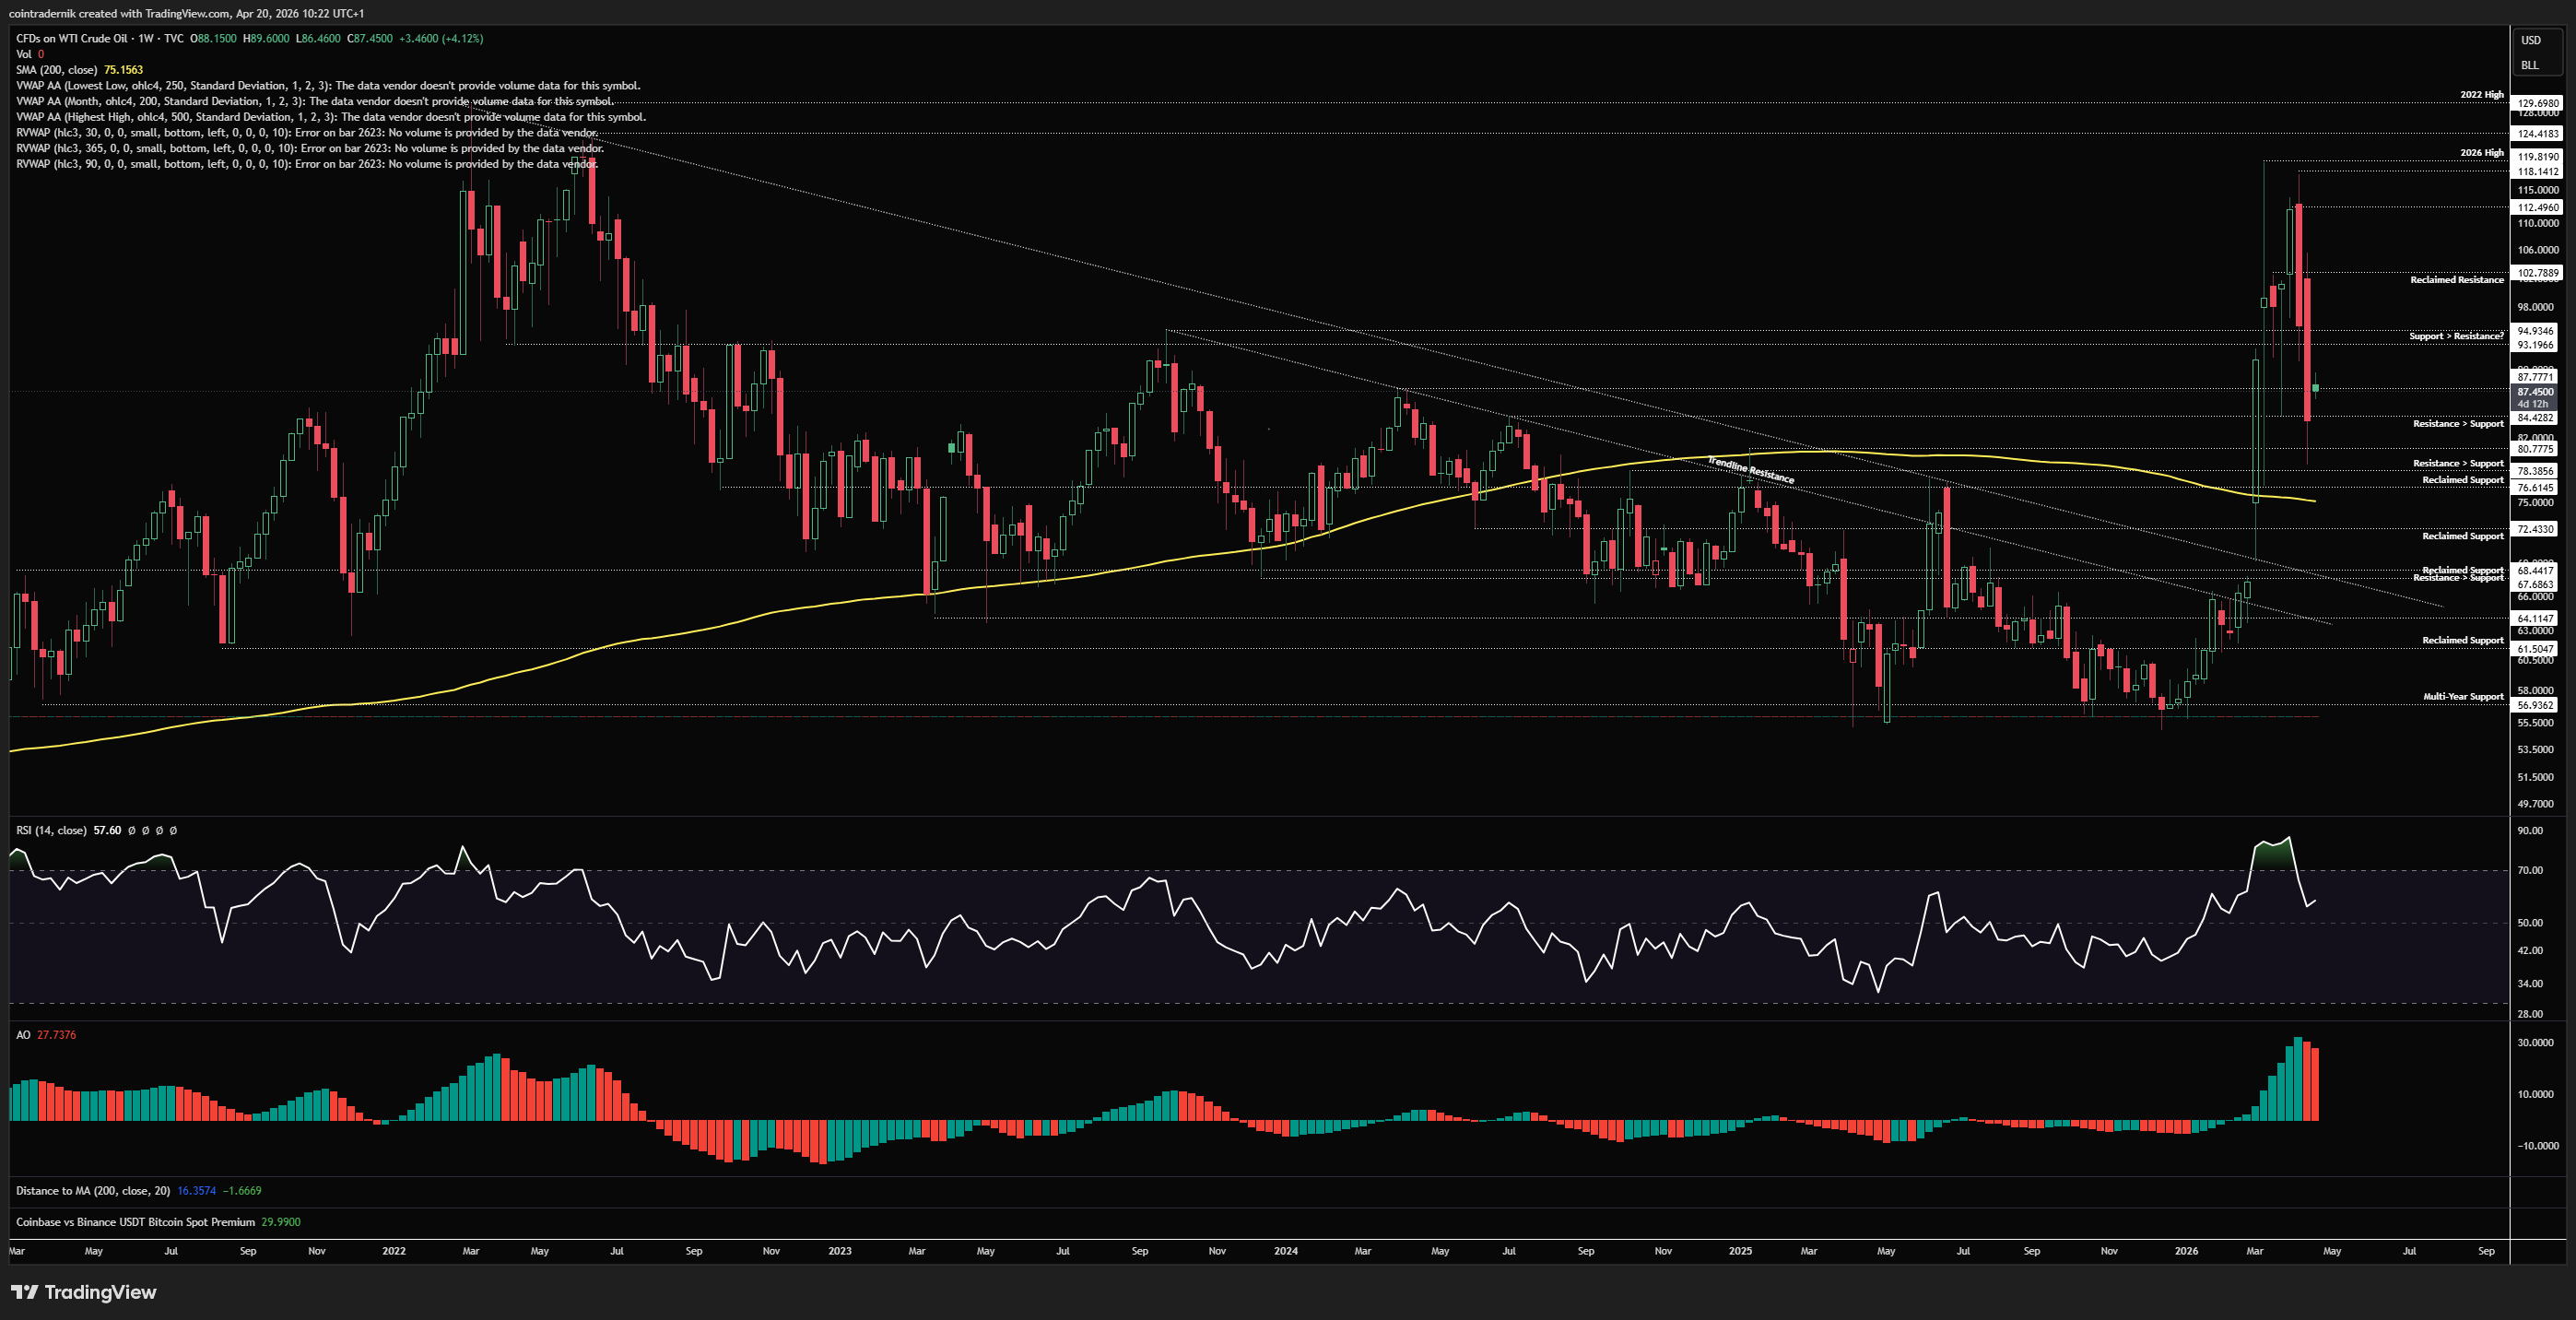
If we begin by looking at the weekly for WTI, does it not look almost identical to that late Jan blow-off top in Silver? We saw price reject below 2026 highs and then close back below $102 a couple of weeks ago, then reclaiming that level as resistance last week, selling off from that open and pushing through support at $93, breaking below $87 and wicking as low at $79 before bouncing to close the week nearer $84. Though not quite as magnificent as the rally off $68, we did just print another monster two-week range and I think it is very likely the highs are in here for the mid-term, with the divergences throughout the prior couple of weeks a clue as to the desire for Oil to sell off versus rally. From here, what should we expect? Well, momentum has come off and reset and price is now back around the mid-range of that initial two-week rally into the 2026 highs. I would be more keen on longs if we took out last week's low towards $77, where I think longs are very favourable for a move back into $95 to retest that prior support as resistance. For shorts, I'd want to see a spike above $95 followed by a breakdown and look to short any pullback into $94ish as resistance subsequent to that breakdown. As mentioned on the week of that $120 high, I think it is very likely the original two-week range remains the range in which WTI trades for quite some time, with longs favourable in the bottom quintile of that range and shorts favourable nearer the top. I do think that the likelihood of WTI accepting above $112 is very low for the next couple of months at least, so a weekly close above that would be where you can put your 'Oil to $200' t-shirts back on.
Daily:
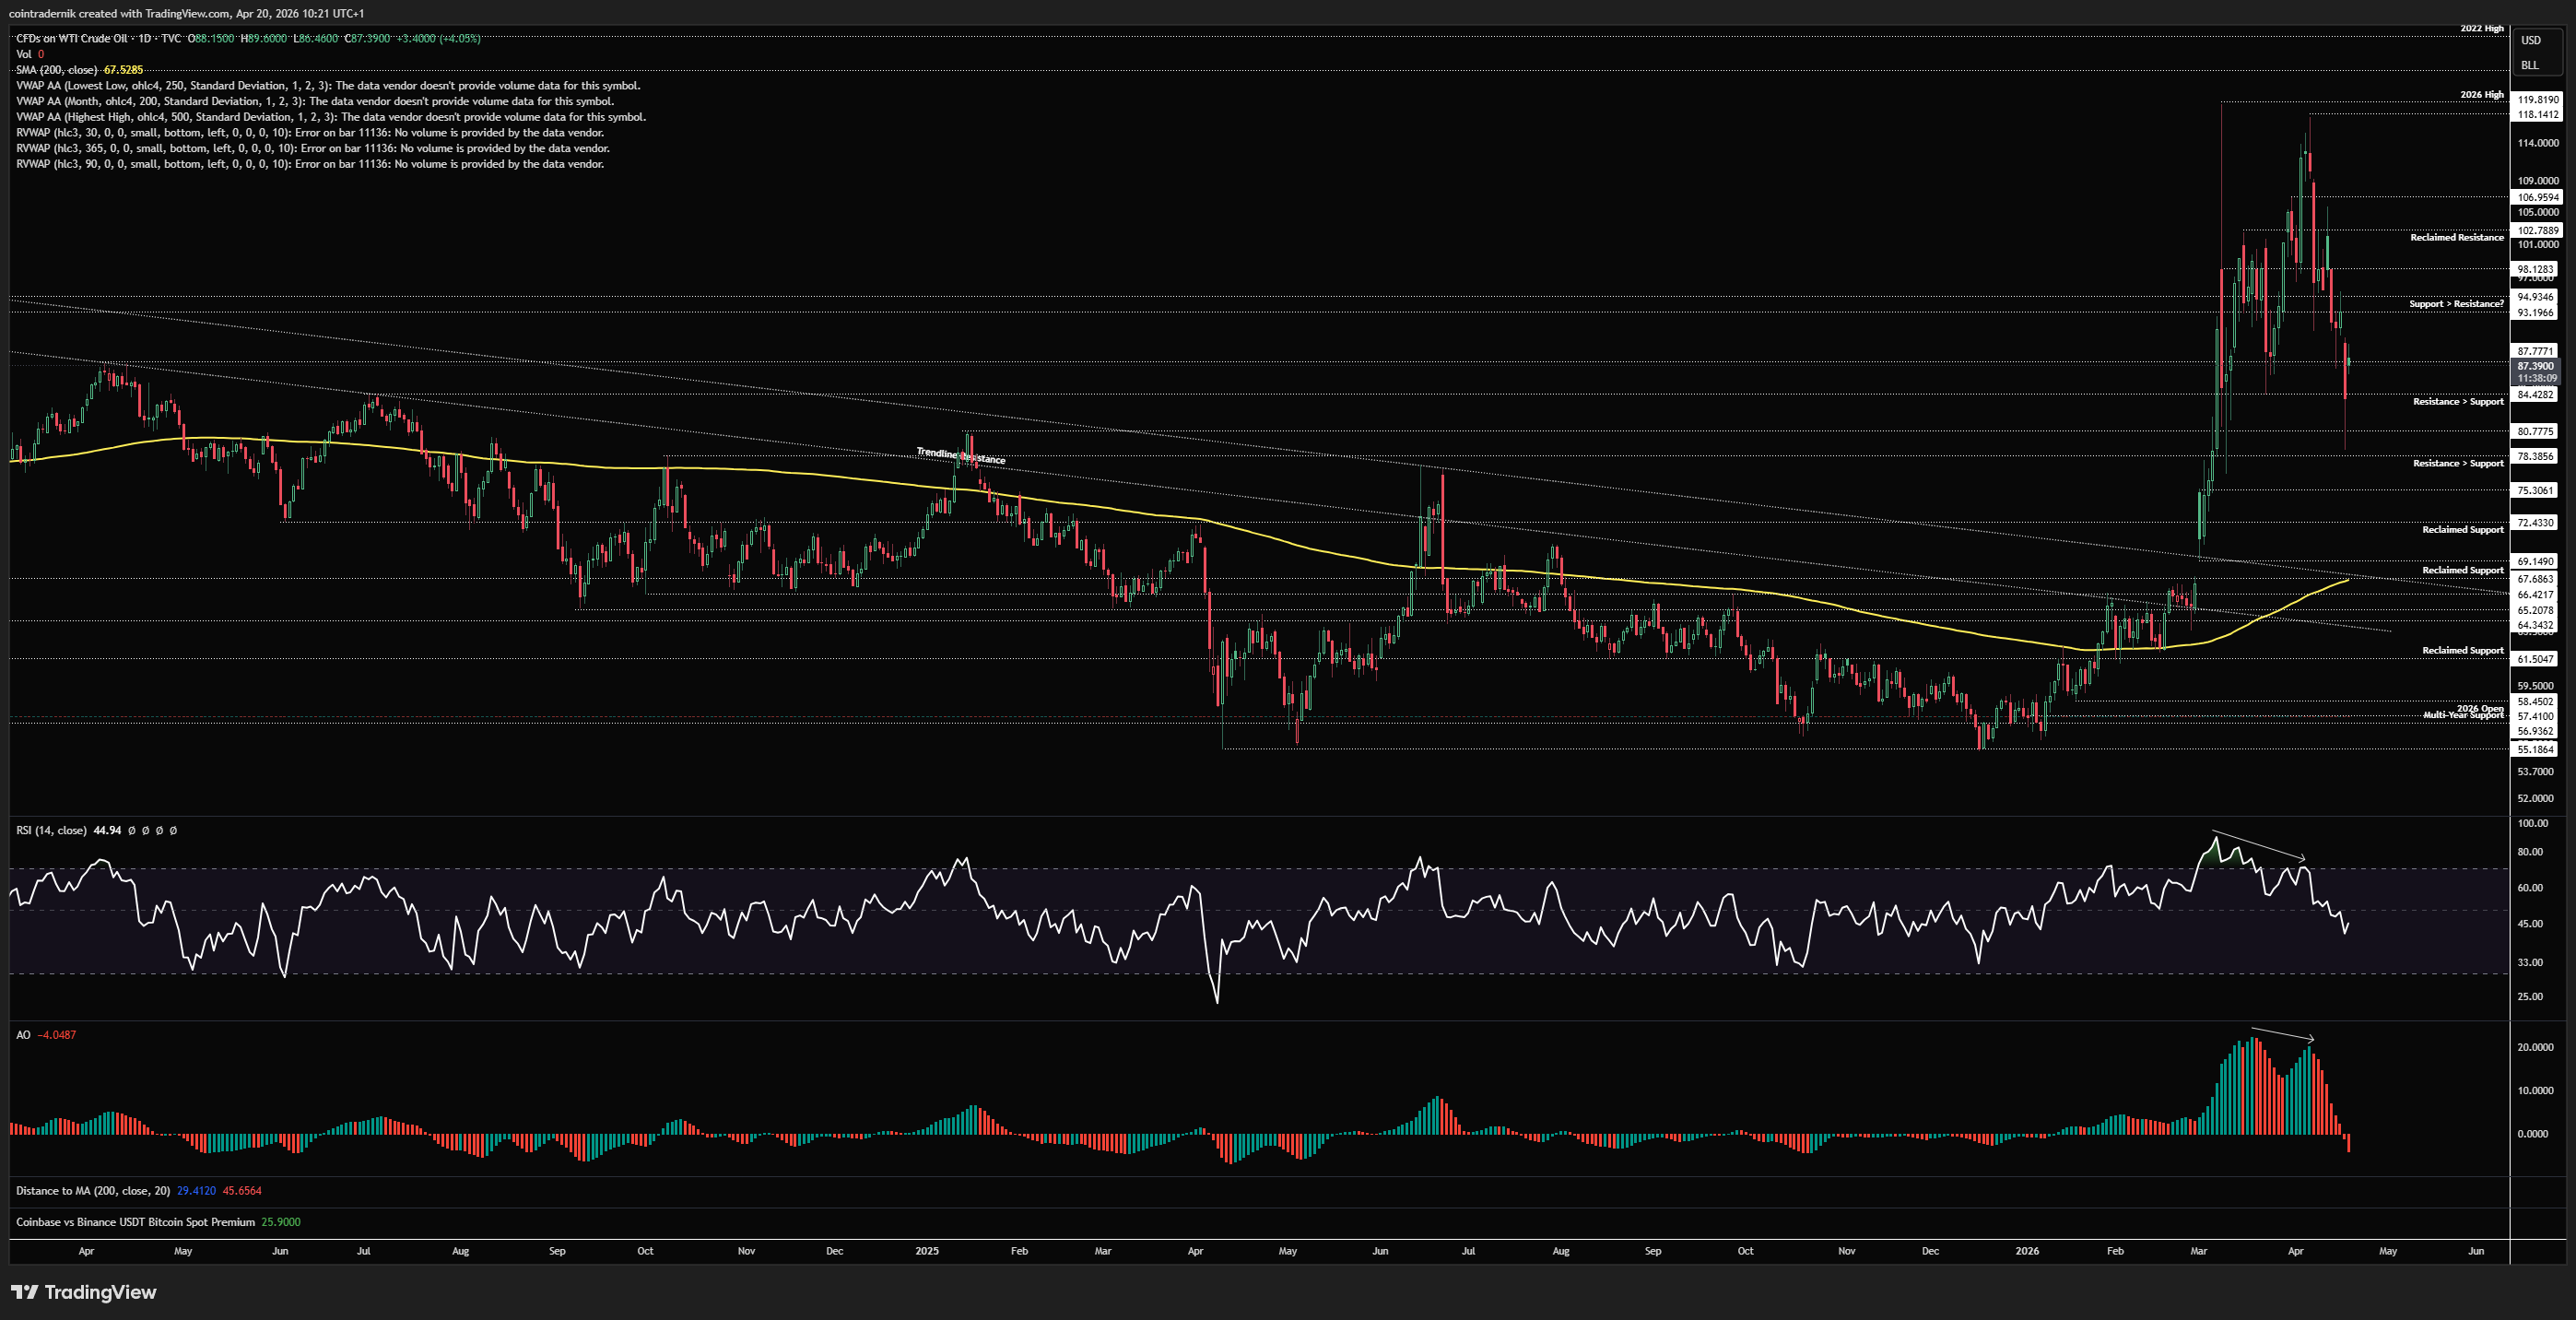
Dropping into the daily, we can see that the bearish momentum exhaustion into those highs highlighted at the beginning of the month were not invalidated, itself confirmation of the inherent weakness in the rally into that $118 lower-high, which then led to the puke and breakdown, with daily RSI now back below 50 for the first time since January. Momentum is completely broken here on this timeframe, which is more confluence for the range-bound view, and also supports the likelihood of another lower-high formation on any push higher from here, where you would want to look for shorts. I do think it is clear there is structural demand here to keep prices elevated above that initial $69 low off that first gap higher, so you want longs as close to that as possible, which is why I am looking for a sweep of last week's low towards $75-77 to load up on longs, with a close below $69 as the obvious invalidation of this entire range (and the sustained bullish Oil narrative). If that low is lost, I think it will be a very long time before we trade near those yearly highs again.
Quick one: if you're enjoying the read and want to make the most of the setups shared, you can earn double points all this week on NDX, TSLA, NVDA, GOOG and BTC at Ostium: https://ostium.app/trade?from=CL&to=USD&ref=CTNIK
Receive the latest updates directly to your inbox

Price: $6.07
Weekly:
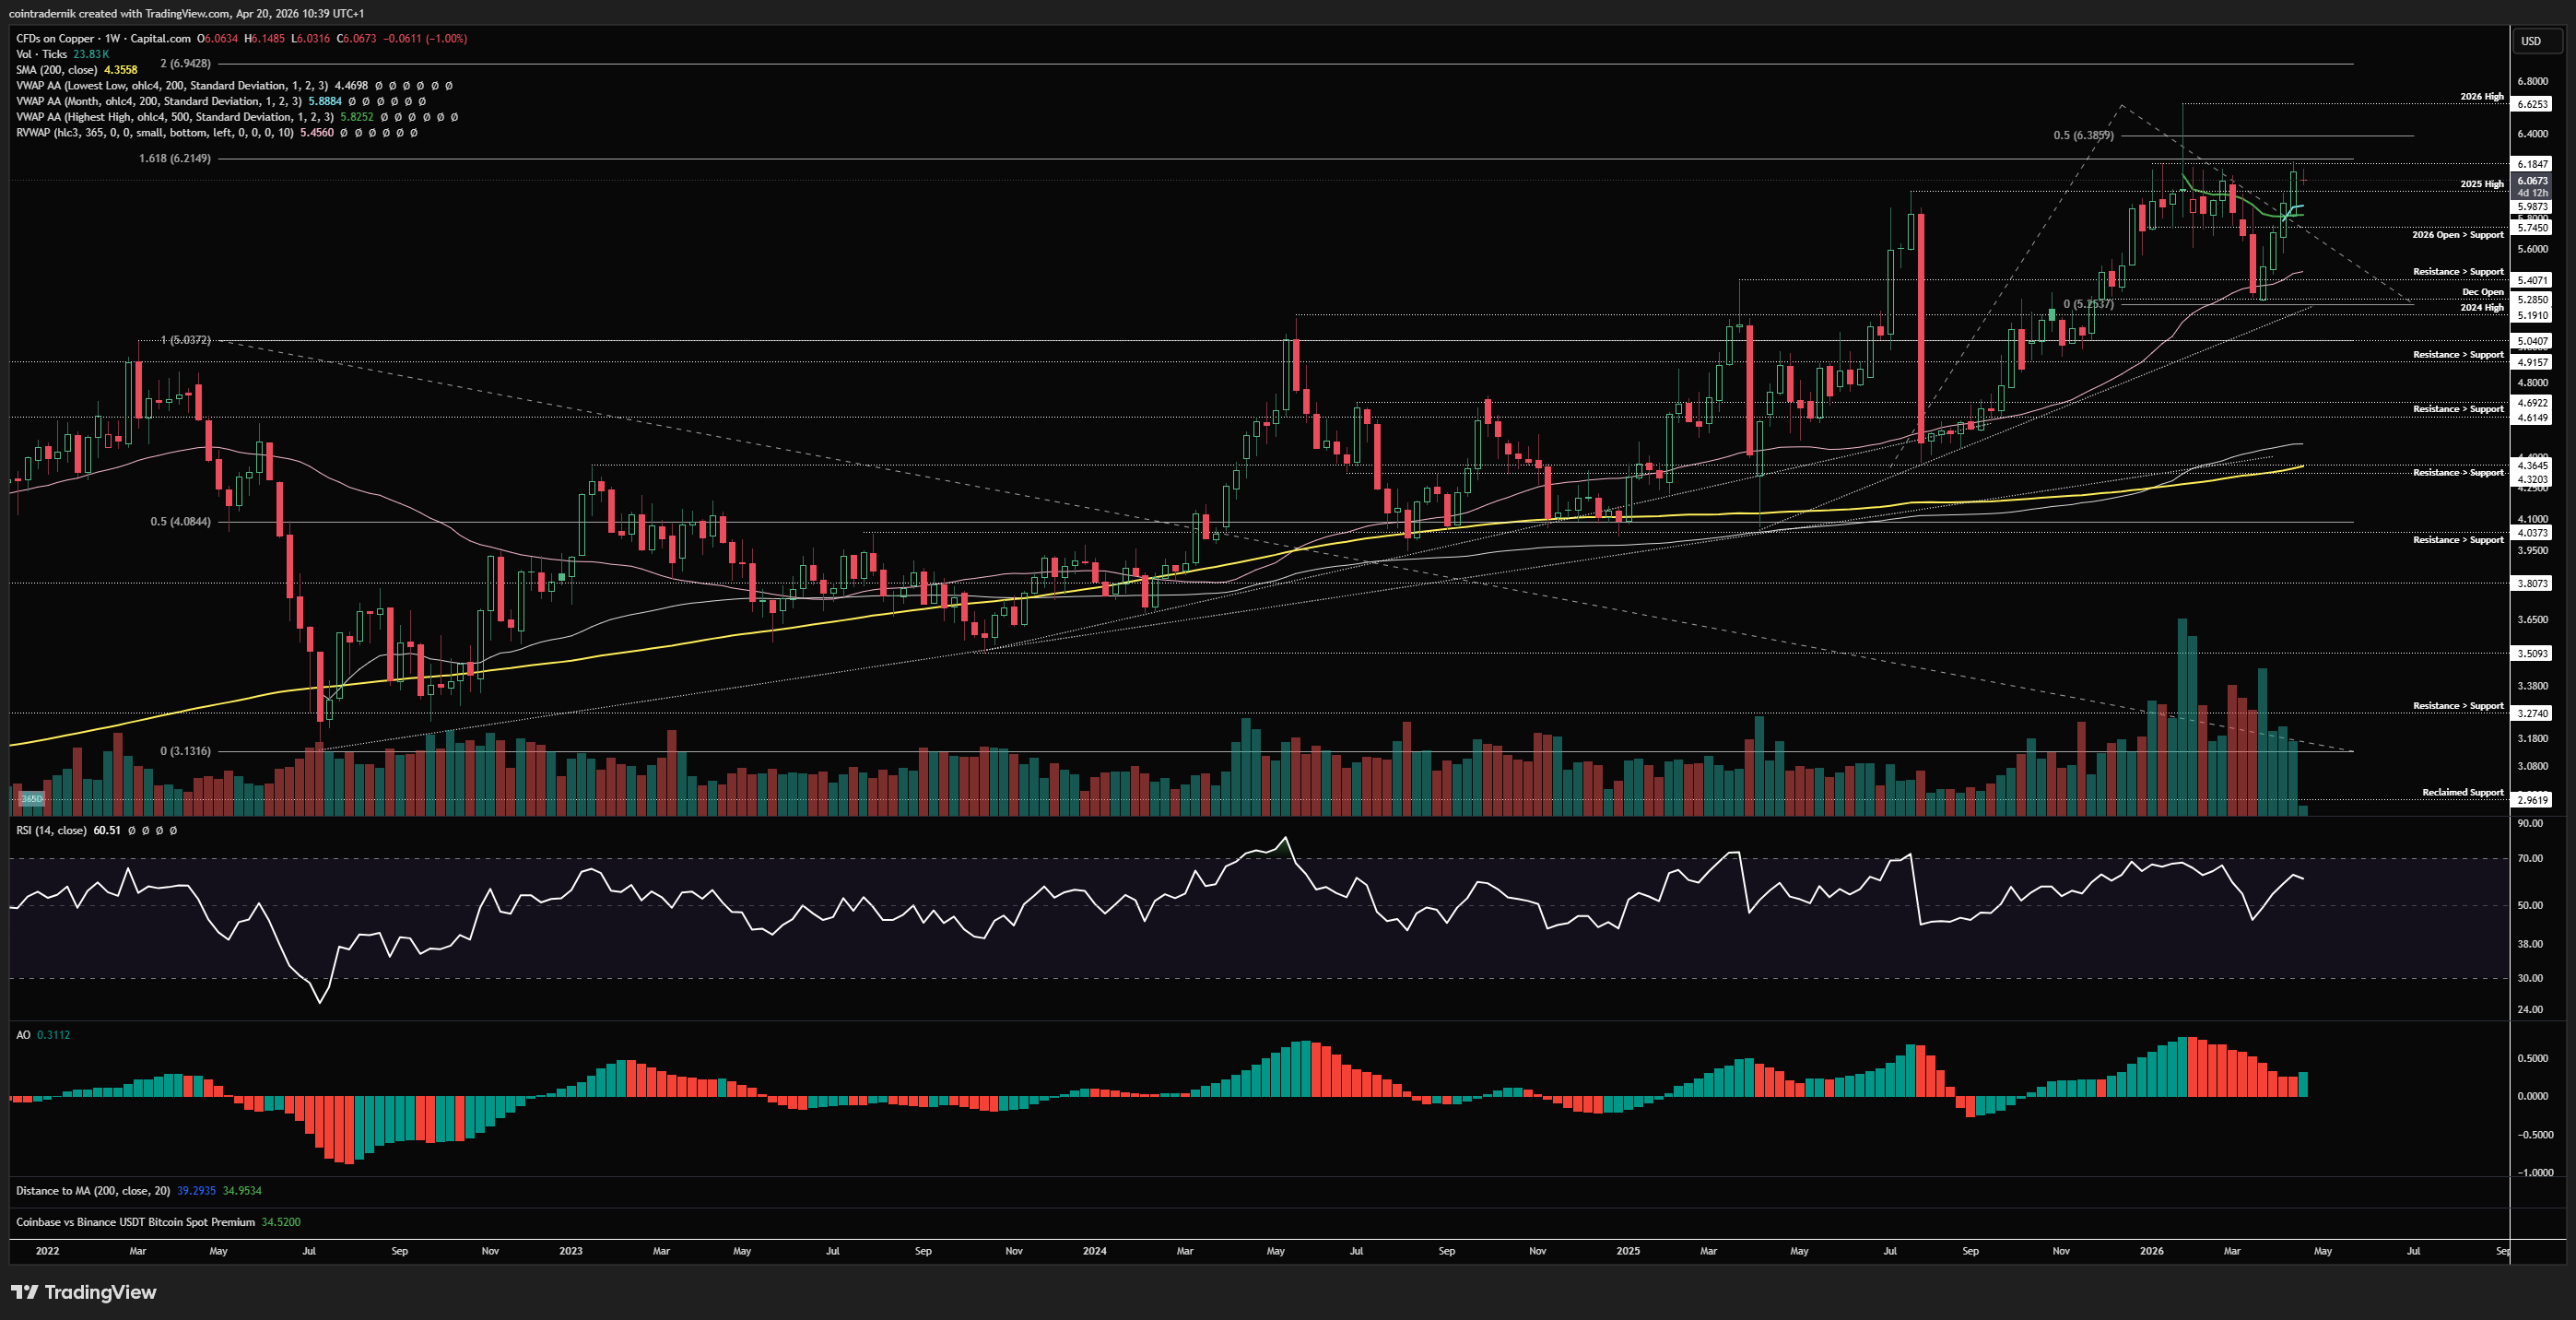
If we begin with the weekly timeframe for Copper, we can see just how strong that v-reversal has been within this long-term bull market, with price deviating below the 365d rolling VWAP into the 2024 highs, catching a bid and reversing the three weeks of downside in as little time. Price closed above the anchored VWAP from all-time highs a couple of weeks ago, then flipping that level - marginally above the yearly open - into support. This led to last week's rally off the weekly open through the 2025 highs into the last major resistance level on the chart at $6.18, which capped multiple weekly highs since late last year and is the final boss before acceleration of this trend through $6.60 towards $7. If we close the week above $6.20, I think you're looking at intraweek dips as long opportunities for the next 15% move higher. If we wick above last week's high and then reject again and break down on the daily timeframe, we might have a different outlook, where subsequent acceptance below the 2025 high would look more like the formation of a major top, but I think that is quite unlikely on the distribution of probable outcomes for Copper. The real nail in the coffin would be if we flipped the 2026 open back into resistance, where I think you can be short all the way back through the yearly low back towards $4.60 to be honest, but again I do not think that is likely and I think you're better looking for longs above $6.20 towards $7.
Daily:
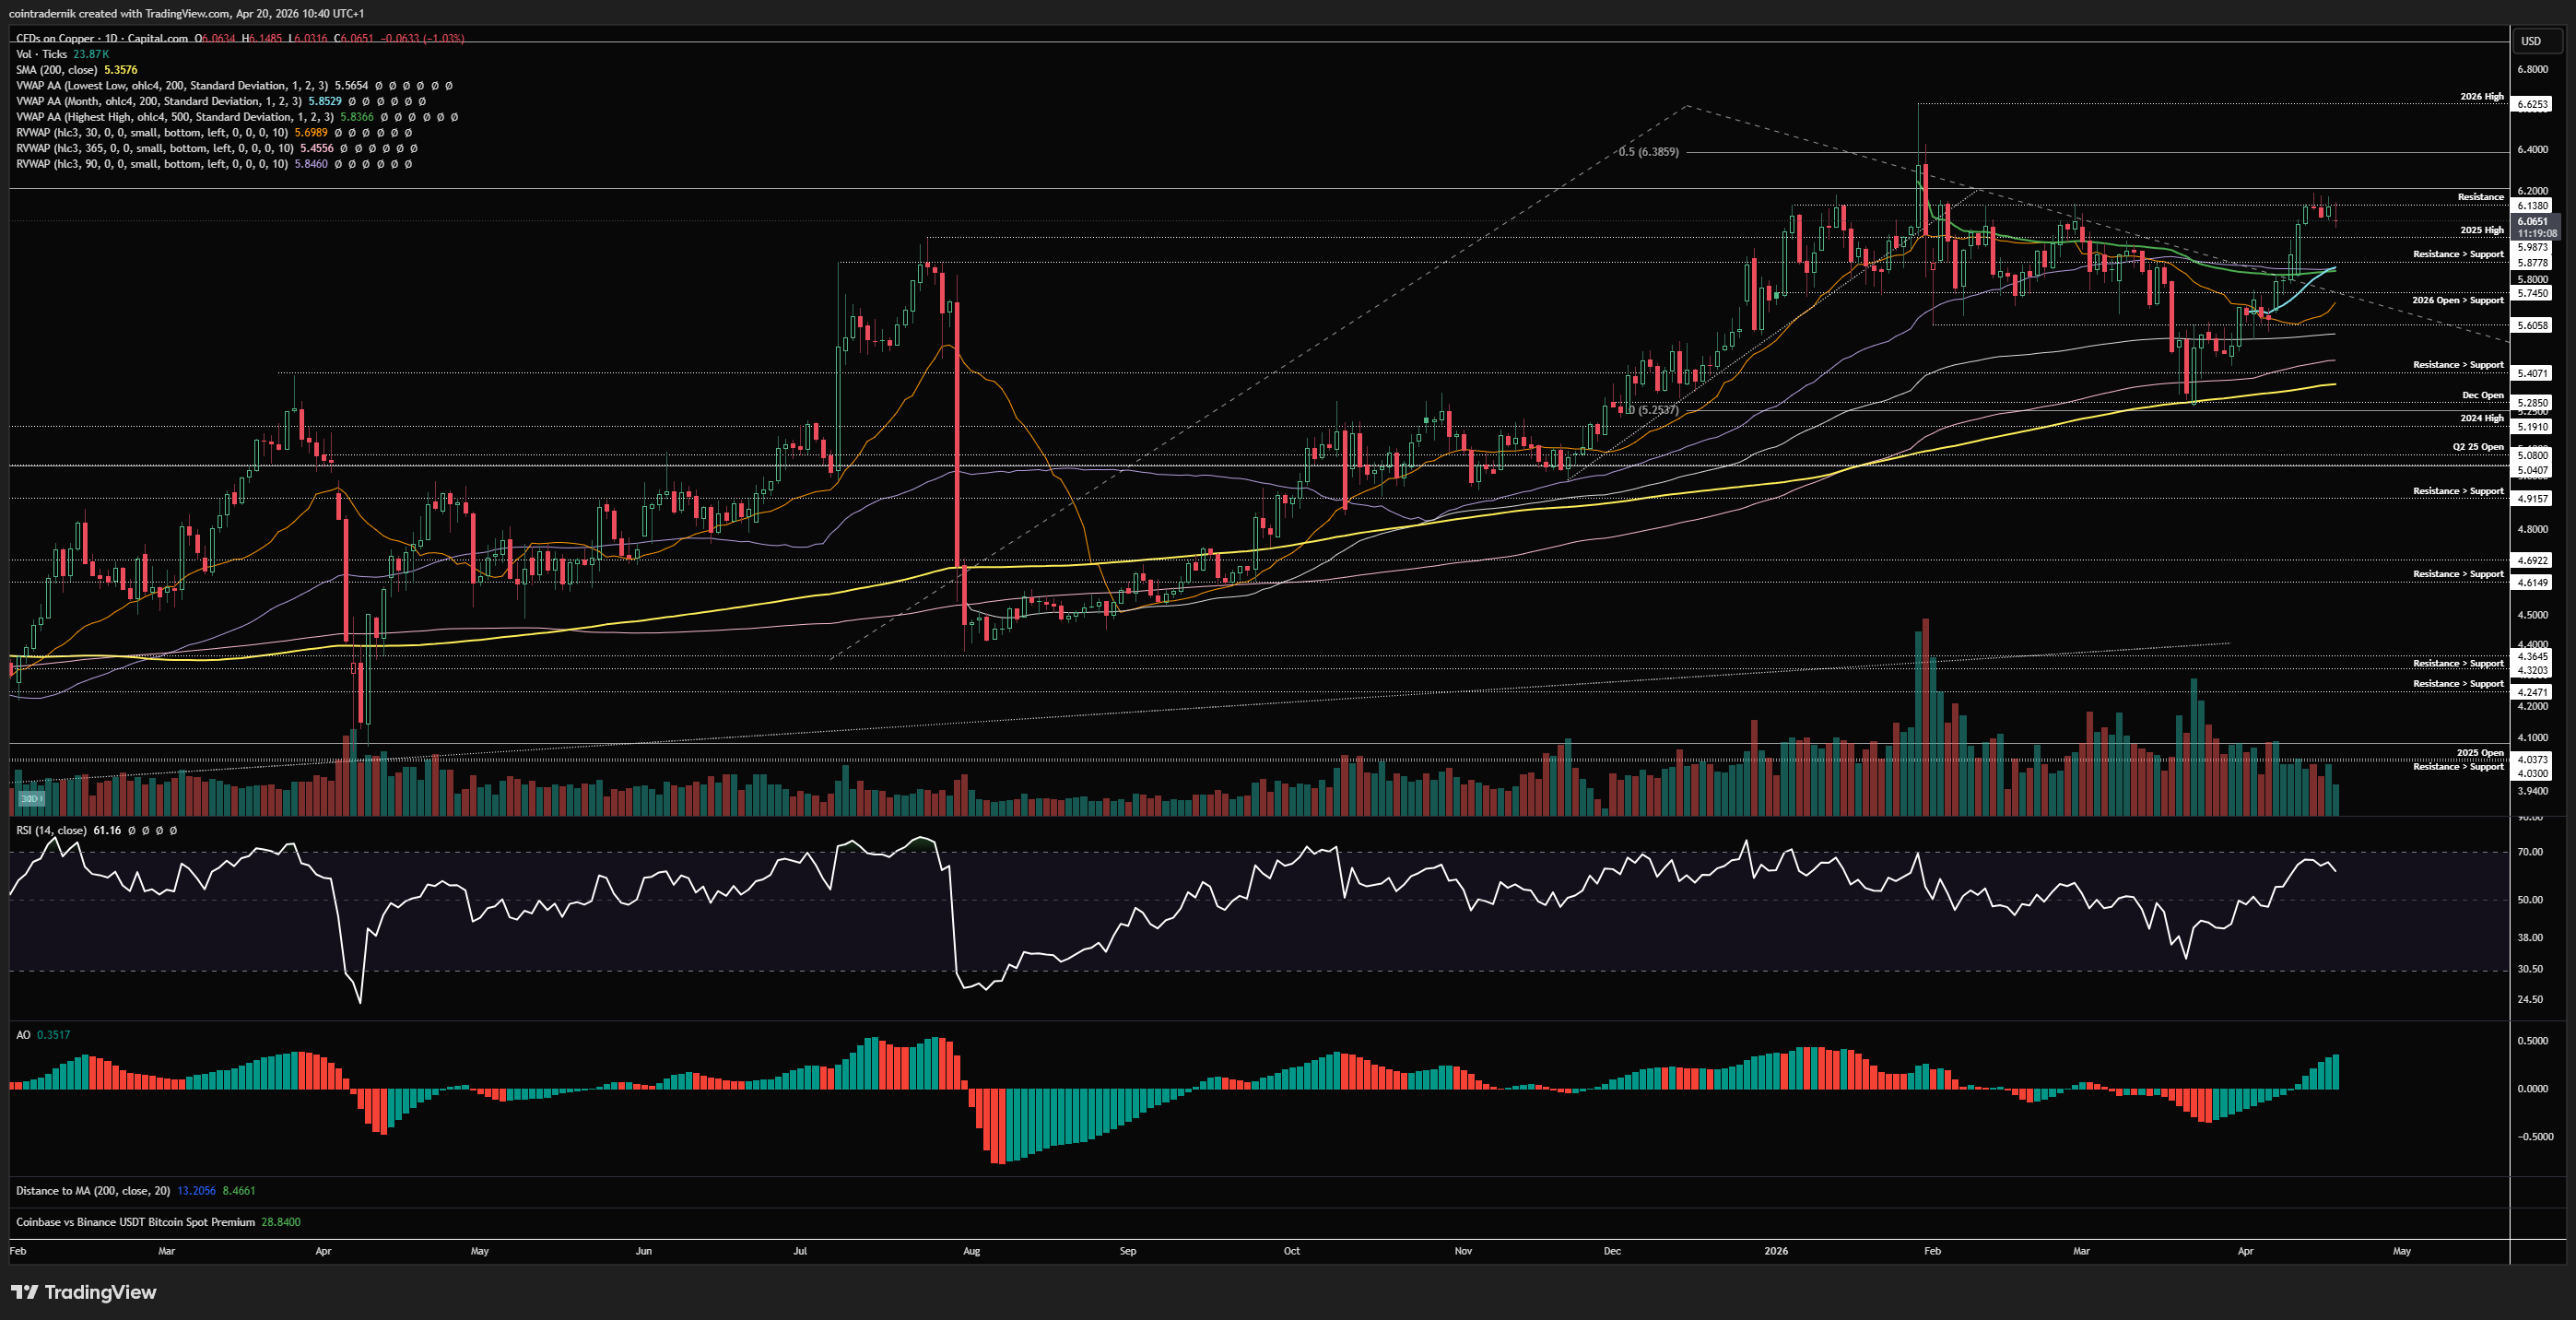
Dropping into the daily, we can see that price v-reversed off the 200dMA after deviating briefly below the 365d rolling VWAP, with price reclaiming it as support immediately after closing below it. We then rallied back above the anchored VWAP from the August 2025 lows, flipping that into support, then finally flipping that anchored VWAP from all-time highs, which had capped the rallies in March. This was a pretty clear signal of strength, alongside daily RSI back above 50, and we have seen that strength persist with price now consolidating below the most important resistance level on the chart. Should we fail here, I would look for long setups at that confluence around $5.90 for the formation of a higher low and then continuation through $6.20 - and I think if we get it then that'll be a high R/R area with a very clean invalidation. Above $6.20, clear skies really...
Price: $75,213
Weekly:
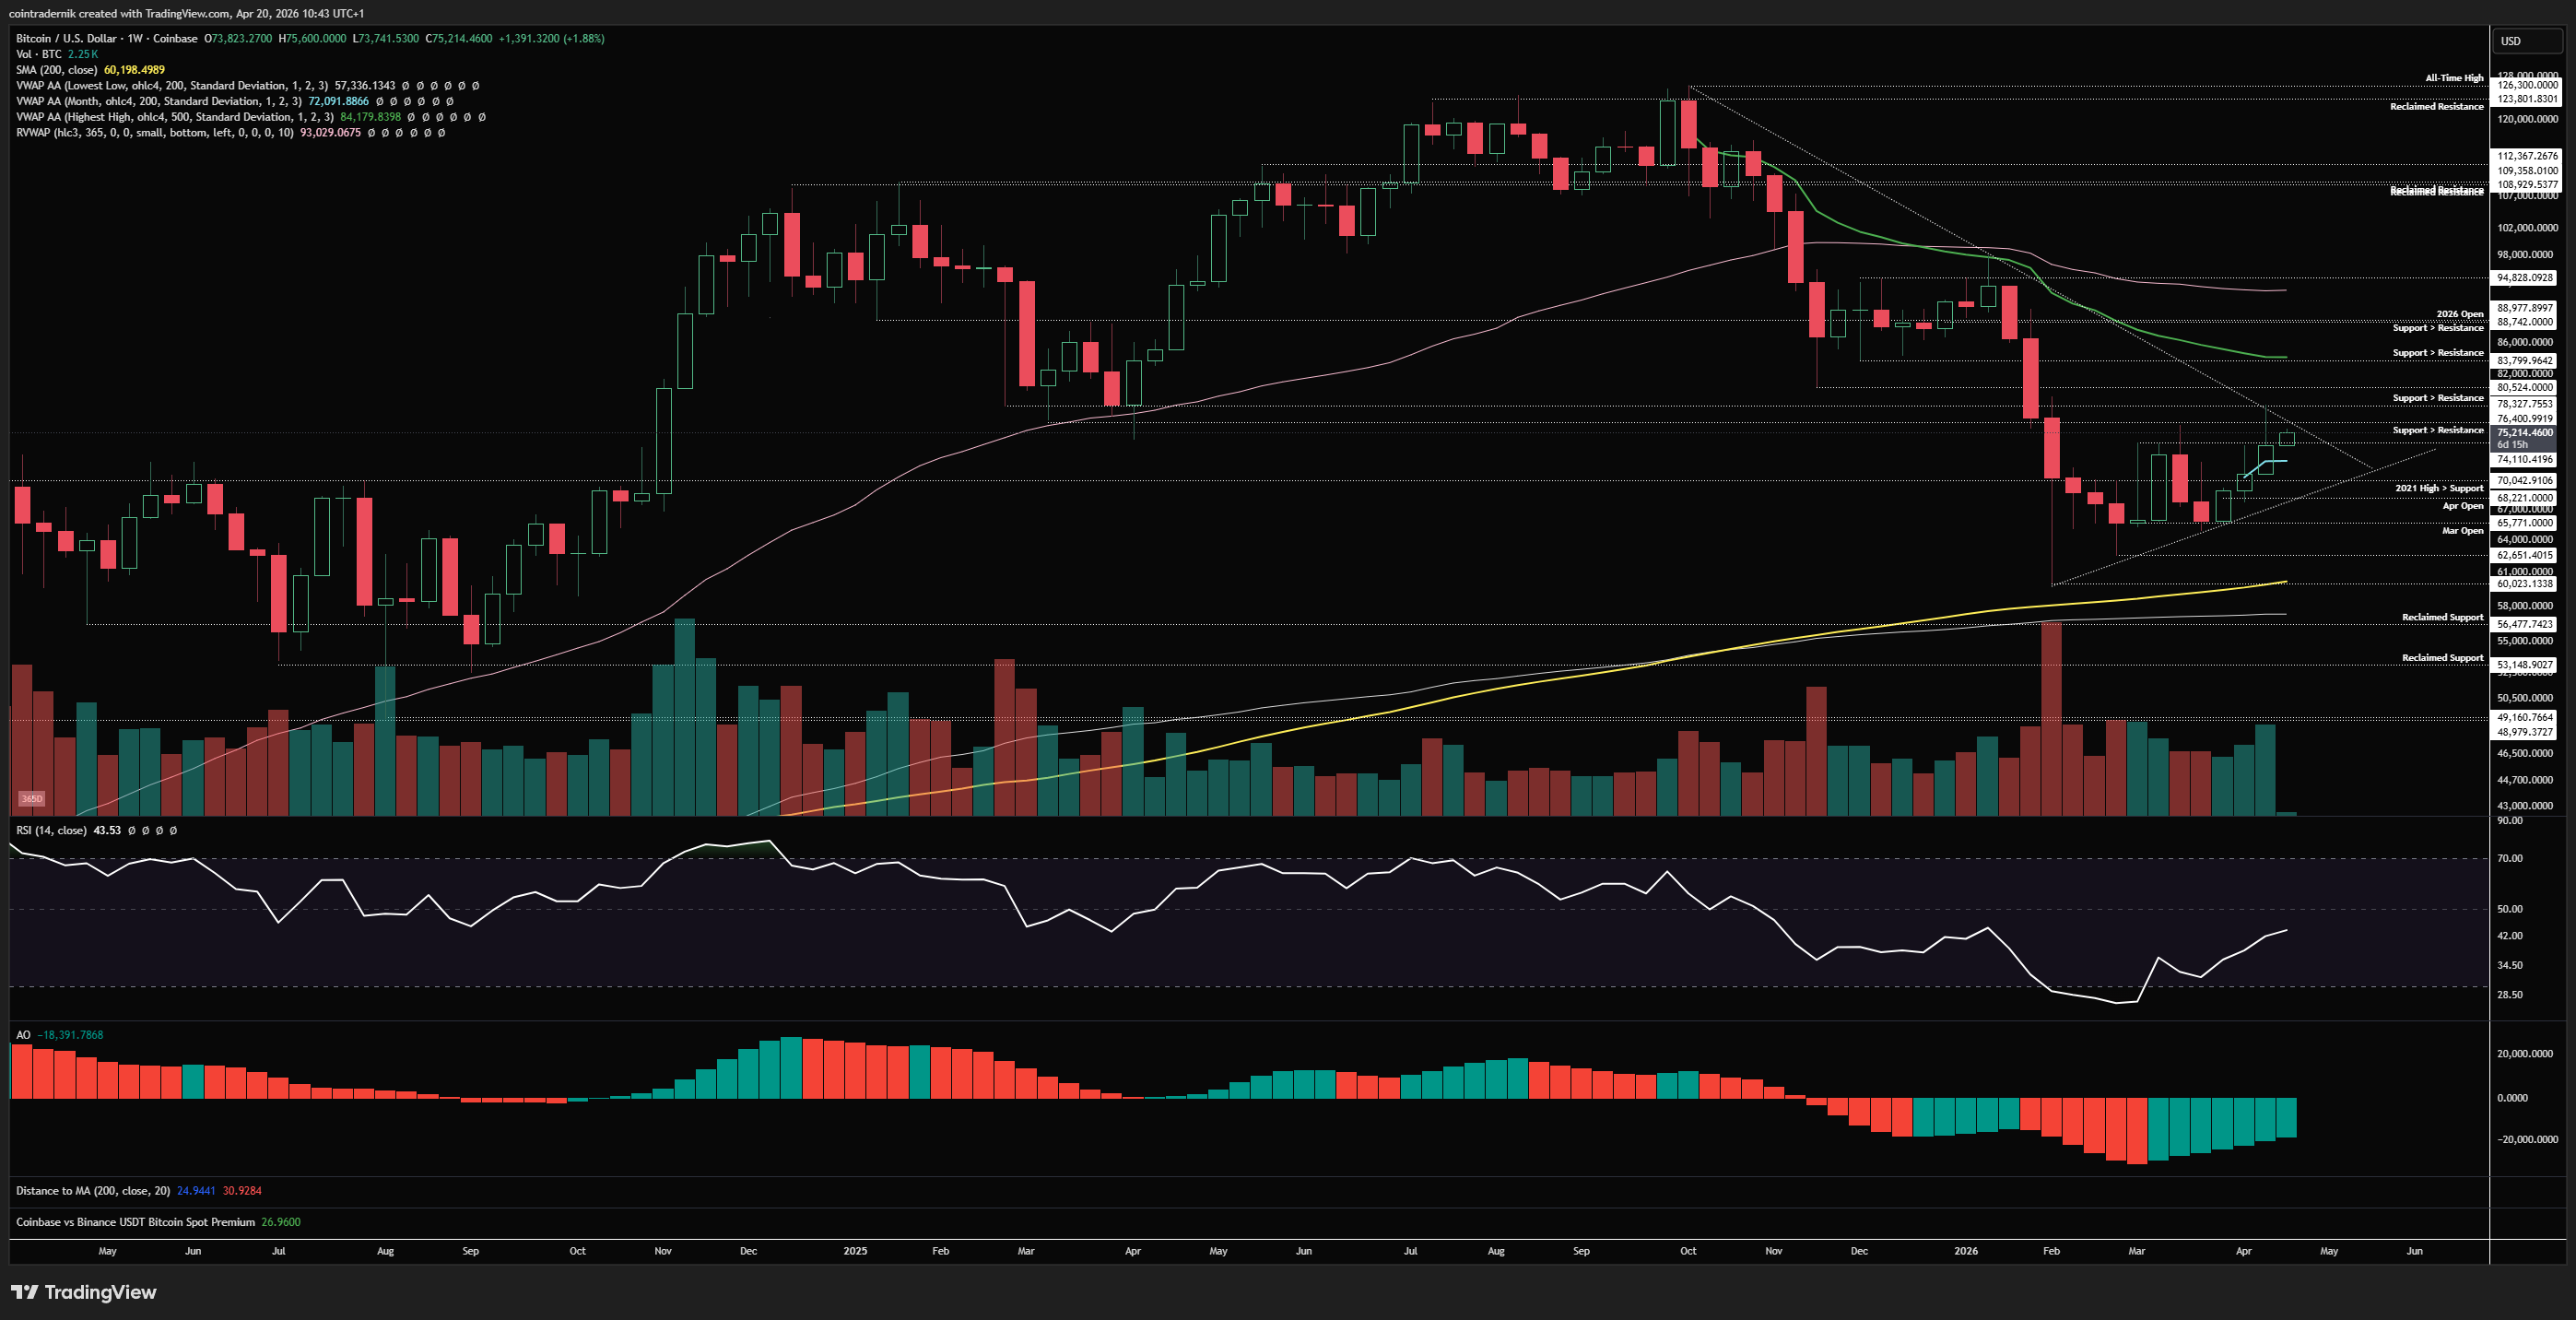
Now, looking at Bitcoin on the weekly timeframe, there is a case to be made that we just turned weekly structure bullish if your criteria for bullish structure is a higher-high on a closing basis and not on a wick. My personal preference for structure is to include the wicks on the higher timeframes, so I would be looking for a weekly close above $76.4k to confirm bullish structure, and that would also confirm a breakout above trendline resistance from the all-time high and would no doubt lead to a retest of major resistance at $83.8k, where the anchored VWAP from all-time highs is also sat. Should price wick above last week's high and fail (or even just mark out a lower high below $76.4k this week and break down), we have a more bearish setup short-term, where at the very least we should expect $70k to be retested as support, below which the path back to the 200wMA and anchored VWAP from the prior bear market low becomes much more probable. For now, we are holding above key support, and if we do close this week above $76.4k, I think $84kish comes faster than most expect and the reaction at that level will be very important. Naturally, I am expecting sellers to step in en masse at that level should we test it over the next few weeks, and if we then hold a higher-low above $76.4k, it's pretty clear to me this cycle's 'low' is in, well before October 2026. If, instead, we reject $83-84k and then close back below $76k, the mid-term picture is very much in favour of the classical 4-year cycle low in Q4 and I would expect that to occur around $56-58k. I think expectations of a significant leg lower below $60k are extremely unlikely. Looking even further ahead, if/when we close the weekly above the anchored VWAP from all-time highs (currently $84.2k), we are on the path back to new highs.
Daily:
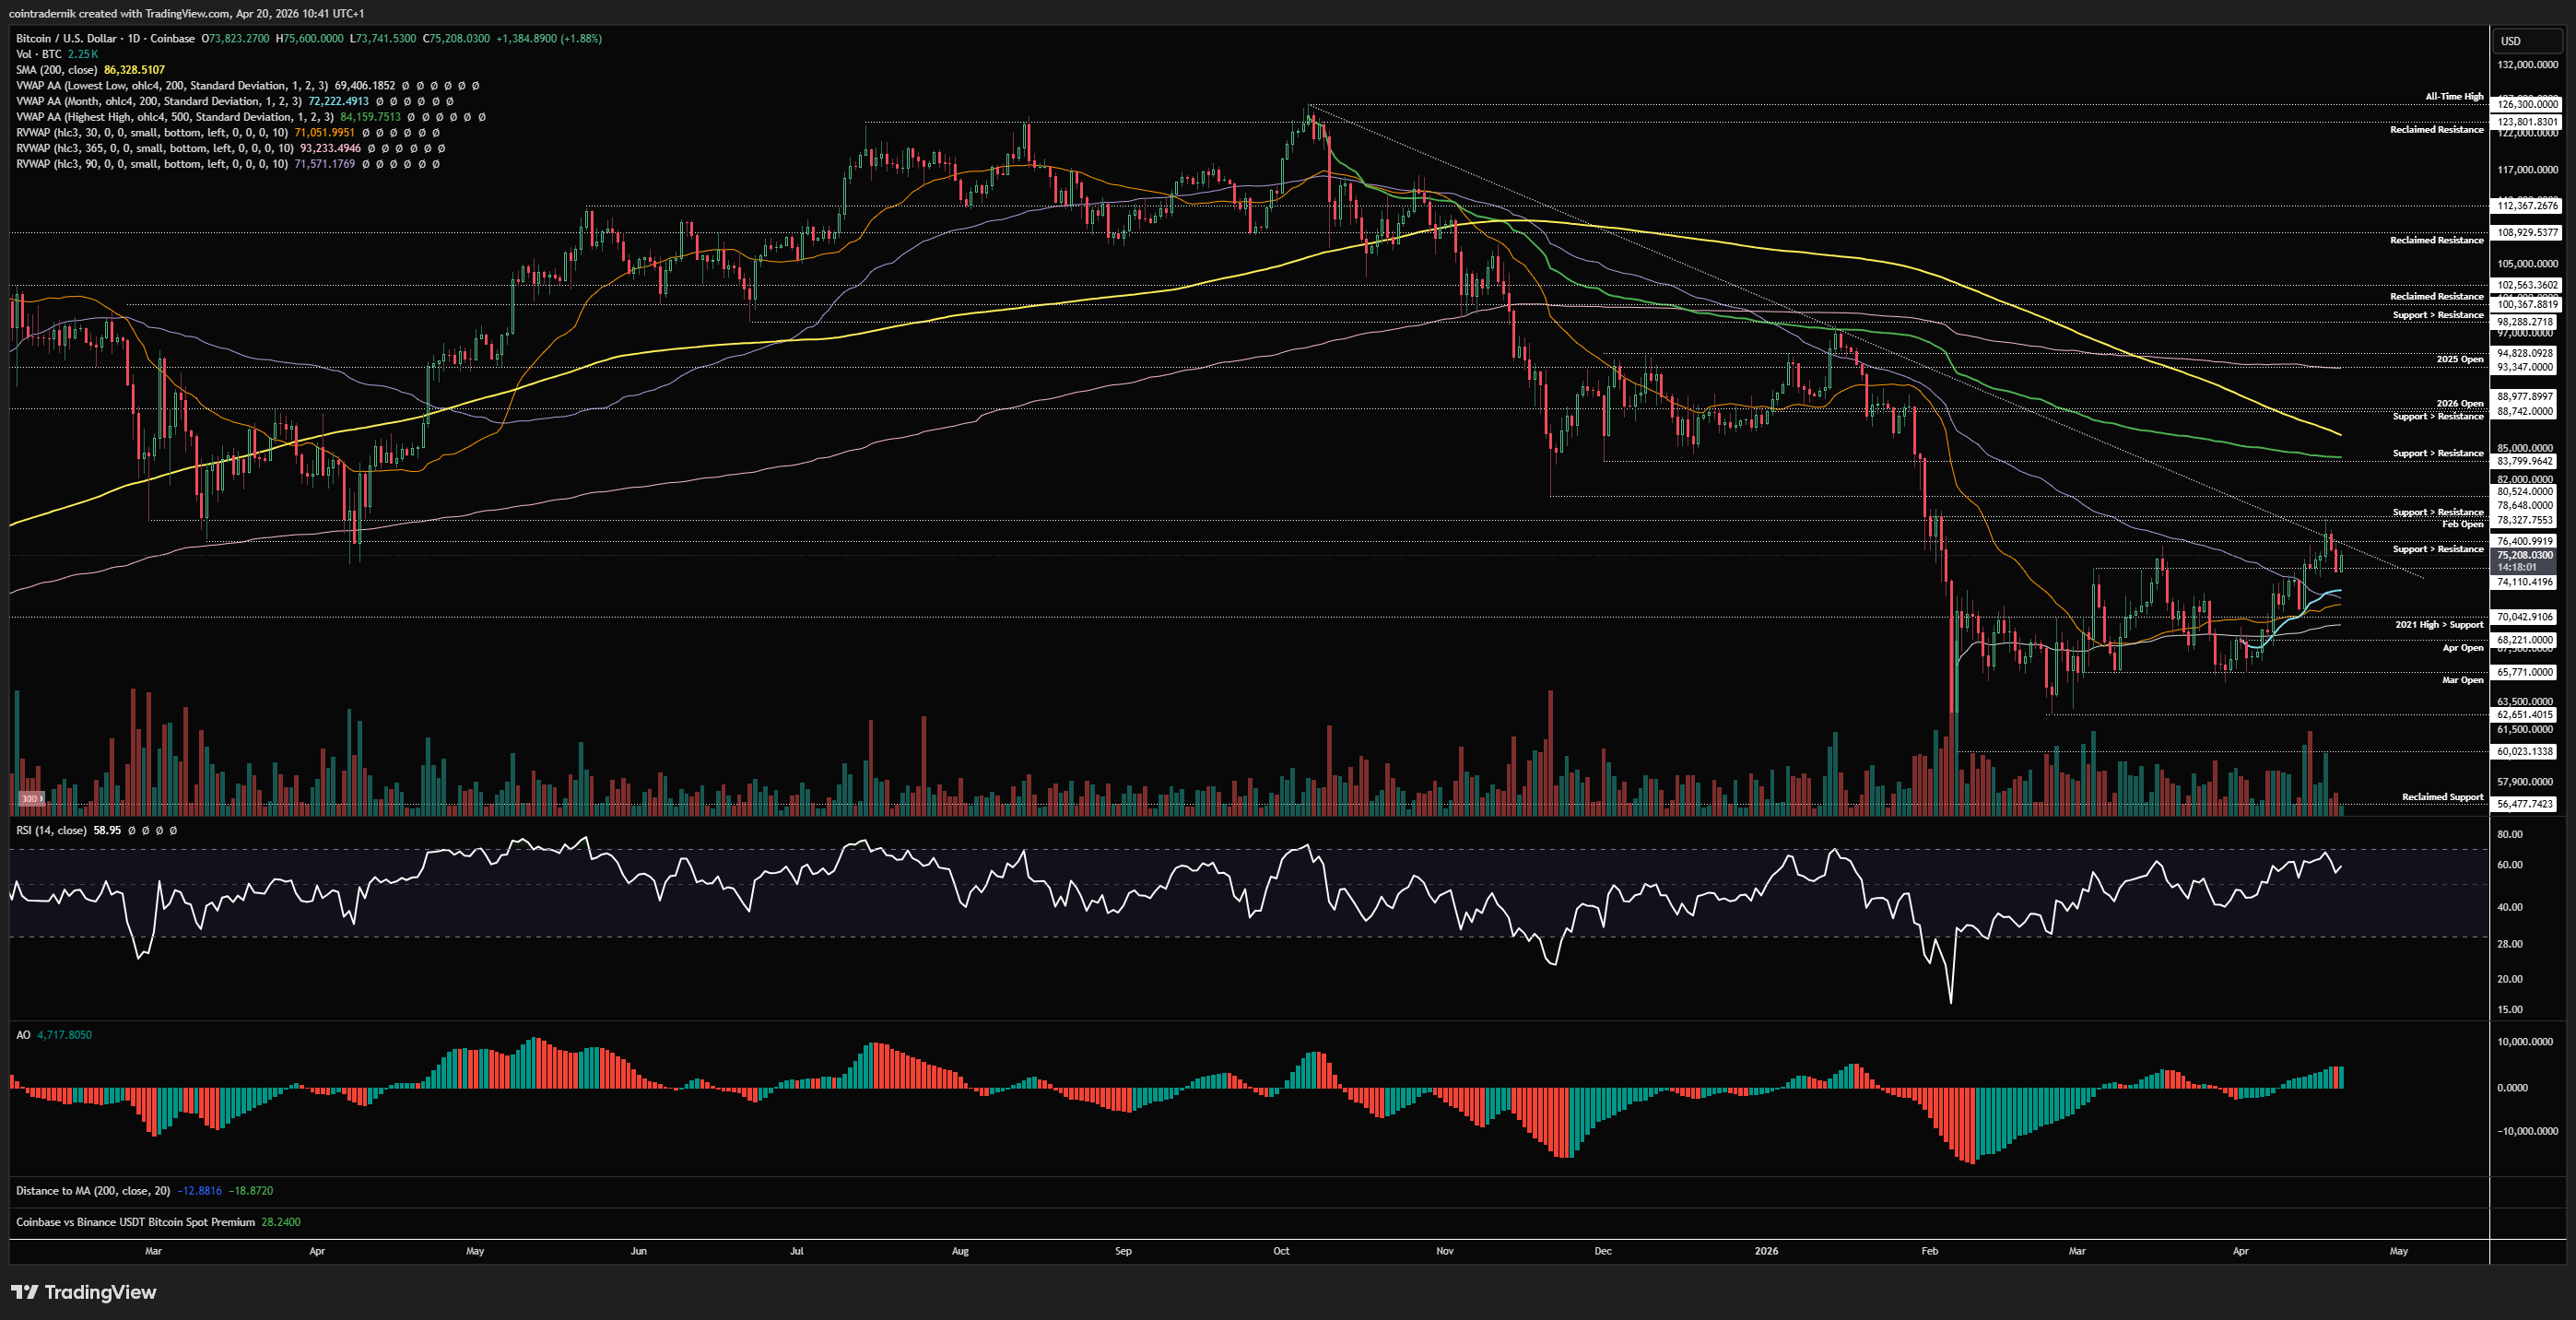
Finally, dropping into the daily timeframe, daily structure remains bullish, as does momentum with no exhaustion as of yet. Price is above prior resistance at $74k, as well as the April VWAP, 90d rolling VWAP and 30d rolling VWAP. In my mind, to get bearish I would need to see price fail below $76.4k early this week and then close back below the 90d rolling VWAP (and obviously not immediately reclaim it, turning that into a bear trap). If we see that, I think we see $65.7k taken out and price push back towards the $60k low over subsequent weeks. FWIW, the work I have been doing on the macro regime models is suggestive of continued strength here for BTC into May from a statistical POV, but obviously if price-action is invalidating that view you give that more weight on the discretionary side. Now, until we do close below the 90d rolling VWAP and even the $70k support, daily structure will be bullish, and so we should be expecting the formation of a higher-low for the time being, Big couple of weeks ahead for 'digital gold'.
I hope you've found some value in the read this week - please RT, share, engage etc. if so!
And if you've not already signed up for Ostium, please do so and test out some of the recent updates, including:
Sign up here (you don't have to use my ref link, of course): https://ostium.app/trade?from=CL&to=USD&ref=CTNIK

.avif)