

Market Outlook #79 - Deadline
March 30, 2026
-
12
min read


This blog references an opinion and is for entertainment and informational purposes only. It is not intended to be investment advice. Seek a duly licensed professional for investment advice.
In this special 'Deadline' edition of the 79th Market Outlook here at Ostium Insights, we'll be taking a look at the week ahead in markets, looking at price-action, positioning and event risk for NDX, USDJPY, Gold, Brent Crude and WTI.
Let's first take a look at the very busy macroeconomic calendar for the week ahead:
MONDAY: FED'S CHAIR POWELL SPEECH
TUESDAY: US CHICAGO PMI (MAR): (CONSENSUS 55.6 VS PREVIOUS 57.7)
TUESDAY: US JOLTS JOB OPENINGS (FEB): (CONSENSUS 6.85MN VS PREVIOUS 6.946MN)
TUESDAY: VARIOUS FED SPEECHES
WEDNESDAY: US ADP EMPLOYMENT CHANGE (MAR): (CONSENSUS 42K VS PREVIOUS 63K)
WEDNESDAY: US RETAIL SALES (MOM) (FEB): (CONSENSUS 0.4% VS PREVIOUS -0.2%)
WEDNESDAY: US ISM MANUFACTURING PMI (MAR): (CONSENSUS 52.3 VS PREVIOUS 52.4)
THURSDAY: US INITIAL JOBLESS CLAIMS: (CONSENSUS 215K VS PREVIOUS 210K)
FRIDAY: US ISM SERVICES PMI (MAR): (CONSENSUS N/A VS PREVIOUS 56.1)
FRIDAY: US NONFARM PAYROLLS (MAR): (CONSENSUS 47K VS PREVIOUS -92K)
Now, let's dig into asset-specific price-action for the week ahead, looking firstly at -:
Price: $23,257
Weekly:
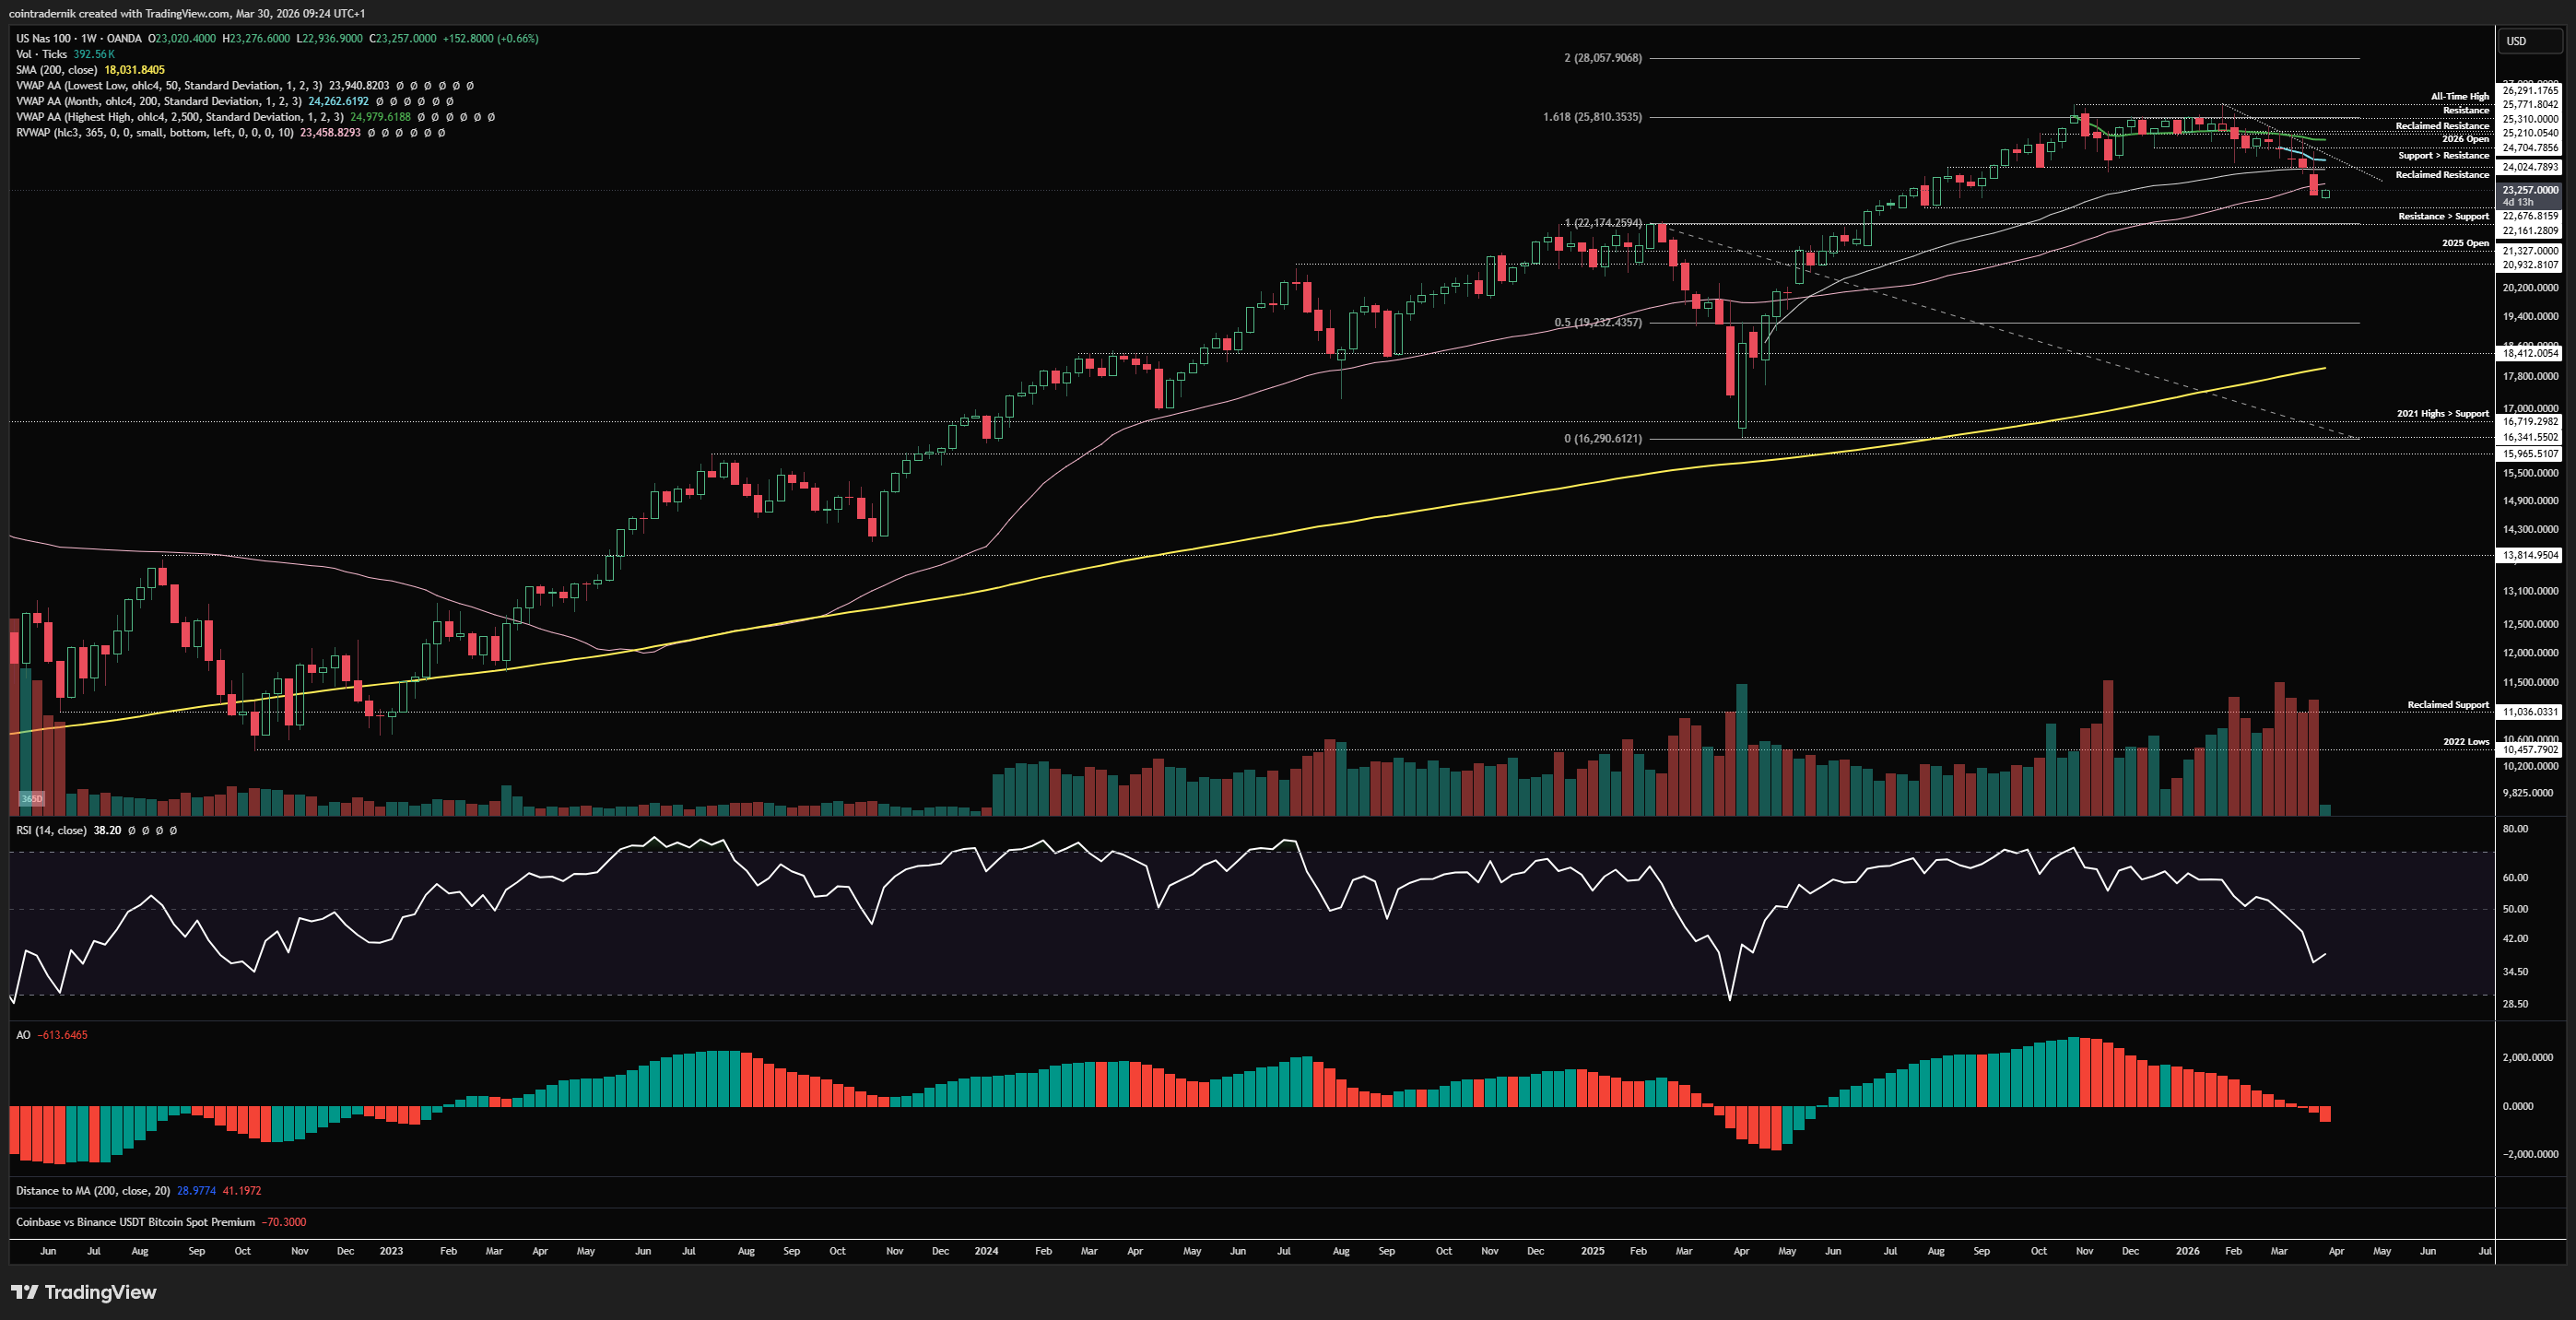
If we begin by looking at NDX on the weekly timeframe, we can see that last week rejected a spike above the monthly VWAP into trendline resistance following the weekly open and sold off to close below both the anchored VWAP from the tariff crash lows and the 365d rolling VWAP, closing marginally above prior support at $22,676. Weekly momentum has been obliterated and is firmly bearish, and thus a rally into that anchored VWAP from the tariff lows - currently around $24,000 - should be considered an opportunity to look for tactical shorts if we see some lower timeframe exhaustion into the level, with clear invalidation on acceptance above that overhead cluster of resistance around the March VWAP. Above $24,300, things look more favourable for a more durable low being in, but if we reject $24,000 this week I would expect continuation towards the 2024 highs turned support at $22,160 before a major bottom formation can occur. A weekly close above $24,300 - and flipping trendline resistance into support - and I think we retest the yearly open at $25,210.
Daily:
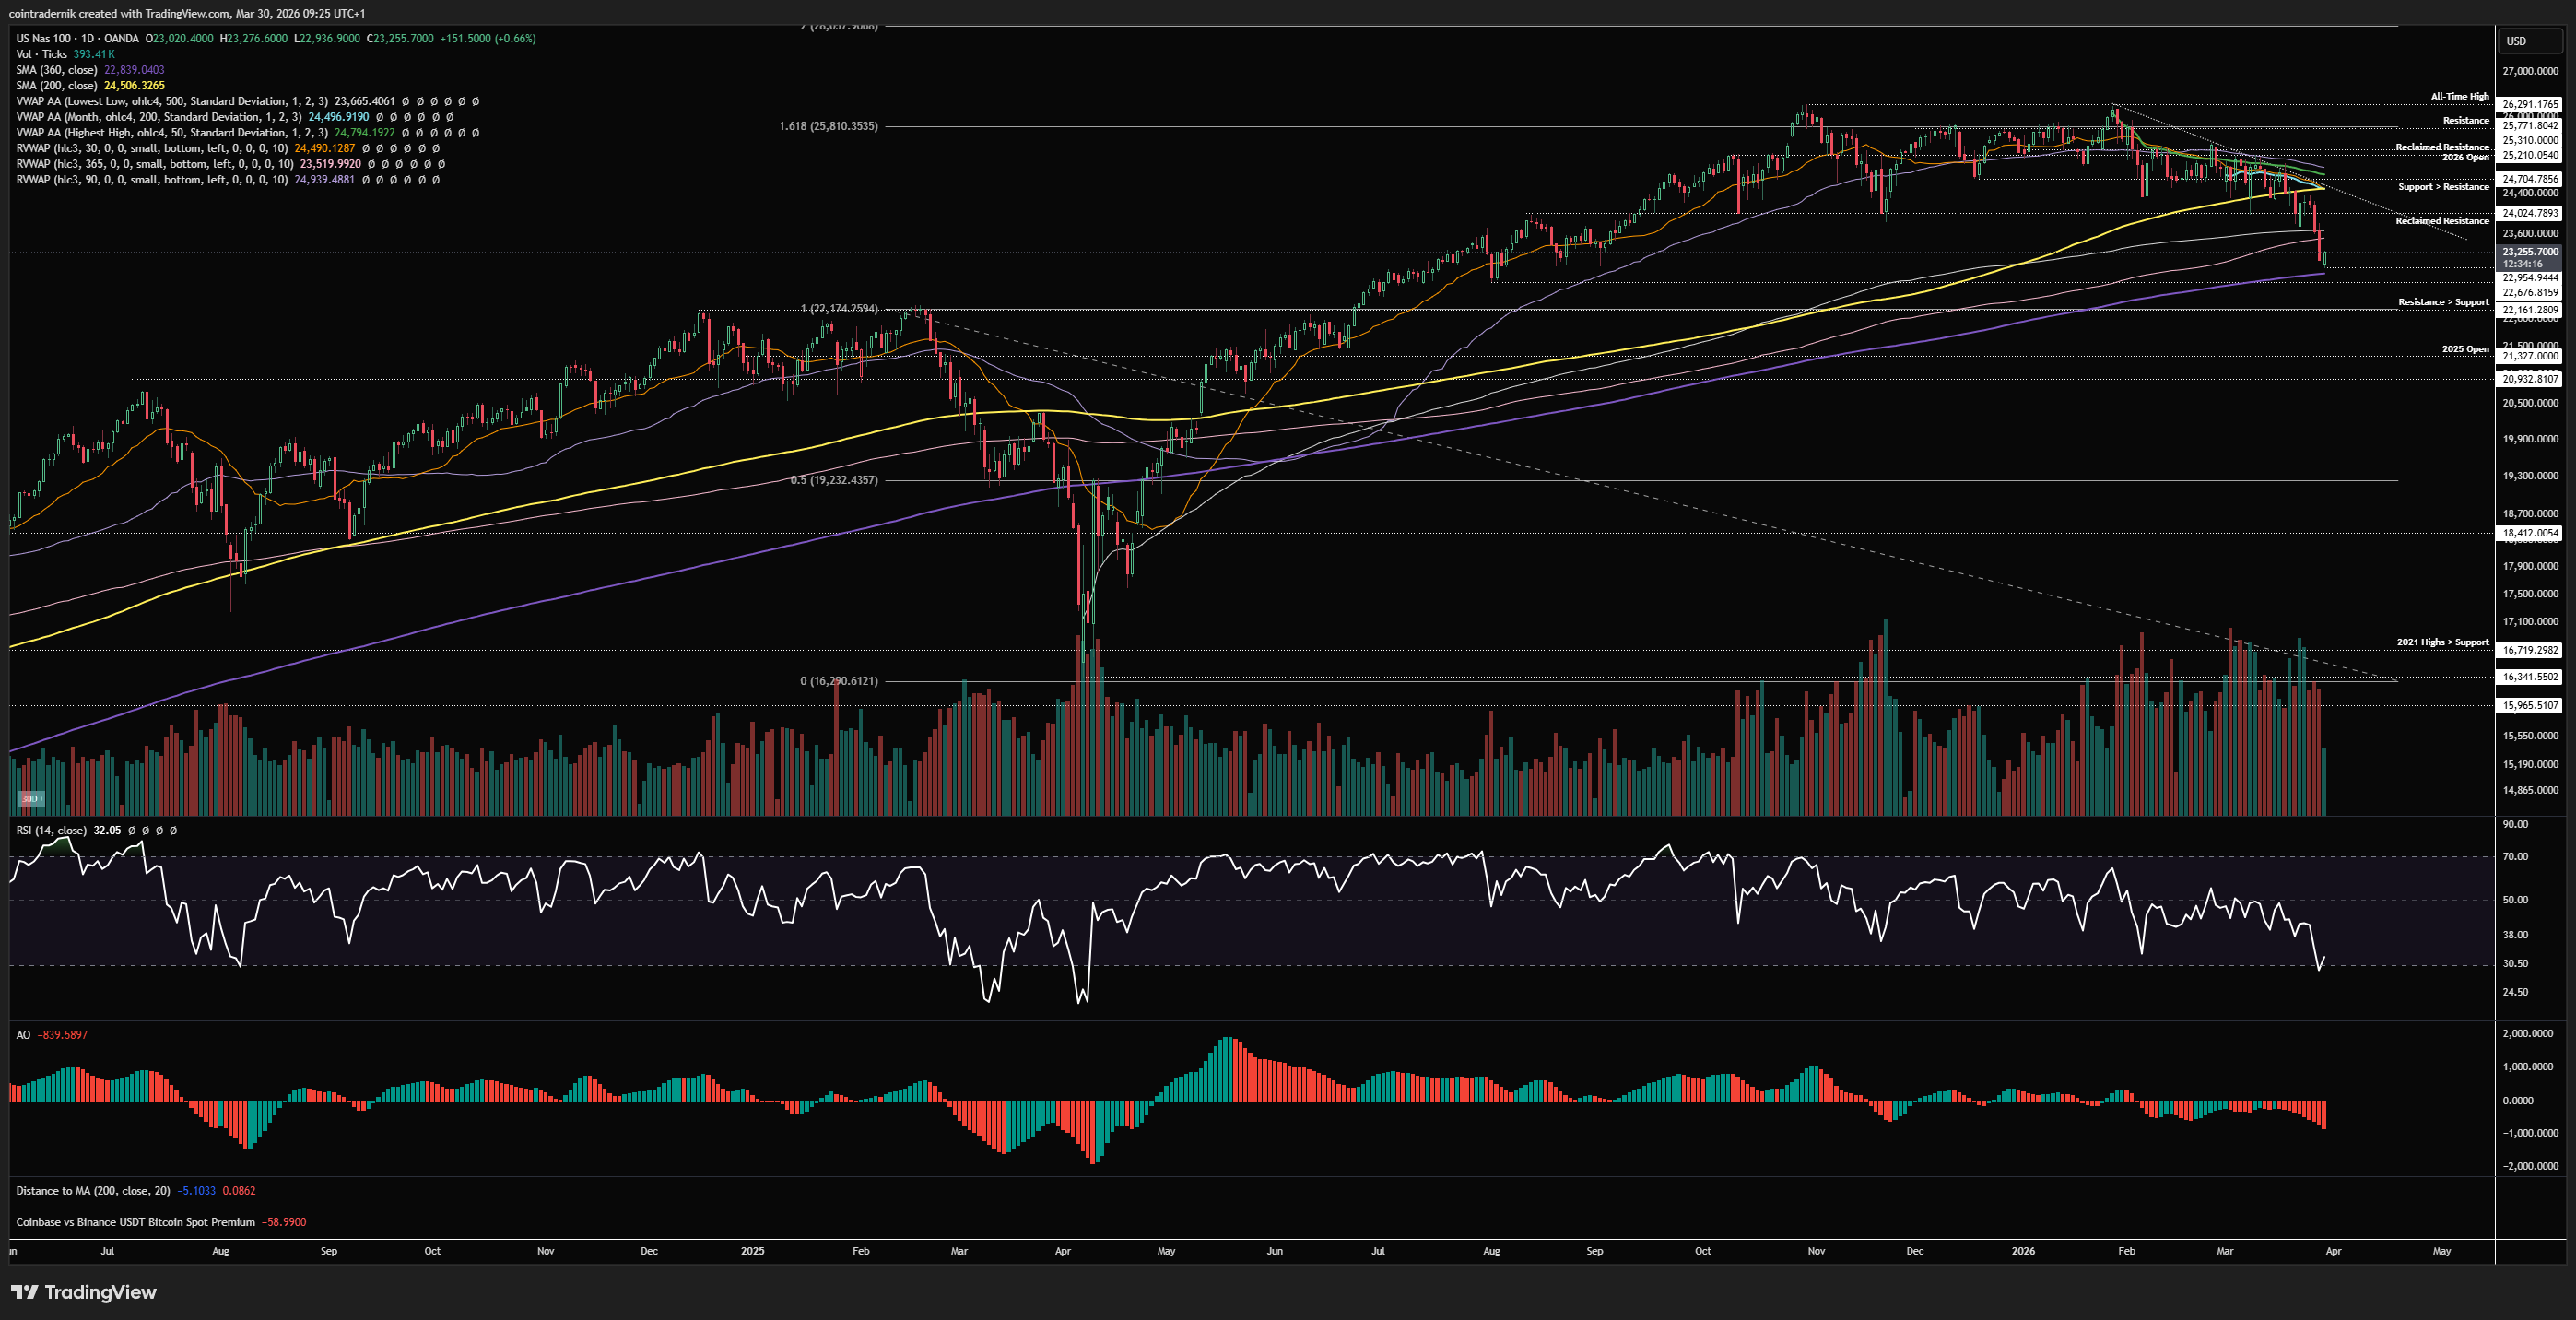
Looking at the daily, we can see that daily structure and momentum are bearish but price is bouncing as of this morning above the 360dMA, marginally above prior support at $22,676. If we do catch a bid early this week, as mentioned above I'd be looking for lower timeframe bearish divergence into $24,000ish and short that, with a view towards a run of the 360dMA into $22,676 at least, where we could form some bullish divergence and begin forming that longer-term bottom. What would be great to see is some de-escalating headlines into a lower-high below $24,000, where shorts are more favourable - that would be some narrative confluence for a stab at further downside. As mentioned, acceptance back above that trendline resistance and it becomes less favourable to be short, in my view, particularly given the headline risk of being short for more than a day at this point. I like longs above that trendline or below today's low if that coincides with some re-escalation. Anchored VWAP from the Apr 2025 low is the area I'm expecting more sellers to step in.
Price: 159.77
Weekly:
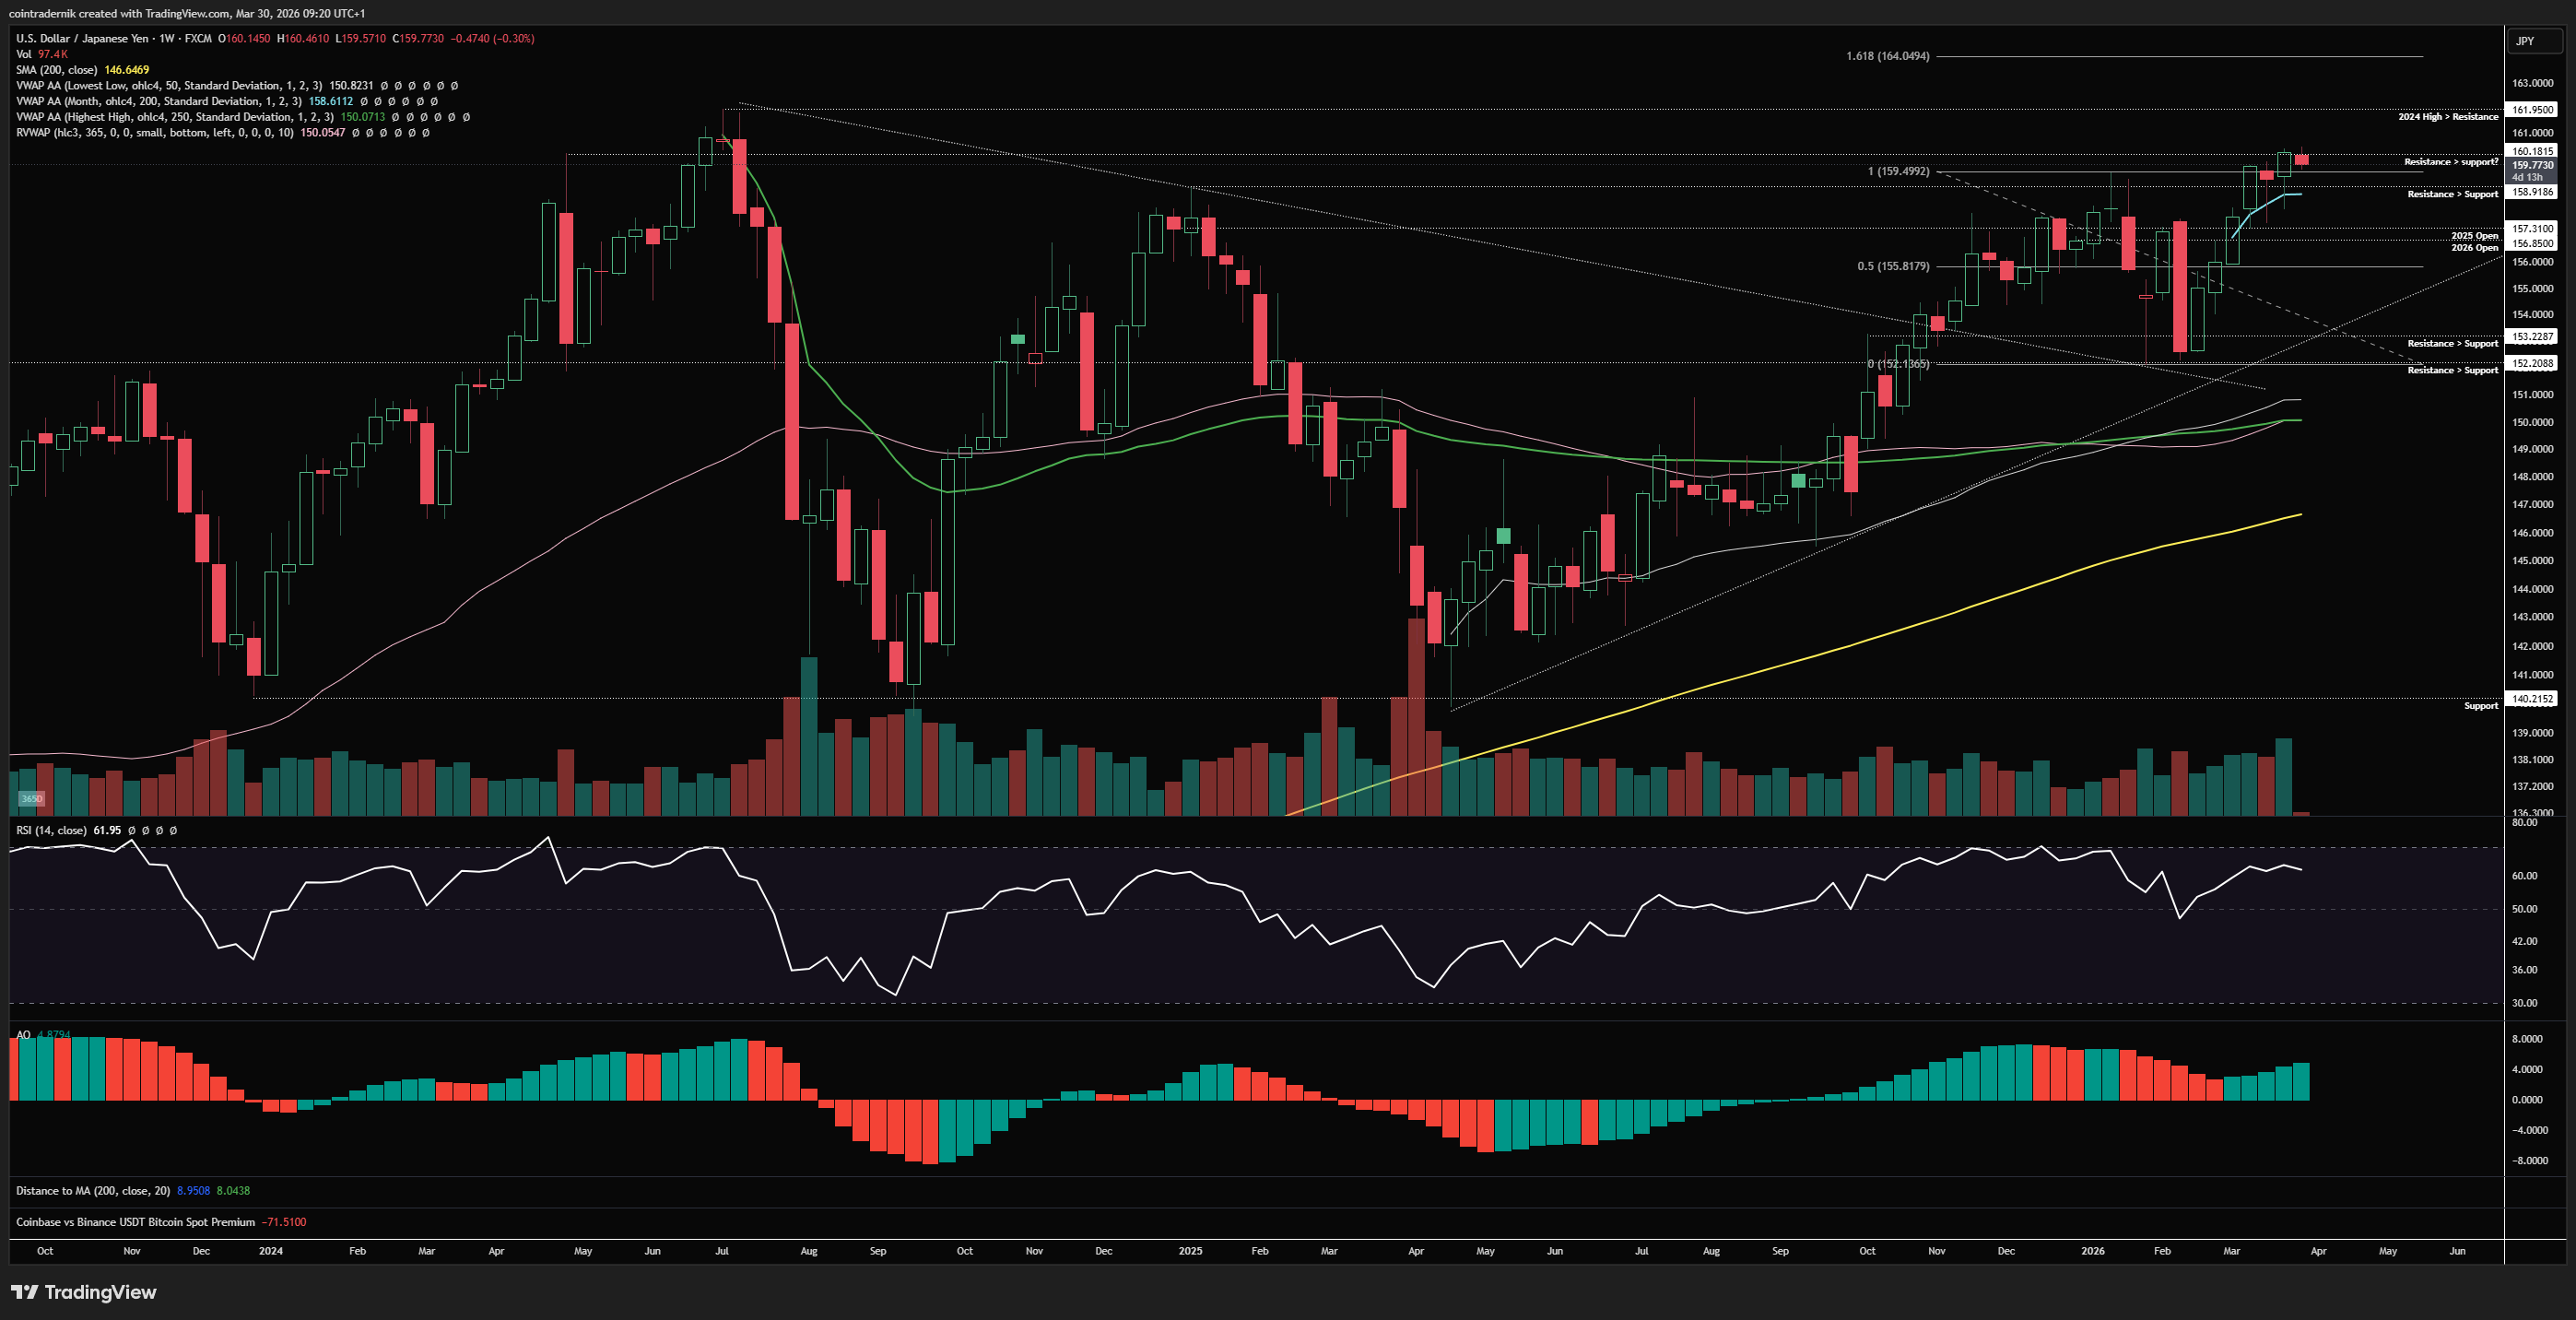
Beginning with the weekly for USDJPY, we can see that last week bounced off that March VWAP once again and found support above prior resistance at 158.91. Price then closed at fresh yearly highs, marginally above 160, breaking through that historical resistance level, with only the 2024 high at 161.95 left overhead. That said, we do have some early signs of waning momentum across timeframes here, so that's something to be wary of; if last week's push through resistance was a bull trap, we should see price reject this week and break and close back below 158.9, confirming further downside is likely. If we hold above 158.9 this week and push through last week's high, I think we take out 162 in early April. Below 158.9 I would be looking for intraweek shorts back into 157.3.
Daily:
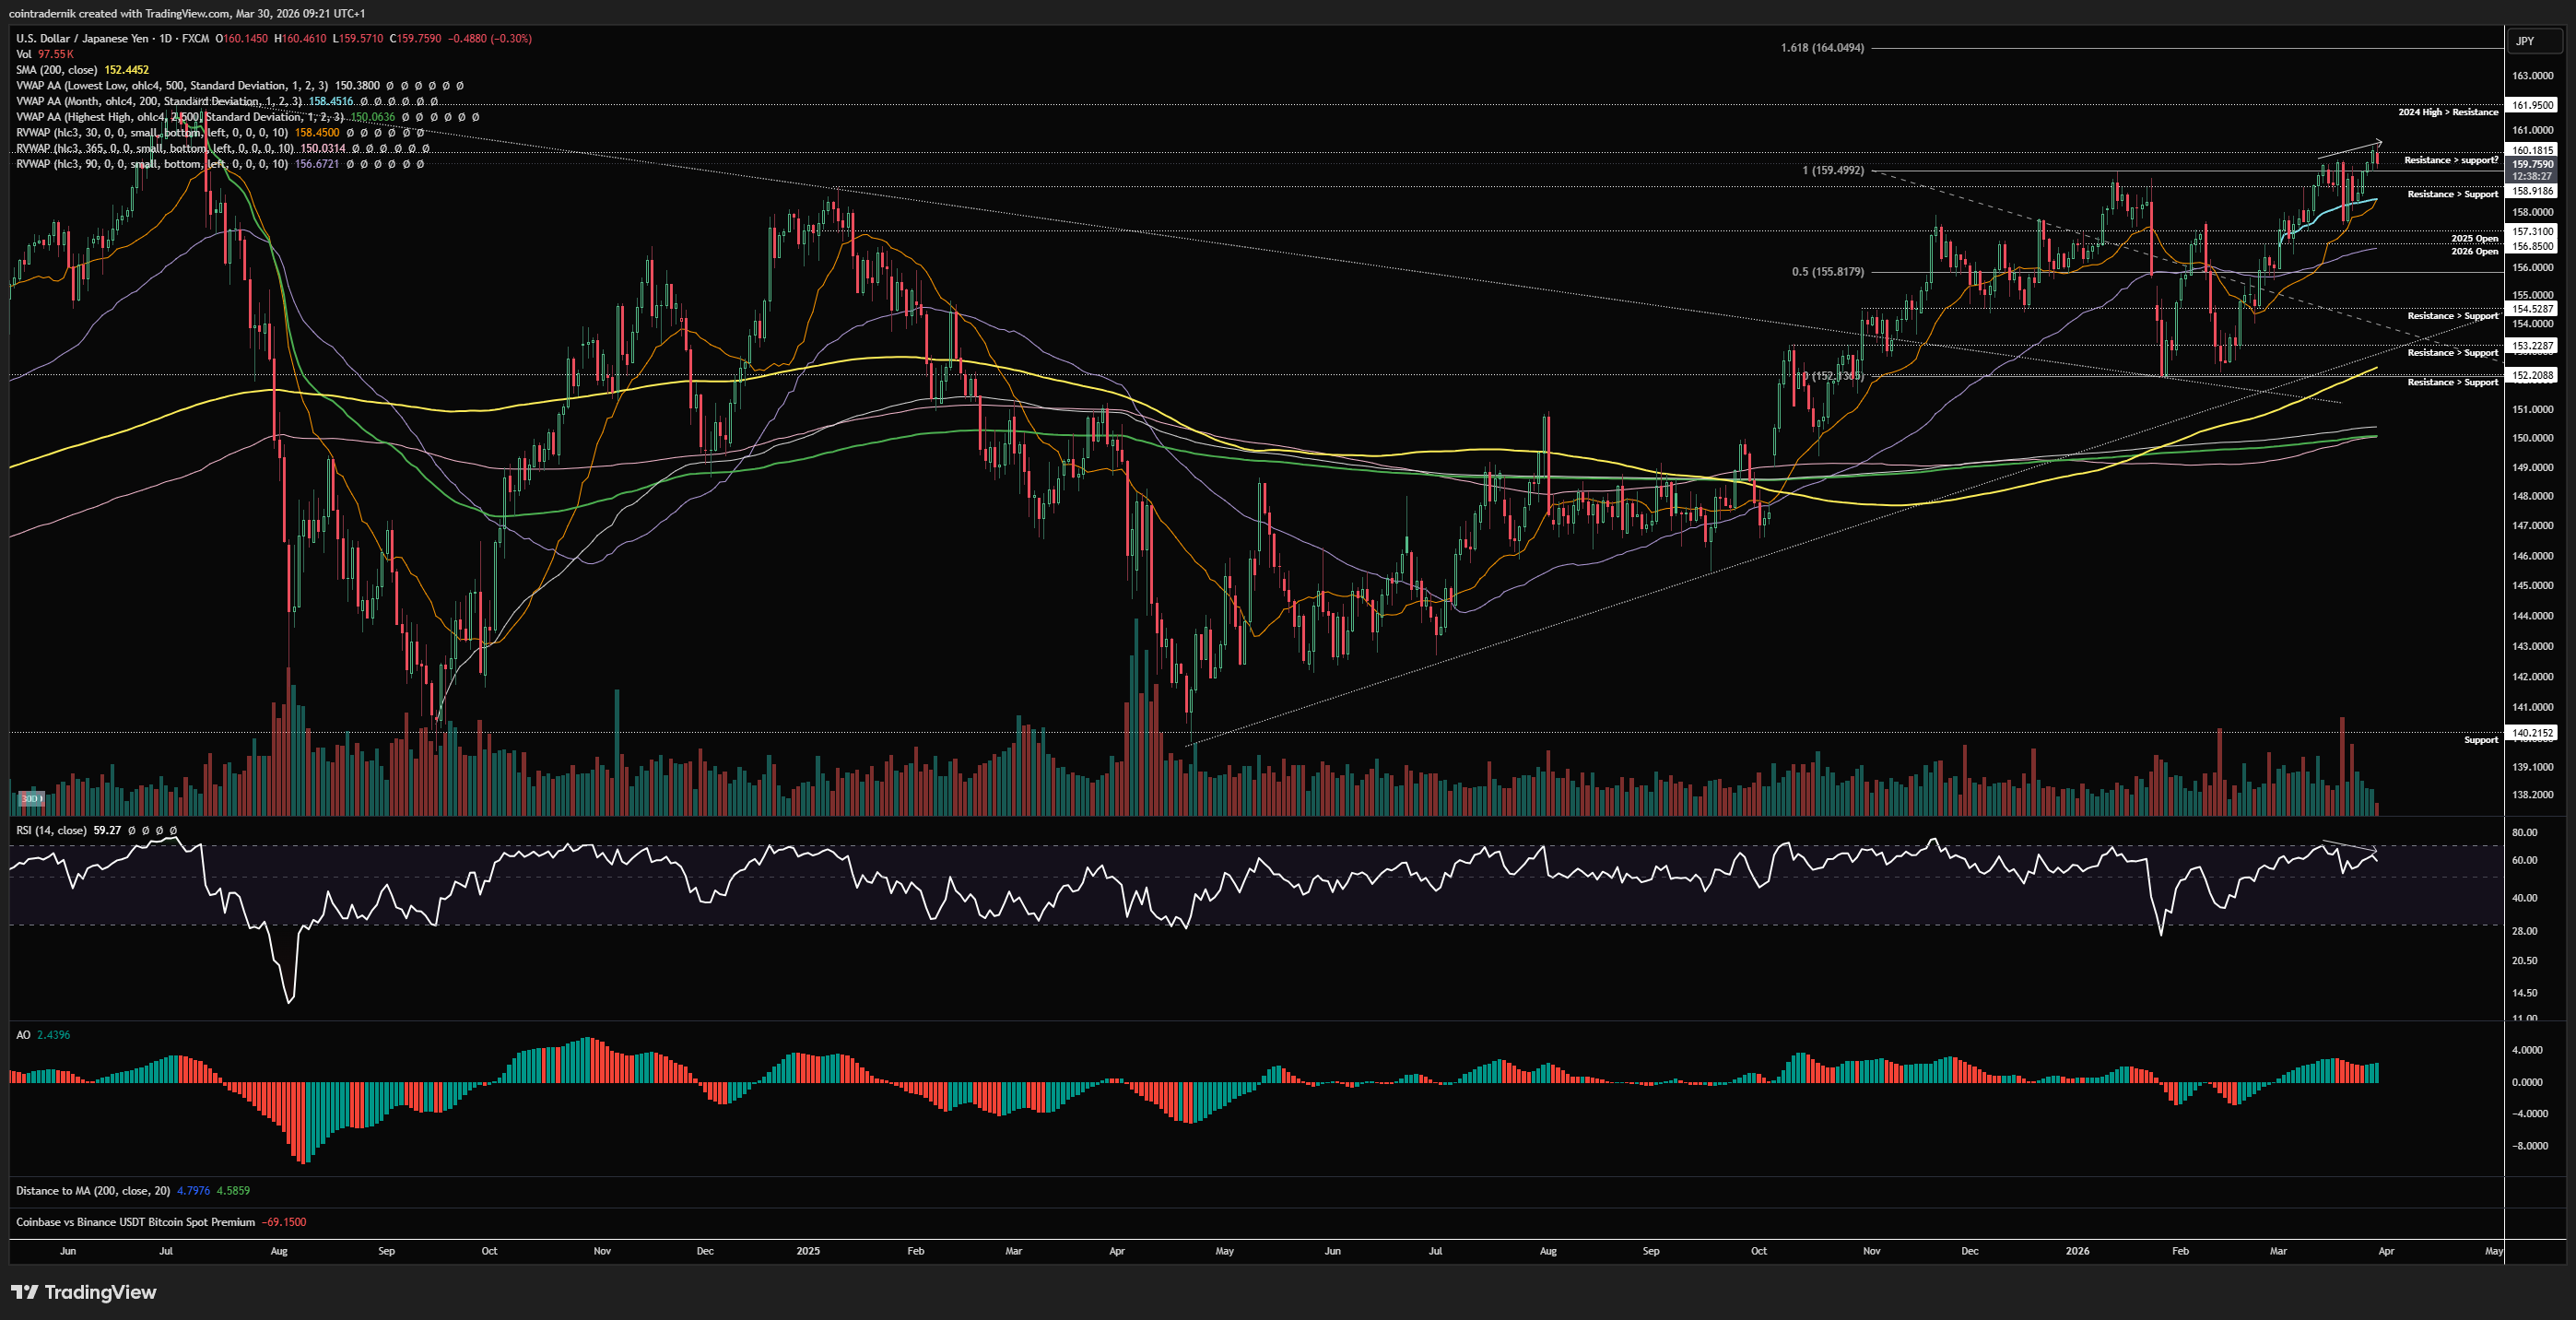
We can see this all more clearly on the daily timeframe, where the push to fresh highs last week has formed bearish divergences on momentum indicators from a historical resistance level. That said, given the close through resistance, I would take a stab at a long if we get a dip into 159 early this week, with invalidation on a daily close below the 30d rolling VWAP at 158.45, with a view towards holding that for at least 160.3 if not higher into 162. Obviously, if this setup fails and gets stopped, its because the breakout was a bull trap and we very likely lock in that bearish divergence and the subsequent breakdown, so you can flip short on your long invalidation with the new invalidation above last week's high. Pretty clean structure here with nice setups in either direction into next week...
Receive the latest updates directly to your inbox

Price: $4539
Weekly:
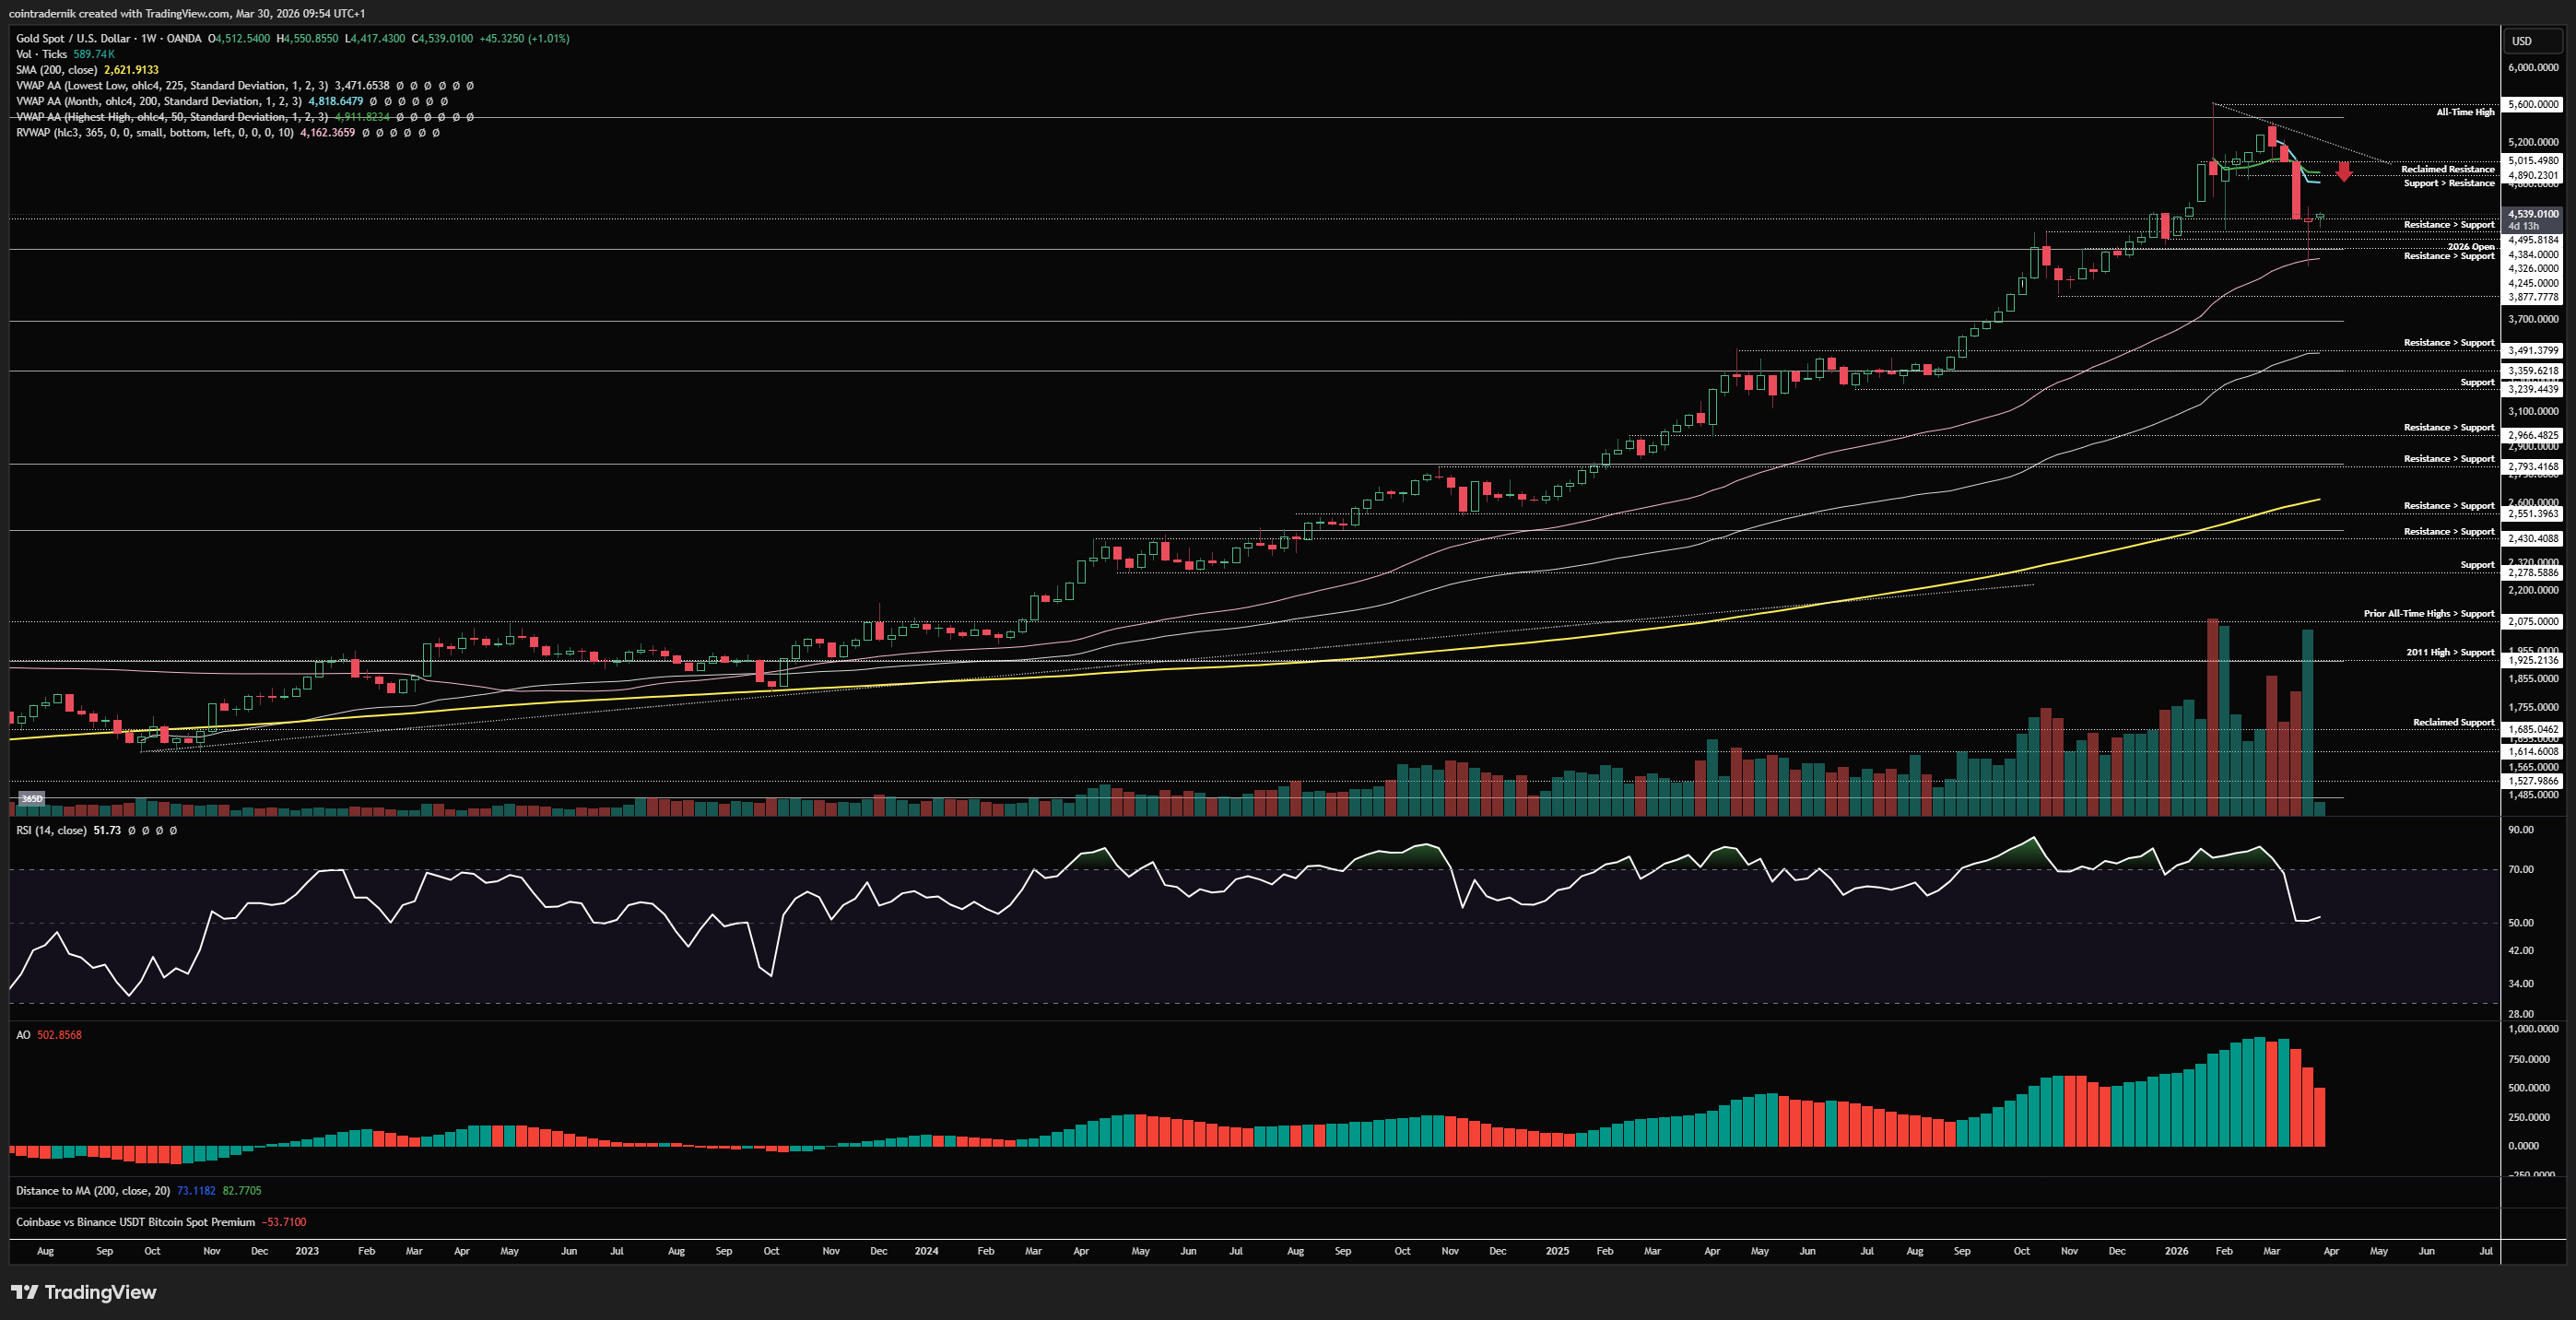
Beginning with the weekly for Gold, we can see that price bounced hard off that 365d rolling VWAP last week at $4162 and closed the week back near the open around $4500, with weekly RSI holding above 50. I would expect to see continuation higher here short-term, where the major overhead resistance is sat around $4900-$5000, with the anchored VWAP from all-time highs and the March VWAP confluent in that range. That said, I continue to believe Gold is a range traders' market for some time yet, where longs are favourable below $4400 and shorts are favourable above $4900 and you don't really want to be messing around in the middle. If we accept back above $5000 and flip that area into support, then we can talk about a return to range highs nearer $5500, but for the next few weeks I think we choppy around between $4380ish and $5000.
Daily:
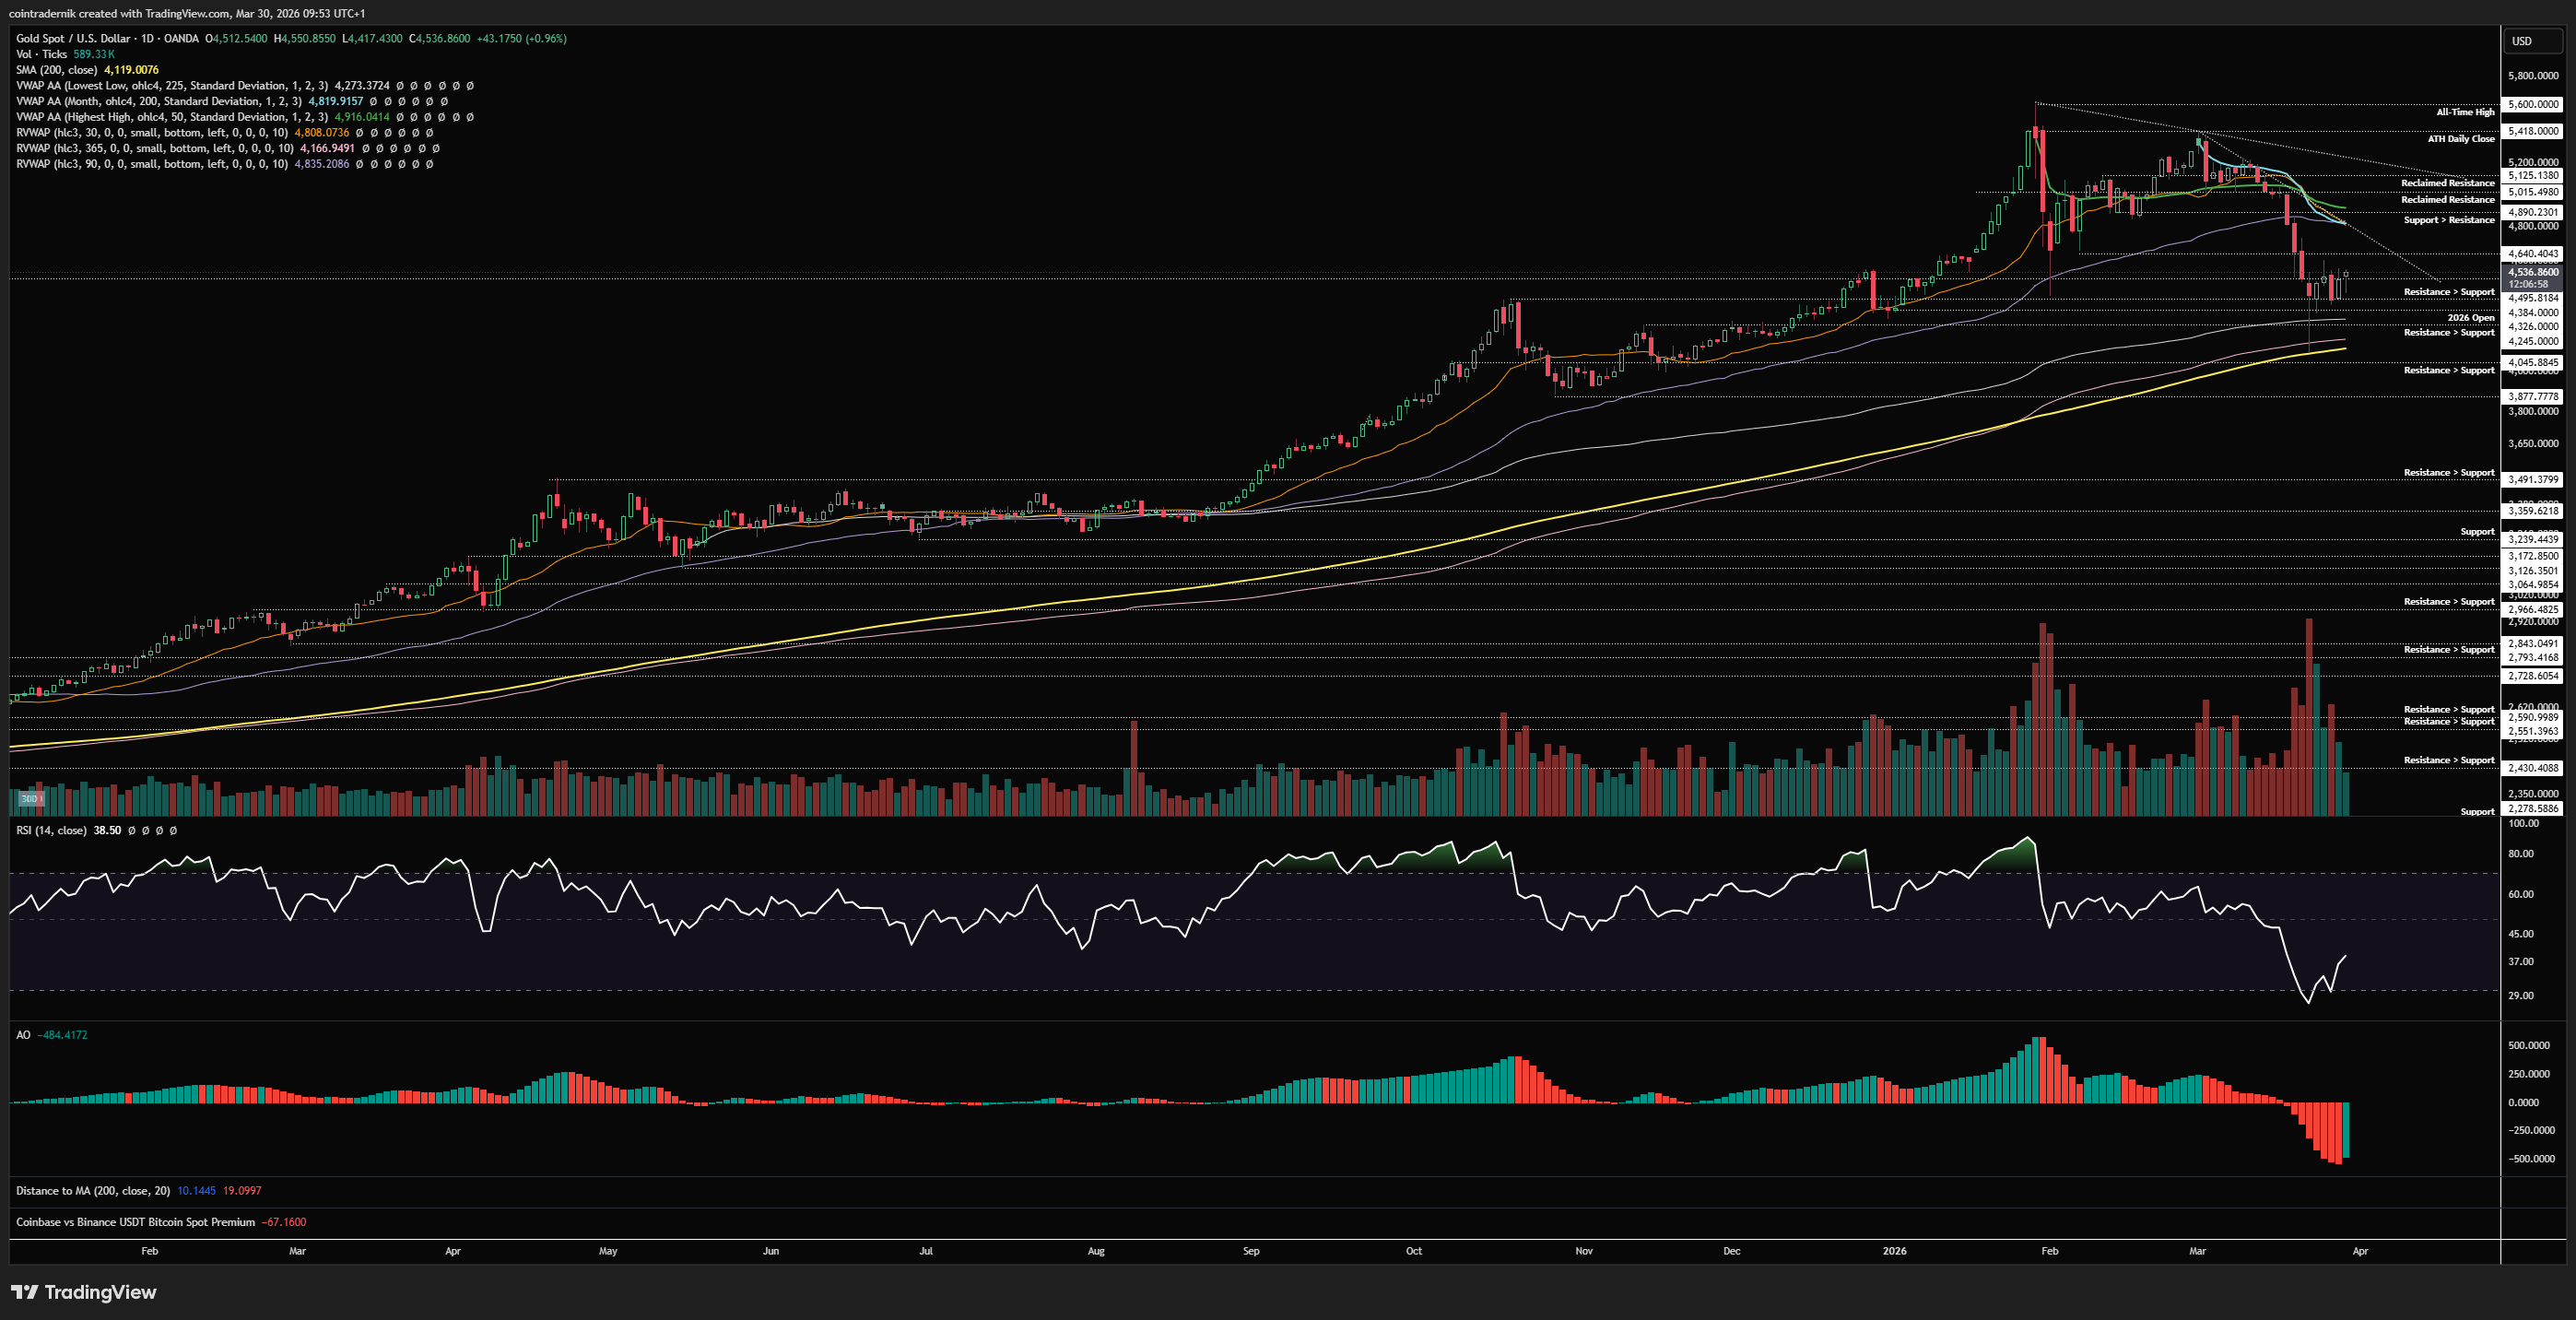
Turning to the daily, we can see that the confluence of resistance into $5000 is massive, with trendline resistance and every VWAP of note all sat around there, along with prior support. Daily RSI hit extremes to the downside as price tagged the 365d rolling VWAP and 200dMA, bouncing and holding above that 2026 open all of last week subsequently. Acceptance below $4270ish would open up another leg of downside through the 200dMA towards $3900, in my view, but I don't think that is very likely at present. As mentioned above, I think you're much more likely to see last week's bounce provide some momentum in early April and Gold push back towards that $4900 area, where shorts become more favourable again. Beyond that, not much else to add on Gold.
Price: $107.61
Weekly:
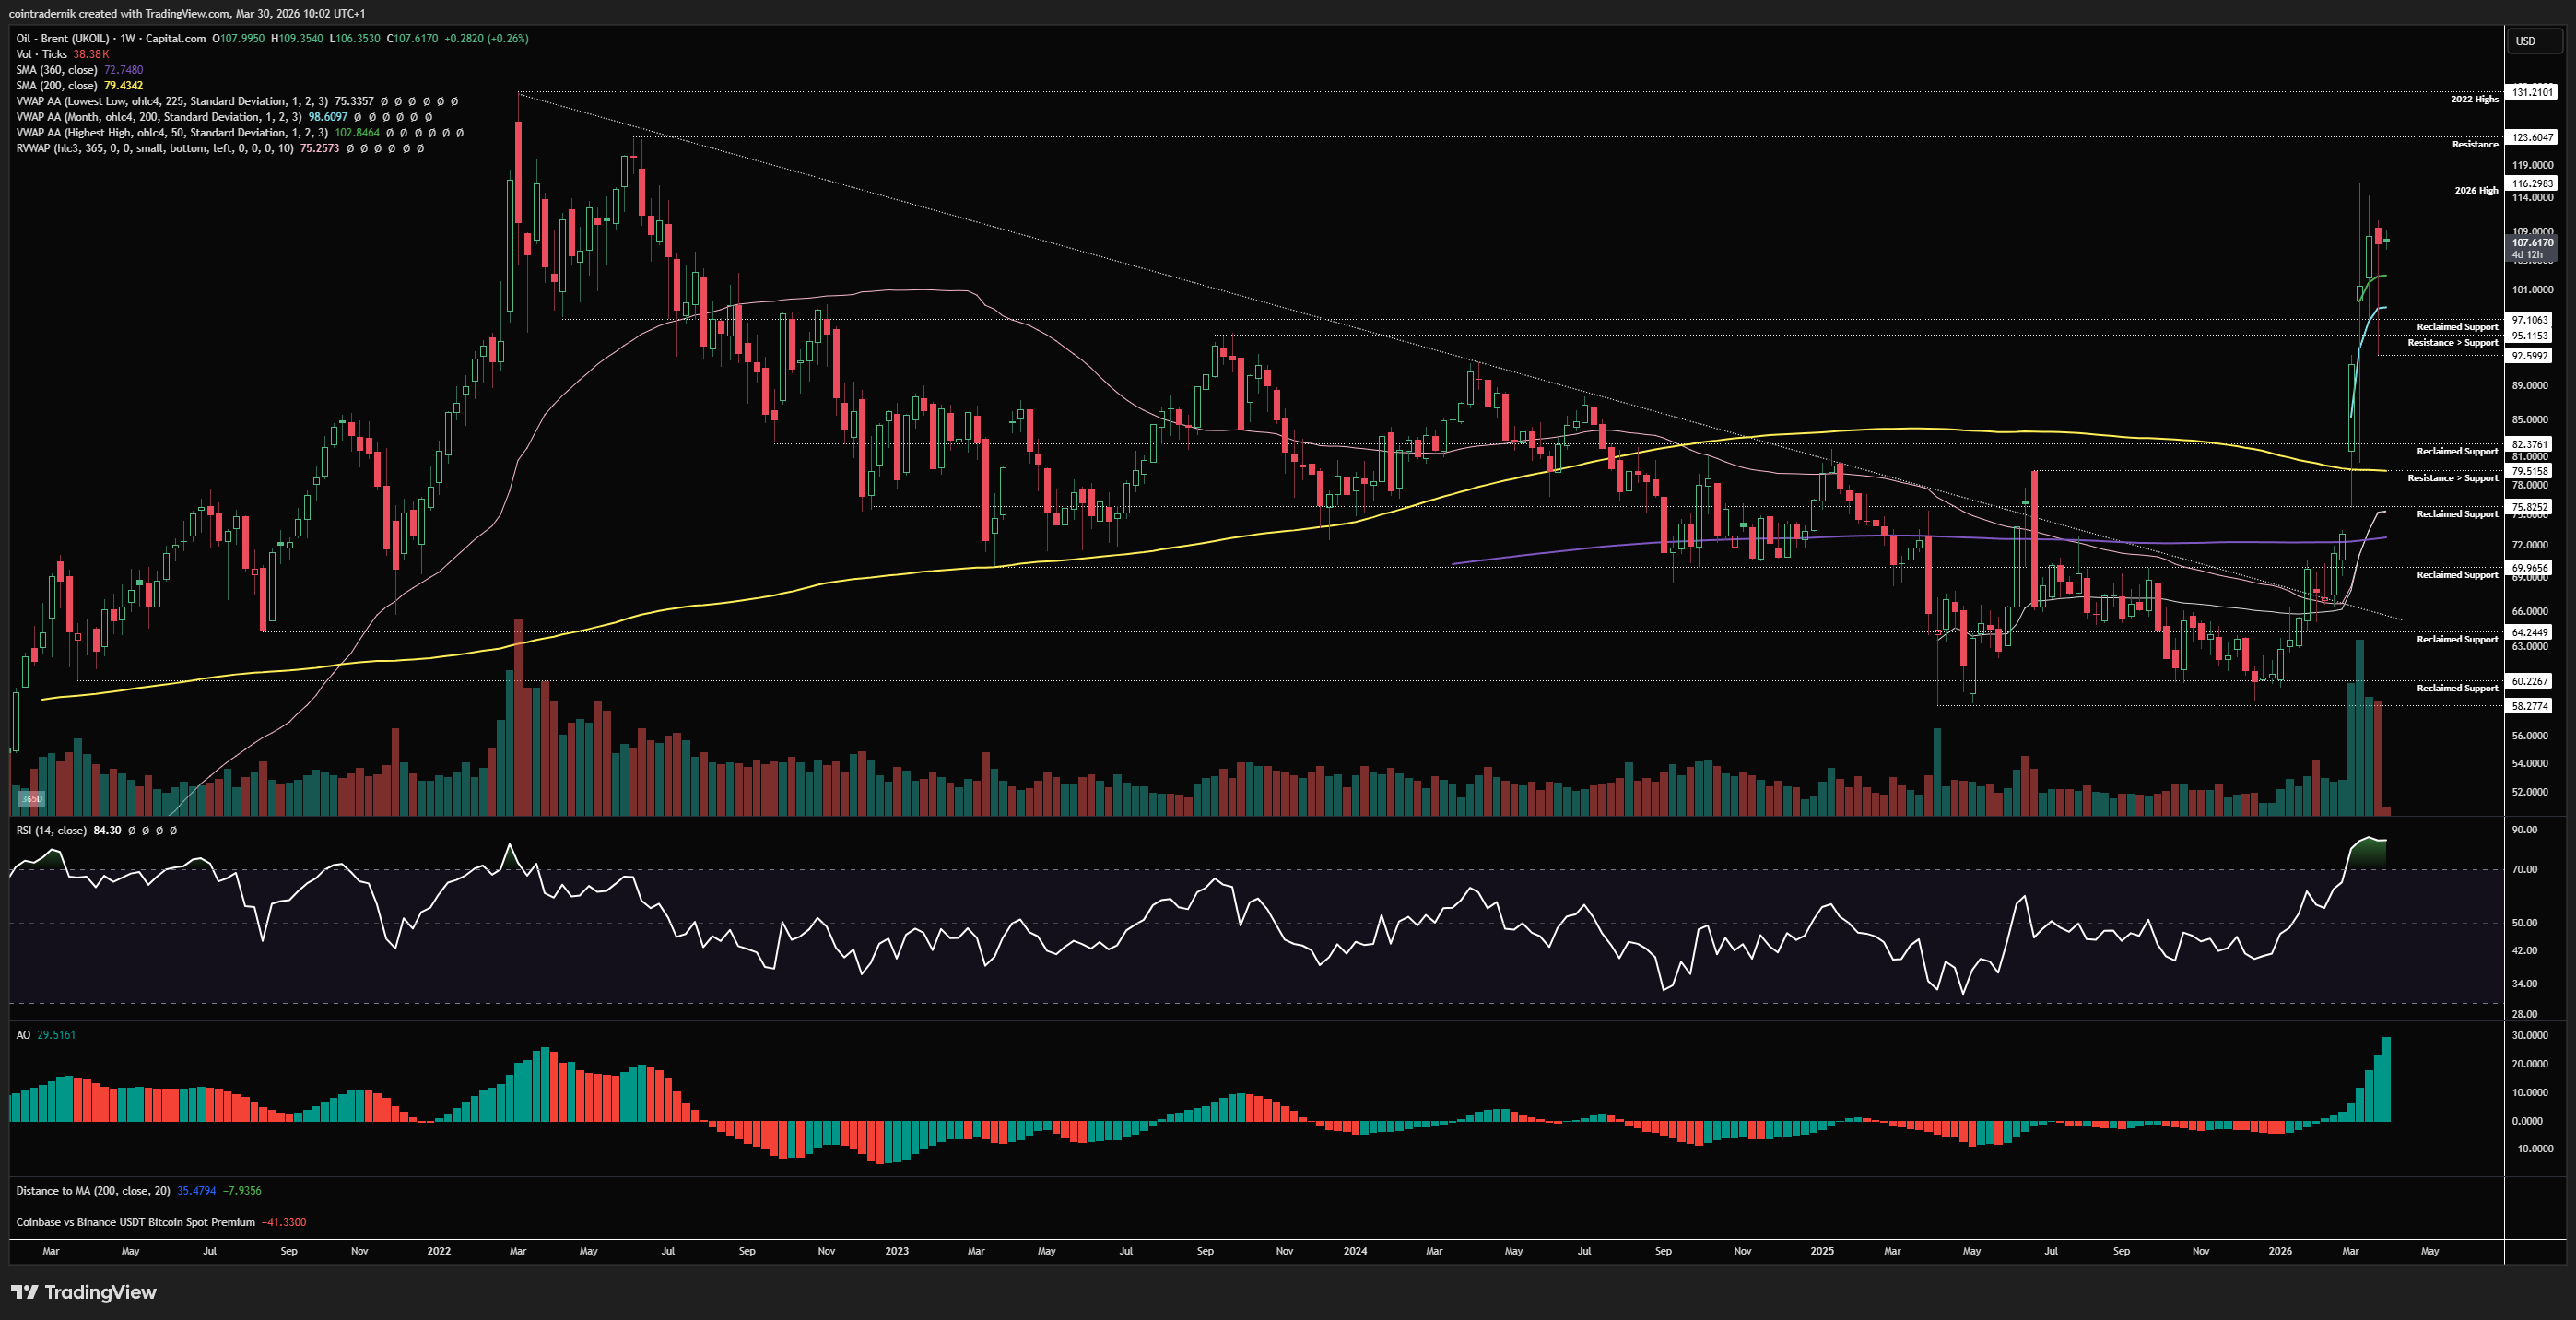
Beginning with the weekly view for Brent Crude, we can see that price bounced hard following that early sell-off last week, rug pulling through support at $95 into $92.60 but finding its feet and pushing back above the monthly VWAP, closing the week firmly back above the anchored VWAP from the yearly high and around the prior weekly close. We are, unlike WTI, nearer the top of the 2-week range here between $75 and $116, and whilst I have precisely zero edge in trying to dissect the core supply and demand differences between the two and therefore the probability that Brent can force a breakout here whilst WTI remains choppy, I would say that the fact that Brent is holding firm above all the key VWAPs and local support levels and is consolidating below yearly highs suggests that at least a run of that $116 high is quite likely here. The reaction subsequent to that will be telling: if we trap bulls above that high and reject hard, I think that's signal for further upside being unlikely in the near term and we could expect to see the bottom end of last week's wick traded back towards at ~$92.60. Acceptance back below $95, flipping it into resistance, and we have a very strong case for a long-term top. Acceptance above $116 and I think $130 gets blown out in April.
Daily:
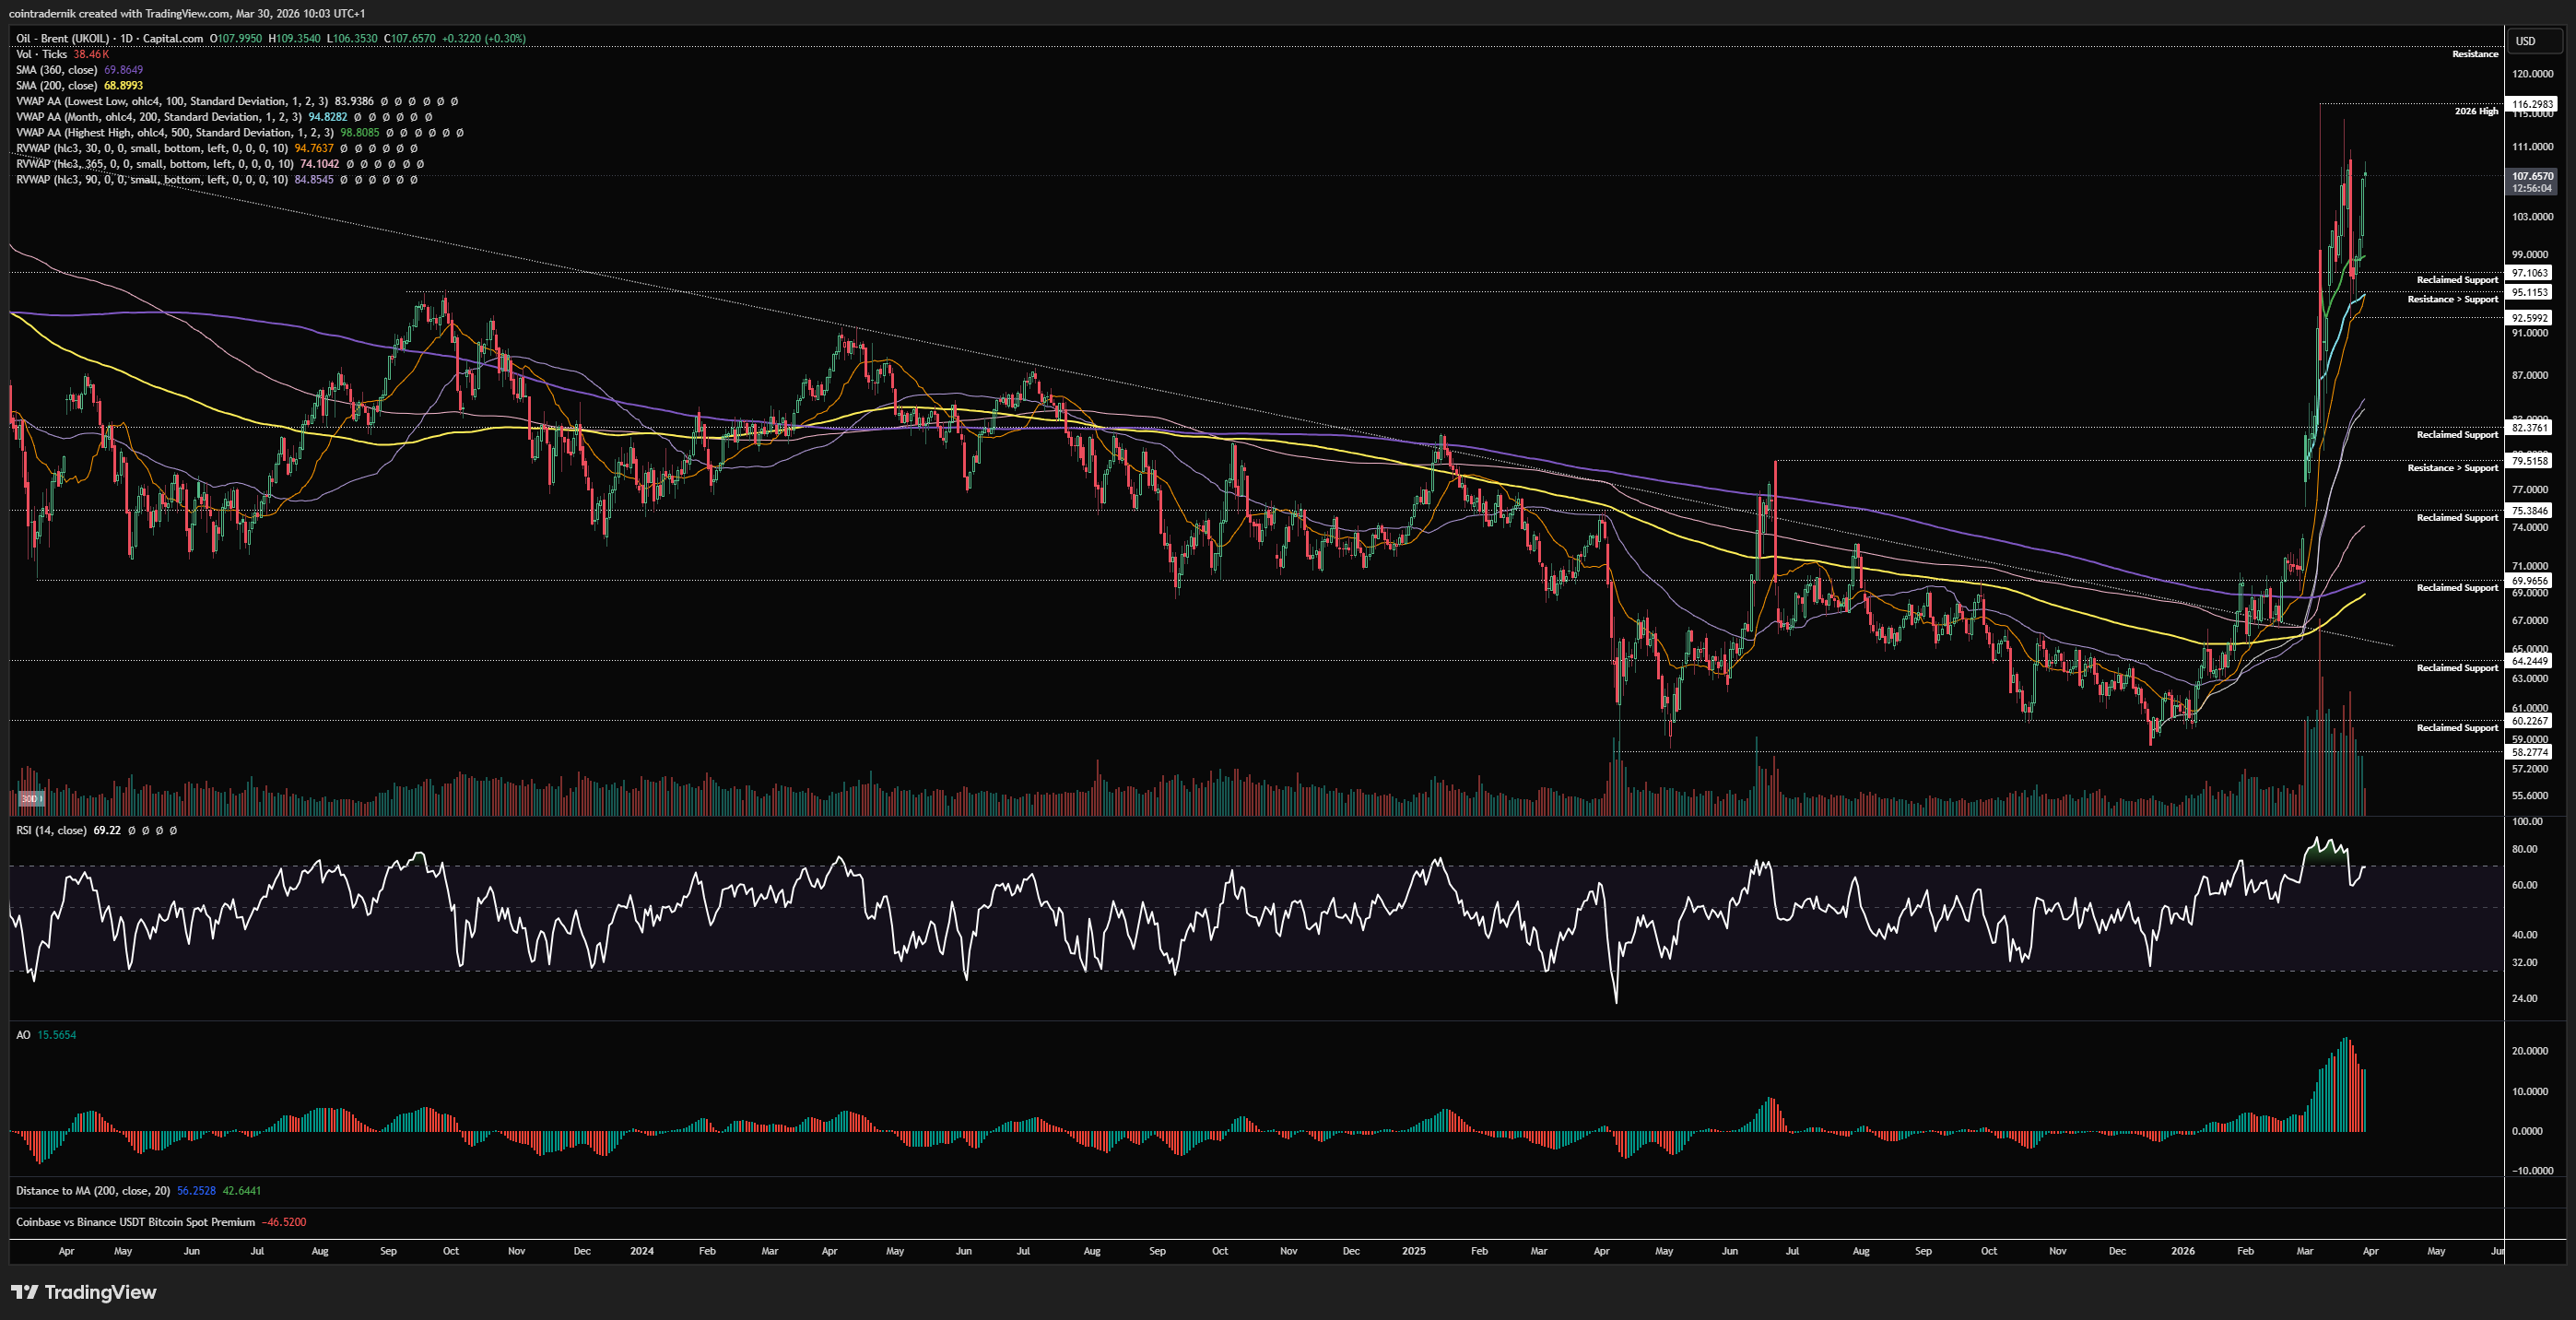
Dropping into the daily, we can see the resilience in Brent here as price marked out that higher-low above the 30d rolling VWAP and March VWAP and pushed back towards the prior weekly highs, below which it is currently sat. Structure and momentum are obviously bullish here but there is possibility that another push higher here could begin to form some trend exhaustion, which would be confluence for a bull trap above $116 if that locks in and then we break down. In that scenario (price closes above $116 and RSI and AO mark out lower-highs), I'd look for a lower timeframe breakdown and want to short back towards $95ish. No holding shorts if we do trade into that level though, as that has been resilient throughout this chaos, and until we see clear signs that $95 is turning resistance I would not be setting any lower targets. In fact, if you get $96-$97 this week it's another opportunity for a long with clean invalidation on acceptance below $95, although headline risk has been carnage for levered positioning over the past couple of weeks... I have preferred long XLE and DBC for upside exposure to Oil for much of March, with good reason.
Price: $100.95
Weekly:
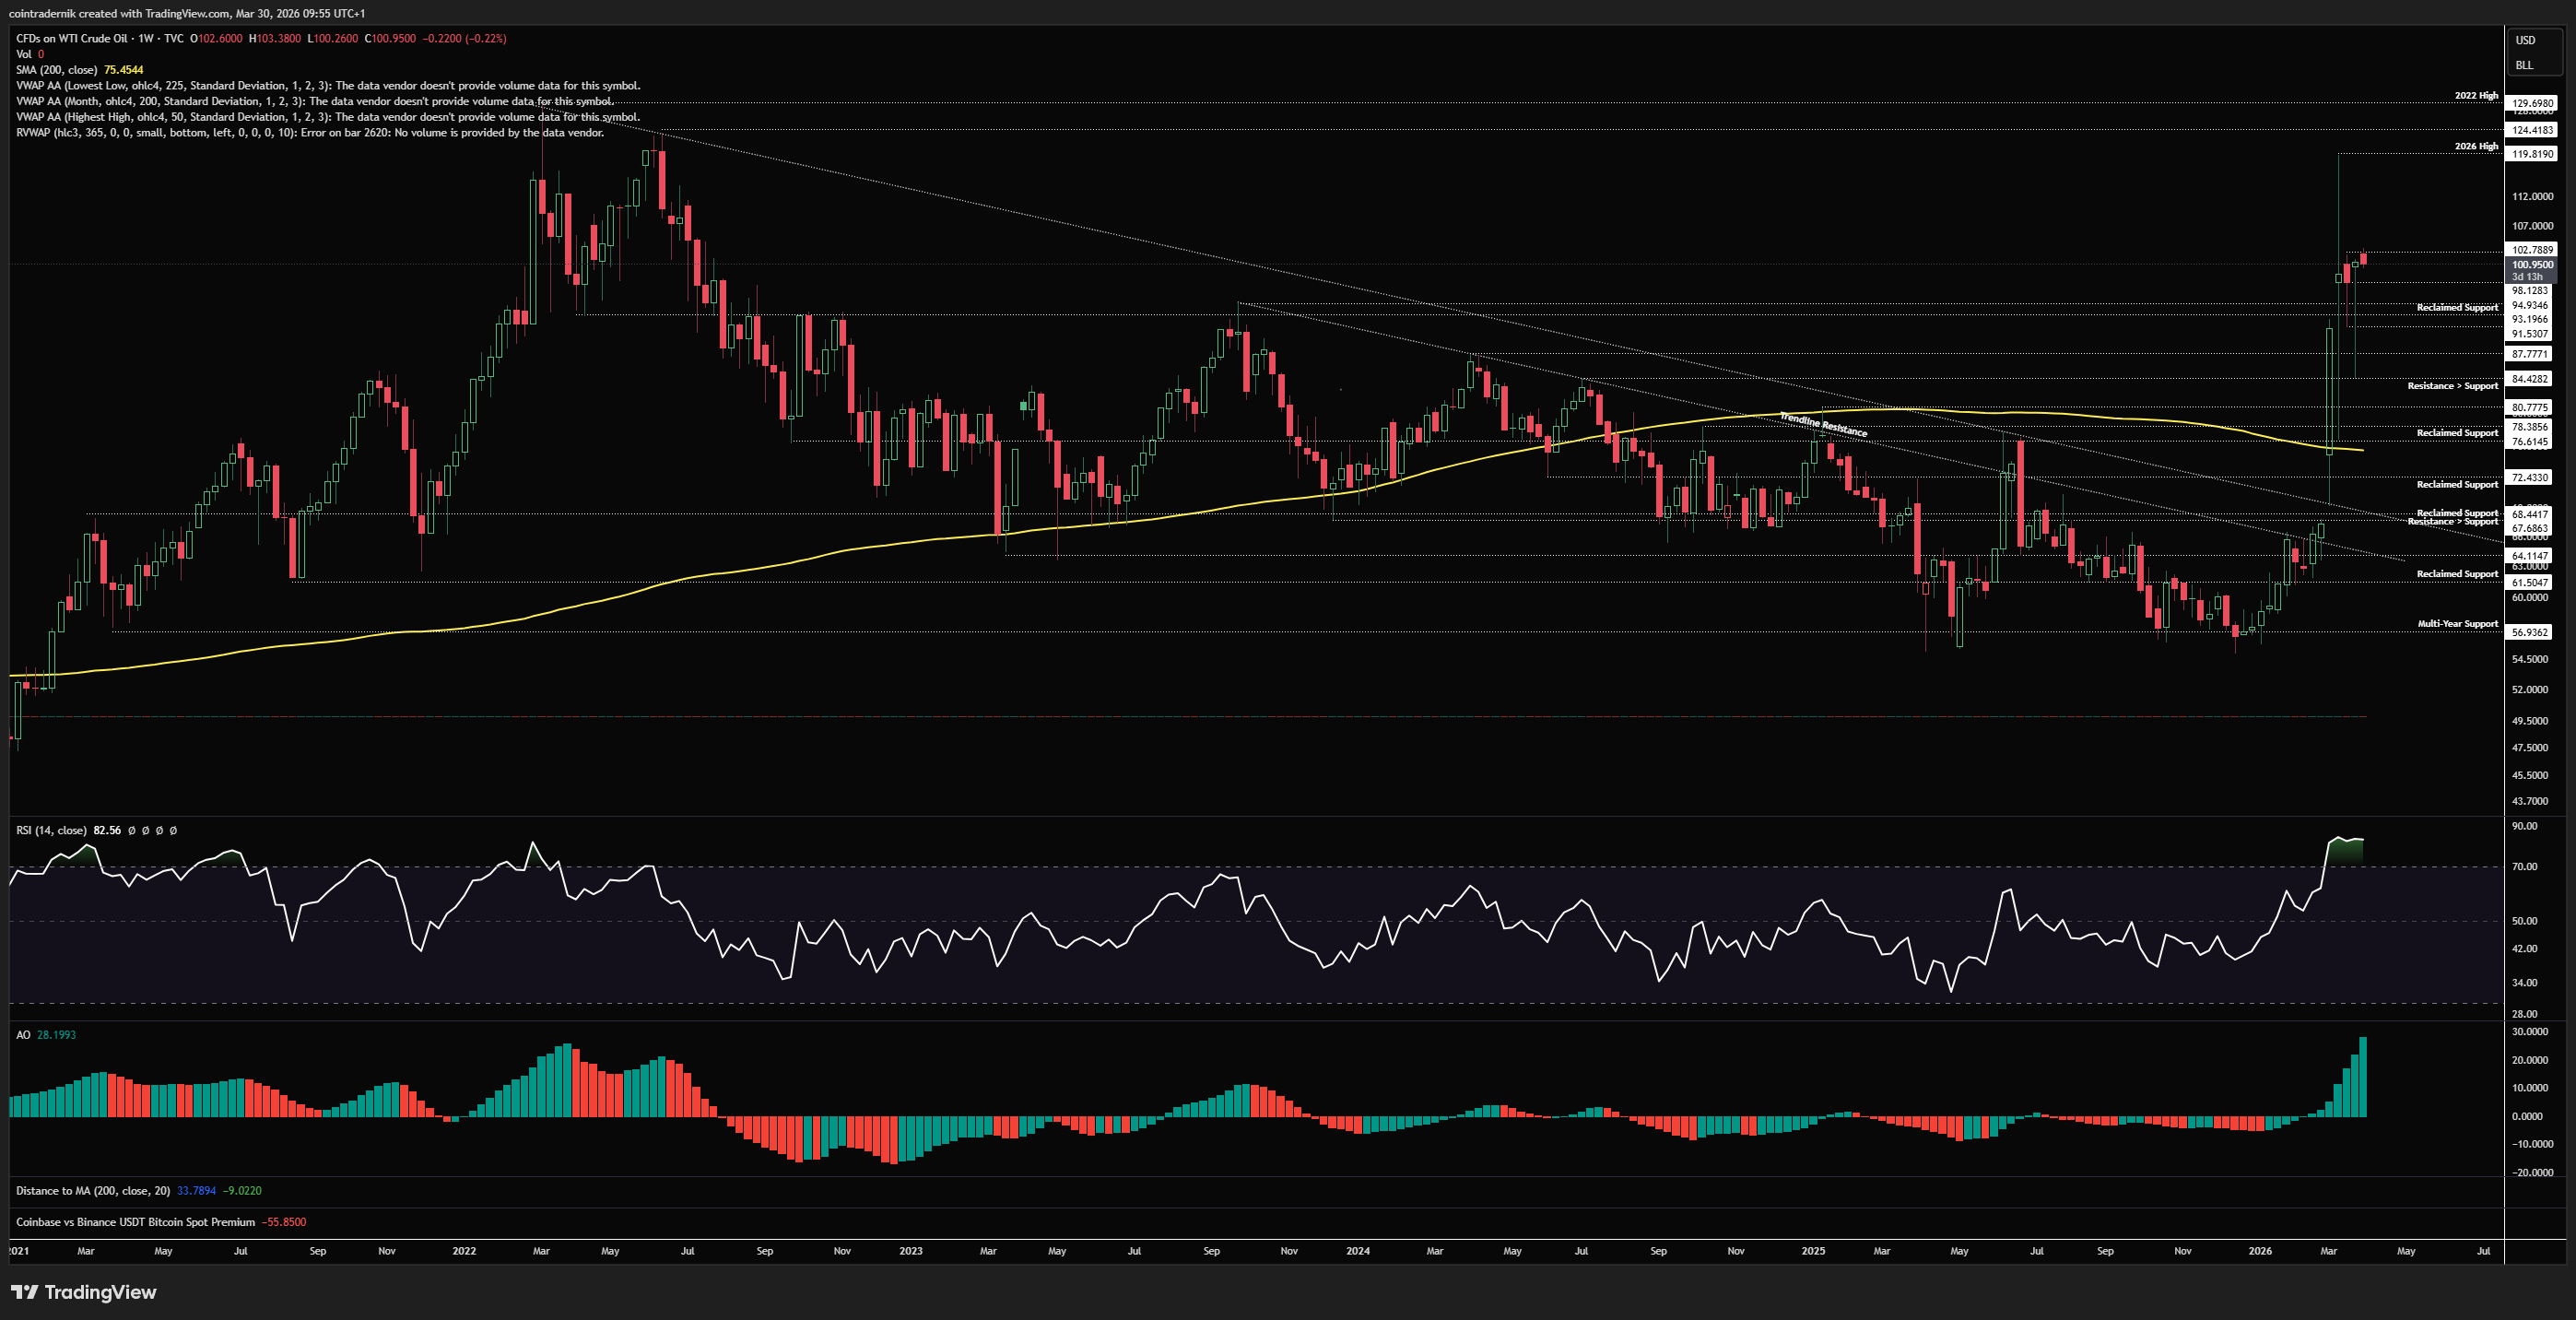
If we begin by looking at WTI on the weekly timeframe, price saw a similar wick early last week through major support into $84.40, finding support above that prior resistance and then closing the week back above the open, nearer $101. $103 has been capping rallies for the past couple of weeks and bulls want to see acceptance above that level this week to open up the next test of that overhead resistance, where through $103 I would expect to see at least 75% of that wick filled in towards $120 but price likely to sweep the 2022 highs near $130 if $120 gives way. If, instead, $103 continues to cap WTI this week and price pushes back below $98 on the lower timeframes, I think you can look for shorts towards $93 intraweek with $103 as your invalidation - not a huge R/R play but one that I think will be a higher probability setup. If $93 fails to hold this week and we close below that support, I think the short-term top is in here and we keep grinding lower back through last week's low, with $77 likely to continue acting as support for many weeks to come. Range-bound price-action persists, in short, until price accepts above $103, where longs towards the highs become much more favourable.
Daily:
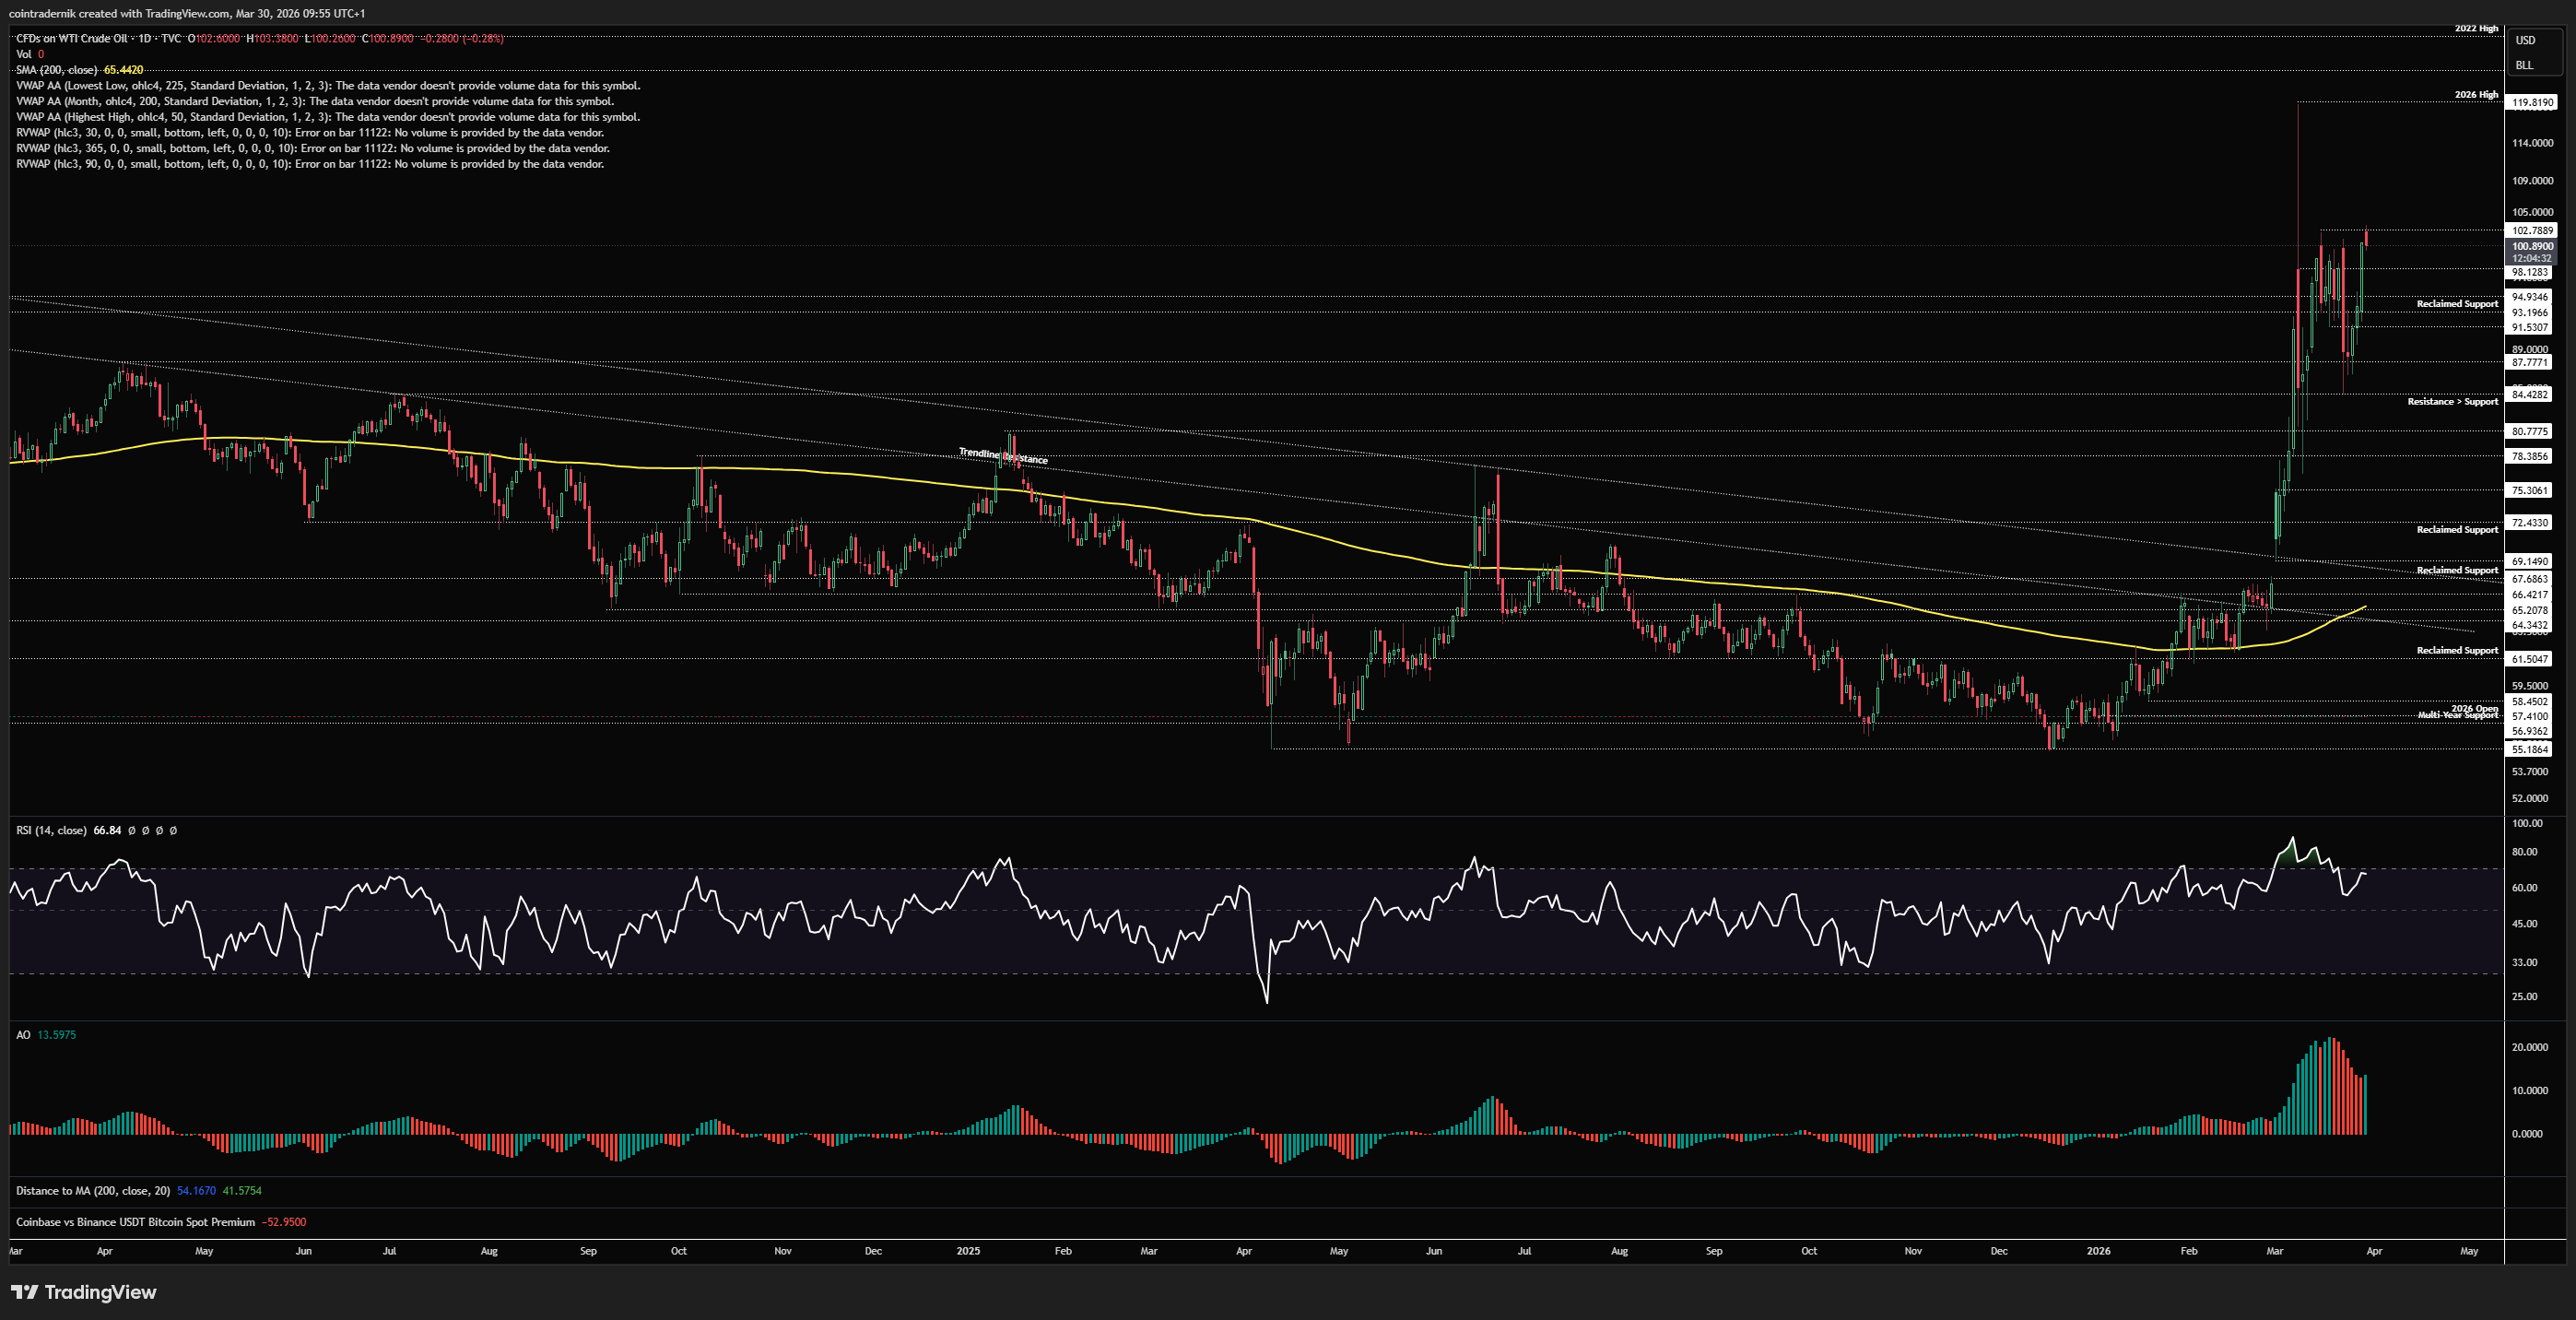
Dropping into the daily, we can see that price is already marking out some trend exhaustion here into today's high, with daily RSI diverging from the higher-highs on this timeframe. If we do reject here at $103ish and price closes below $93 with daily RSI breaking back below 50, that's game over from a purely technical POV, at least for the next few weeks. I would then expect another leg lower to follow back towards the bottom quintile of the 2-week range within which price is consolidating and where longs would again be more favourable. Daily close above $103 with daily RSI above 70 and I'd punt a long with a hard stop at $93 (though likely exiting well before that if we start breaking down), and TP1 around $116, with TP2 at $124.
I hope you've found some value in the read this week - please RT, share, engage etc. if so!
And if you've not already signed up for Ostium, please do so and test out some of the recent updates, including:
Sign up here (you don't have to use my ref link, of course): https://ostium.app/trade?from=CL&to=USD&ref=CTNIK

.avif)