

Market Outlook #75 - Fog of War
March 2, 2026
-
12
min read


This blog references an opinion and is for entertainment and informational purposes only. It is not intended to be investment advice. Seek a duly licensed professional for investment advice.
In this special Fog of War edition of the 75th Market Outlook here at Ostium Insights, we'll be taking a look at the week ahead in markets, looking at price-action, positioning and event risk for US Oil, PLTR, CVX, XOM and Gold.
Now, let's take a look at the extremely busy week ahead on the data front - alongside obviously significant headline risk from geopolitics. Yet another 'Big Week' ahead:
MONDAY: ISM MANUFACTURING PMI (FEB): (CONSENSUS 52.3 VS PREVIOUS 52.6)
MONDAY: ECB PRESIDENT LAGARDE SPEECH
TUESDAY: BOJ GOVERNOR UEDA SPEECH
TUESDAY: VARIOUS FED SPEECHES
WEDNESDAY: US ADP EMPLOYMENT CHANGE (FEB): (CONSENSUS 45K VS PREVIOUS 22K)
WEDNESDAY: US S&P GLOBAL COMPOSITE PMI (FEB): (CONSENSUS 52.3 VS PREVIOUS 52.3)
WEDNESDAY: US ISM SERVICES PMI (FEB): (CONSENSUS 54 VS PREVIOUS 53.8)
WEDNESDAY: FED'S BEIGE BOOK
THURSDAY: US INITIAL JOBLESS CLAIMS: (CONSENSUS 216K VS PREVIOUS 212K)
THURSDAY: ECB PRESIDENT LAGARDE SPEECH
FRIDAY: US NONFARM PAYROLLS (FEB): (CONSENSUS 60K VS PREVIOUS 130K)
FRIDAY: US RETAIL SALES (MOM) (JAN): (CONSENSUS -0.2% VS PREVIOUS 0%)
FRIDAY: VARIOUS FED SPEECHES
Now, let's dig into asset-specific price-action for the week ahead, looking firstly at US Oil:
Price: $72.51
Weekly:
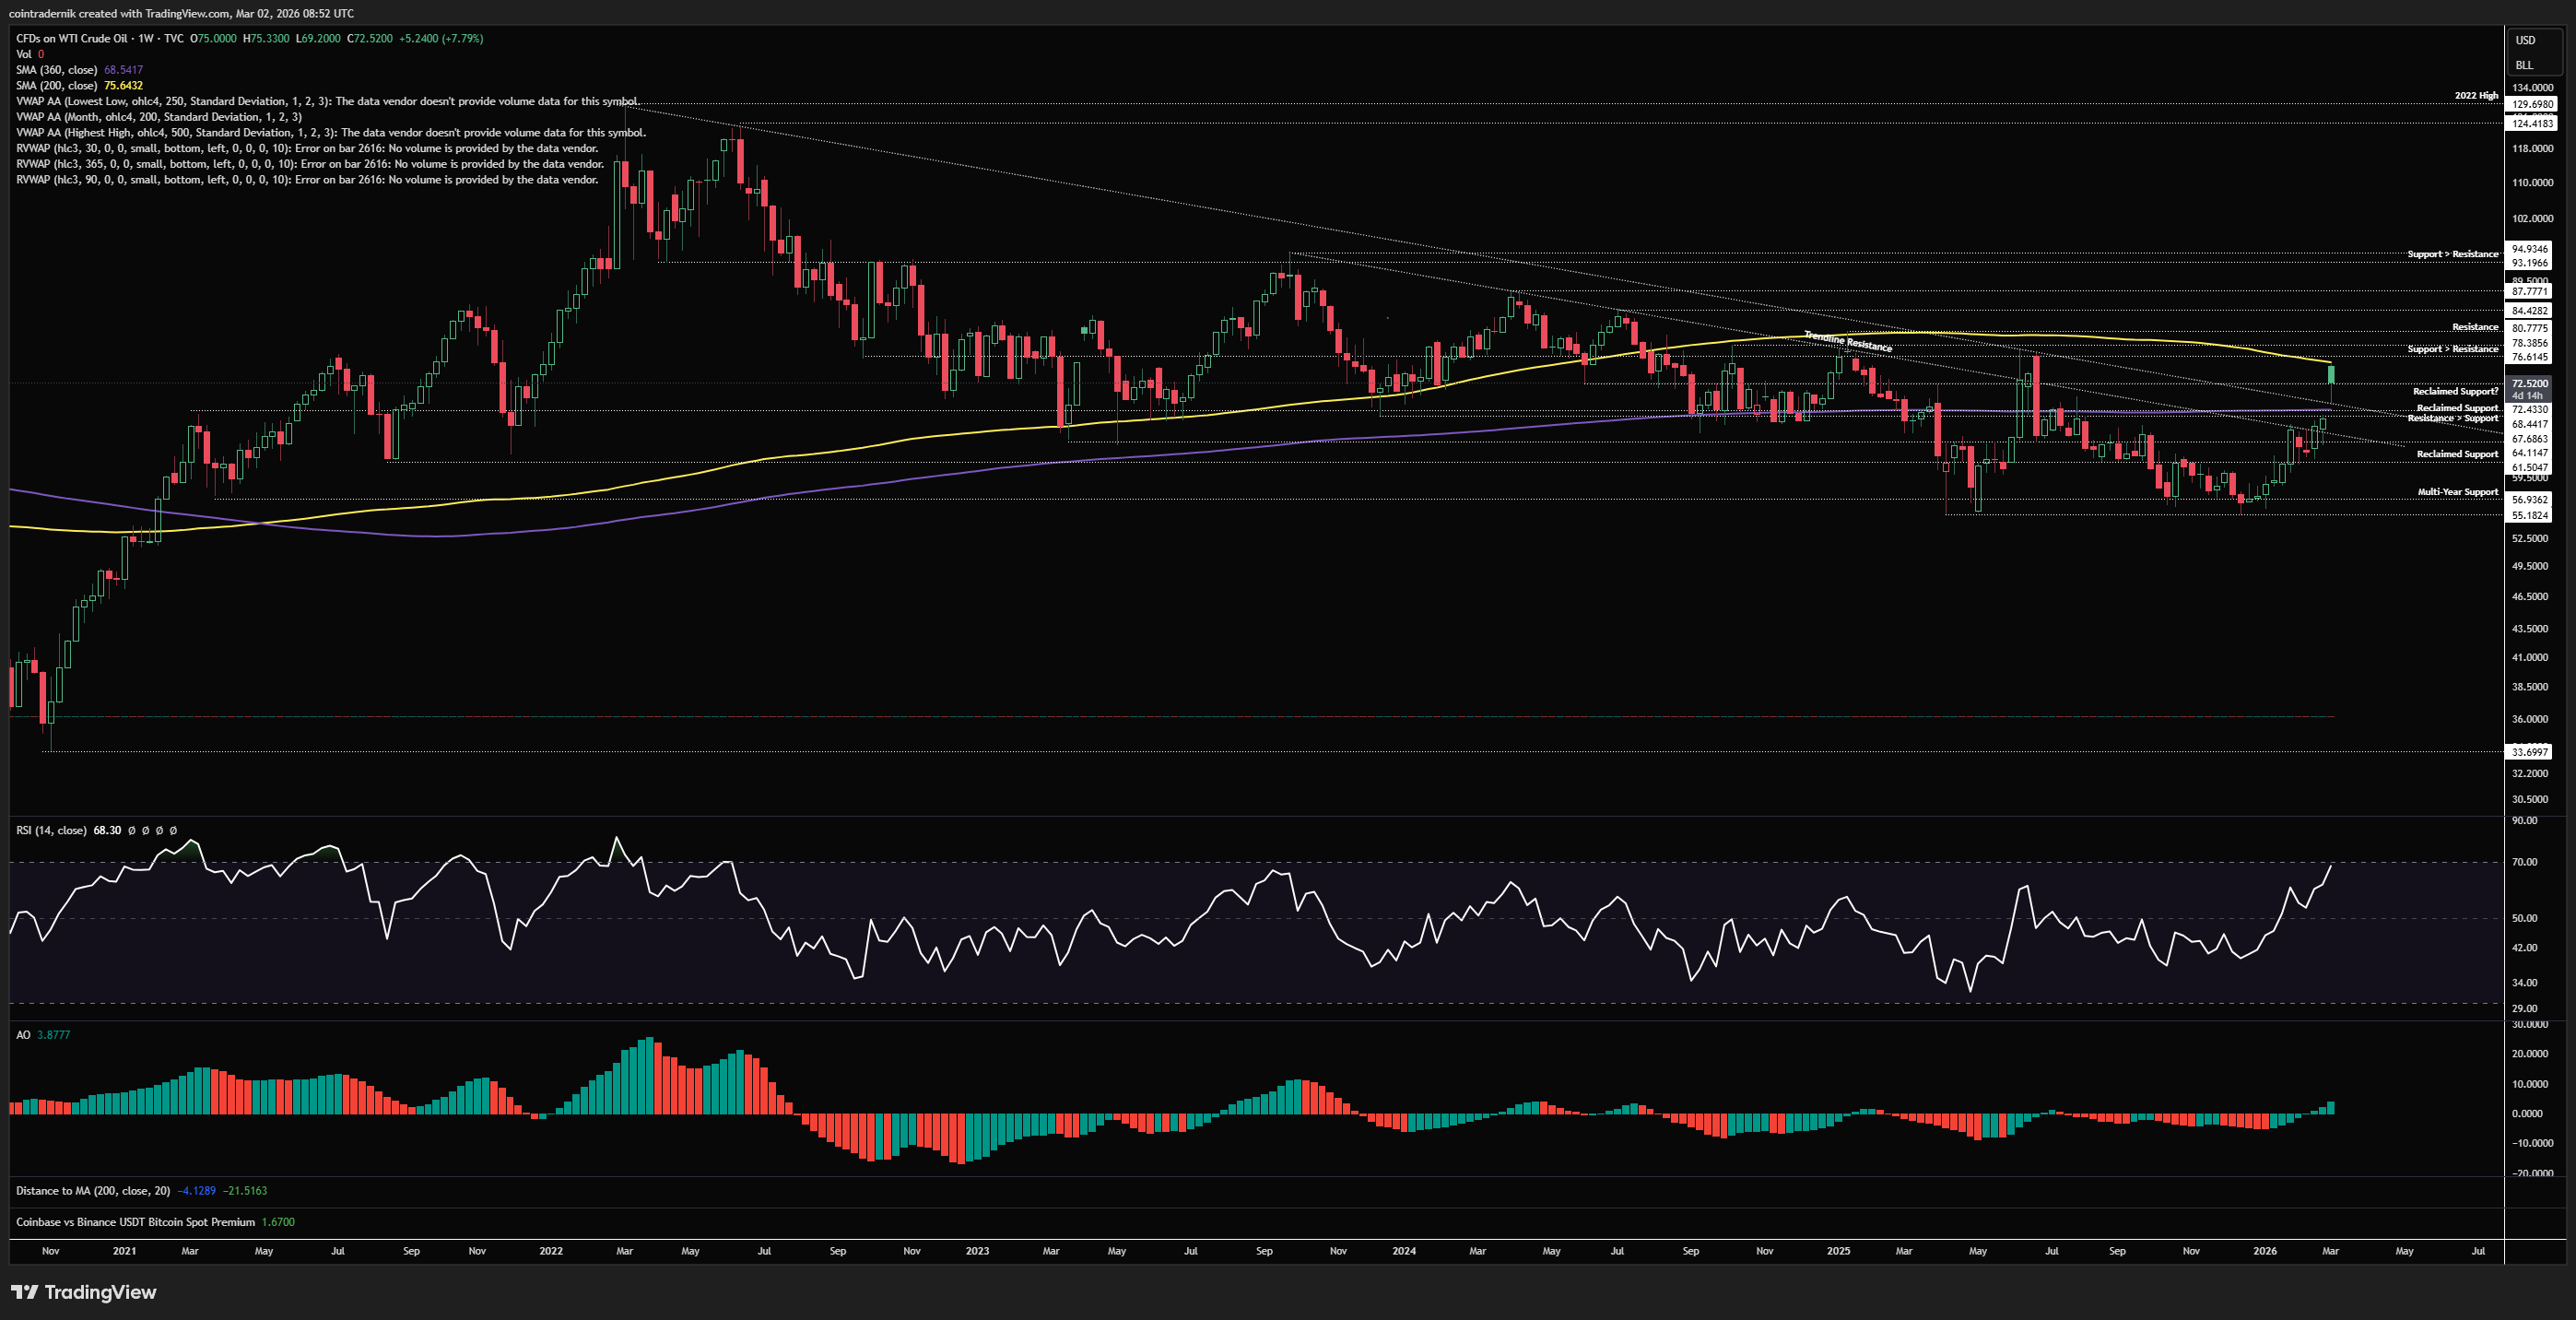
Beginning with the weekly for US Oil, we can see that following the events of the weekend, Oil has gapped higher, finally breaking above the long-term trendline resistance from the 2022 highs that had capped the rally back in mid-2025, with price finding support at that trendline earlier today. We did reject around the 200wMA at $75.64, which is also just shy of a major cluster of overhead resistance at those 2025 highs between $76-$78. Weekly momentum is firmly bullish now, but we are pushing right up against significant resistance after a narrative catalyst for the breakout, so I would not be surprised here to see $76-$78 hold on the first attempt and Oil to pull back a bit and retest that trendline breakout later this week. If it holds above $69ish (the current weekly low), then I think you can look for longs back into $77 with a very tight invalidation on a daily close back below the trendline; conversely, if today is marking peak short-term momentum to the upside and price breaks and closes back inside that trendline, that looks lie a failed breakout of a major downtrend after the most-anticipated catalyst (as we move towards midterms), and that would make me more convinced of a return to choppy range-bound price-action above that $55 yearly low but continuing to be capped by ~$69.
Daily:
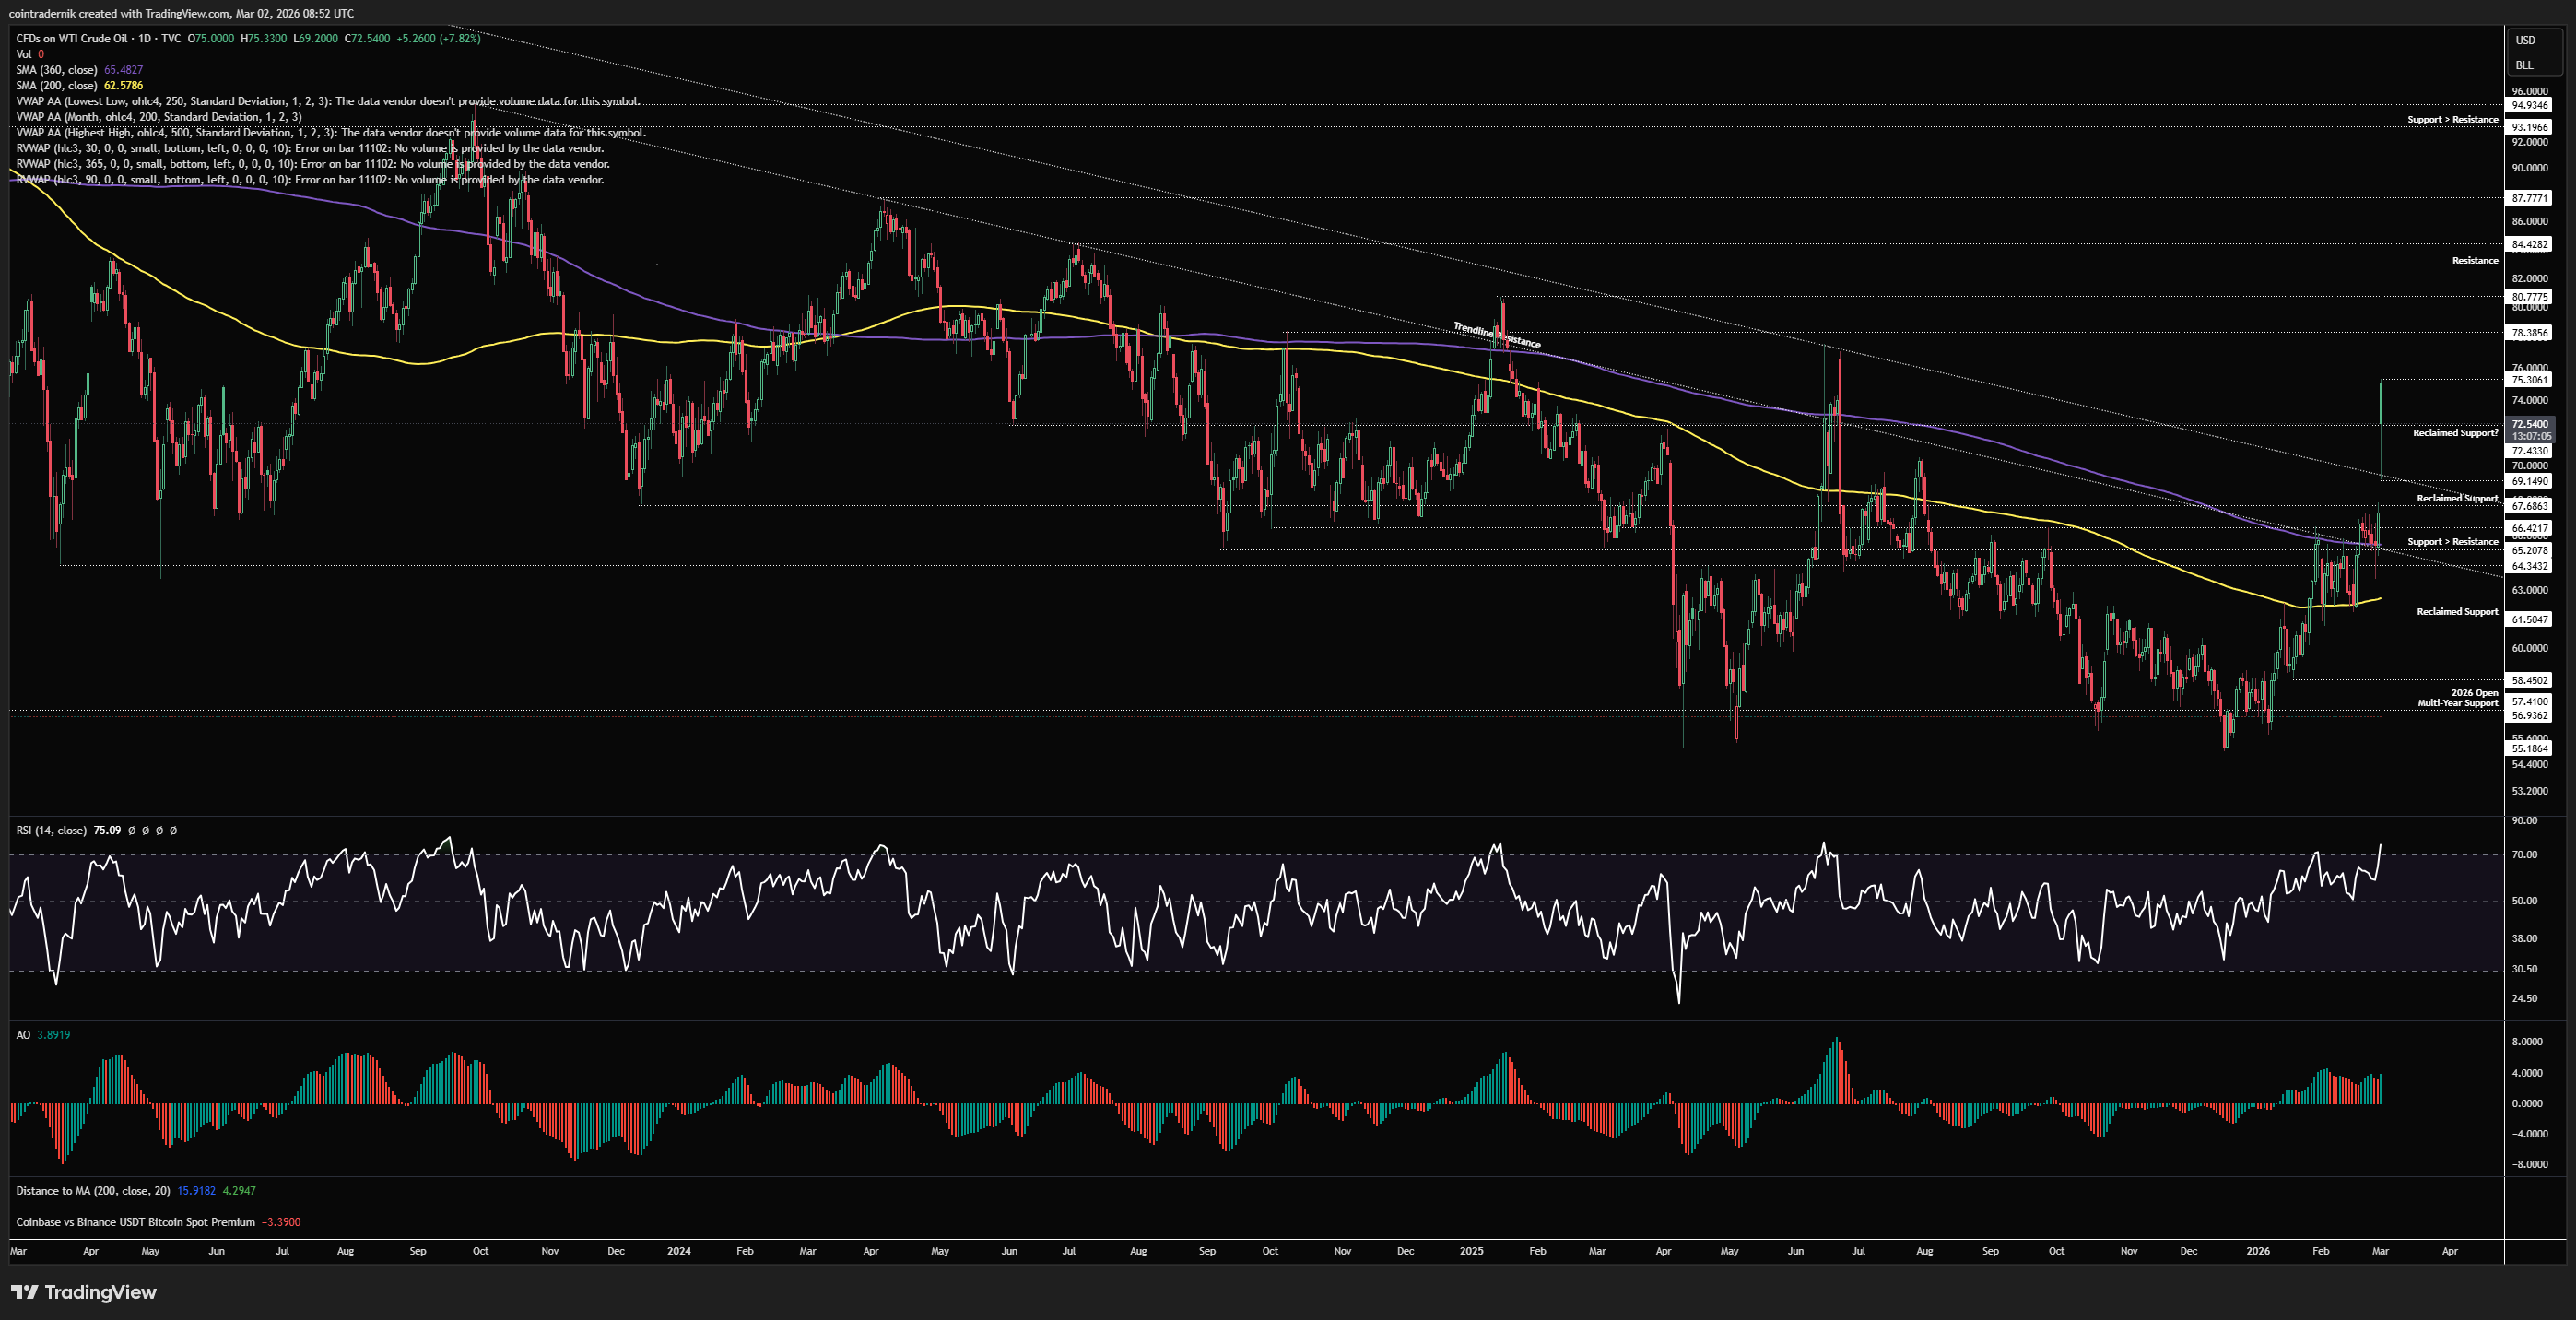
Looking at the daily, we can see that daily structure and momentum are obviously bullish here, so we should expect the weekly low to hold here and price to mark out a higher-low above trendline resistance turned support at $69. That is why it would be such a strong signal should price fail to do so. Given the proximity here to that massive resistance at ~$78 I would not be longing in no man's land, but I will very likely try a long if we fill in some of that morning wick with invalidation as outlined above. If this is a sustainable, long-term Oil breakout, this should not be flipping $69 back into resistance. If you want my opinion, I think it is more probable that this becomes a news failure and we do trade back inside the range, trapping over-eager Oil longs at the highs, with the more sustainable tailwinds for Oil likely to enter the frame a little later this year. I do think any move back inside $69 does not lead to a huge retrace but just more choppy price-action before a real breakout and trend higher later this year. If we hold $69 as support early this week (and my long back to $77 works out, fill-dependent), there's a much higher probability this view is wrong and the trend higher is in play, in which case I'll have made some money on it anyway. Acceptance above $78ish = $84 retest.
Price: $137.19
Weekly:
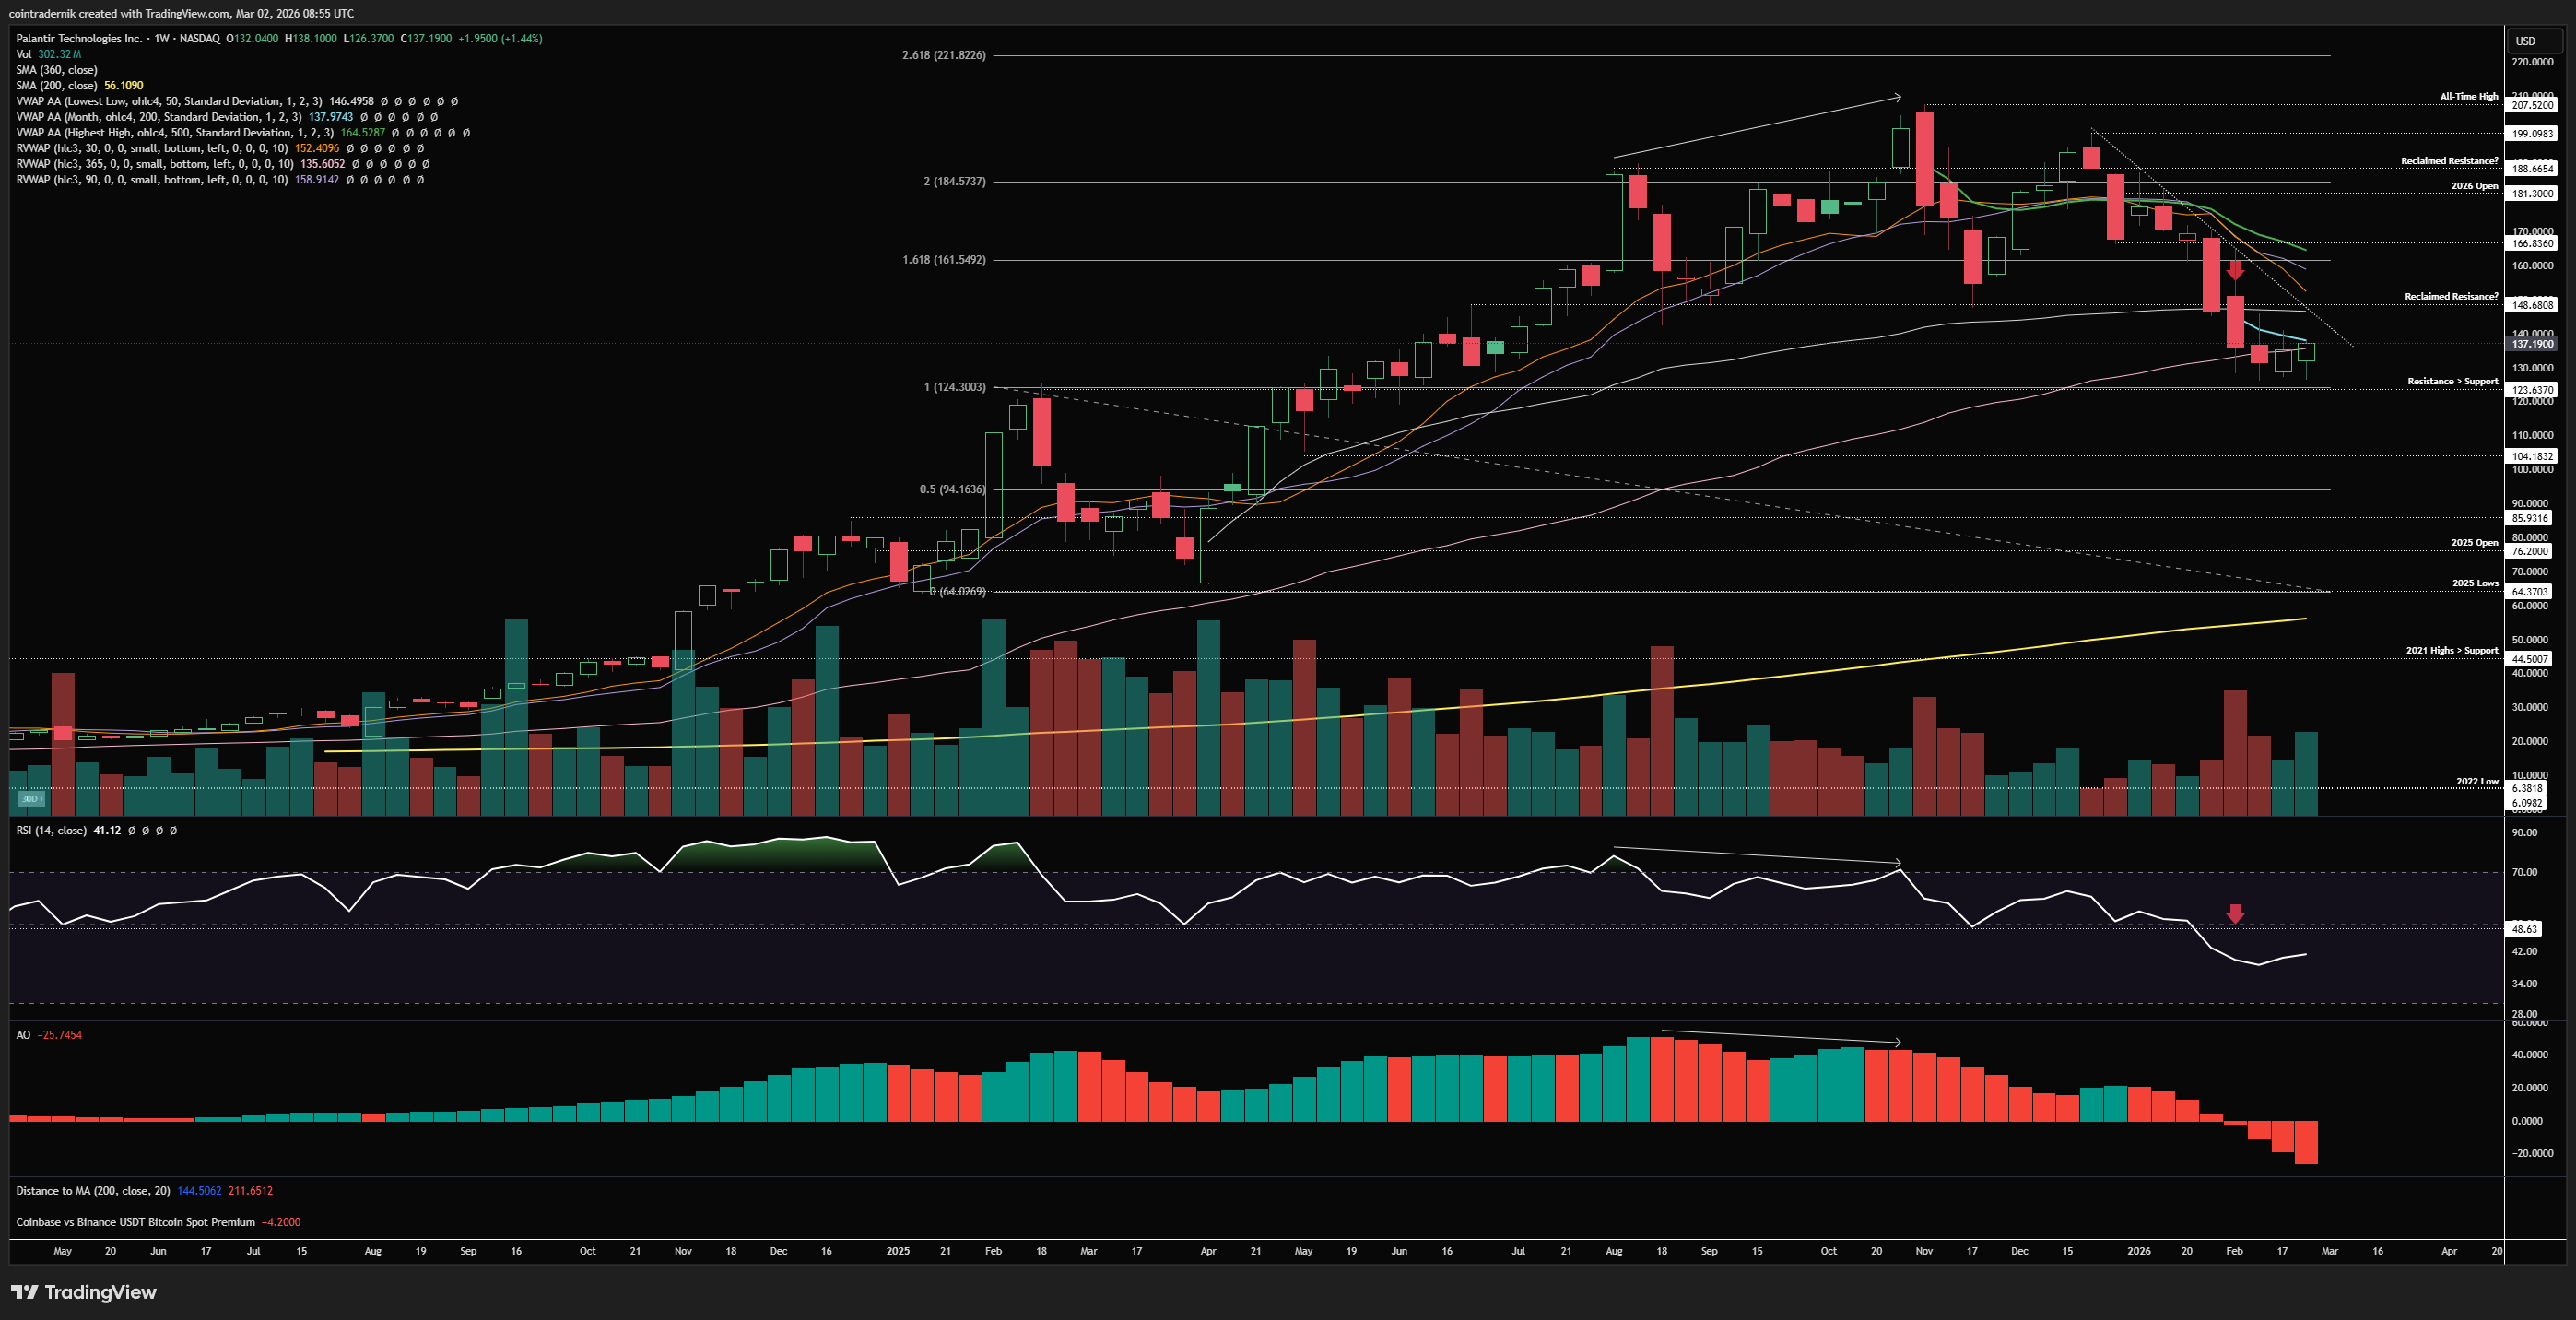
Beginning with the weekly for PLTR, we can see that price played out pretty perfectly following the bearish divergence and lower-high, with loss of $148 and 50 on weekly RSI leading to a capitulation leg lower into resistance turned support at $123.67, right around the 365d rolling VWAP, where the stock has been consolidating for a few weeks, failing to break lower. We remain capped by trendline resistance and all key MAs and VWAPs, with bearish weekly structure and bearish momentum, so we should anticipate any rally here into the anchored VWAP from tariff lows at $148 to be faded, marking out another lower-high; but, crucially, should this fail to materialise, with price instead breaking and closing back above $150, we have a reclaim of a massive level and the neckline of the long-term head and shoulders that Michael Burry has plastered all over the timeline. I would be a buyer of PLTR if we flip $150 back into support, expecting a huge short squeeze to follow from that point. Until then, I remain uninterested in PLTR, but given this structure and momentum if you were looking for a high R/R short area it would be a pop higher into $148, with invalidation on a weekly close back above that level. Should we mark out that lower-high and break below $123, I think $104 gets taken out, with no major support until back towards $86.
Daily:
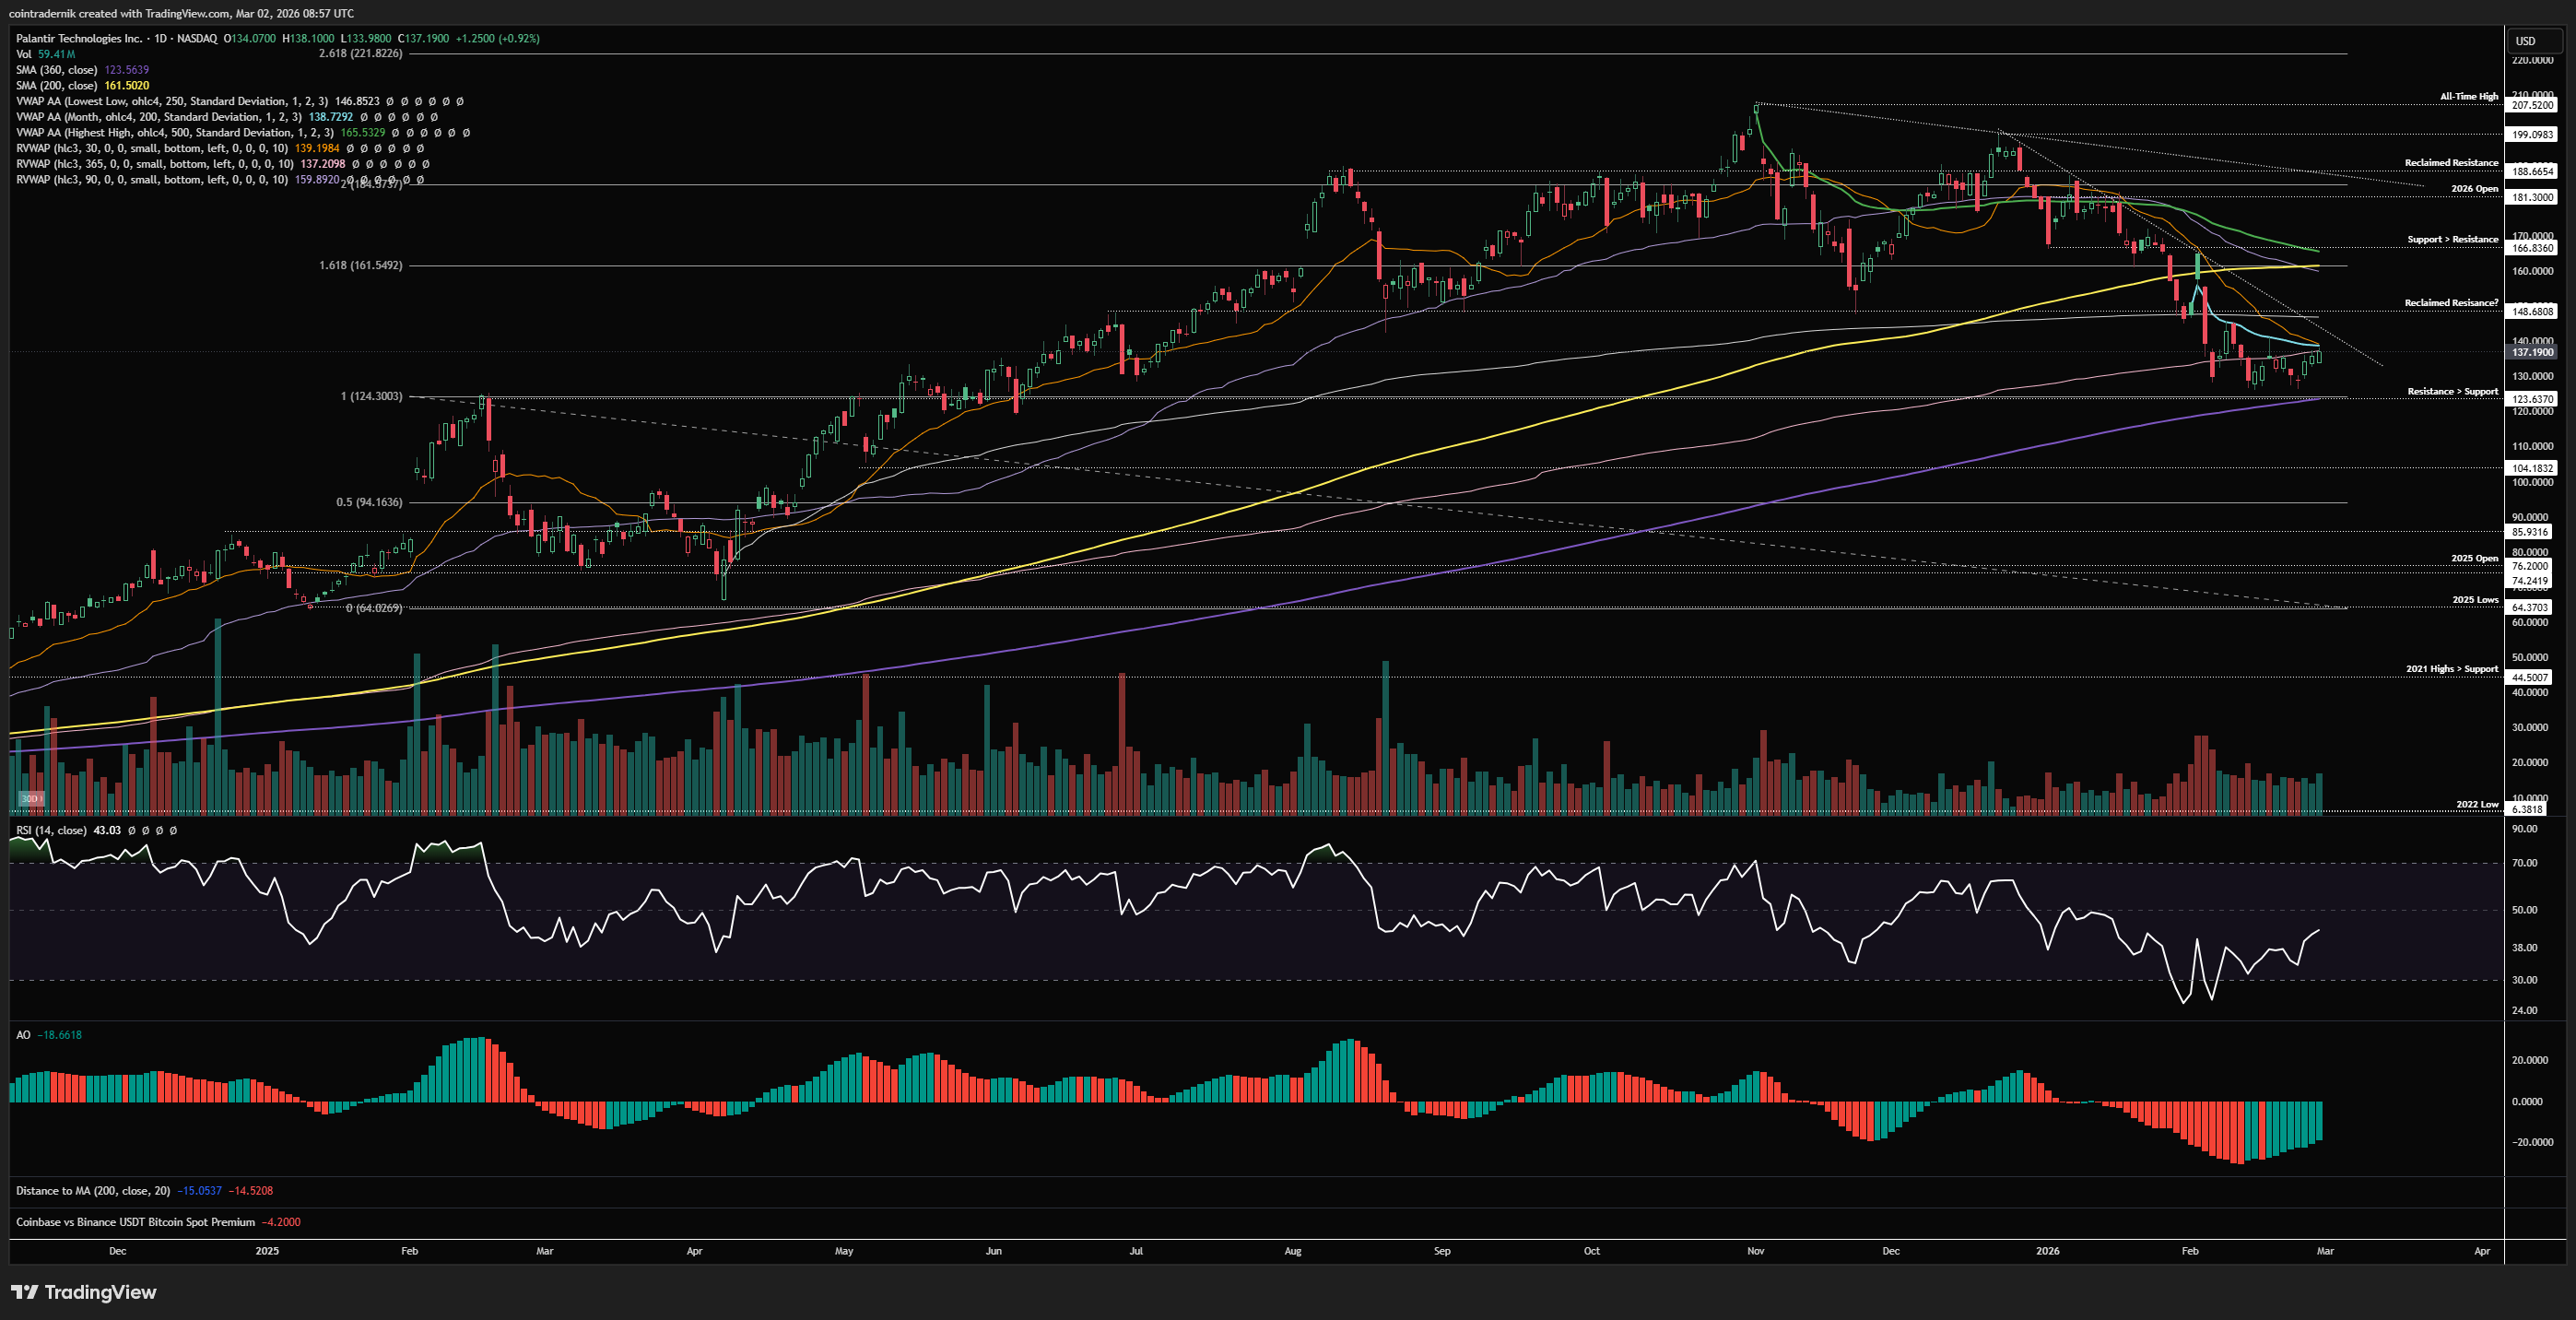
Turning to the daily timeframe, we can see that momentum appears to have bottomed out on this timeframe as price is consolidating between the 365d rolling VWAP as minor resistance and the 360dMA as support, with the Feb VWAP and 30d rolling VWAP confluent with that $138 area that is capping price of late. Should price break higher and flip this cluster into support, I would expect that squeeze to push into $150, marking a breakout above the trendline - and this is precisely where a lot of people can get caught offsides in either direction. If we have a trendline breakout, and price runs into $150, we're retesting the neckline of a huge H&S / multi-month range breakdown, and price could very well trap local breakout longs and punish them with that lower-high at a key level followed by a puke to fresh lows; conversely, everyone short from the neckline breakdown is likely getting a little bit nervous at price failing to break new lows here, so if we squeeze into $150, do they cover and fuel a reclaim? To be honest, I think so much is dependent here on the index itself, and the numerous mixed signals for PLTR continue to make me uninterested in putting on a position. What I would really want to see is that $150 level reclaimed with gusto, and then look to rebuy close to that level on an intraday pullback - beyond that, I don't really like anything here unless it trades much lower.
Receive the latest updates directly to your inbox

Price: $186.76
Weekly:
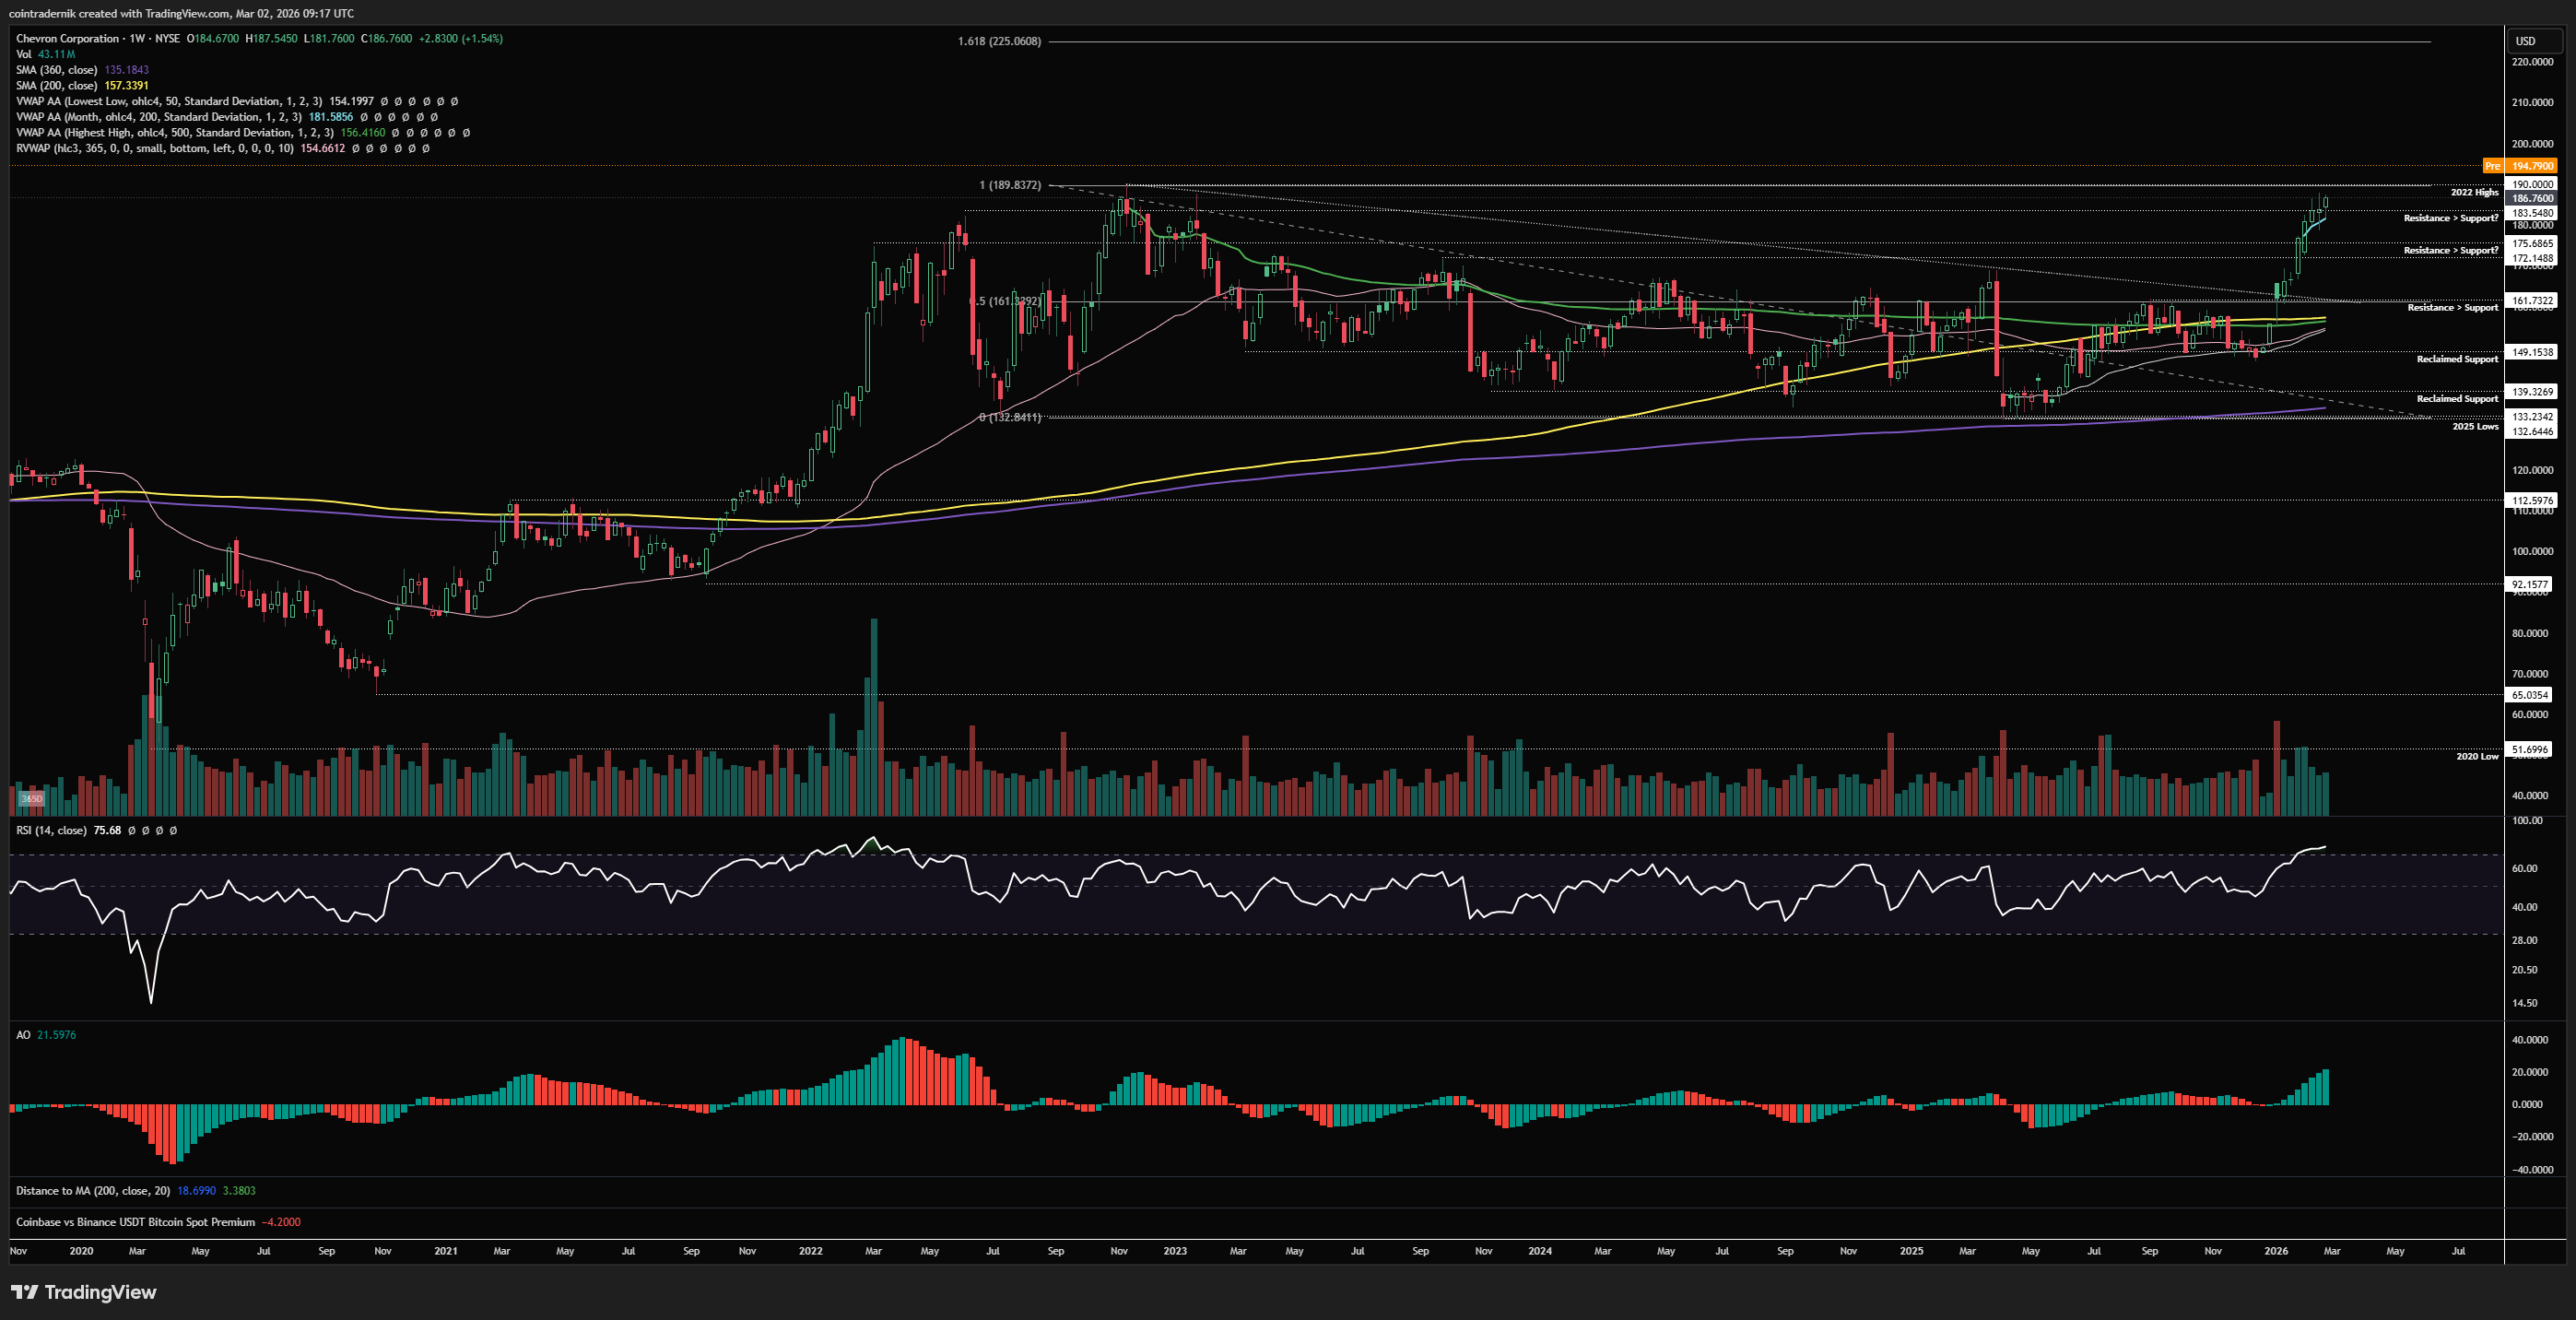
Looking firstly at the weekly for CVX, we can see that following the weekend's news, price is at fresh all-time highs beyond the $190 2022 highs in pre-market. The stock has been on an absolute tear since breaking out beyond trendline resistance from that 2022 high a few months ago with price flipping all the VWAPs and MAs into support, reclaiming $161 as support and ripping into $187 as of last week. This is likely the week where the late longs could get trapped, particularly above the 2022 highs, and if we can't accept above that level and flip it into support I think there's a good chance we get some sort of bull trap / failed breakout: a push above $190 during the cash session and then acceptance back below last week's high into this week's close is probably a good sign to offload some exposure short-term if you have been long, with a view to re-entering on a pull-back. If, instead, this week sees a close above $190, we are in price discovery, with the 1.618 fib extension of the multi-year range up near $225. I would be looking to buy dips above $190 towards that level with invalidation on acceptance back inside the 2022 high.
Daily:
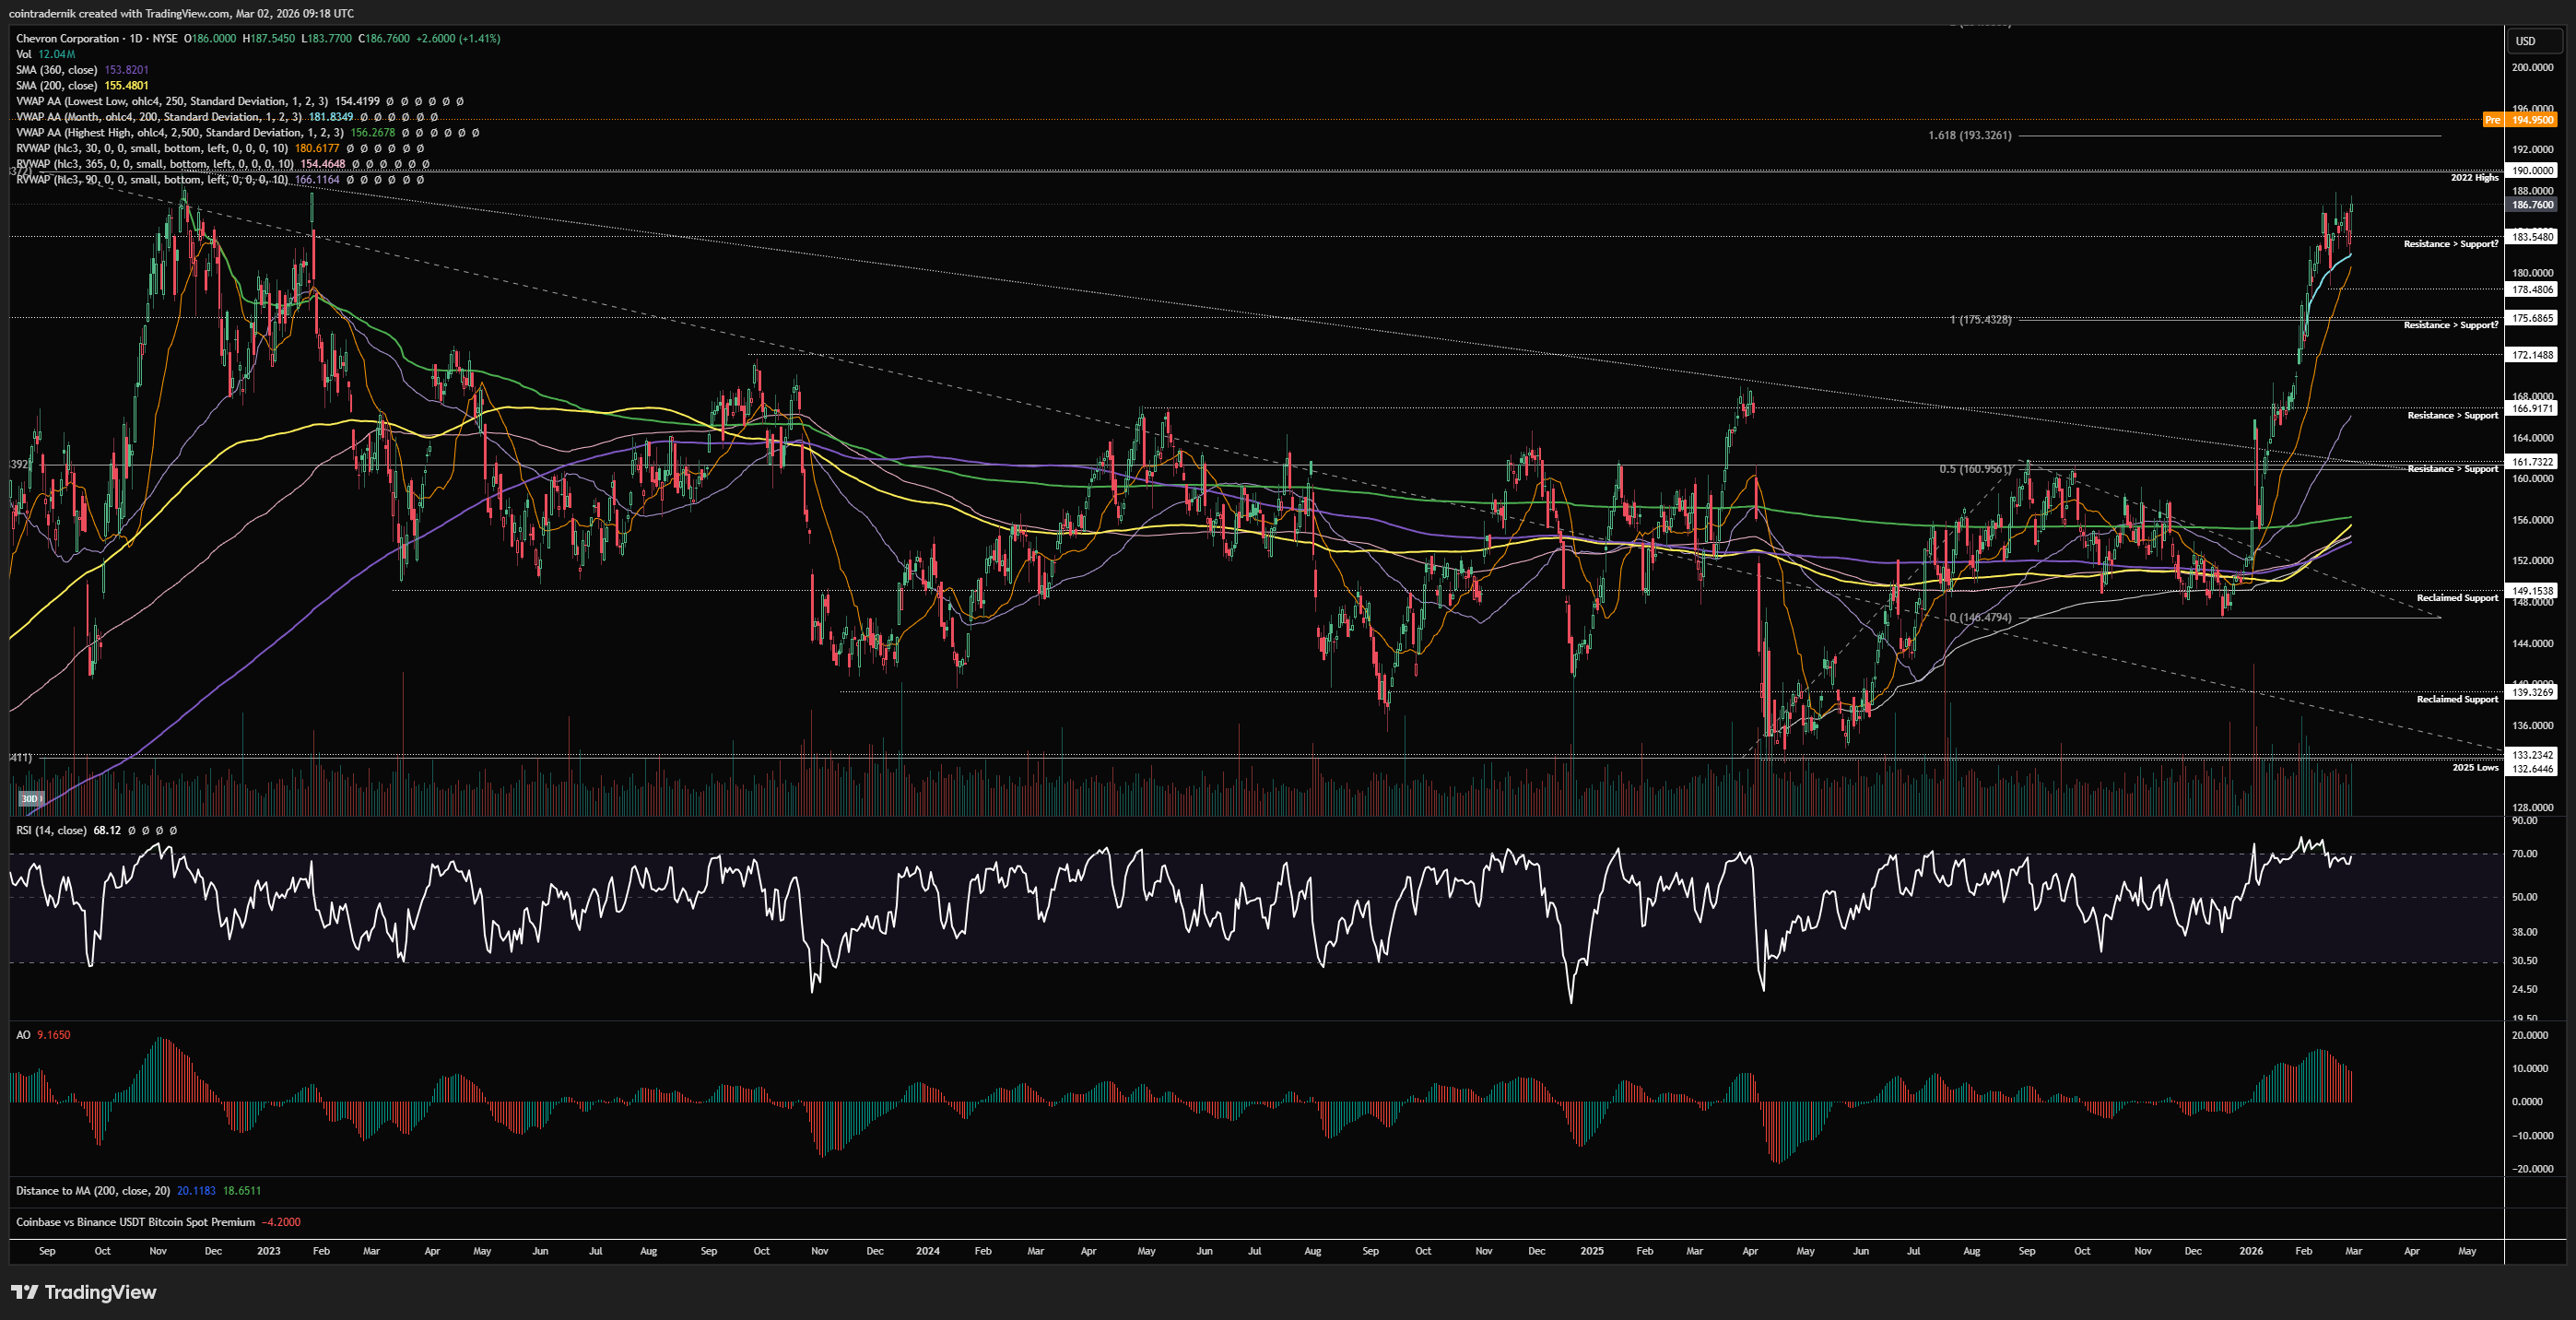
Dropping into the daily timeframe, we can see that price is in the midst of its second major leg higher off that April 2025 lows, with the Feb VWAP and 30d rolling VWAP holding firm as price marks out higher-lows, flipping prior resistance levels into support. we have been consolidating below the 2022 highs for a couple of weeks here, and bulls want to see today's pre-market push stick the landing and mark a breakaway gap from this range, holding above $190 early this week. If we see that, I would expect continuation higher to follow towards that $225 level before any major resistance is found. If, instead, as mentioned above, we reject above the 2022 highs and return back inside $190 and back inside last week's highs at $187ish, that would not look good for the breakout long energy crowd, and I would expect a deeper pullback to play out, likely clearing out $178 and pushing towards the range between $172-$175 within a few weeks, where I think the probability of another higher-low above the $147 swing-low from late Dec 2025 is likely to form within this longer-term uptrend.
Price: $152.50
Weekly:
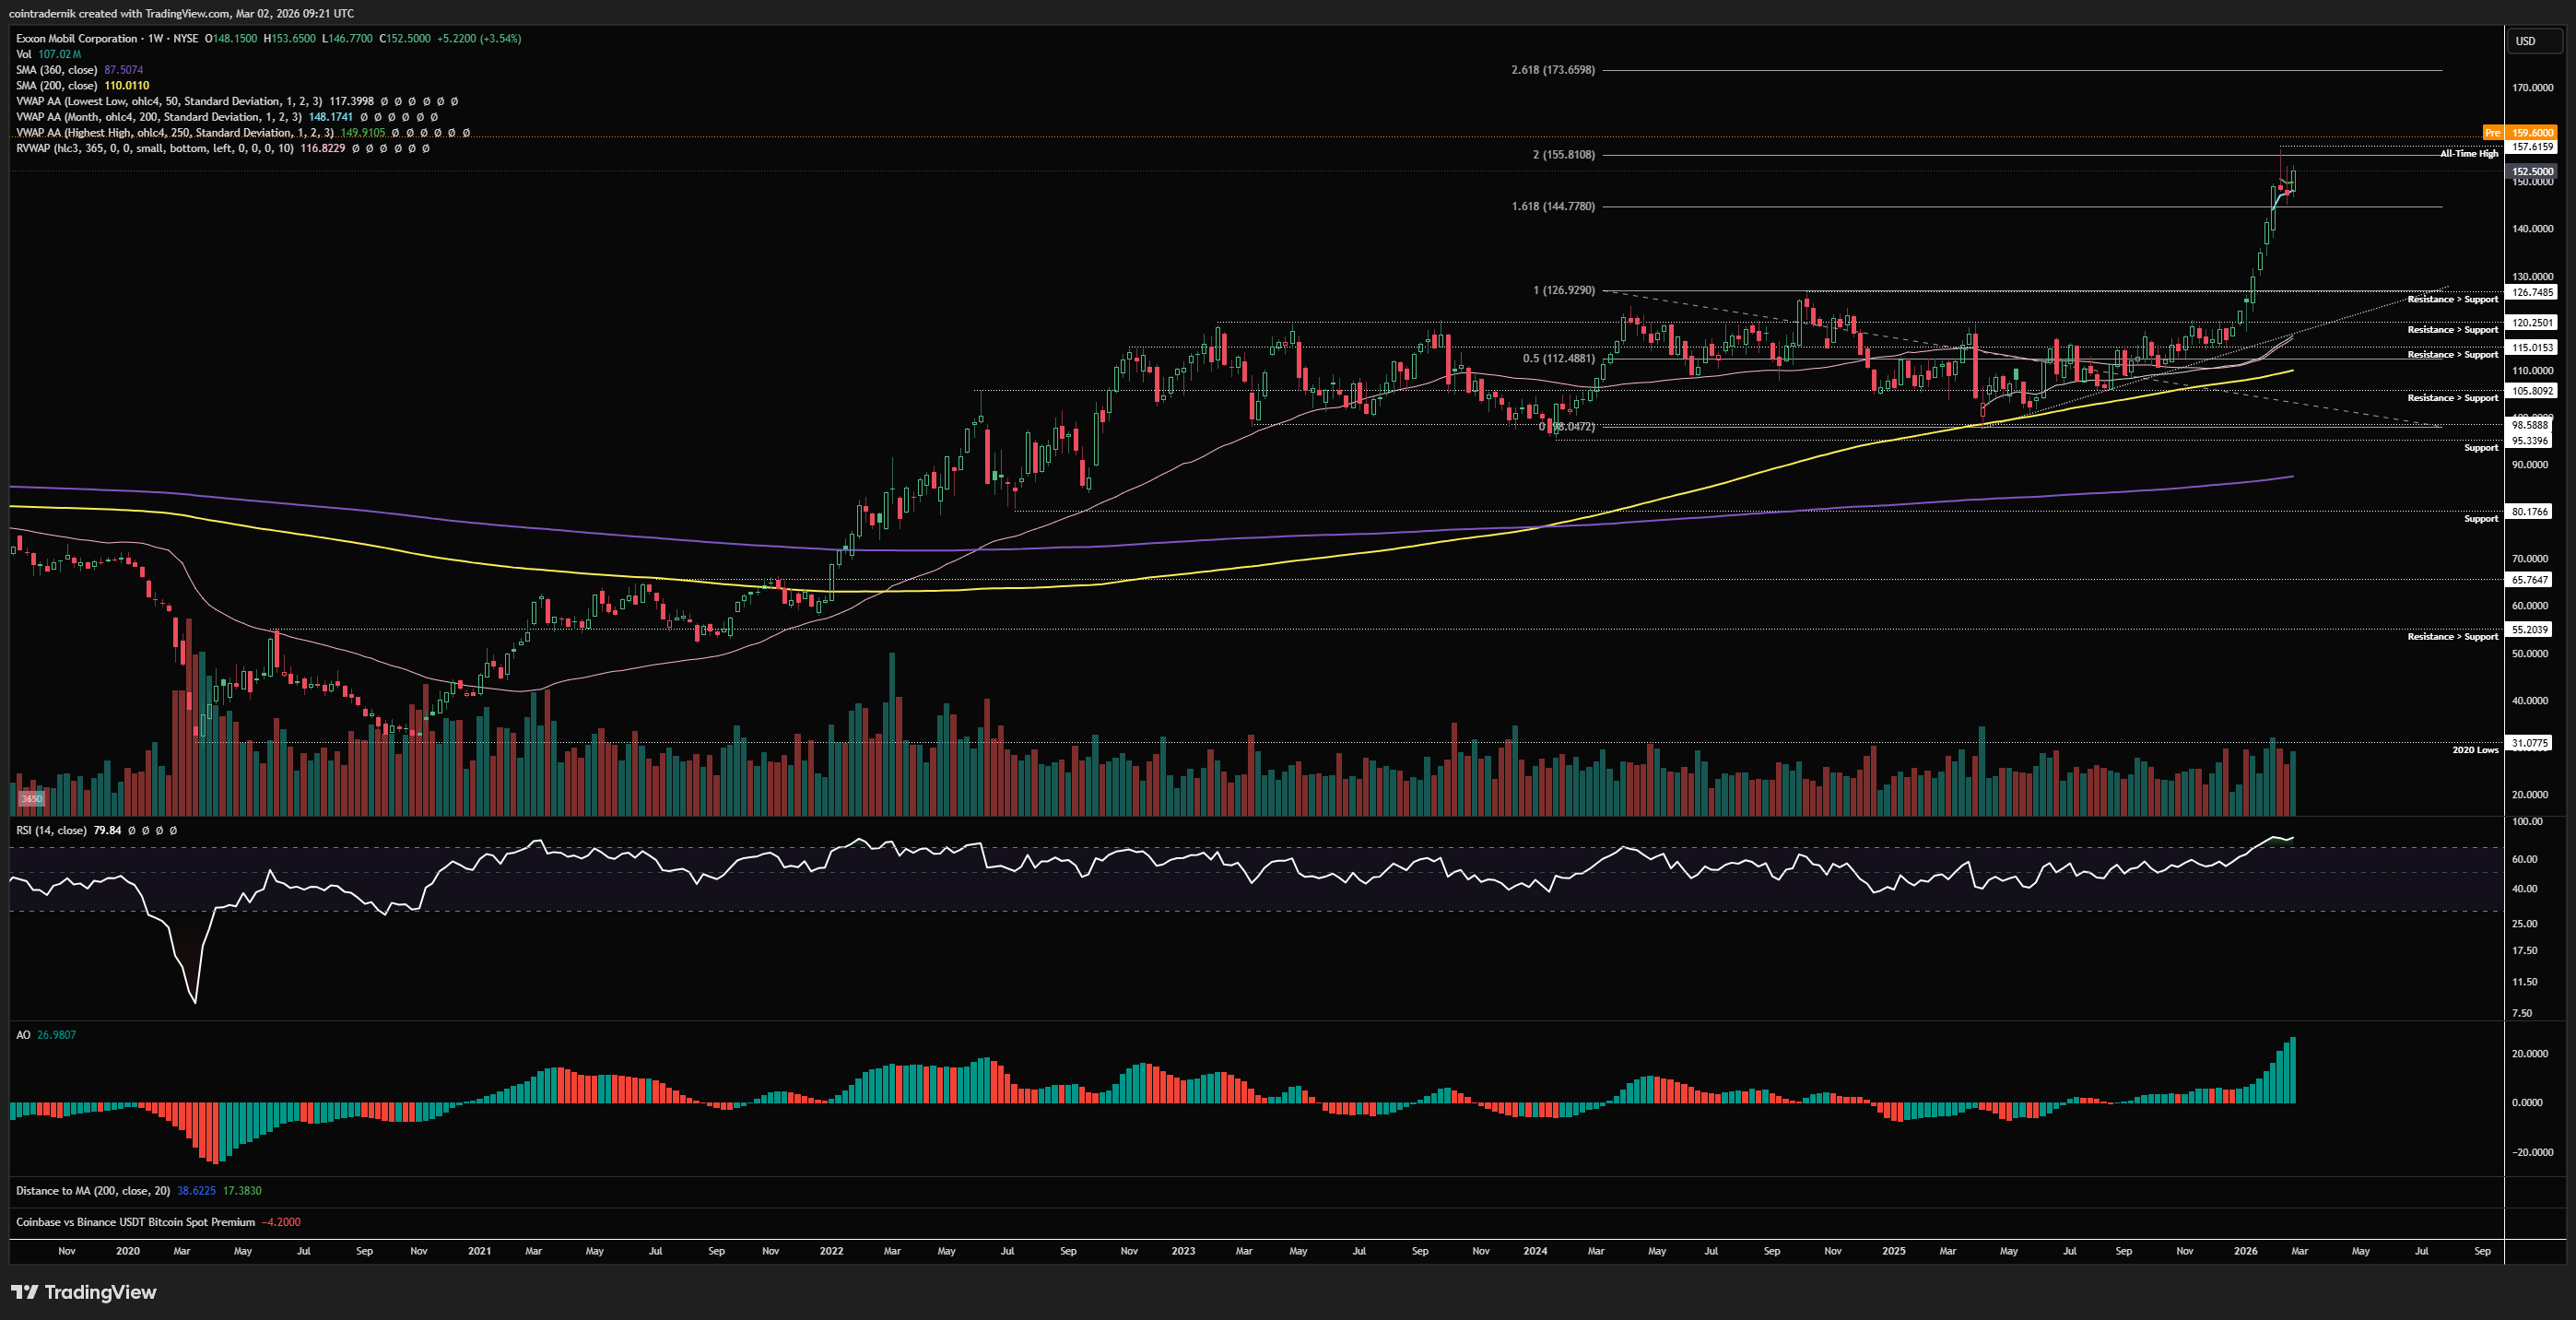
If we begin by looking at XOM on the weekly timeframe, we can see it has been an absolute monster since breaking beyond all-time highs at $126, clearing that multi-year range resistance and running through the 1.618 extension at $145 into the 200% extension at $155.80, above which it wicked into a fresh high at $157.60, before rejecting and consolidating between those two major levels. Last week saw price bounce of $144 as support and pre-market trading is seeing fresh new highs for XOM above $157.60, and the same deal applies here as the one I marked out for CVX: if we wick above that prior high and then see price fail to hold above it, instead rejecting and retracing back inside, there's a good chance we're seeing some sort of news failure into all-time highs with a local peak in Energy names. This would only be temporary, in my view, as I do think the next 12 months will continue to be strong for this sector, but if price is failing to accept at fresh highs on war headlines it's a pretty clear sign that we're toppy short-term. If, instead, $157 turns into support this week and we push higher, I would expect to see the 2.618 extension of the long-term range tagged at $174ish.
Daily:
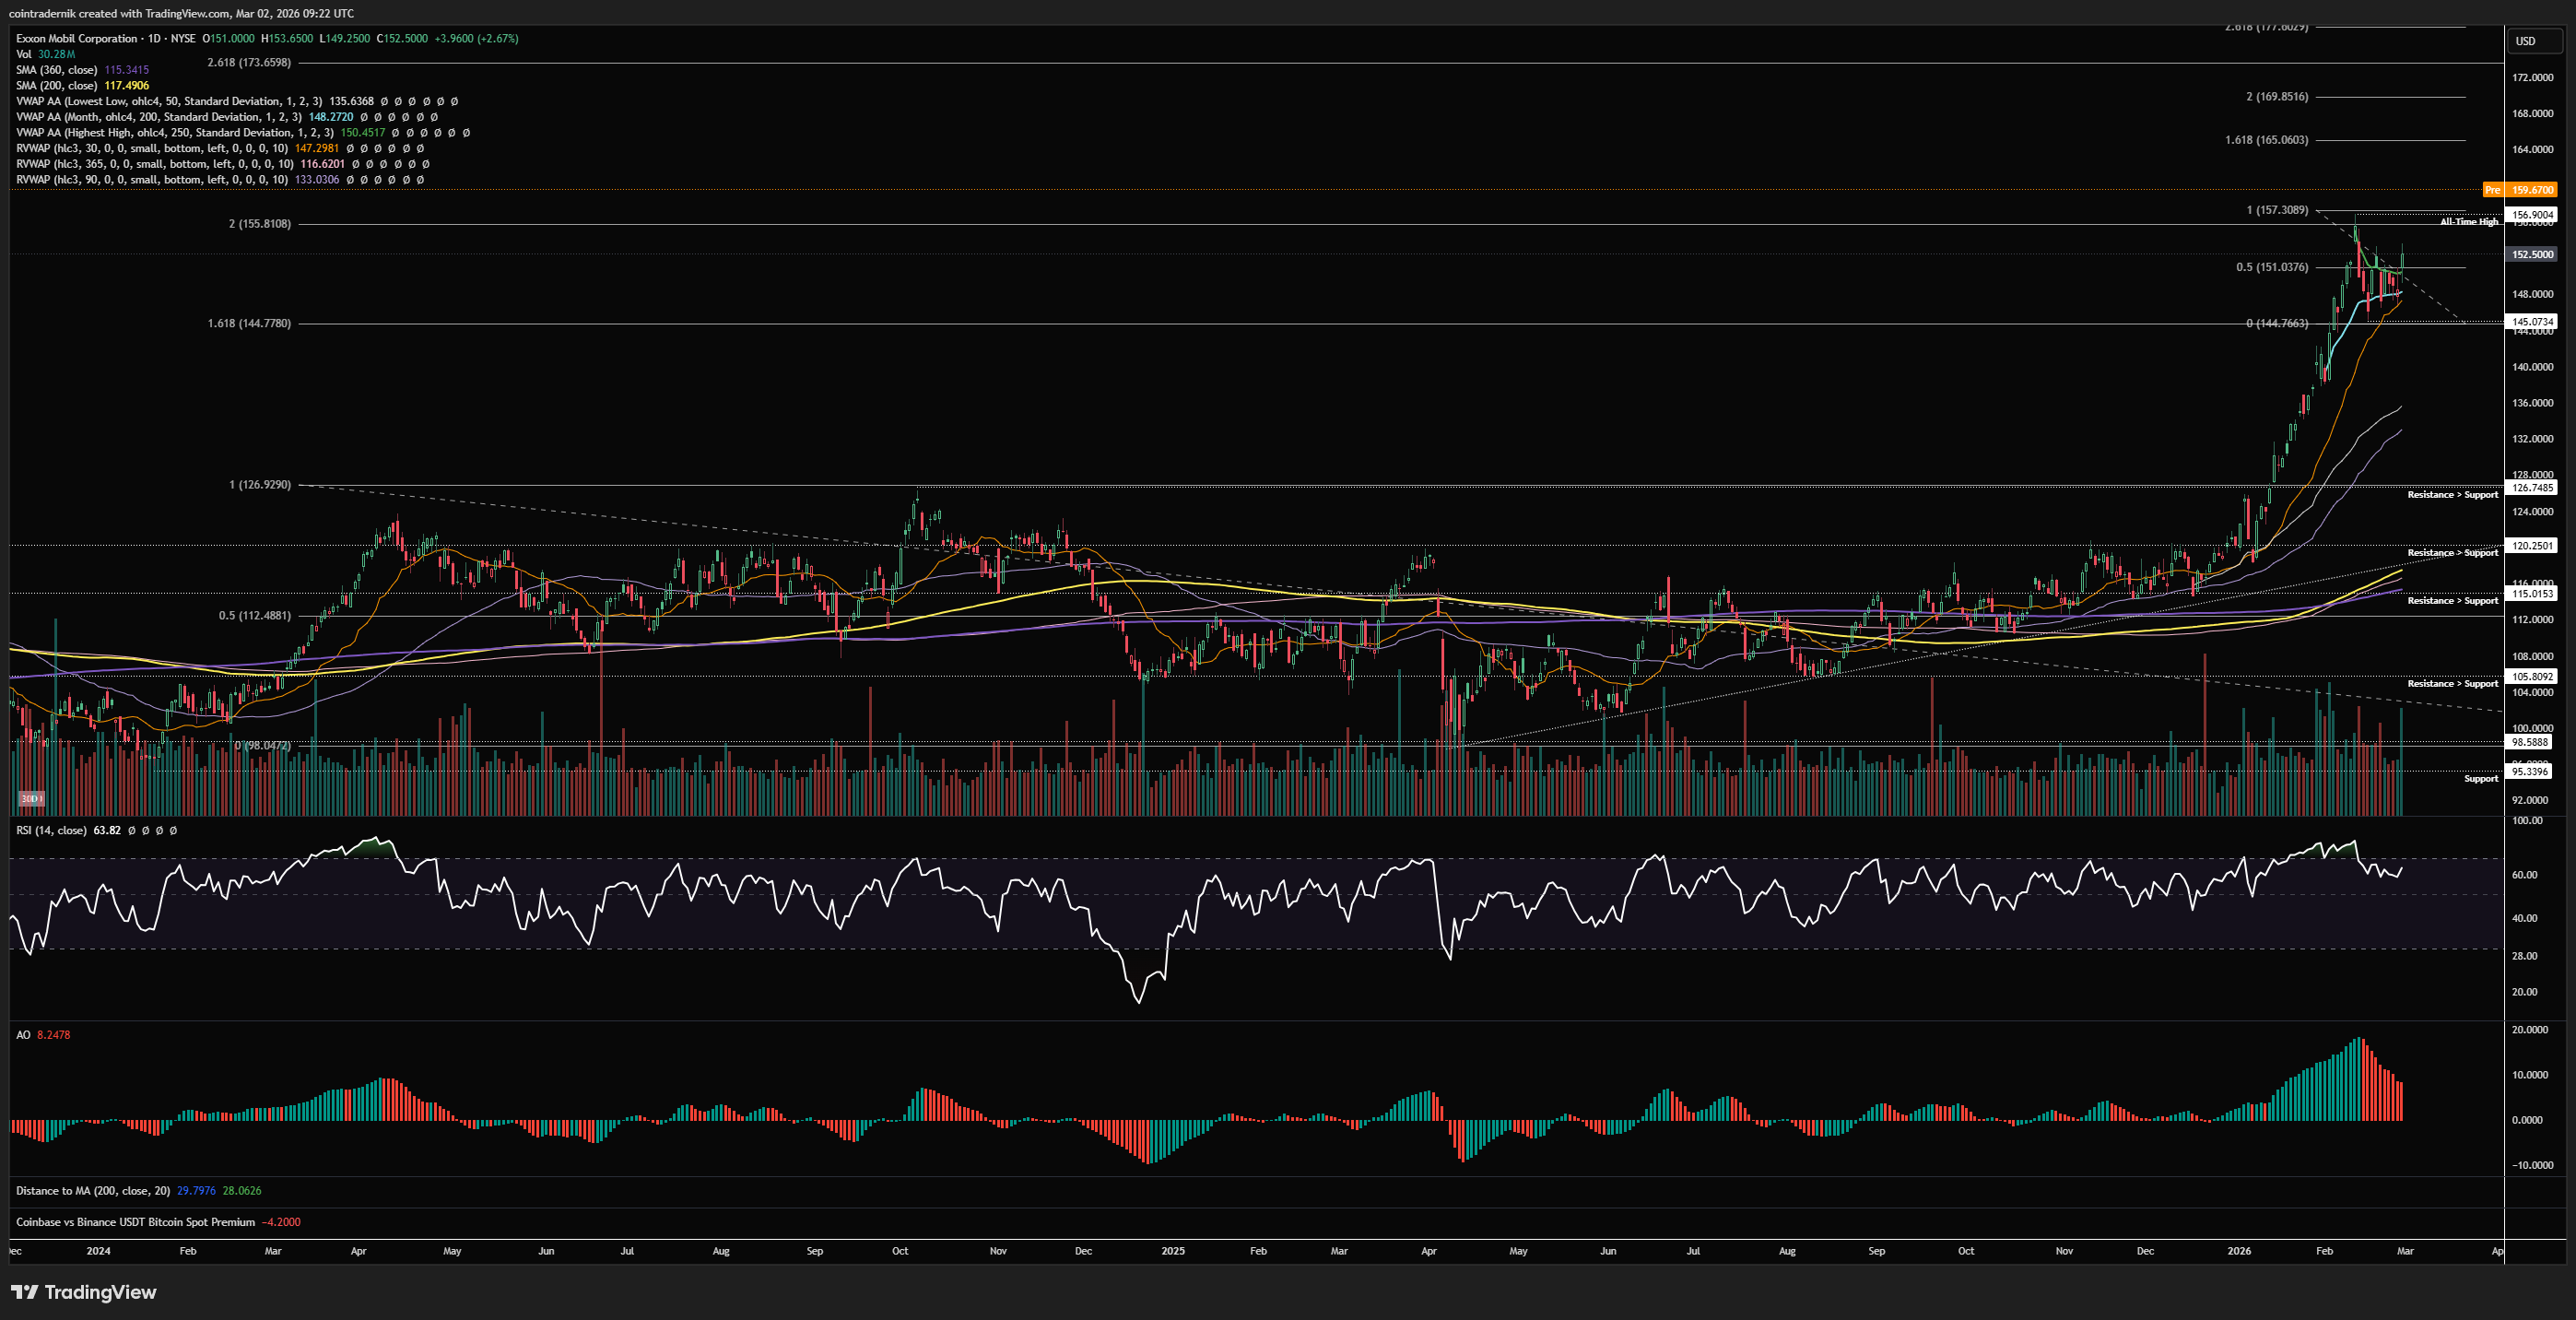
Turning now to the daily, we can see that we got a little bit of a momentum reset on the most recent consolidation, with no trend exhaustion here for now on these momentum indicators, and price held above the Feb VWAP and 30d rolling VWAP, marking out higher lows and closing last week above the anchored VWAP from all-time highs. The next couple of cash sessions will be key here, with acceptance above $157, flipping that level into support and pushing higher, opening up another major leg higher for XOM towards that $174 area, with some minor fib levels between. If we do reject, however, and close below the 30d rolling VWAP, I think you can start looking at shorts back towards $135...
Price: $5396
Weekly:
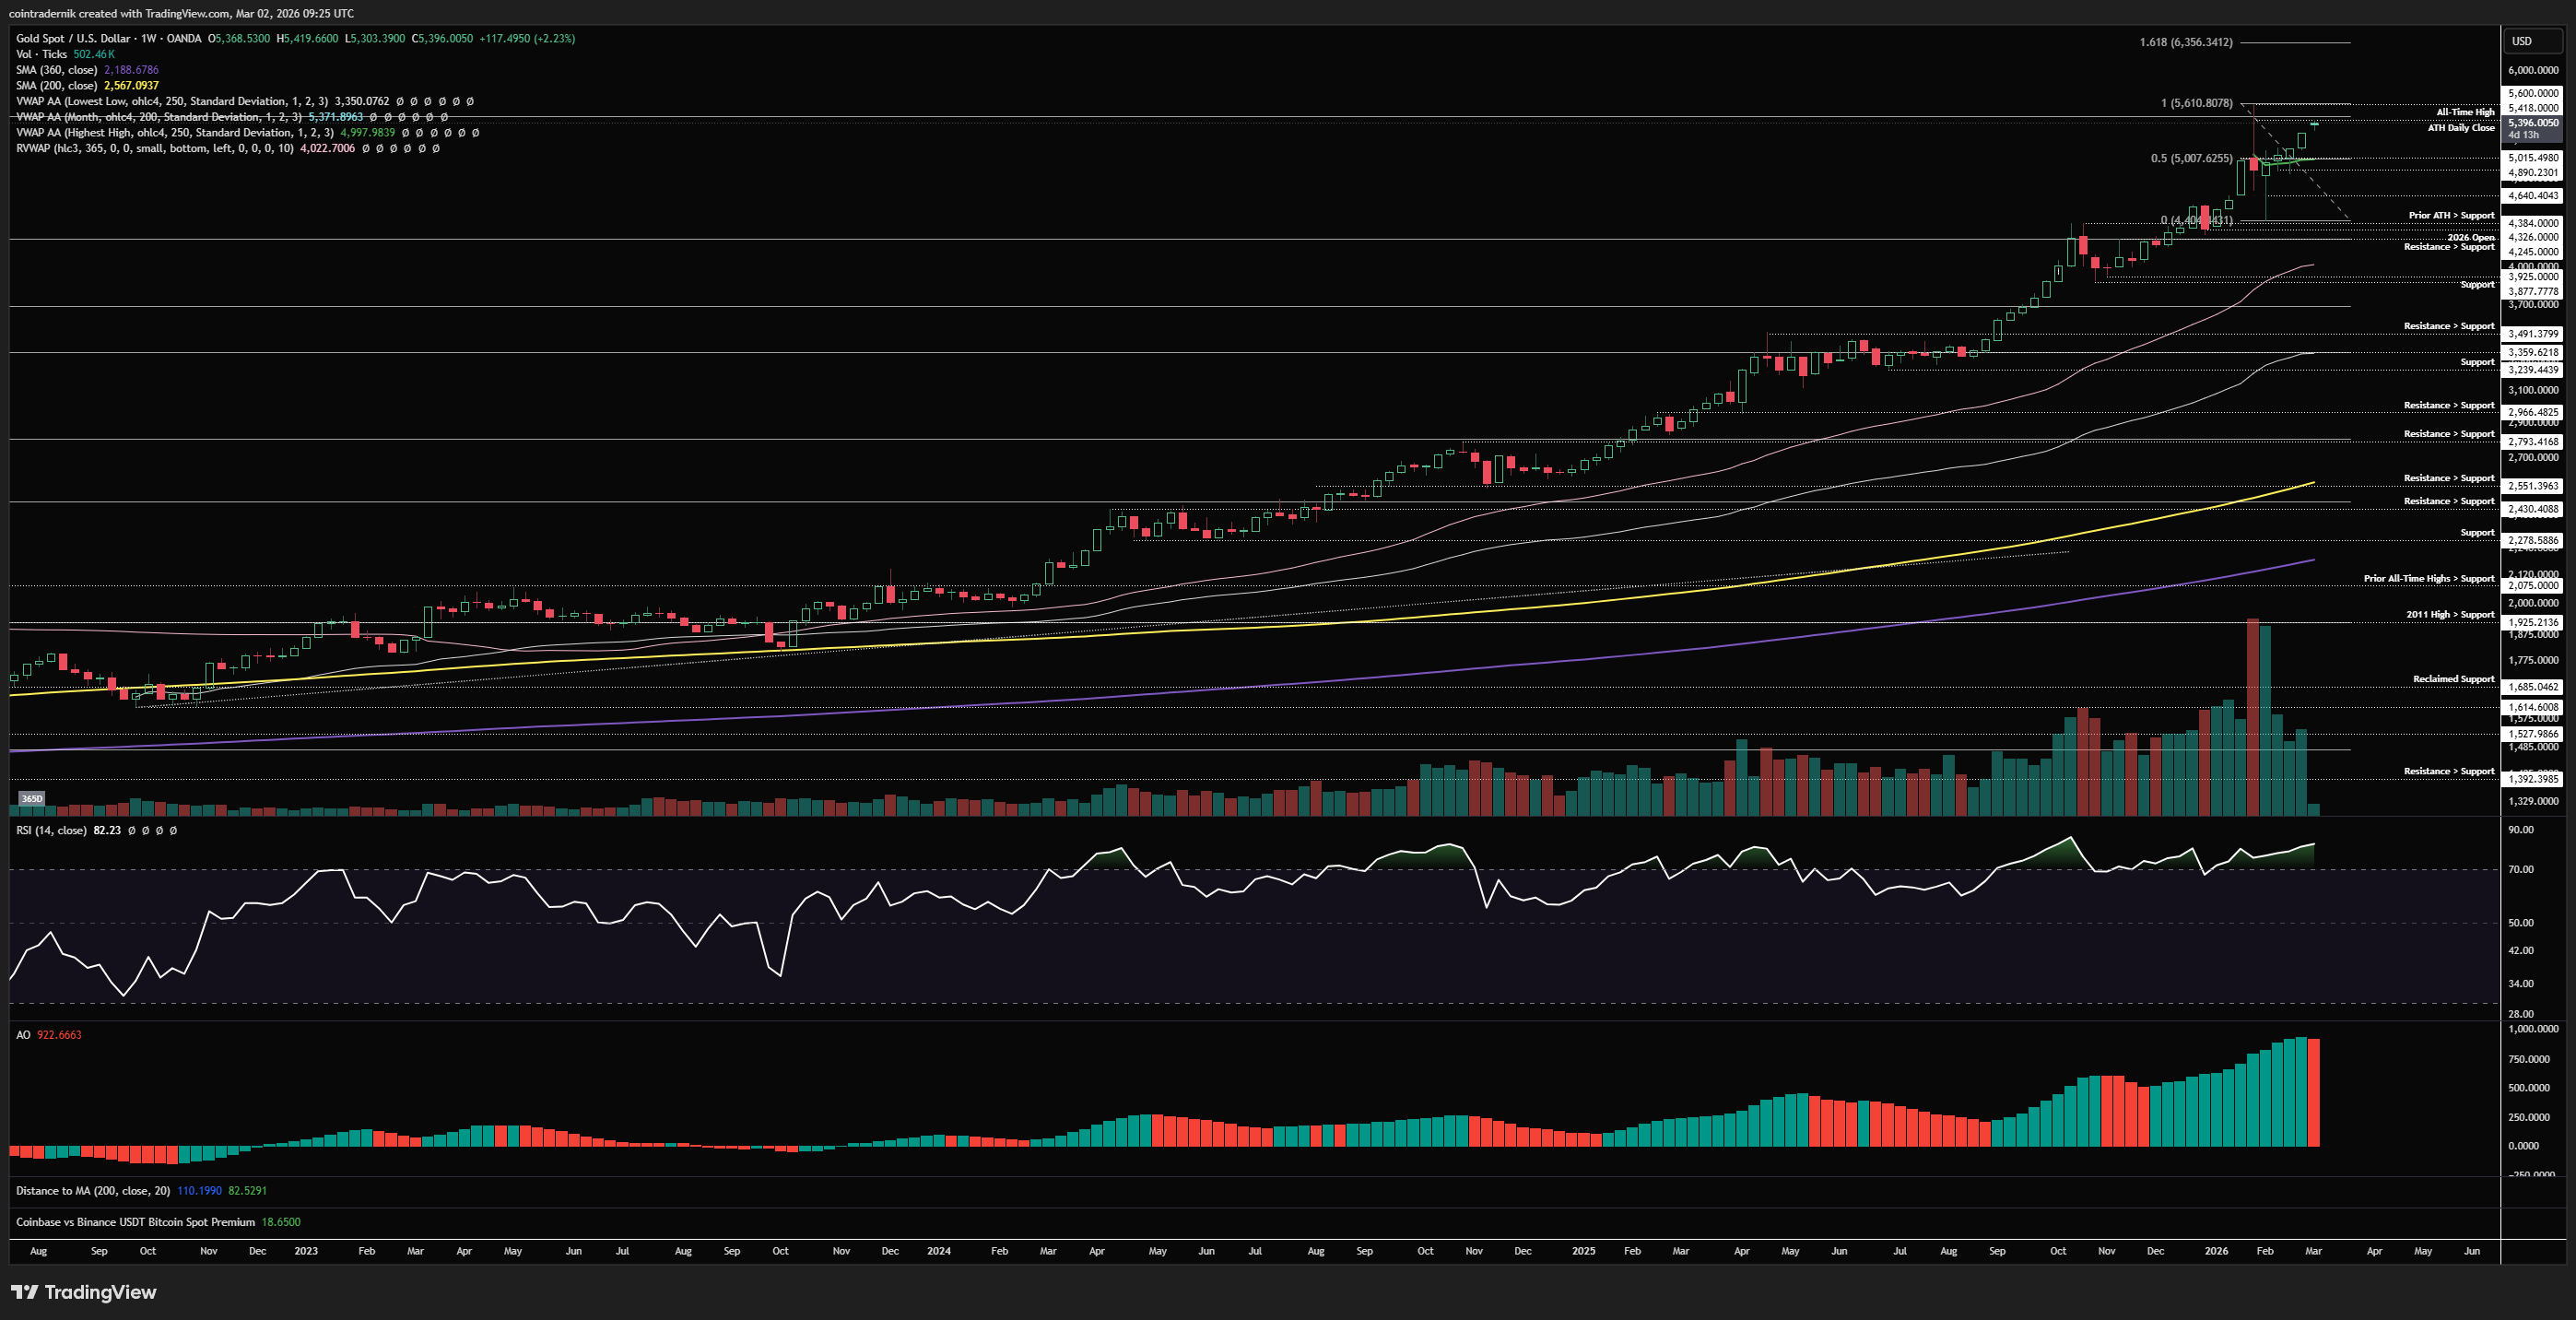
Beginning with the weekly for Gold, we can see that following that massive capitulation event that saw price trade from $5600 into $4384 in the space of a few sessions, Gold recovered well, consolidating right around the anchored VWAP from all-time highs around $5000 for a couple of weeks before accepting back above that level, then continuing higher last week and gapping higher this week, now sat right below the all-time high daily close at $5418, which is the last level of defense for a lower-high formation in my view before price just rips back to the ATH. Obviously, a marginal new high and subsequent rejection would still be bearish, but $5418 really is the only bit of technical resistance left standing before that $5600 gets retested, in my view. If we do reject here below $5418, I would be looking for aggressive shorts back towards $5000 to retest the anchored VWAP from all-time highs as support, below which obviously the picture is much more bleak for the mid-term performance of Gold. If we did get back below $5000 over coming weeks, I think Gold is likely cooked for several months with $5600 holding as the high and price just chopping around for much of the rest of the year, which was my initial expectation in my 2026 Outlook. If, instead we reject here, but then mark out a higher-low above $5000, it looks good for another breakout and thus another leg higher towards $6350 as the next fib level of interest. Naturally, if we do not reject here this week and close above $5418, I do think it is more probable that we continue higher rather than reject at $5600 as the technicals will look very bullish into that high, but we can judge it better as price-action develops. Do not be chasing Gold longs right up here, however.
Daily:
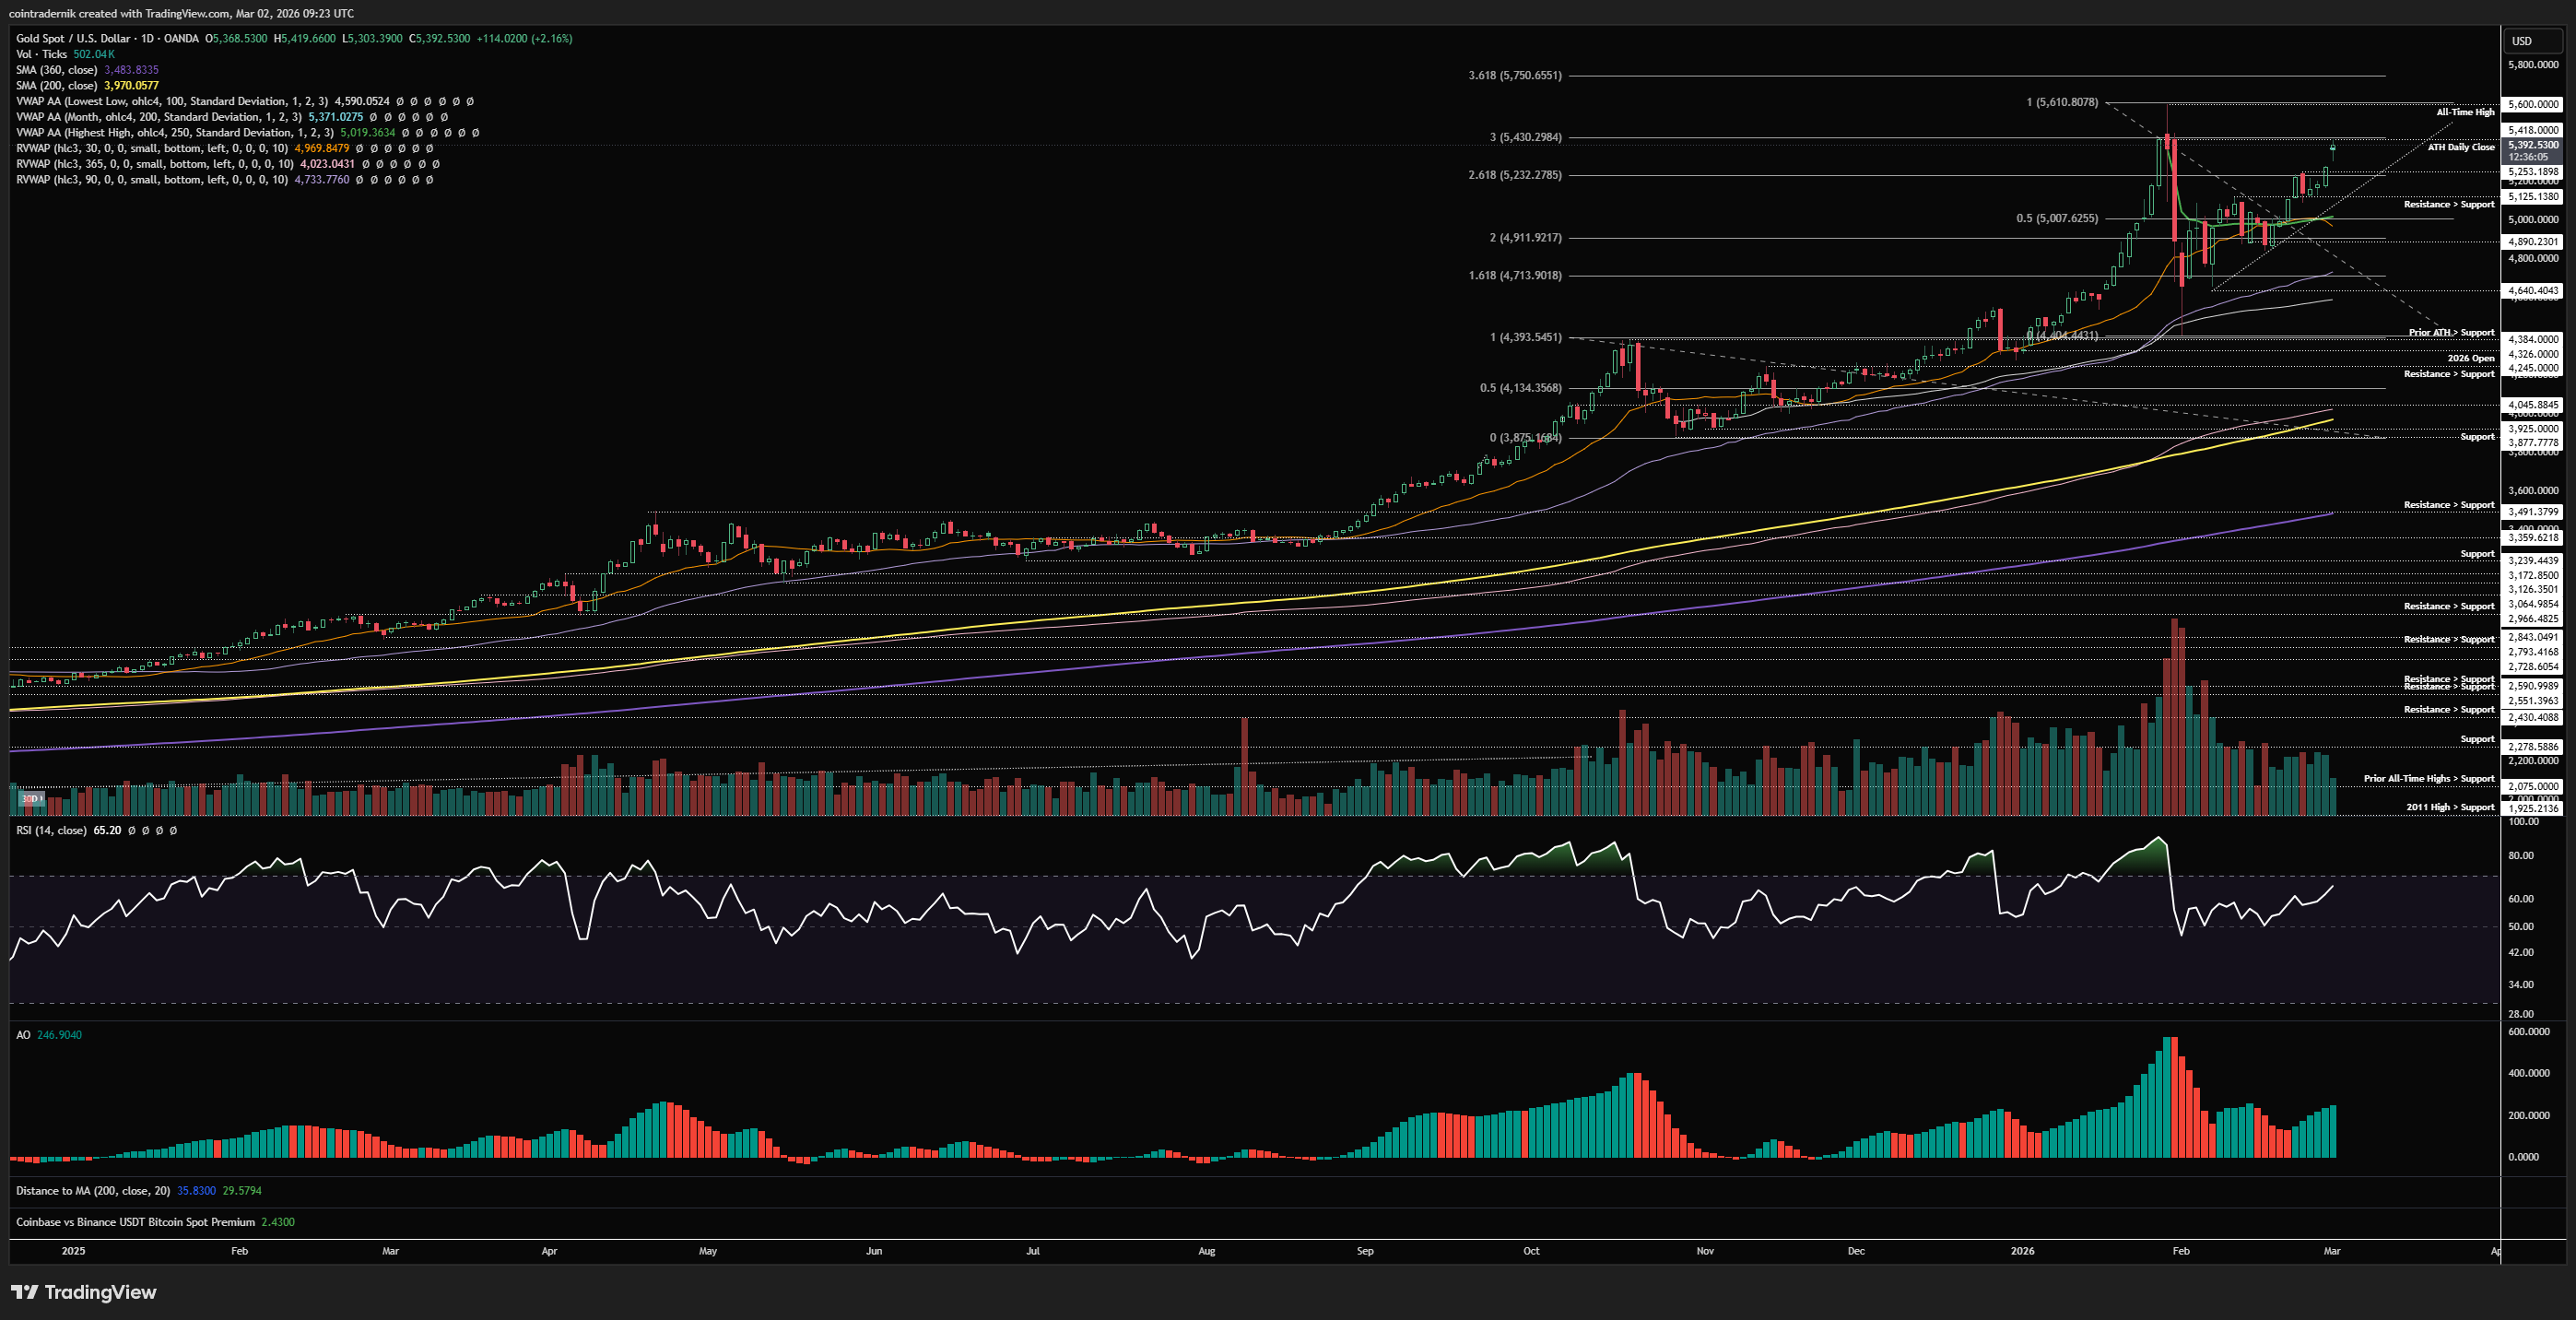
Finally, dropping into the daily, we can see that daily structure is bullish and momentum is recovering, and price is now within touching distance of that all-time high daily close, which was such a pivotal level for the sharp reversal. This is exactly where you would expect sellers to step in if we are not going for a full v-reversal and continuation of the trend higher; if they can't cap it here, Gold keeps running, with $5750 as minor overhead resistance but the $6000 level and $6350 beyond that the major targets (and I would be unequivocally wrong on my Gold view for H1 2026). Regardless of whether I am right or wrong on that broader view, I will be looking for shorts to set up near $5420 early this week with tight invalidation and then adding if and when price breaks down from there. Conversely, if we flip $5420 into support and keep pushing towards the high, I will start looking for areas where late longs get trapped, puke, and look to buy their blood a little later down the line.
I hope you've found some value in the read this week - please RT, share, engage etc. if so!
And if you've not already signed up for Ostium, please do so and test out some of the recent updates, including:
Sign up here (you don't have to use my ref link, of course): https://ostium.app/trade?from=CL&to=USD&ref=CTNIK

.avif)