

Market Outlook #74 - Kimchi Premium
February 23, 2026
-
12
min read


This blog references an opinion and is for entertainment and informational purposes only. It is not intended to be investment advice. Seek a duly licensed professional for investment advice.
In this special Kimchi Premium edition of the 74th Market Outlook here at Ostium Insights, we'll be taking a look at the week ahead in markets, looking at price-action, positioning and event risk for EWY, USDKRW, NVDA, Copper and Silver.
Now, let's take a look at the relatively quiet week ahead on the data front, albeit with NVDA Earnings likely to dominate on Wednesday:
MONDAY: FED'S WALLER SPEECH
MONDAY: US FACTORY ORDERS (MOM) (DEC): (CONSENSUS 1.1% VS PREVIOUS 2.7%)
MONDAY: ECB PRESIDENT LAGARDE SPEECH
TUESDAY: VARIOUS FED SPEECHES
WEDNESDAY: PRESIDENT TRUMP SPEECH
WEDNESDAY: NVIDIA EARNINGS
THURSDAY: US INITIAL JOBLESS CLAIMS: (CONSENSUS 211K VS PREVIOUS 206K)
THURSDAY: FED'S BOWMAN SPEECH
THURSDAY: ECB PRESIDENT LAGARDE SPEECH
FRIDAY: US PRODUCER PRICE INDEX EX FOOD & ENERGY (YOY) (JAN): (CONSENSUS N/A VS PREVIOUS 3.3%)
FRIDAY: US CHICAGO PMI (FEB): (CONSENSUS 52.6 VS PREVIOUS 54)
Now, let's dig into asset-specific price-action for the week ahead, looking firstly at EWY:
Price: $141.88
Weekly:
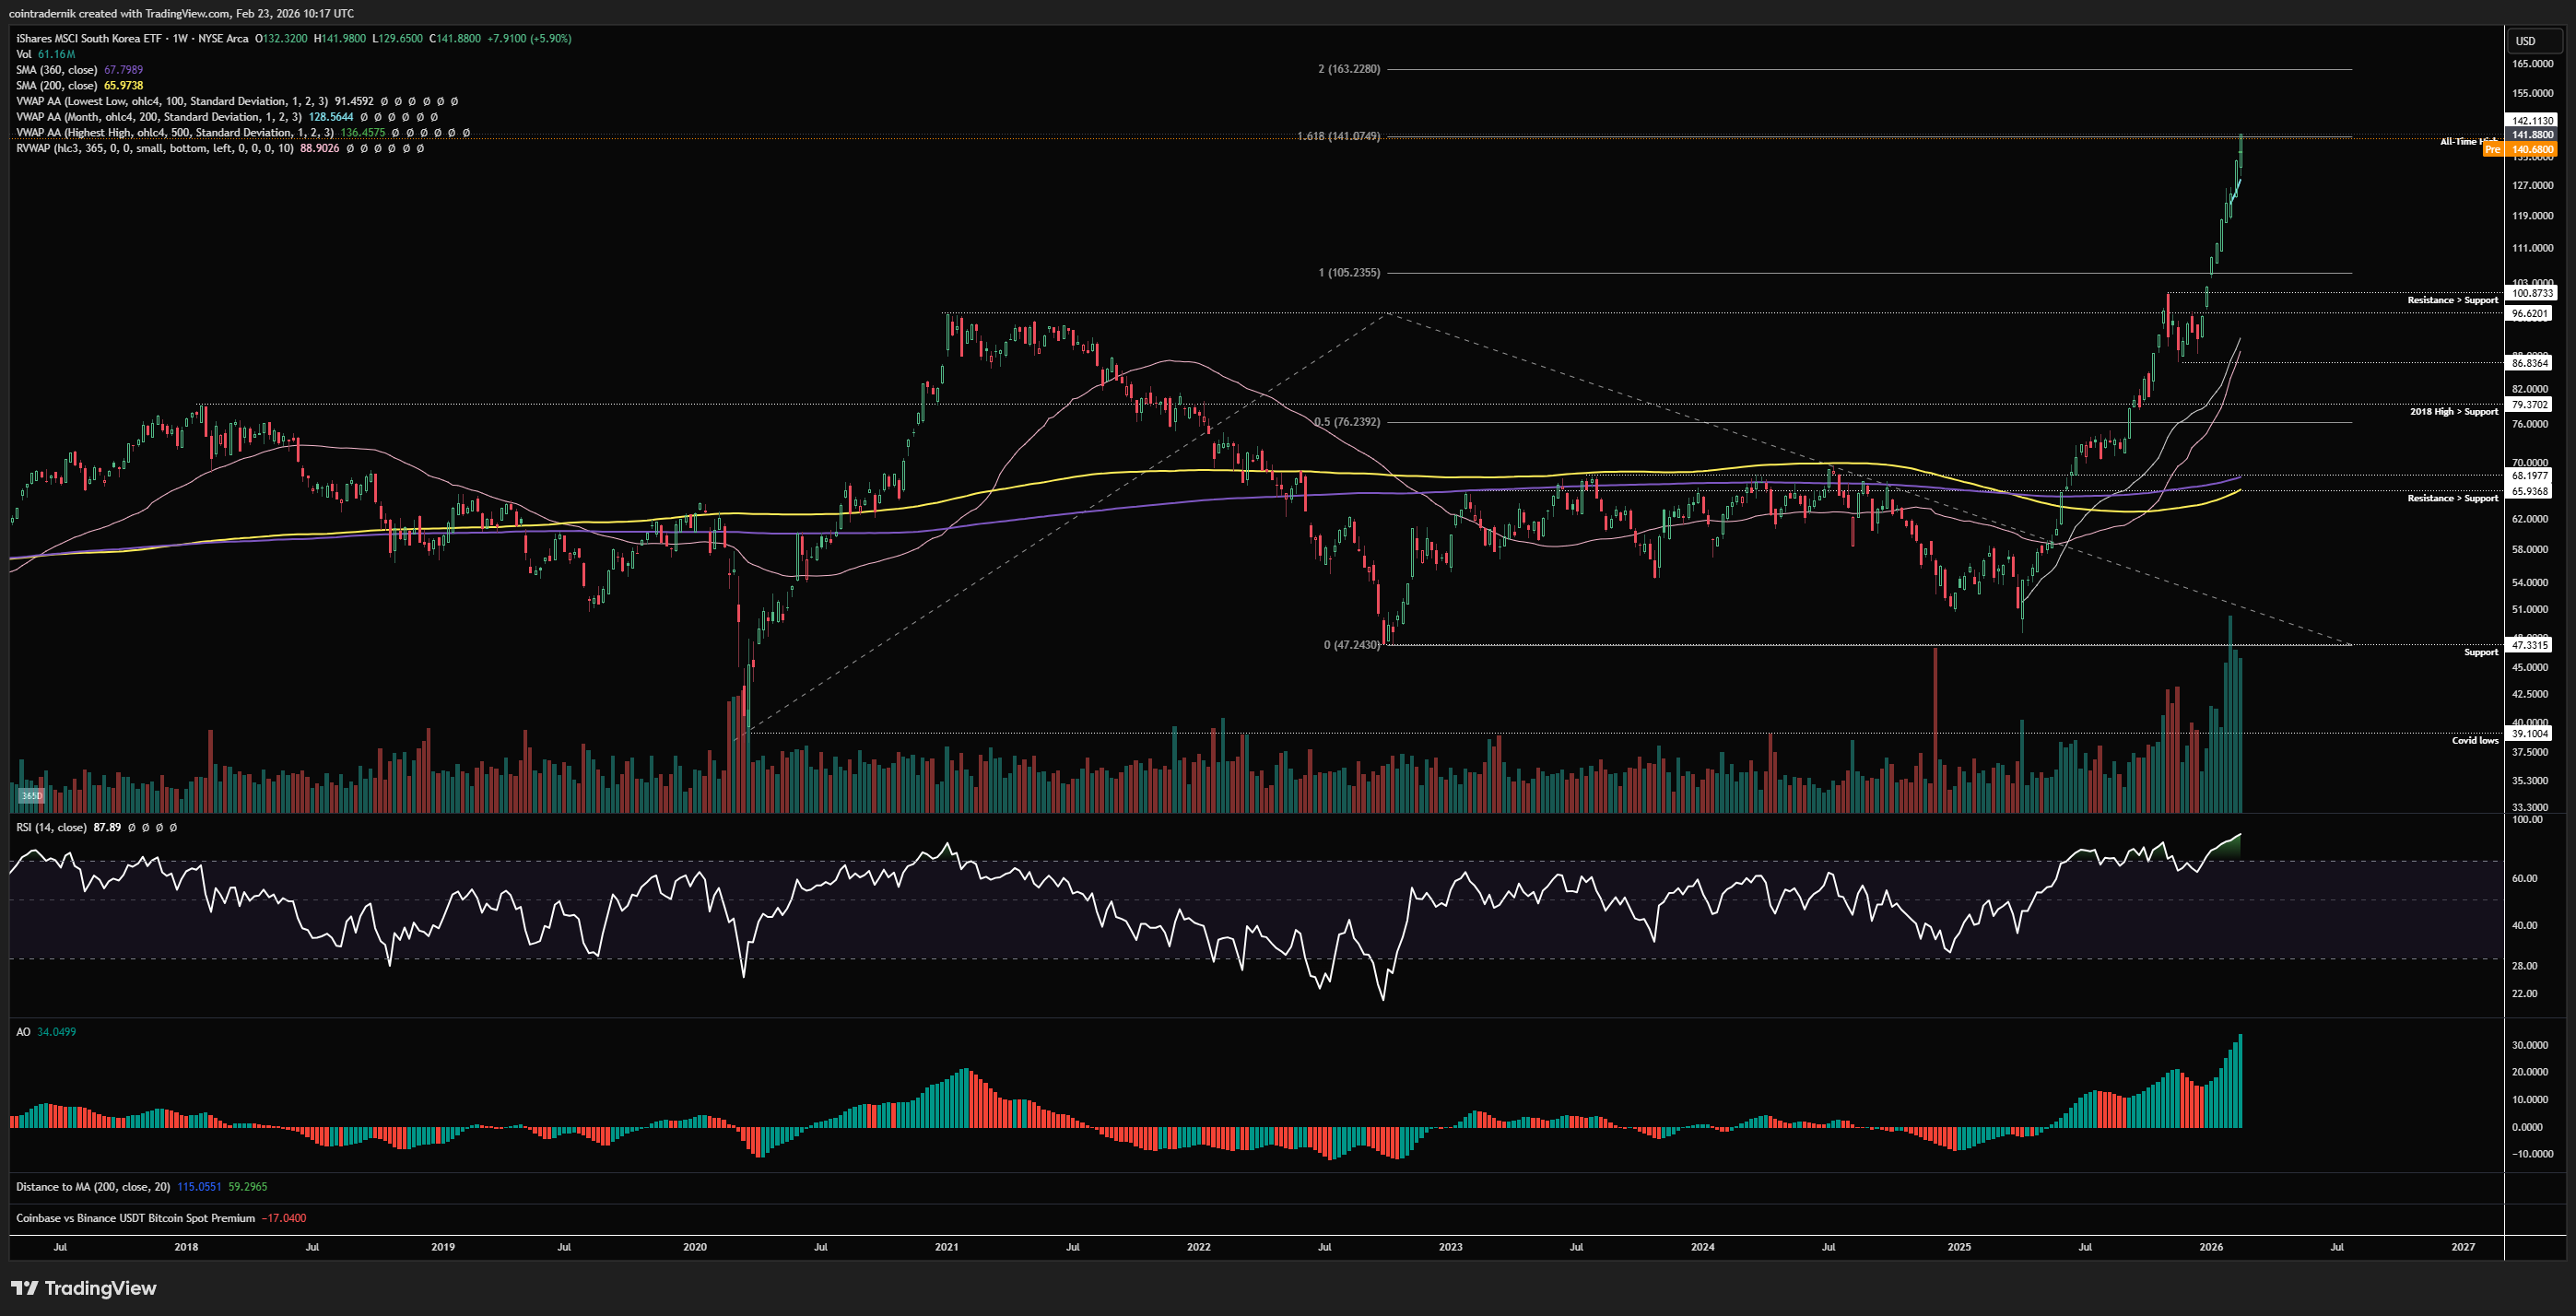
Beginning with the weekly for South Korea's equity index (here represented by the EWY ETF), we can see just how insane the trend has been off the April 2025 tariff lows, with EWY rallying from ~$48 to $142 as of last week's fresh all-time high in the space of ten months. In that time, the index has only seen one major pull-back, from $100 to $87 in Q4 2025, then continuing through the 2020 highs with a steeper leg higher into the 1.618 fib extension of the multi-year bull market at $141 last week. Weekly momentum is still extremely strong, with no signs of exhaustion, but naturally given the historical extremes we are at it is poor R/R to be looking for fresh long exposure right here, in my view. Much like Silver in late January, we are in that spot where the momentum is so strong that it is highly probable we see continued upside, but we are in effect so parabolic that the candles appear as though they could go backwards in time. Looking ahead, if we push above last week's all-time high, the next overhead target would be the 200% extension at $163.
Daily:
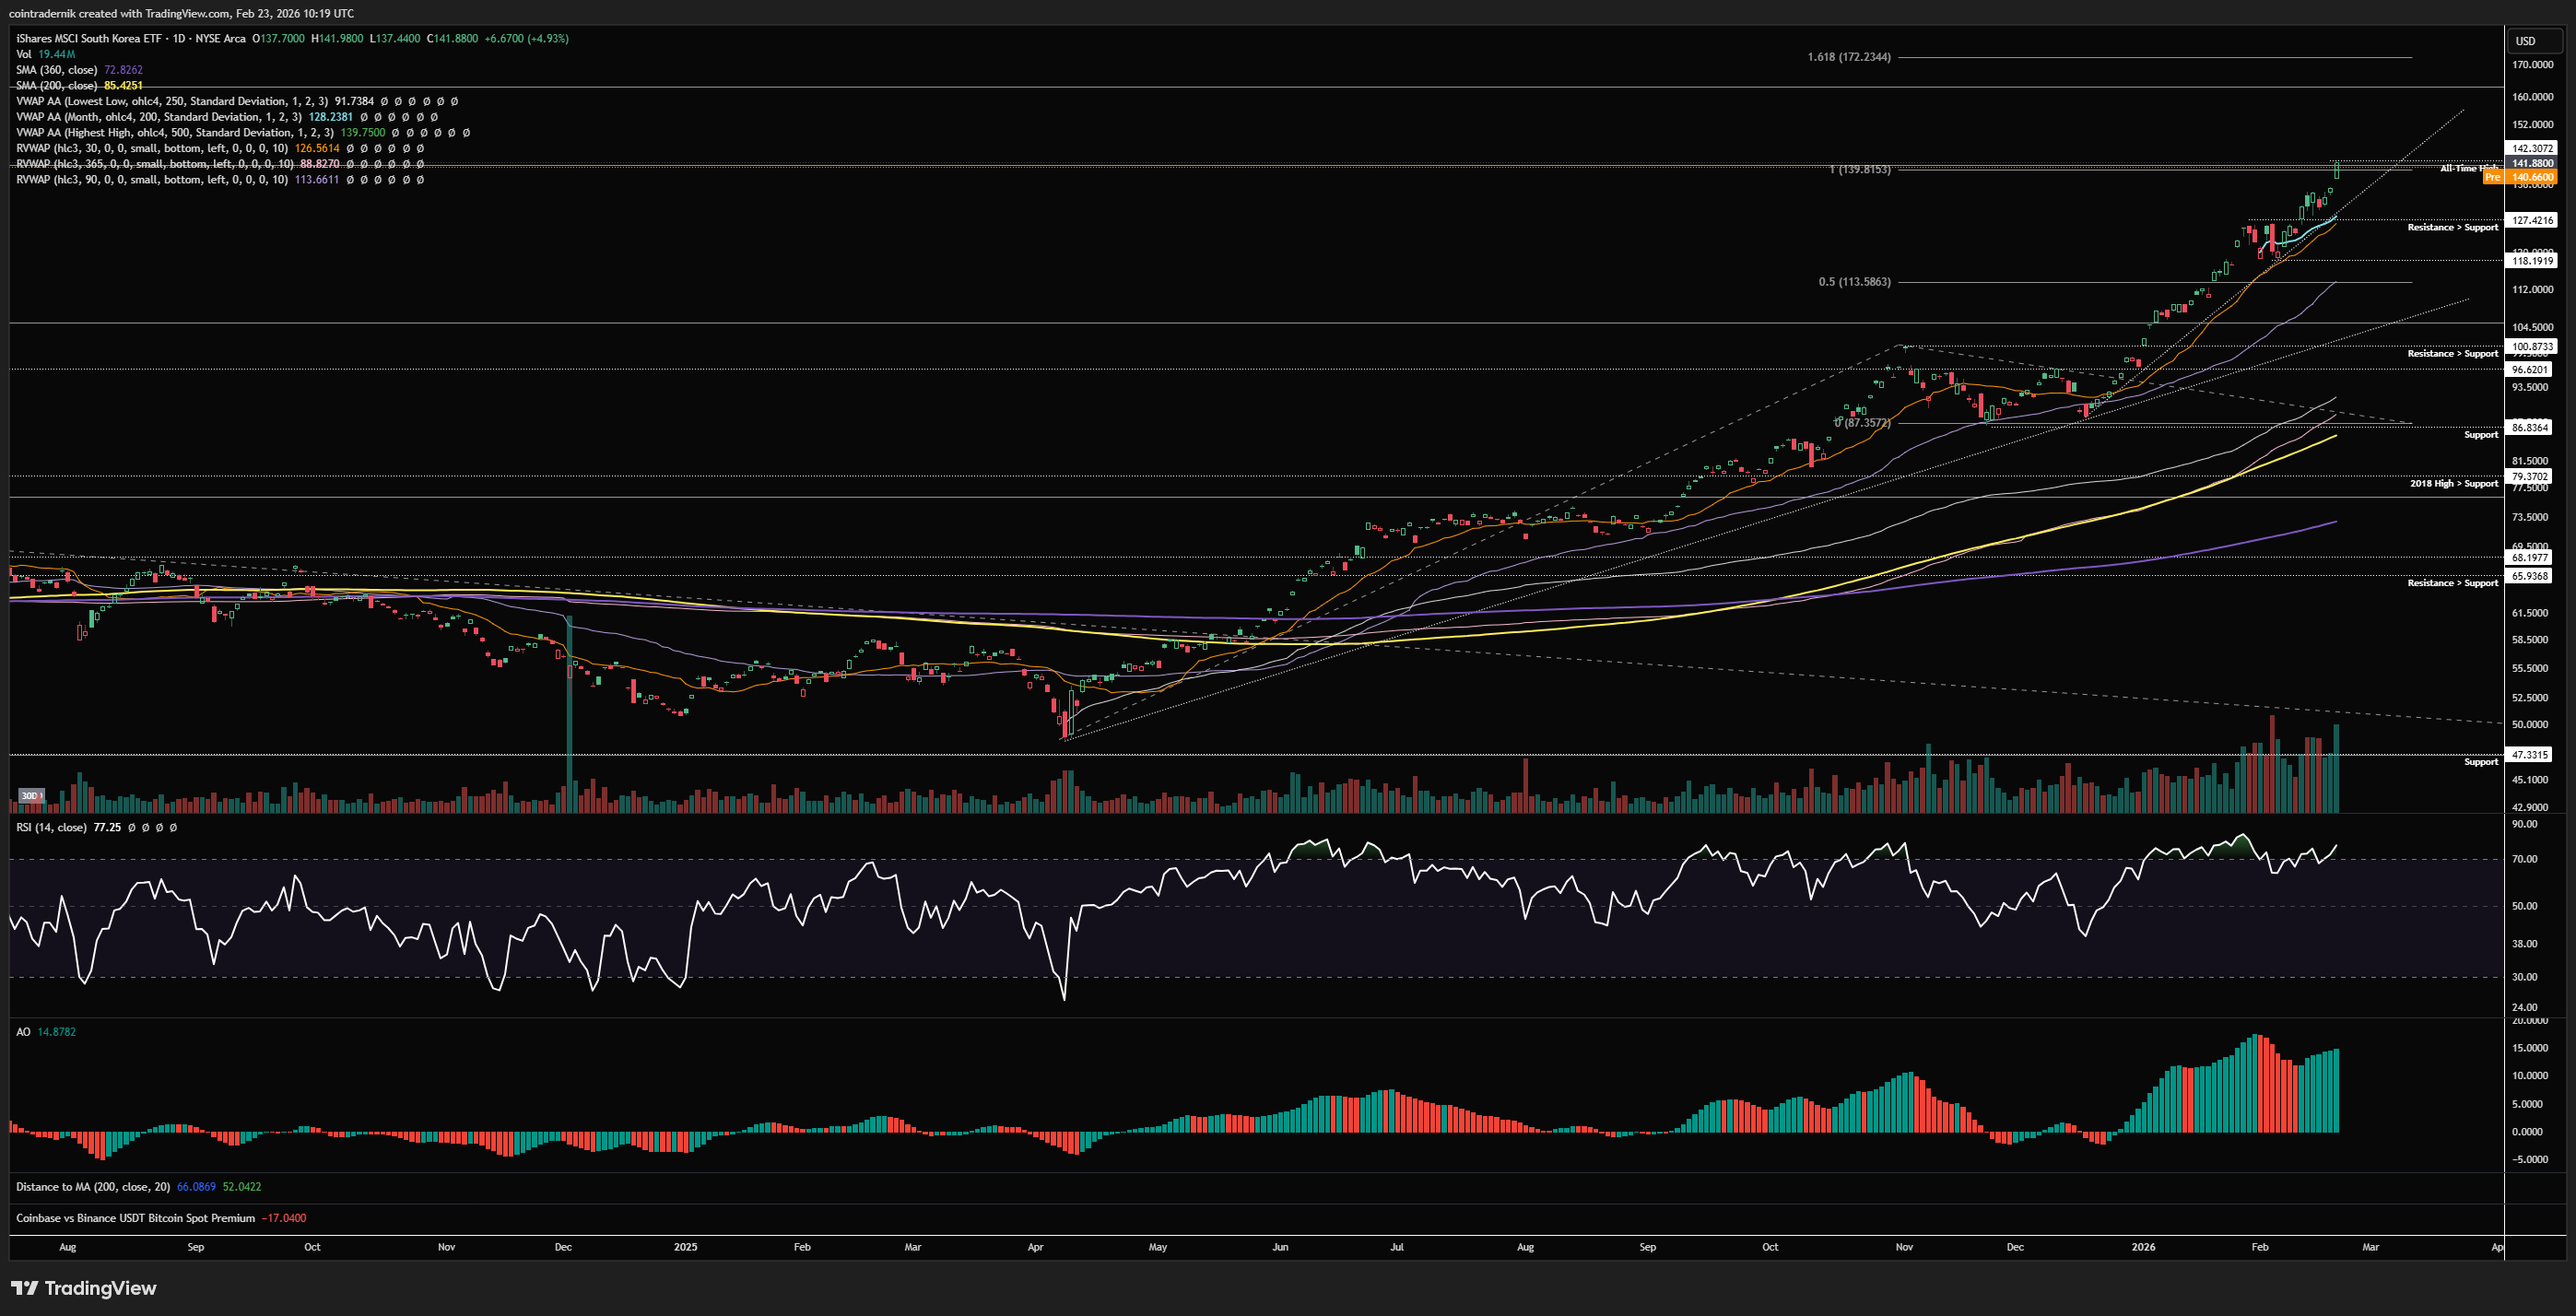
Dropping into the daily, we can see the structure a little more clearly here, with that first leg from April into October 2025 hugging the 30d rolling VWAP for much of the trend and then extending into $100.87, before pulling back into the 90d rolling VWAP at $87, chopping sideways for a few weeks and then breaking higher again into year-end, with price beginning a steeper second leg higher in the New Year, which has taken it to that $142 level as of last week's close. We closed extremely strong on the week, with price also having reset daily momentum a touch on the minor pull-back from $127 to $118. This took the index back to the 30d rolling VWAP, again holding as strong support, with price then flipping $127 resistance into support above the Feb VWAP and running higher. We are now well above all key MAs, VWAPs etc. and above this level the next fib extension you'd be looking at is another 10-15% higher. If you were looking for a long opportunity with a tight invalidation, a pull-back into the trendline with invalidation on a daily close below the 30d rolling VWAP would be your best bet here. And, if you're wanting to fade this monster, I would be waiting for some sort of trend exhaustion on this timeframe or acceptance below that 30d rolling VWAP before even attempting it, else the most probable path is you get blown out.
Price: 1440.82
Weekly:
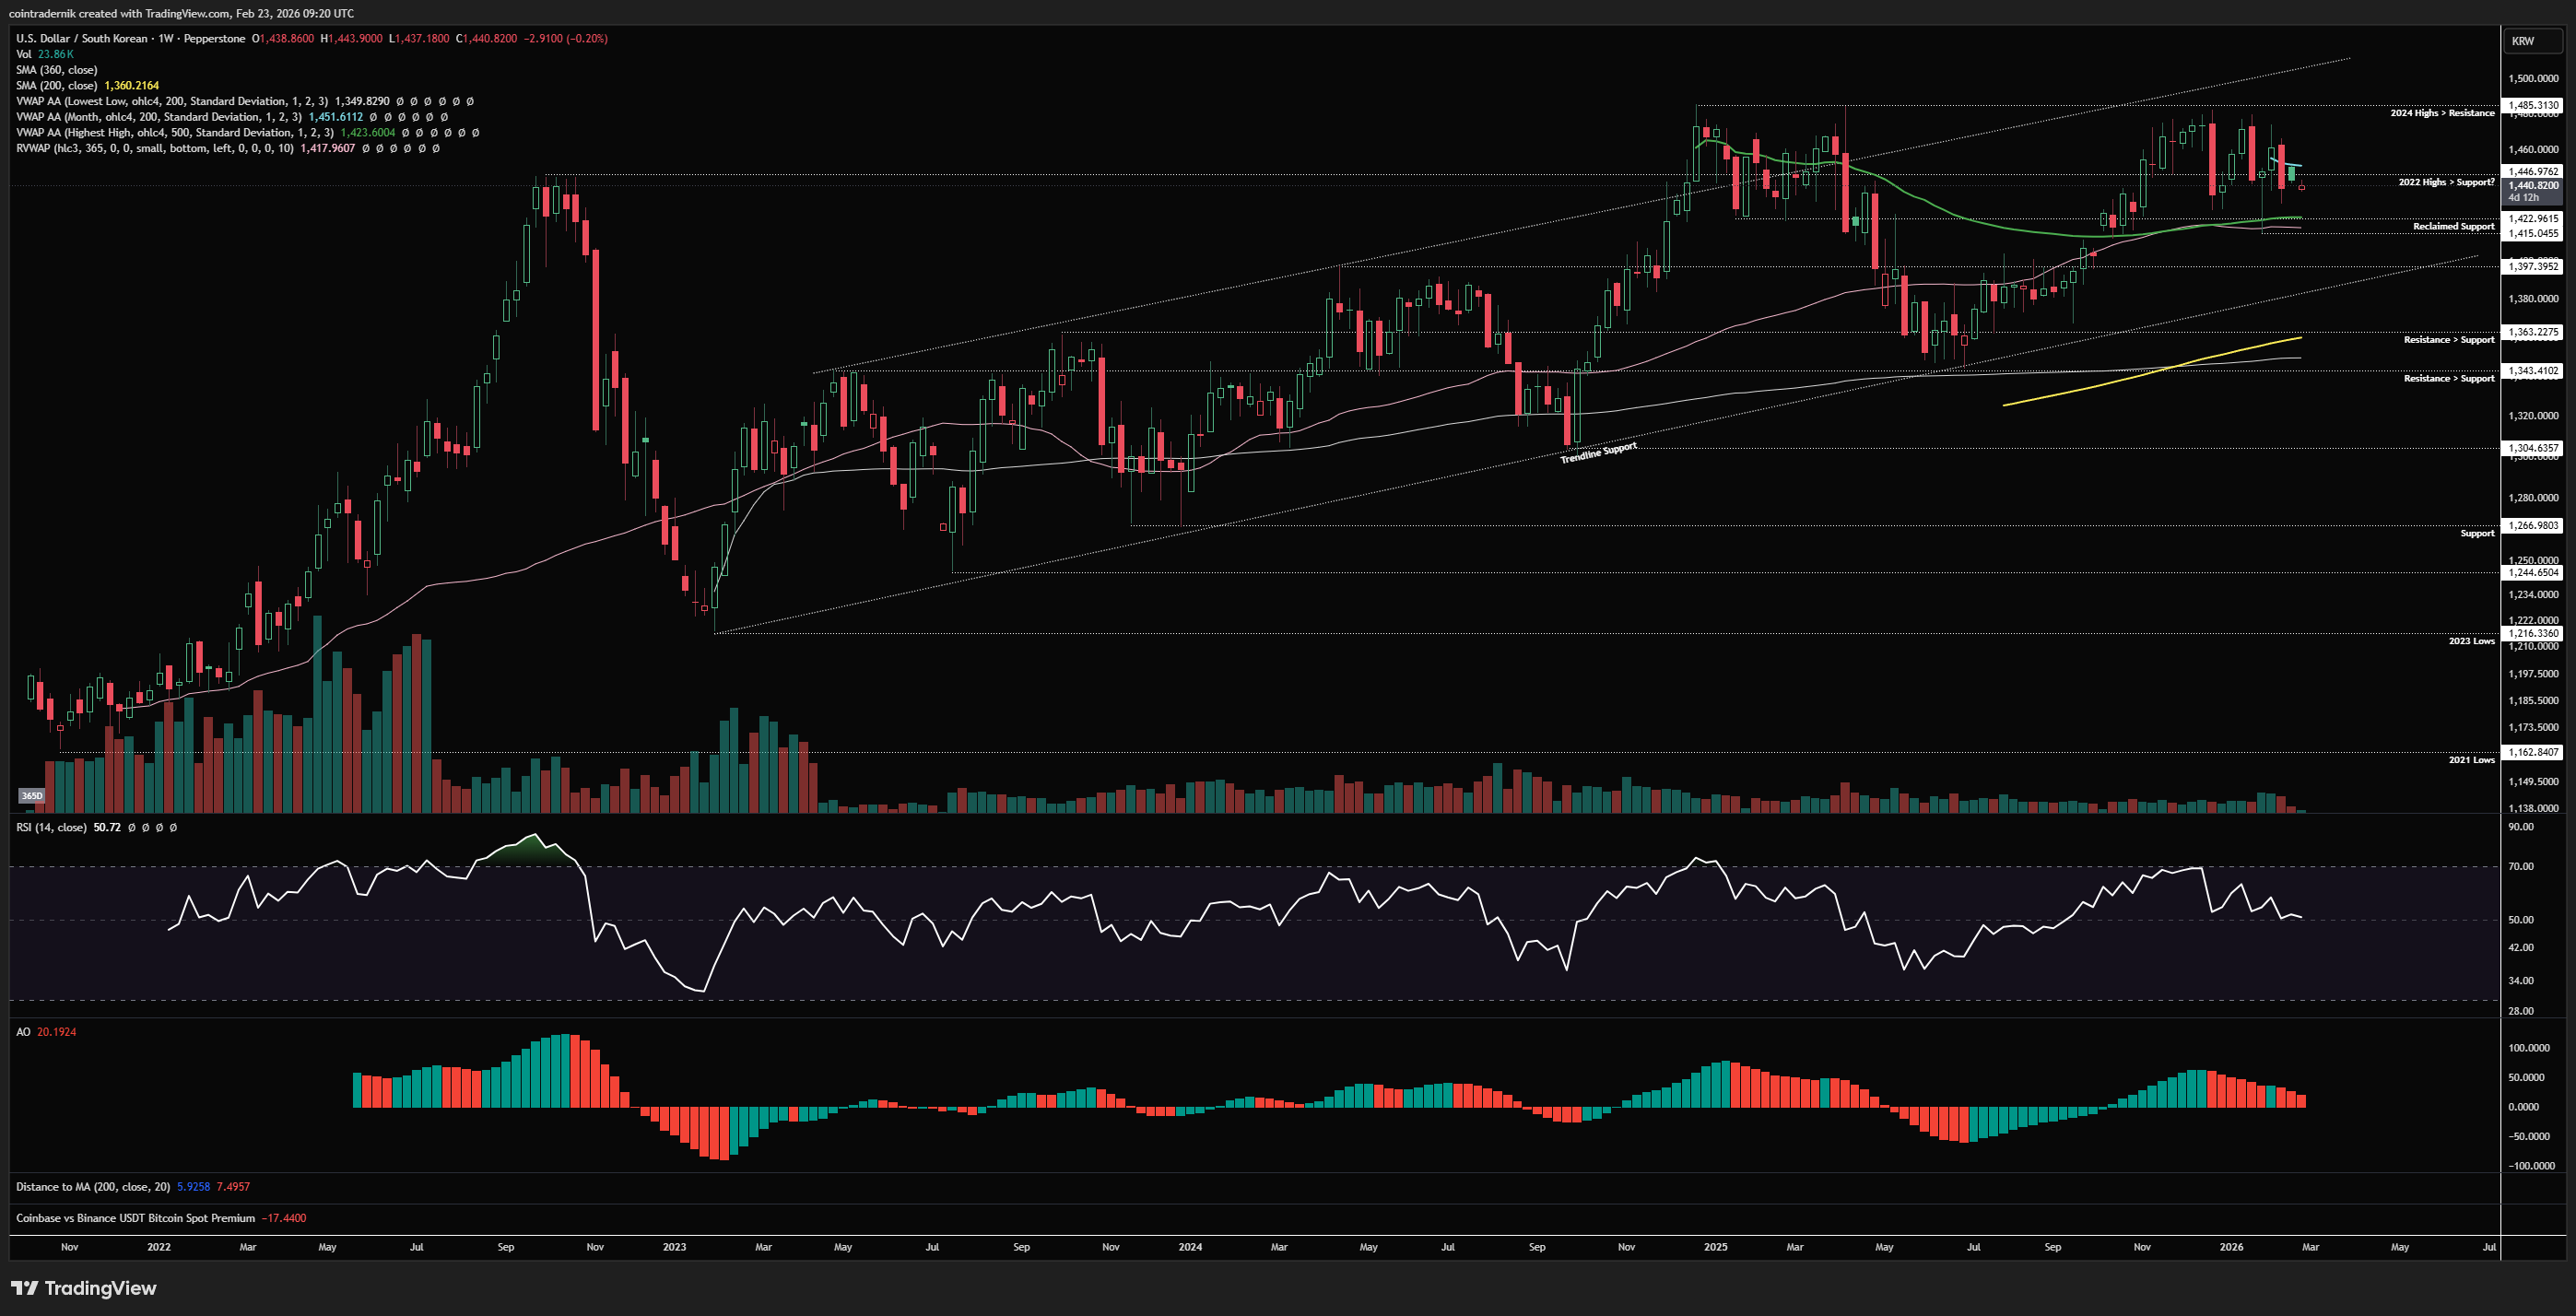
Looking firstly at the weekly for USDKRW, we can see that the pair has been in a pretty clear uptrend since Jan 2023, broadly capped by channel resistance and marking out lows at trendline support throughout that period, with late 2024 breaking above that channel, marking out a high at 1485 and then printing a double top, from which the pair returned to channel support at 1343. Since then, price has continued to trend higher but found resistance right at those 2024 highs all over again for the past few months, failing to even wick above them, with very choppy price-action between 1485 as range resistance and range support at 1415, which is confluent with the anchored VWAP from the 2024 high and the 365d rolling VWAP. Given we are right in the middle of the channel here but above key support, we could look for a long opportunity closer to 1422, with tight invalidation on a close below 1415, looking for a retest of 1485, with a view towards continuation towards channel resistance above 1500. If this is filled and then stopped, I would be more interested in another attempt at the bottom of the channel, but would want to see some more structure develop in that 1380-1390 area.
Daily:
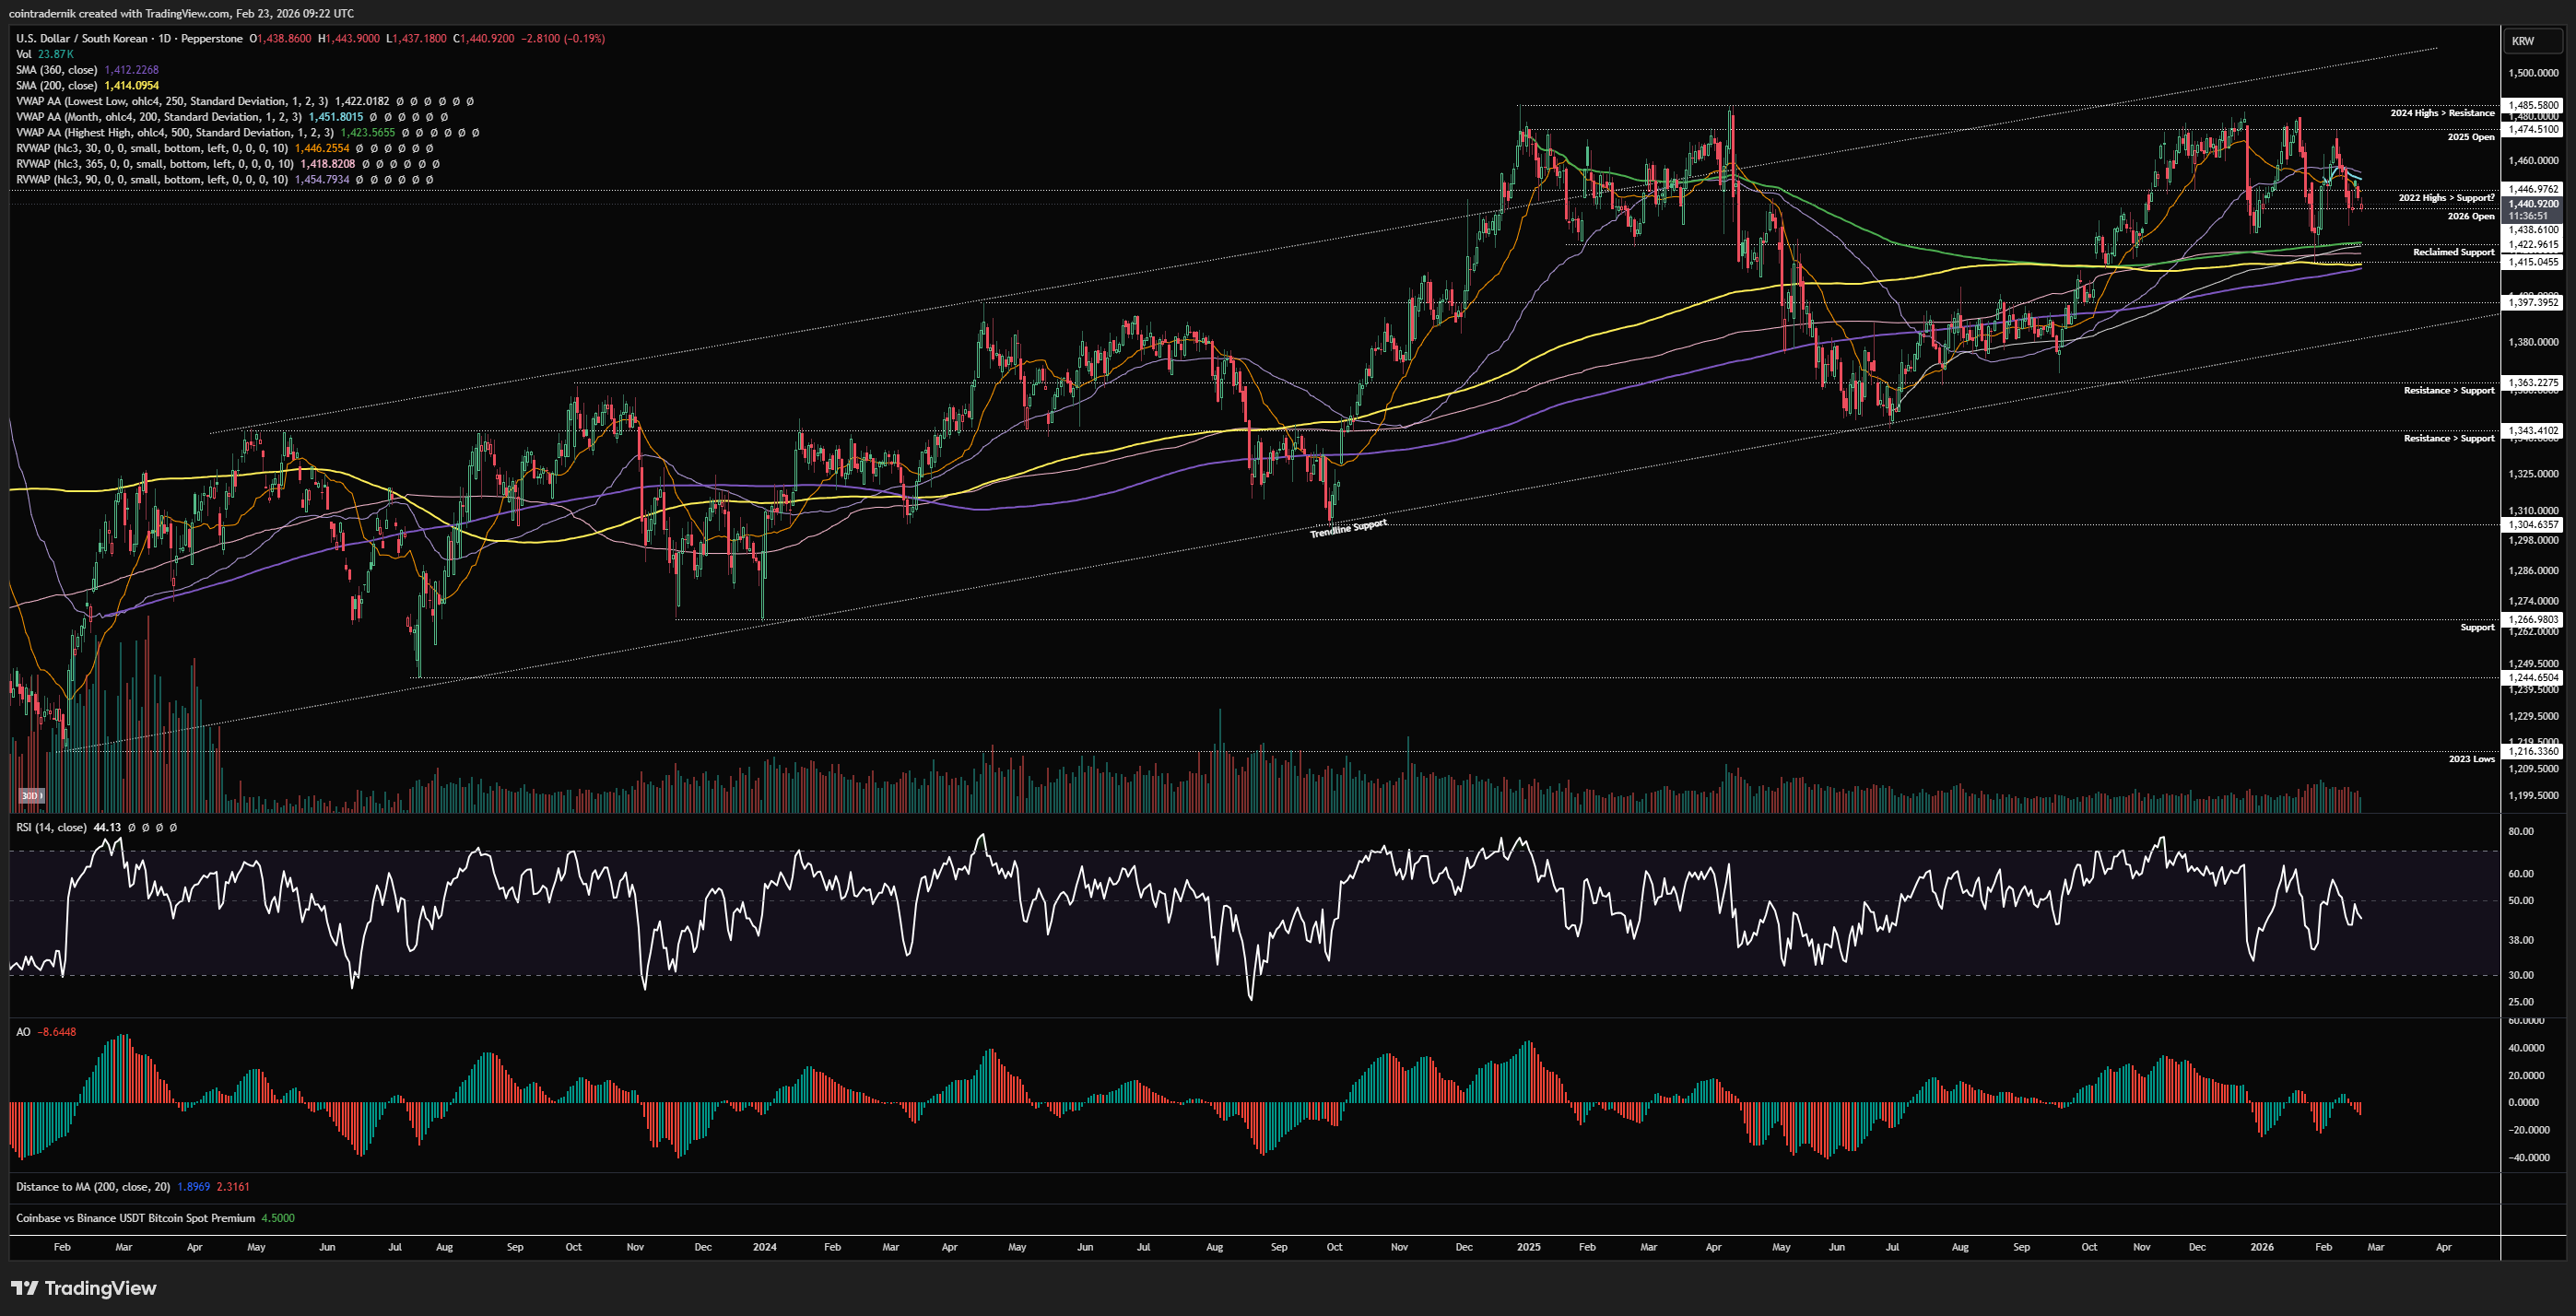
Turning to the daily, we can see just how choppy the price-action has been since December, with the 2025 open at 1474 acting as resistance on multiple attempts but price failing to break below that 2024-high anchored VWAP. We did have some momentum divergence into that more recent low, so if we do now mark out a higher-low here above 1422 and then break and close back above 1466, that would very much look like another test of overhead resistance is on the cards. I would not rush in right here, however, and if I don't get filled lower then I would look for the 90d rolling VWAP to be flipped at 1455 after this higher-low formation before getting involved. Whilst this is holding that 1415-1422 zone as support, we should expect continuation higher to follow.
Receive the latest updates directly to your inbox

Price: $189.82
Weekly:
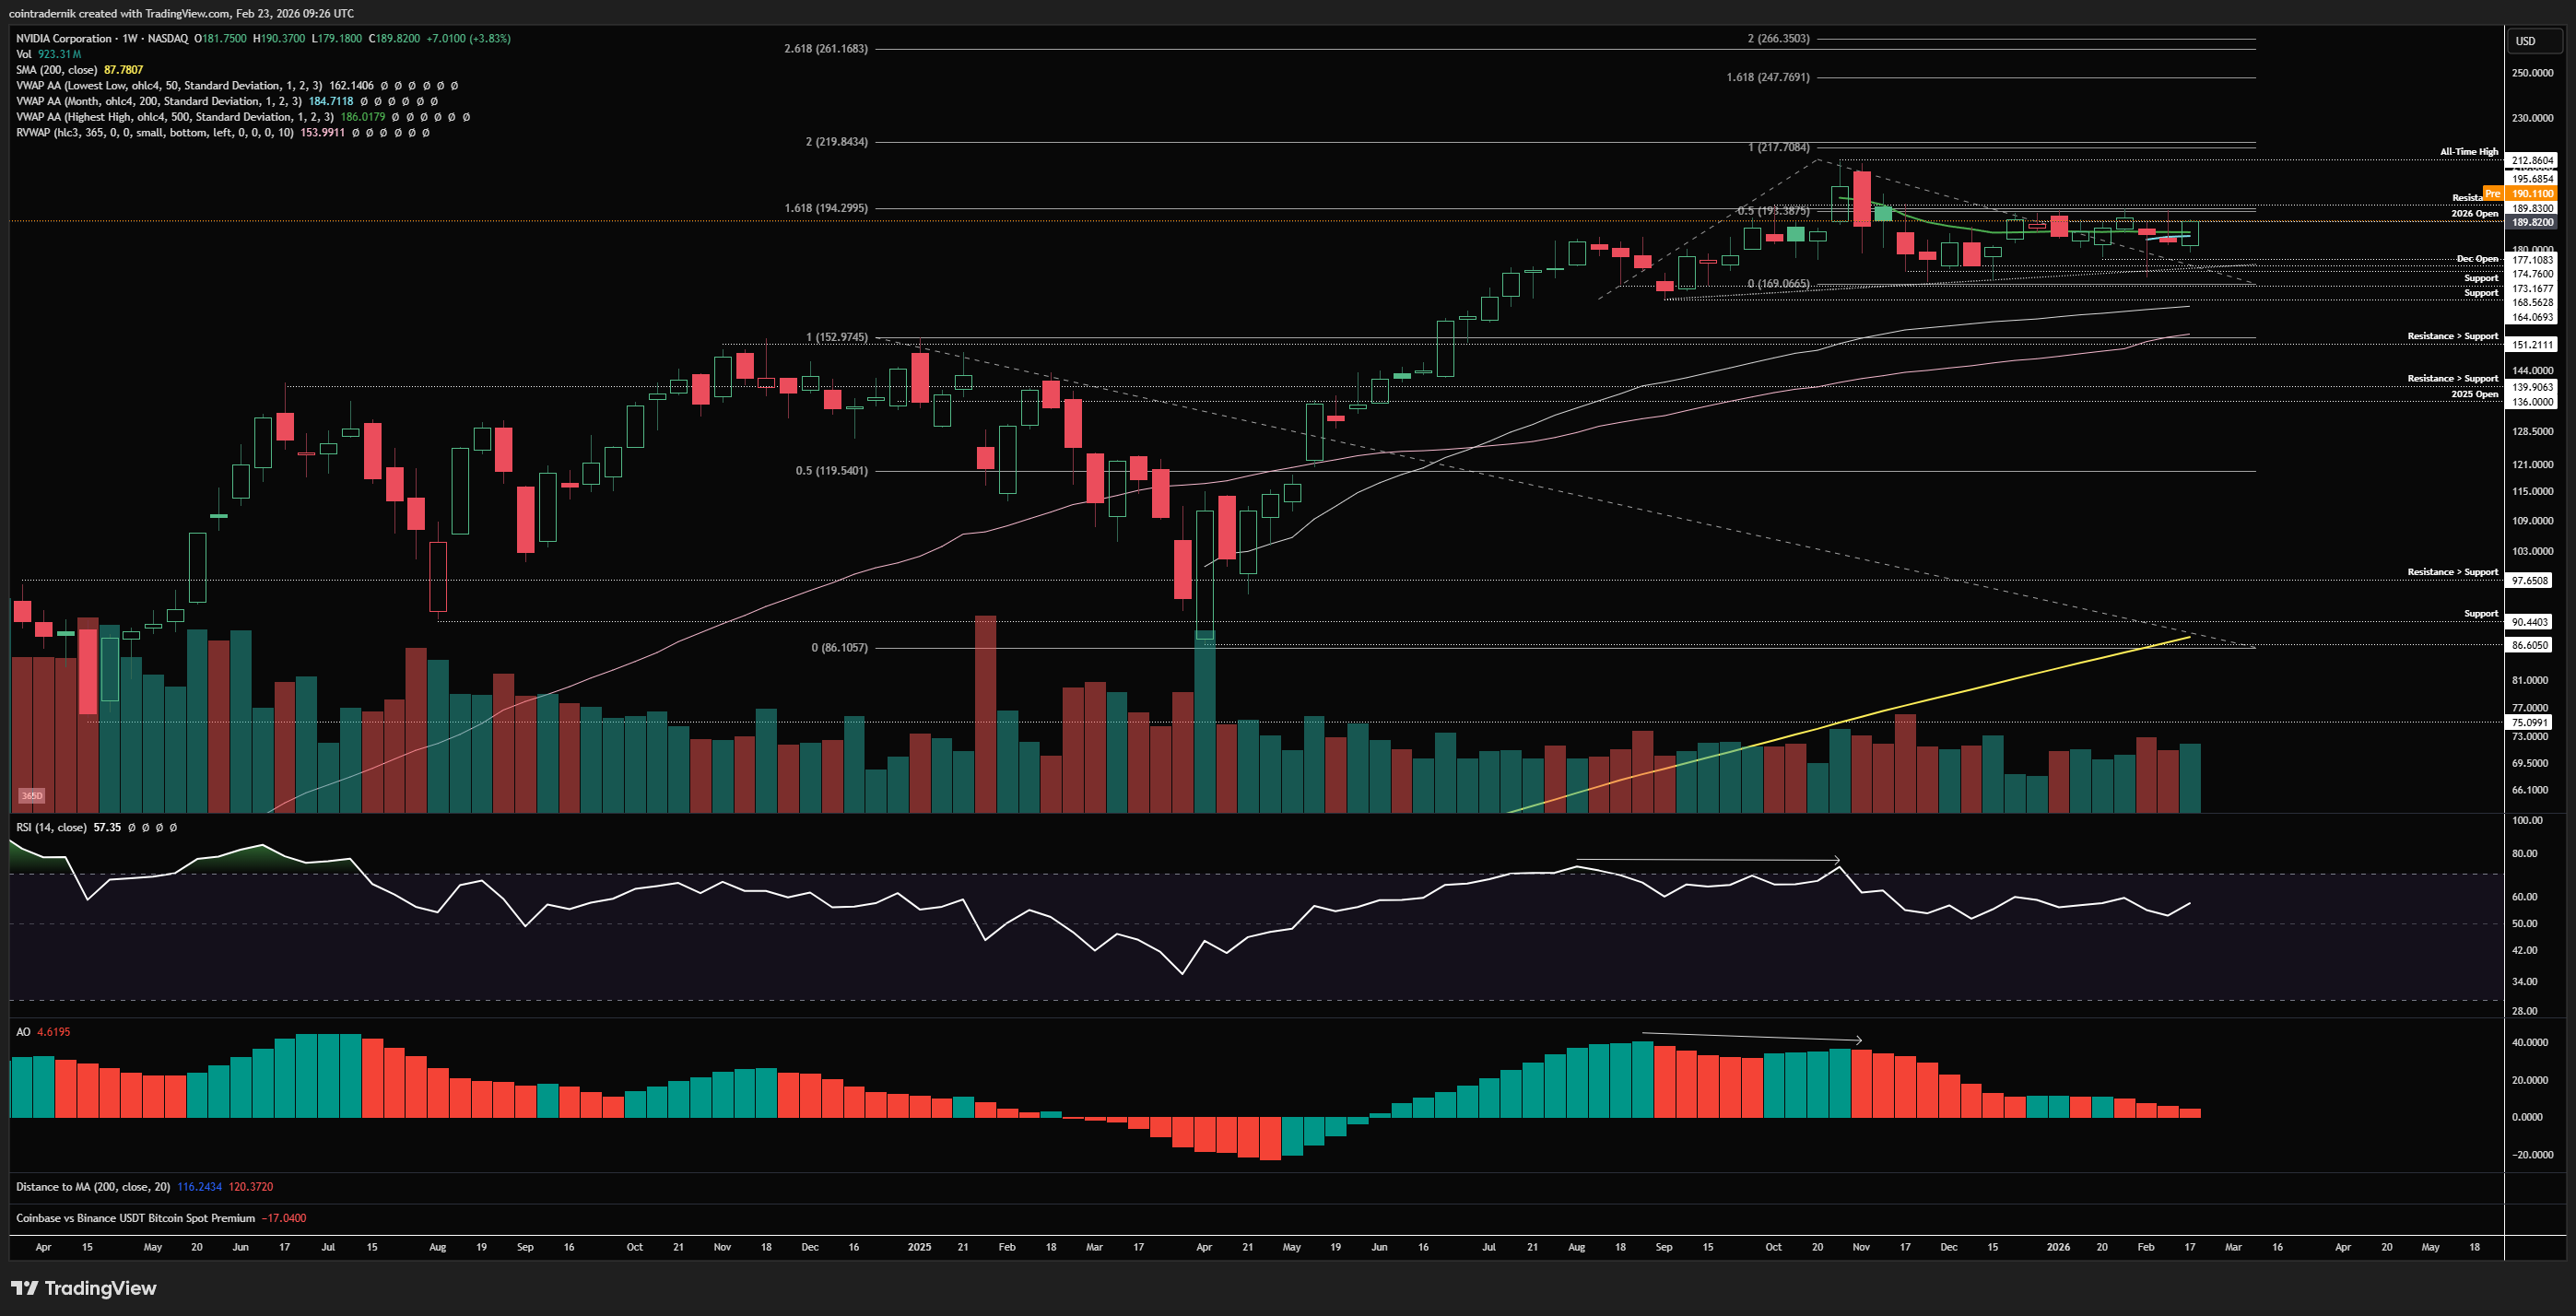
Looking firstly at NVDA on the weekly timeframe, we can see that price continues to chop around as it has done for months between support at $168 and resistance at $193, last week bouncing off the open above $177 to close the week right at the 2026 open ~$189.8. Weekly momentum has reset now, and weekly RSI is holding above 50, so if NVDA can break and close above $194 and turn that level into support, with earnings as the potential catalyst here, I think the next leg higher can begin, with all-time highs at $213 and then $260ish as the fib extension target beyond that. If, instead, we wick above $194 resistance and then Nvidia earnings lead to a rug pull, we could see the bottom end of this range finally break, with $162 as major support below - the anchored VWAP from the April 2025 lows. In that scenario, I would be looking at the 365d rolling VWAP at the 2024 highs ~$150 as the next area for a local low to form. Right now, we have that H&S pattern that everyone can see, plus extreme caution around US tech; if Nvidia earnings (and forward guidance) does not disappoint, many could be caught offsides here expecting this to roll over. Acceptance above $194 = the path to $260 imo.
Daily:
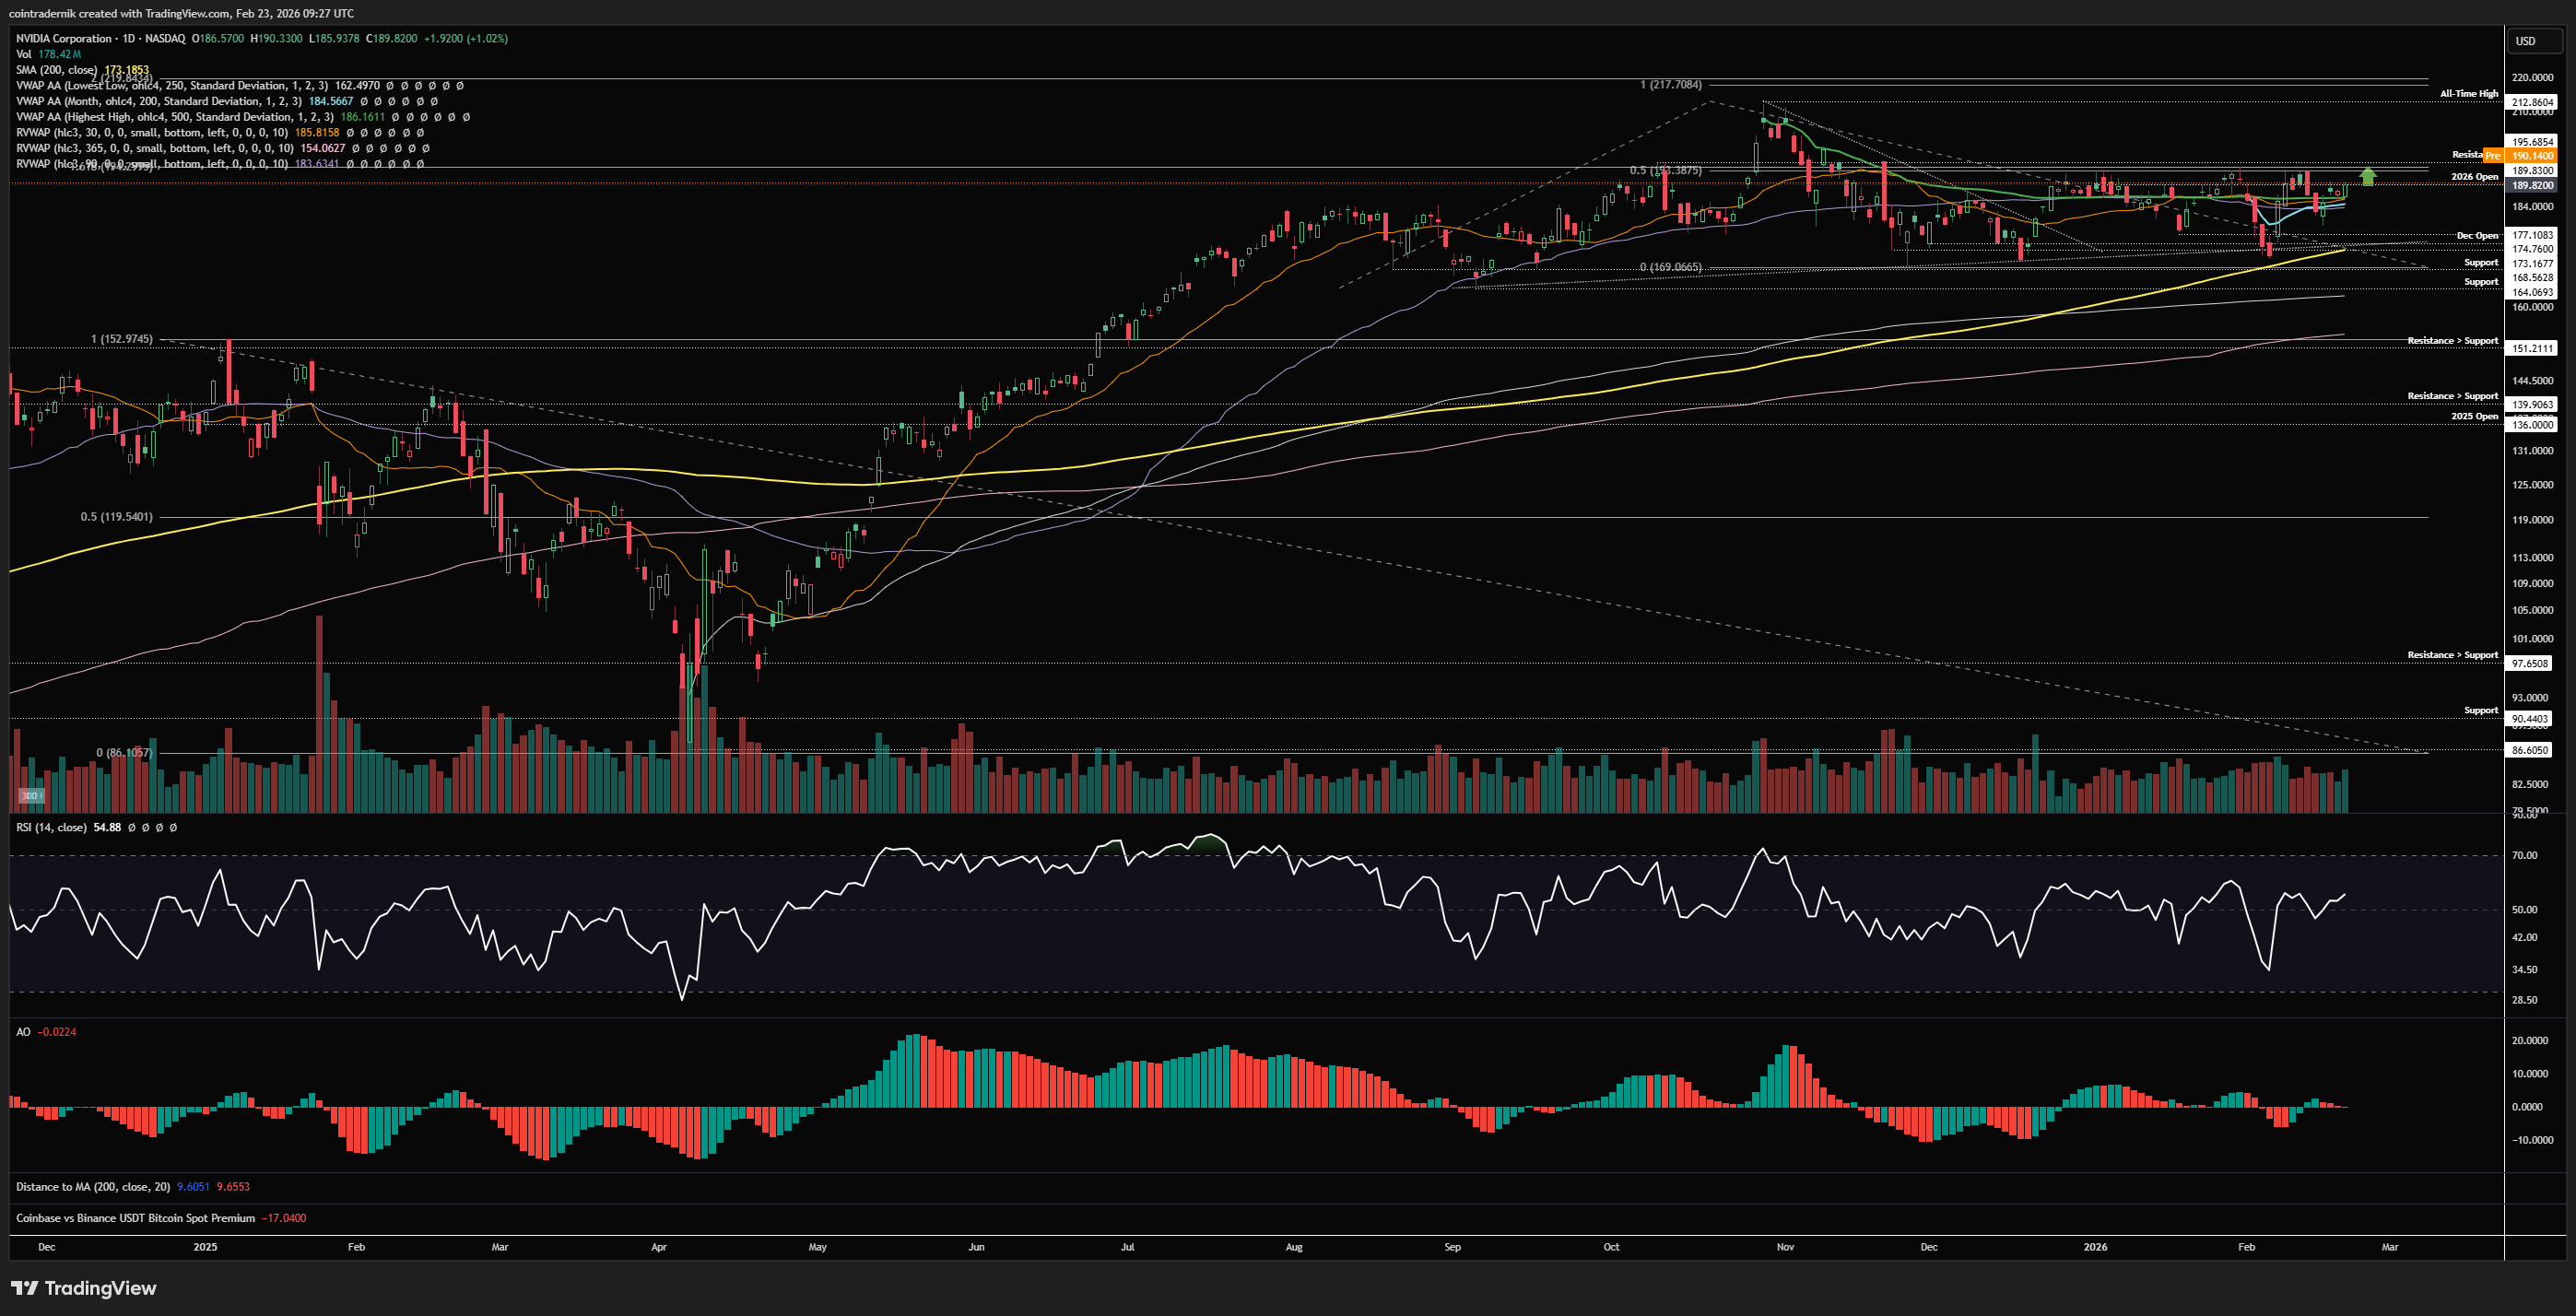
Turning to the daily, we are now starting to hold above the anchored VWAP from all-time highs as daily RSI is staying stubborn above 50, having marked out that higher-low last week. So, we actually have something of an inverse H&S within this broader H&S pattern, right as we come into earnings. Simulation, anyone? Either way, it seems clear we find some sense of sustained direction after months of chop and, if we close above $194, daily structure turns bullish alongside momentum and we should expect price to at least retest those highs at $213. To be honest, not a lot else to add here as the structure is clean on both sides and we should find out pretty soon whether this has juice for another leg higher or whether we have been in months of distribution with a range breakdown on the cards.
Price: $5.89
Weekly:
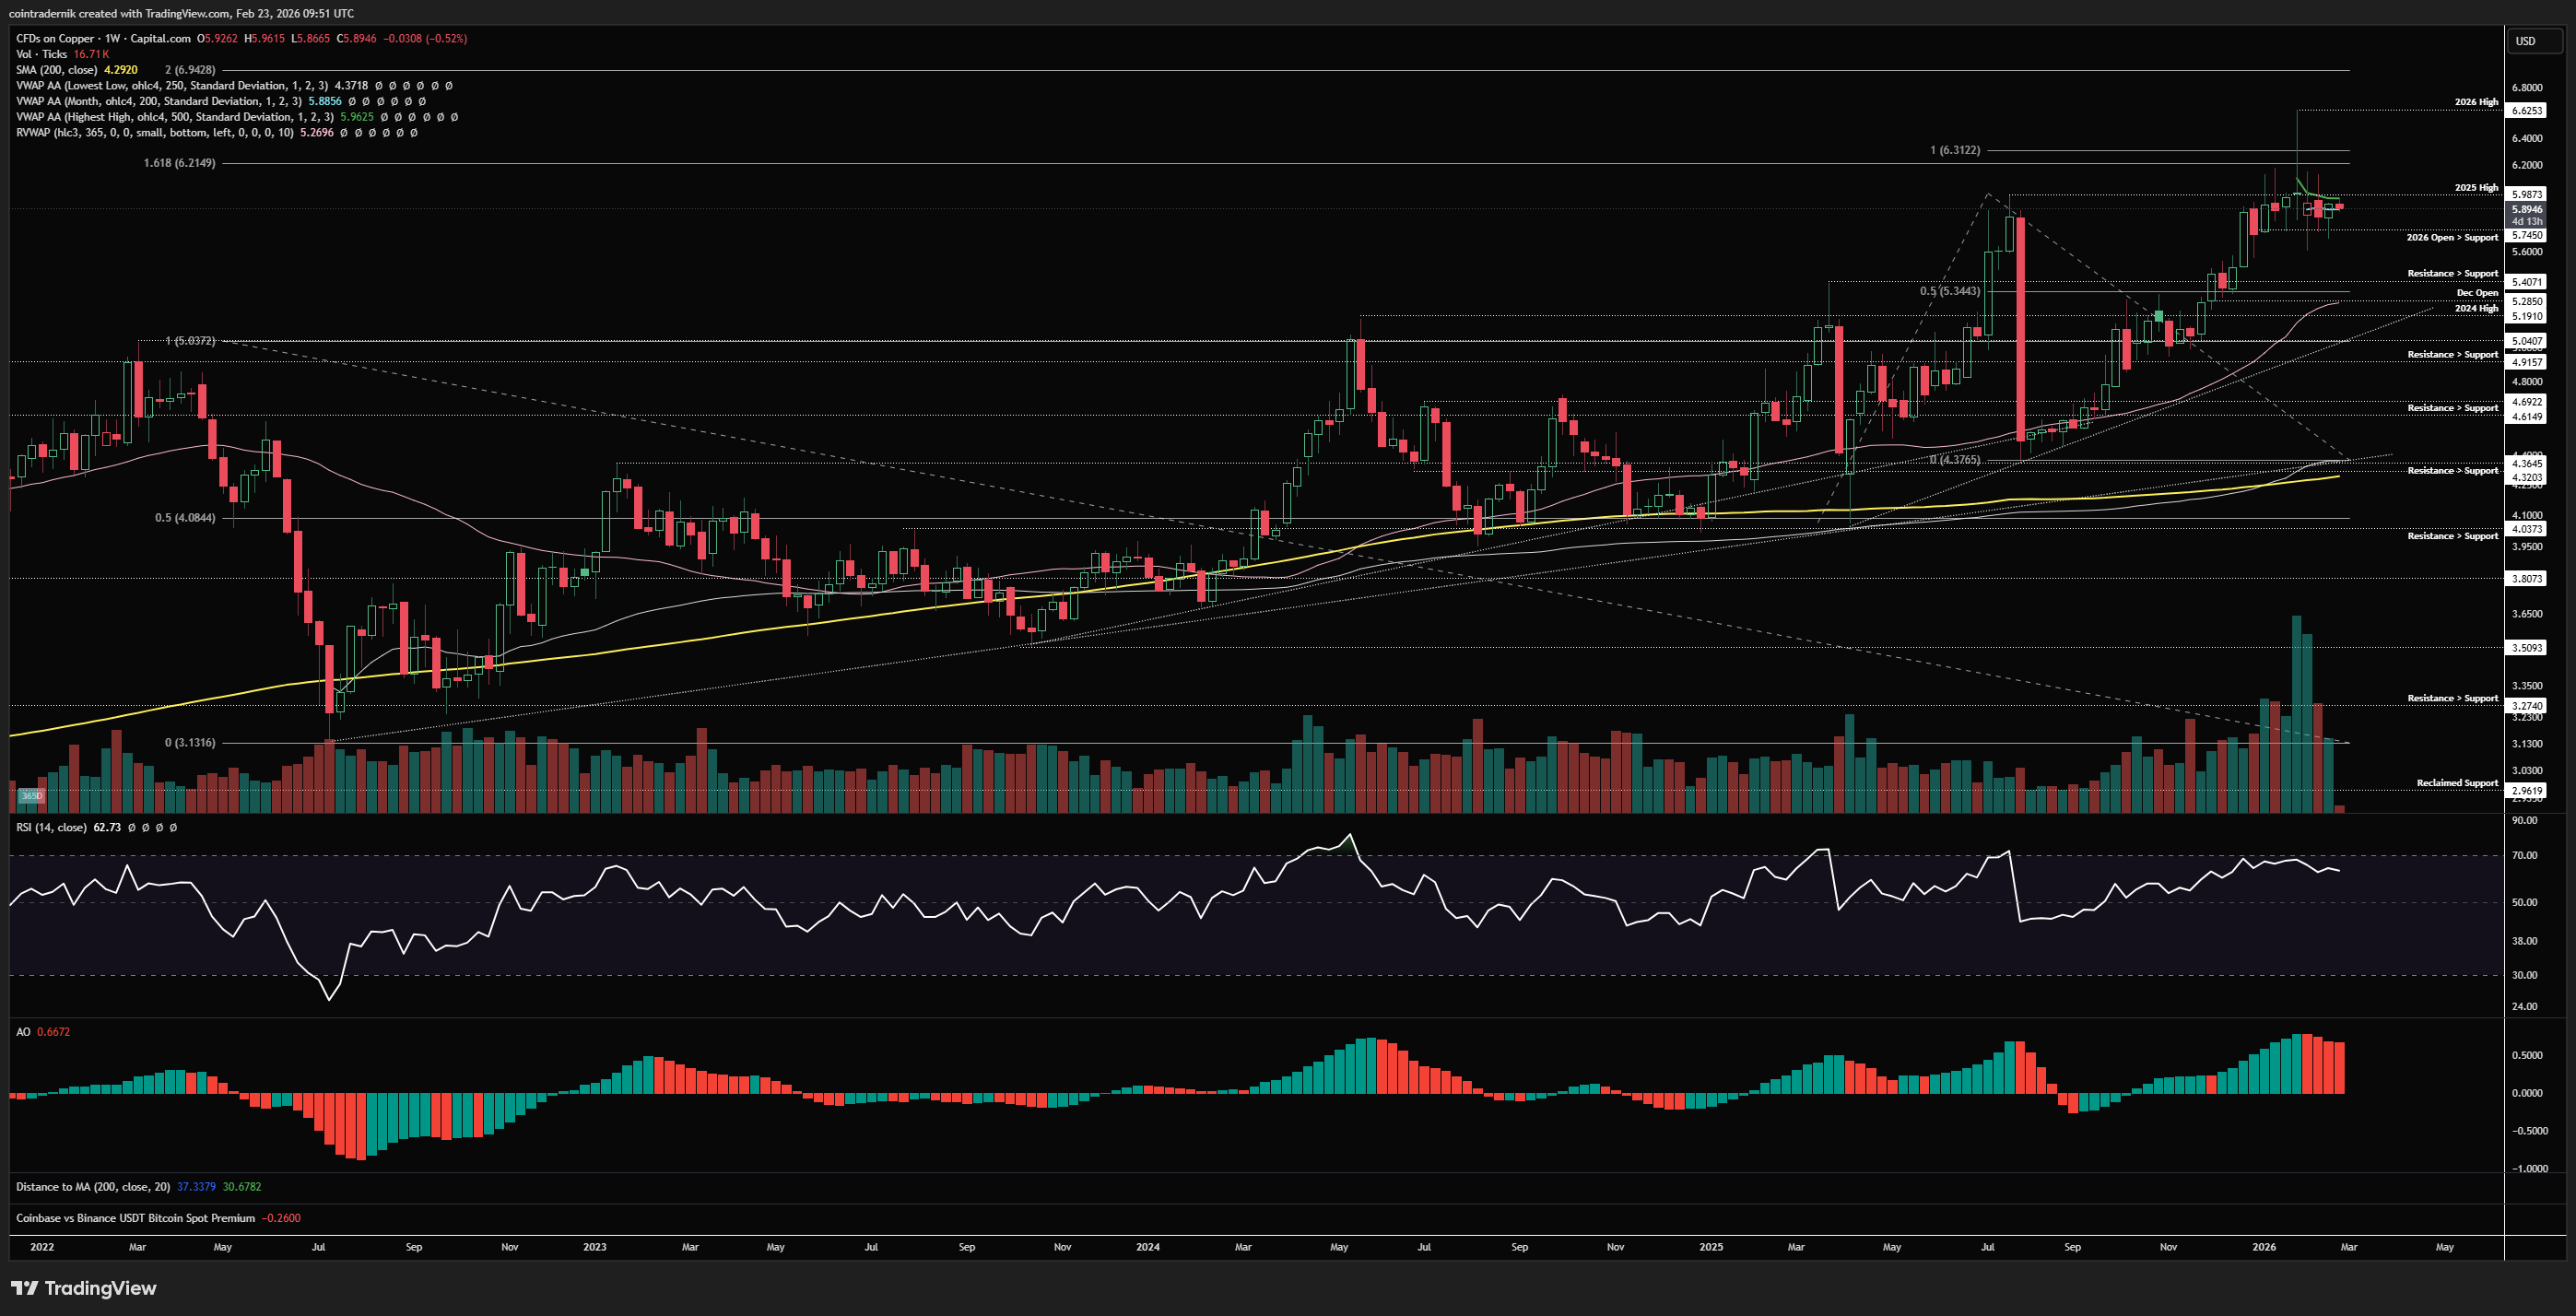
Beginning with the weekly for Copper, we can see that price wicked to new all-time highs at $6.62 a few weeks ago, then rejected during the metals capitulation week, breaking back below the 2025 high at $5.99, which continues to act as extremely strong resistance. Price then wicked below the yearly open at $5.74, bounce and is now consolidating between that yearly open and the 2025 high as resistance, with the anchored VWAP from that all-time high confluent around $6. Weekly momentum is still bullish but choppier here and it does seem like price is digesting the major move higher, where acceptance above $6, flipping that level into support, will then begin another leg higher from here towards $6.90 as a first target. If, instead, we are distributing here, with $6 continuing to cap price, we should see a weekly close the 2026 open at $5.74, turning support into resistance, where I will exit some copper exposure from lower prices and look to re-assess later, with my expectation being that a loss of $5.74 would be enough to send us back to the 365d rolling VWAP, now at $5.27. Acceptance above $6 is, in my view, the clearest signal for continuation and for those on the sidelines to look keenly for intraweek pullbacks to long with a much higher probability of higher prices from there.
Daily:
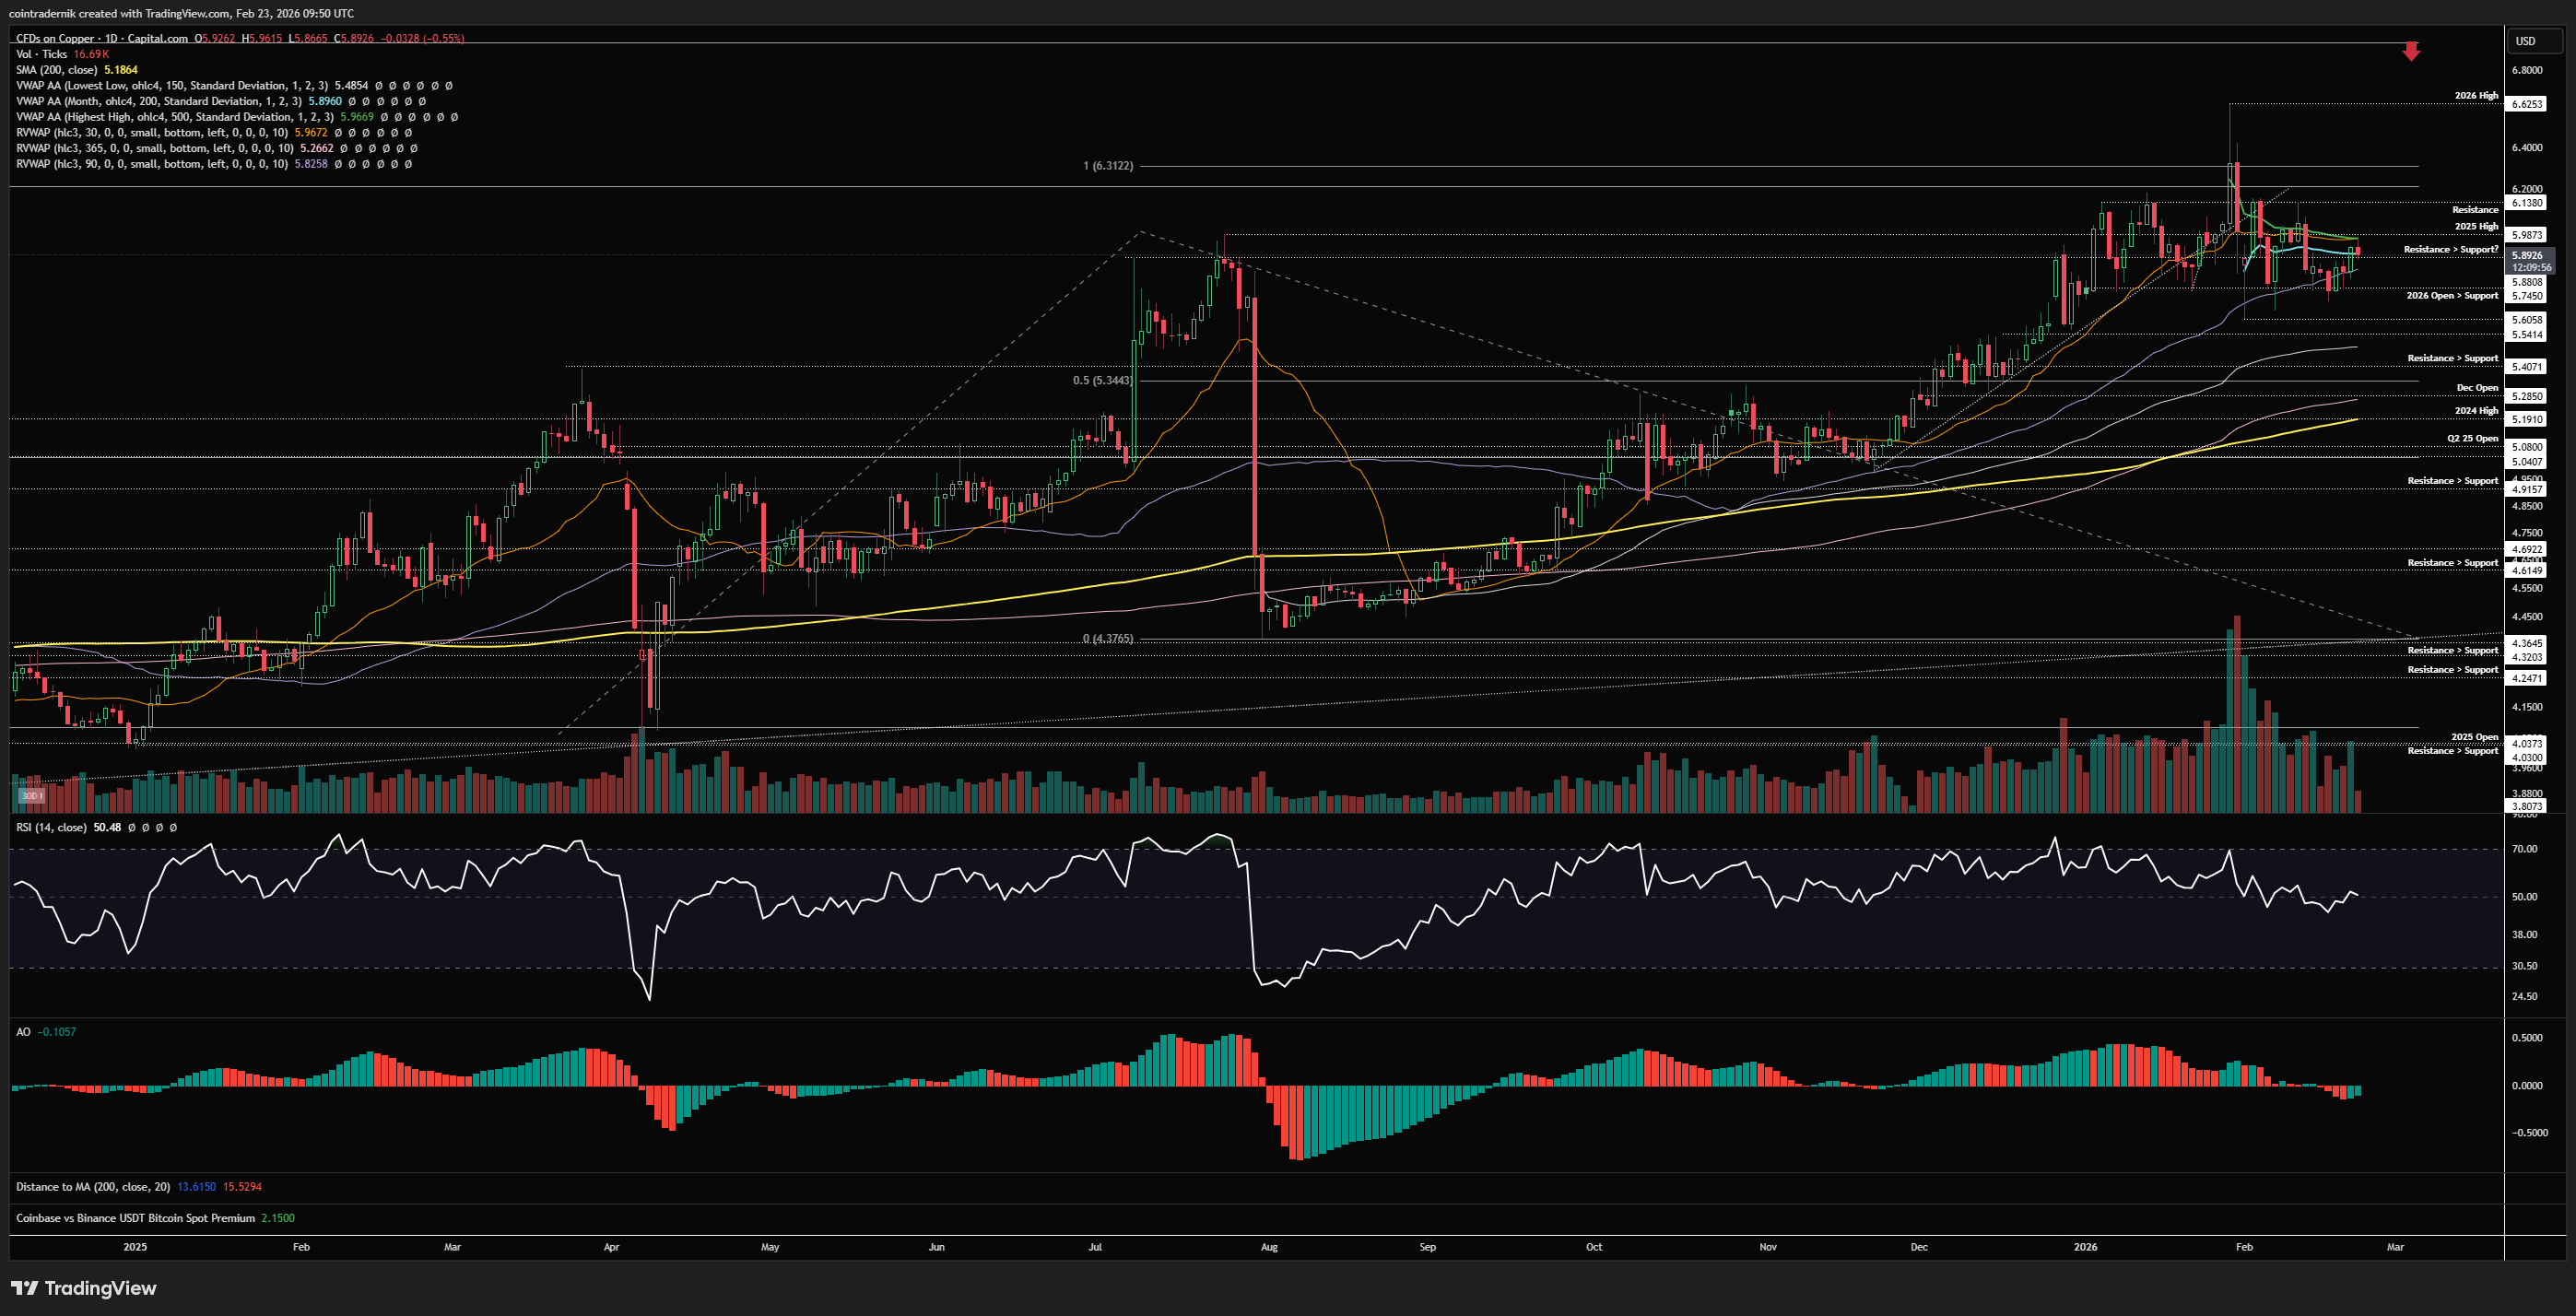
Turning now to the daily, we can see how price is coiled between key MAs and VWAPs, as well as price levels themselves, with daily RSI just about holding that 50 area, much like Nov 2024. In fact, this looks like a broader version of that same consolidation to me, where price then marked out a higher-low above the 90d rolling VWAP in mid-Nov and continued higher from $5 towards that $6.60 from there. We are currently capped by the anchored VWAP from the all-time high and the 30d rolling VWAP and support by the 2026 open and the 90d rolling VWAP, with the Feb VWAP right in between. Daily structure is bearish here with the lower-highs and lower-low below the swing-low that preceded the all-time high, but we have now started to mark out higher-lows, so flipping $6 and then breaking and closing above $6.14 would turn daily structure bullish and I would be quite confident that we trade towards $7 from there.
Price: $86.77
Weekly:
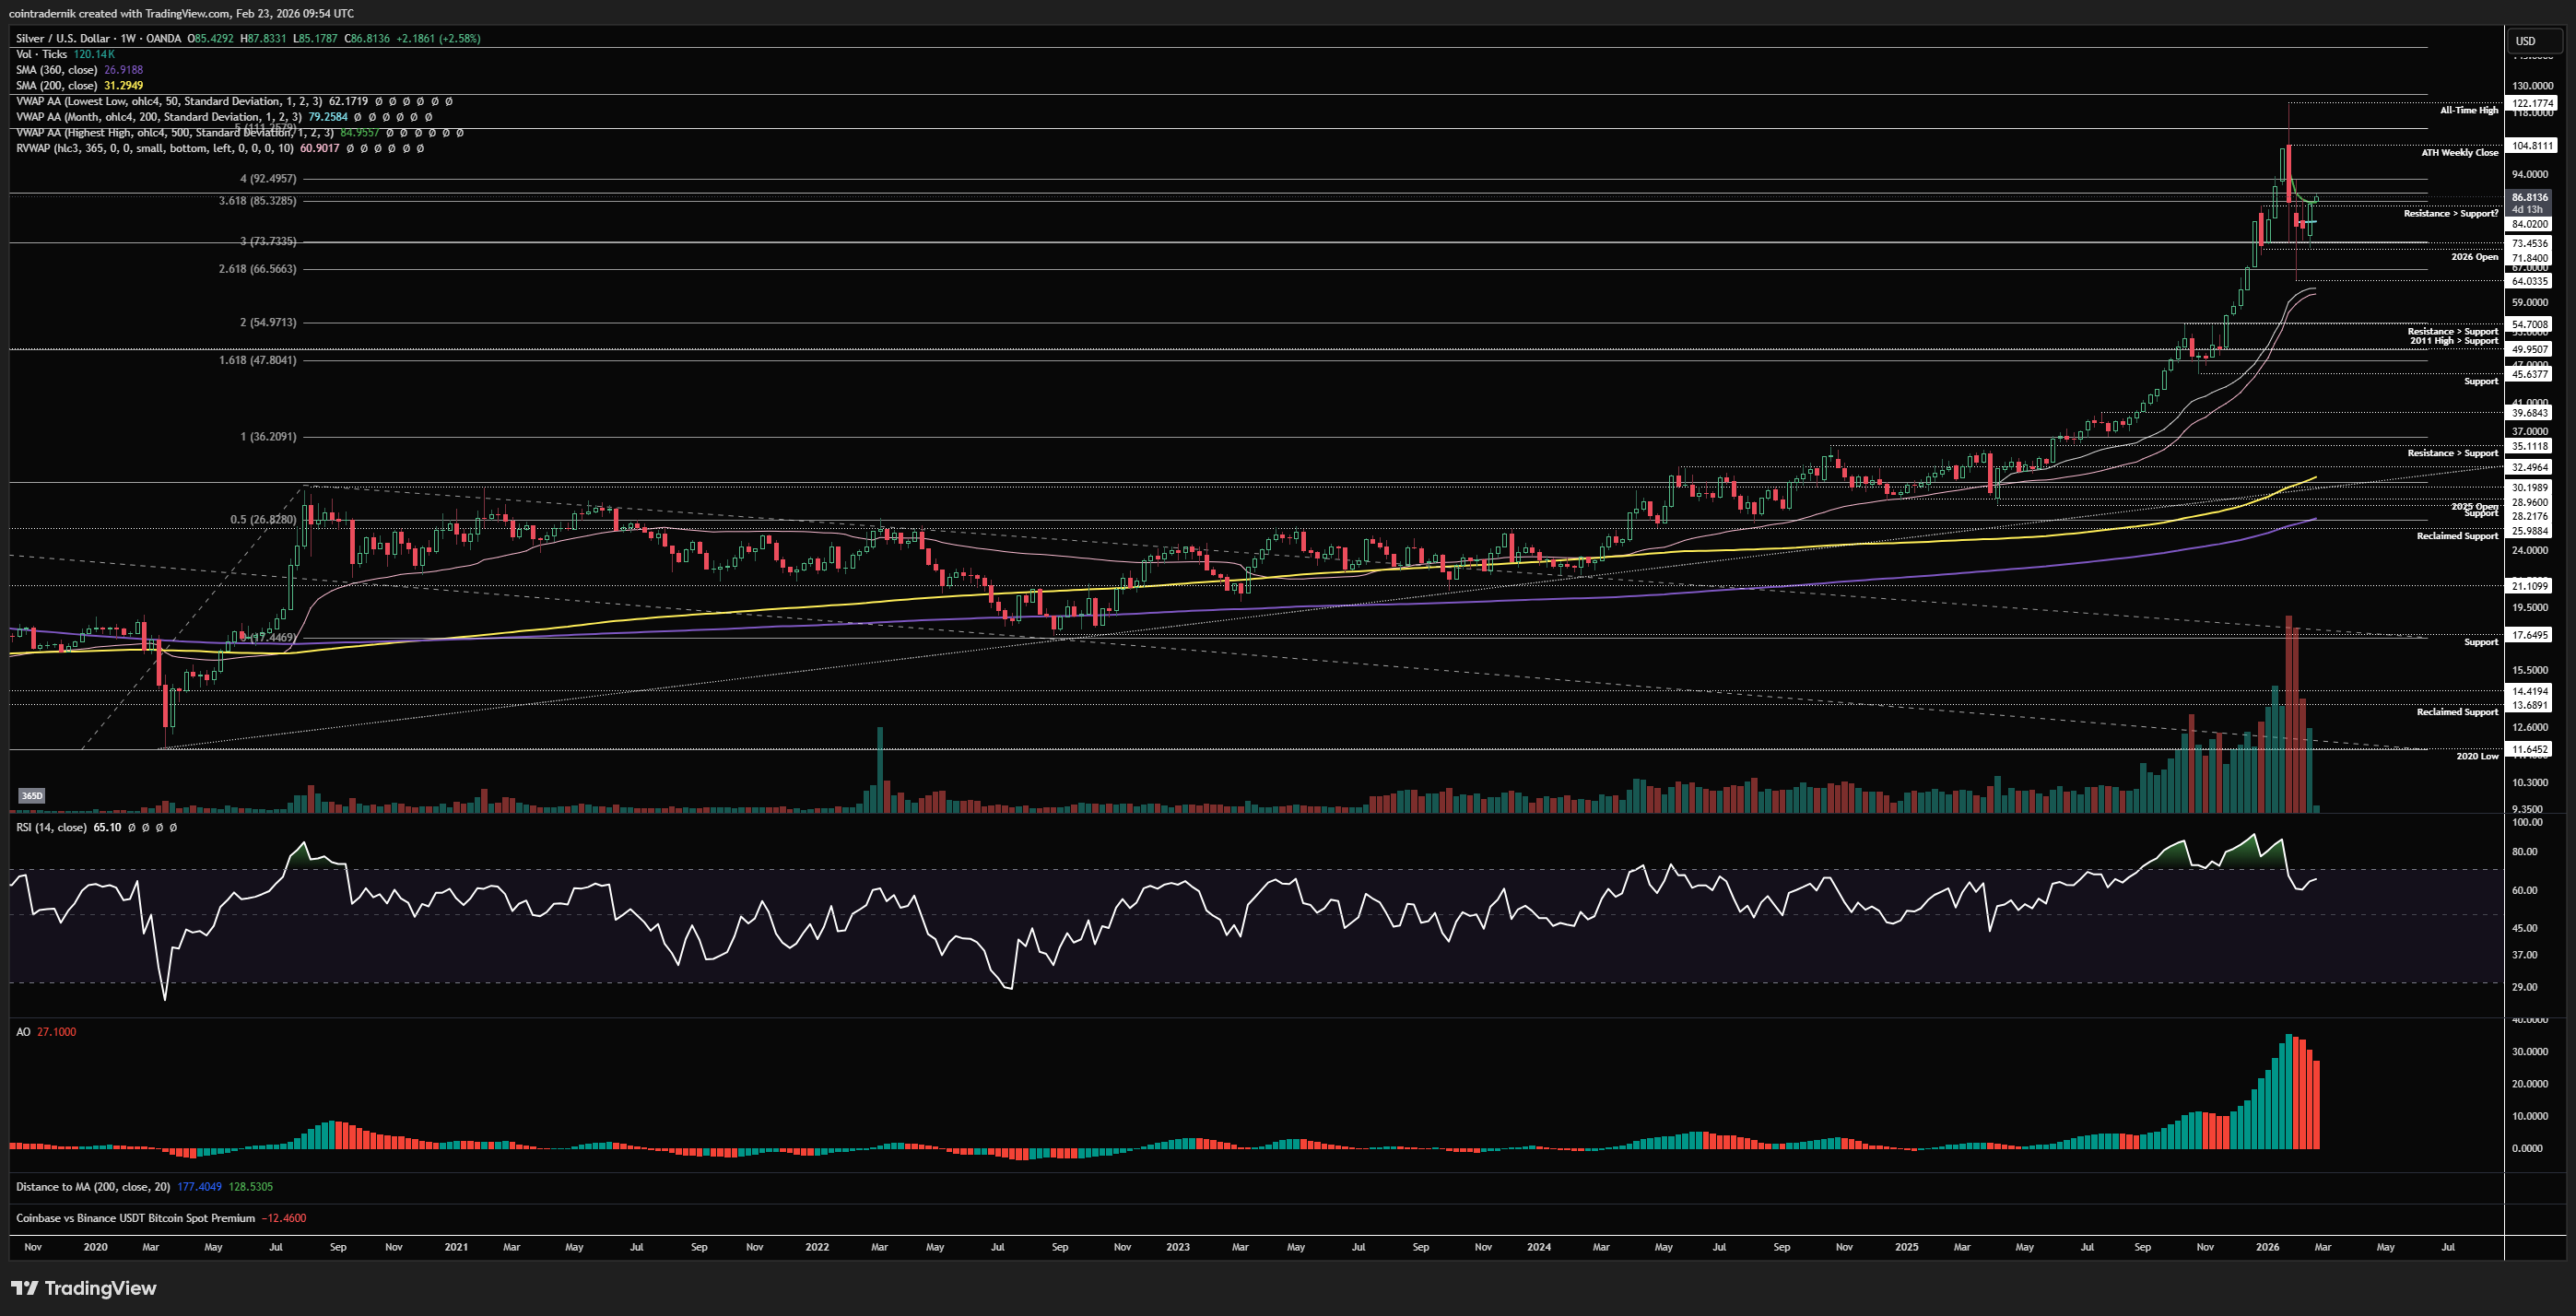
Beginning with the weekly for Silver, we can see that weekly momentum has come off quite a bit since those extreme highs in January, but remains in bullish territory for now, with price holding above the 365d rolling VWAP. We tagged the 500% extension of the prior major swing and wicked above it into $122 before rejecting, with price retracing almost 50% off that high. We have since marked out a swing-low and price is pushing higher once again, but, as I will outline on the daily timeframe, I do think it is more probable this is setting us up for a lower high or complacency shoulder after a parabolic run, from which we are likely to see a period of consolidation within this broader range. Only if we close the weekly above $105 would I think we're likely to continue through all-time highs towards $140+.
Daily:
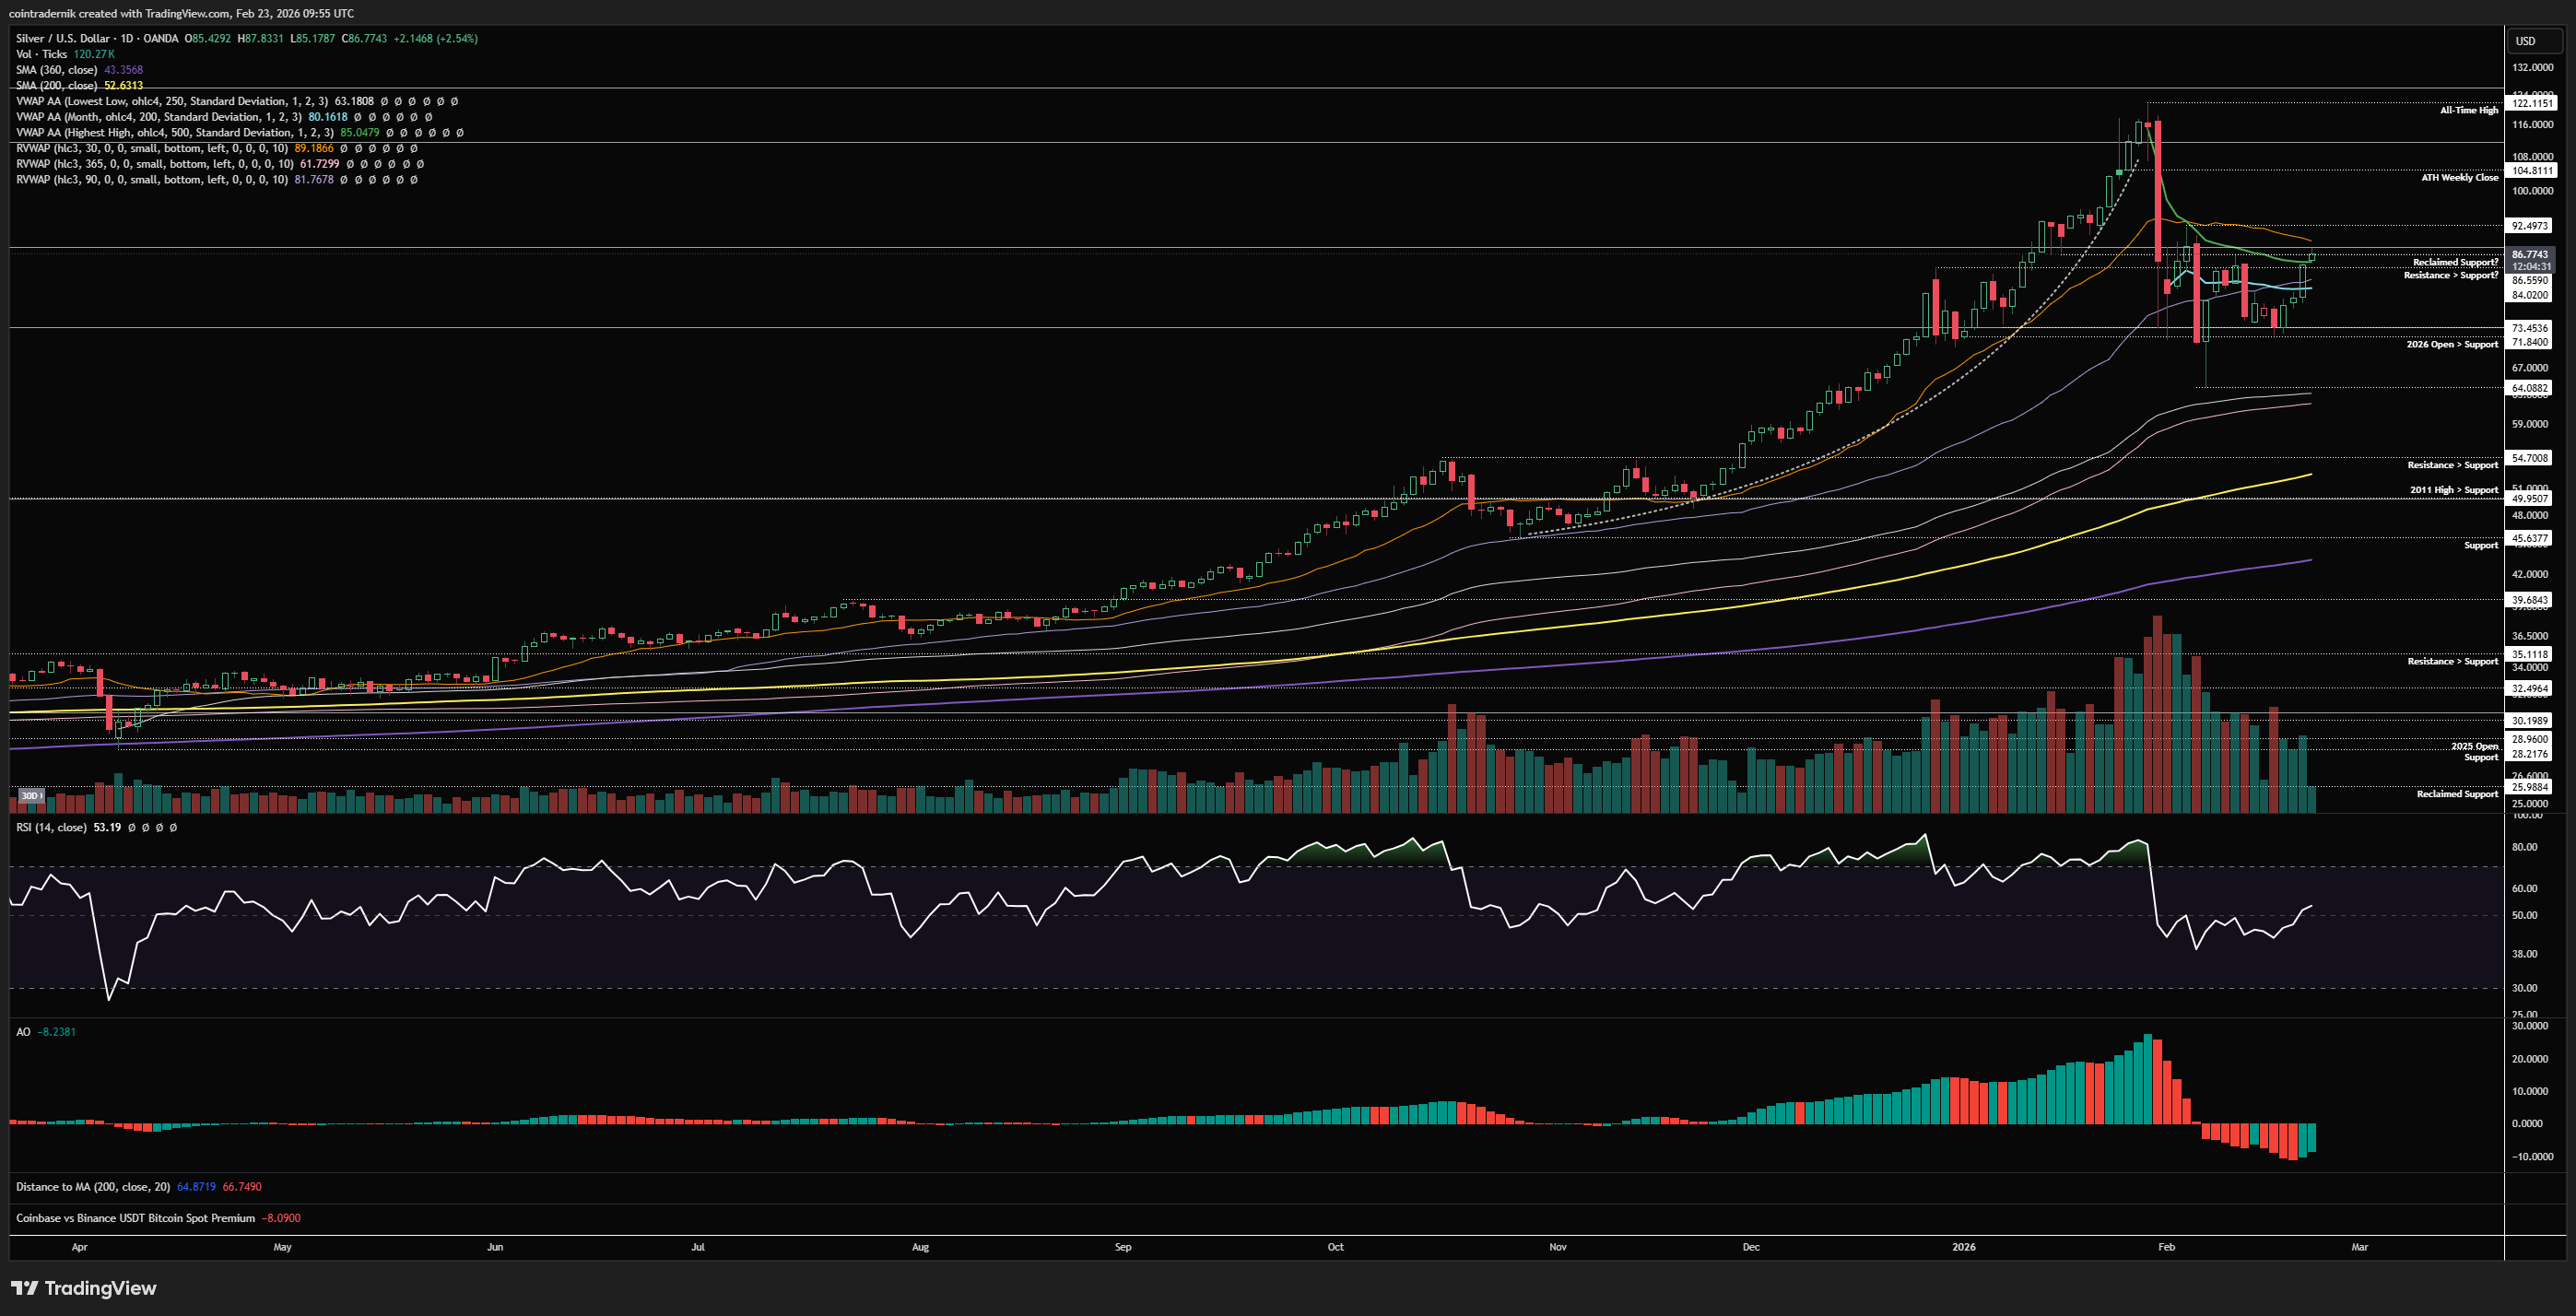
Turning to the daily for Silver, we can see just how perfectly that parabola played out, with price ascending more steeply into the all-time high in late Jan at $122, then rejecting hard and erasing weeks of rallying with days of capitulation, with Silver tagging $122 and $64 in the space of 7 sessions. We marked out that low above the anchored VWAP from the April 2025 lows and the 365d rolling VWAP at $64, bounced and rejected at the anchored VWAP from the all-time high earlier this month. Price then marked out a higher-low above the yearly open, reclaiming support at $72, and we are now seeing price push higher, through the 90d rolling VWAP into the anchored VWAP from the all-time high, above which it has opened this week. If we close above it today, daily structure would also turn bullish with a higher-high following the higher-low, as daily RSI has broken back above 50. We would then only have the 30d overhead at $89 as minor resistance before we could look to play a gap fill long at least back towards the ATH weekly close at $104.80ish. I am still very much of the view that such a parabolic move will take some time to digest and Silver likely remains range-bound for many months from here, but that would be a nice long if we can get it for a complacency shoulder below all-time highs. Depending on how price-action sets up if we get that move higher, I would look to fade it with all-time highs as invalidation, but let's see how things develop. I do think the bulk of the downside has been realised and it will likely be a game of time capitulation from here, though I would absolutely be looking for longs in a couple of months if we sweep $64.
I hope you've found some value in the read this week - please RT, share, engage etc. if so!
And if you've not already signed up for Ostium, please do so and test out some of the recent updates, including:
Sign up here (you don't have to use my ref link, of course): https://ostium.app/trade?from=CL&to=USD&ref=CTNIK

.avif)