

Market Outlook #73 - 'Year of the Fire Horse'
February 16, 2026
-
12
min read


This blog references an opinion and is for entertainment and informational purposes only. It is not intended to be investment advice. Seek a duly licensed professional for investment advice.
In this special 'Year of the Fire Horse' edition of the 73rd Market Outlook here at Ostium Insights, we'll be taking a look at the week ahead in markets, looking at price-action, positioning and event risk for Gold, Nikkei, USDJPY, AUDUSD and EURUSD.
Now, let's take a look at the moderately busy week ahead, with some key growth data throughout the week and plenty of speeches, alongside an RBNZ rate decision and a stacked Friday:
MONDAY: FED'S BOWMAN SPEECH
TUESDAY: VARIOUS FED SPEECHES
TUESDAY: US NY EMPIRE STATE MANUFACTURING INDEX (FEB): (CONSENSUS 7.1 VS PREVIOUS 7.7)
WEDNESDAY: RBNZ RATE DECISION: (CONSENSUS 2.25% VS PREVIOUS 2.25%)
WEDNESDAY: US DURABLE GOODS ORDERS (DEC): (CONSENSUS -1.8% VS PREVIOUS 5.3%)
WEDNESDAY: US INDUSTRIAL PRODUCTION (MOM (JAN): (CONSENSUS 0.3% VS PREVIOUS 0.4%)
WEDNESDAY: FOMC MINUTES
THURSDAY: US INITIAL JOBLESS CLAIMS: (CONSENSUS 225K VS PREVIOUS 227K)
THURSDAY: US PHILLY FED MANUFACTURING SURVEY (FEB): (CONSENSUS 10 VS PREVIOUS 12.6)
THURSDAY: VARIOUS FED SPEECHES
FRIDAY: VARIOUS FED SPEECHES
FRIDAY: ECB PRESIDENT LAGARDE SPEECH
FRIDAY: US CORE PERSONAL CONSUMPTION EXPENDITURES (YOY) (DEC): (CONSENSUS 3% VS PREVIOUS 2.8%)
FRIDAY: US GDP ANNUALIZED (QOQ) (Q4): (CONSENSUS 3% VS PREVIOUS 4.4%)
FRIDAY: US S&P GLOBAL MANUFACTURING PMI (FEB): (CONSENSUS N/A VS PREVIOUS 52.4)
FRIDAY: US S&P GLOBAL SERVICES PMI (FEB): (CONSENSUS N/A VS PREVIOUS 52.7)
FRIDAY: FED MONETARY POLICY REPORT
Now, let's dig into asset-specific price-action for the week ahead, looking firstly at Gold:
Price: $5013
Weekly:
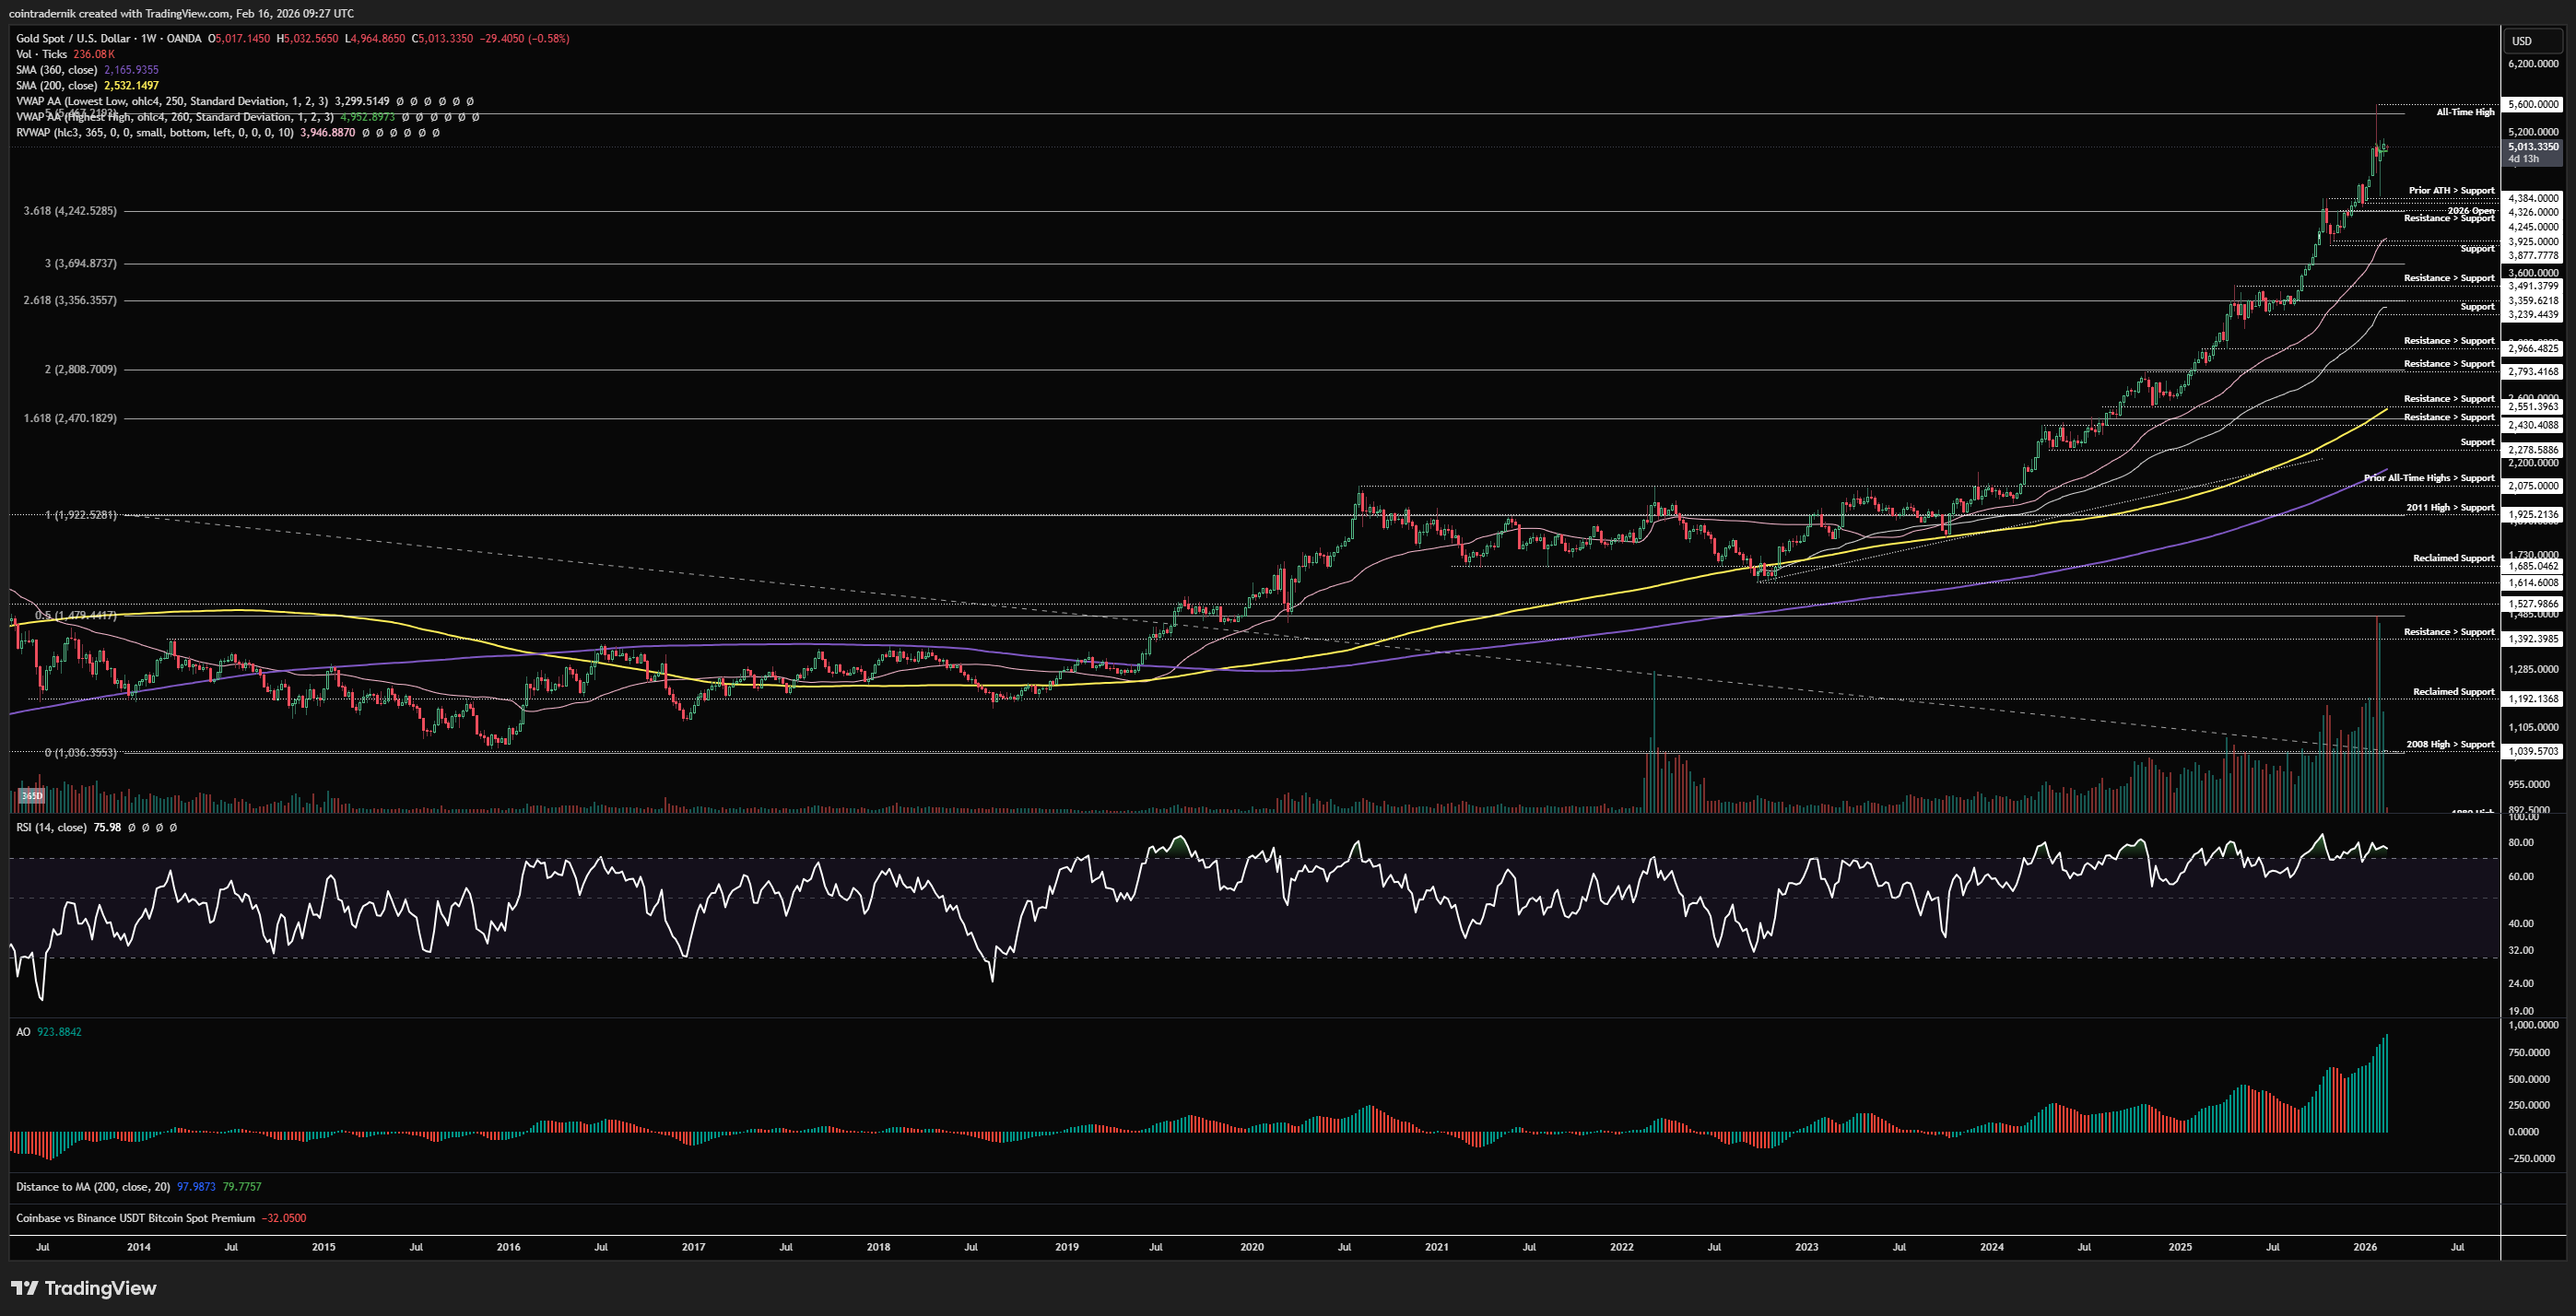
If we begin by looking at Gold on the weekly timeframe, we can see just how wild recent price-action has been, with Gold marking an all-time high into the 500% fib extension of the bear market at $5600, then crashing 21% lower a week later into prior highs turned support at $4384 and bouncing hard, with price now consolidating somewhere in between those two levels at $5013. Last week was a consolidation week, as you would expect, and price given the extreme volatility into the high and the subsequent immediate drawdown, I do think significant further consolidation is likely. For those who read my 2026 Outlook, you will recall my expectations for a blow-off top above $5000 in Q1 for Gold followed by a long period of consolidation and re-accumulation, with this likely to last well into H2. I did not expect us to trade $5600 and then correct over 20% in the space of a few days - but this sort of historic volatility only reinforces the idea that Gold (and Silver) likely need some time to take a breather after a monumental run. Now, invalidation on this idea is pretty straightforward: a weekly close above $5600 would be a very clear sign that the next leg higher has begun and more price discovery awaits. But, we are currently trading right in the middle of this massive range and I would not be looking for Gold longs here, nor do I think shorts are favourable unless we see a lower timeframe breakdown. Basically, stay the fuck away for now.
Daily:

Turning to the daily, we can see just how insane the move into the highs followed by the crash was, with a steepening parabolic ascent into $5600, with momentum at historic highs, and price rejecting and closing back below $5400 (with the all-time high daily close at $5418). This led to a rug pull off the daily open at $5400ish and price melted through local support levels into $4900, above the 30d rolling VWAP, where it found some support for a day, before capitulating through that level into the 90d rolling VWAP, anchored VWAP from the November 2025 lows and prior all-time highs turned support at $4400. This was marked by historic volume into the lows and price bounced sharply, then running up into the anchored VWAP from all-time highs at $5000, wicking above that level, rejecting, forming a higher-low at $4640 and since chopping around between $4900 - $5100 for several days. We are finding support around the Feb VWAP and 30d rolling VWAP, but price is struggling to hold above the anchored VWAP from all-time highs. Interestingly, daily RSI is still holding above 50, which marked the lows in late October too. If price can flip last week's high into support at $5125, then it is above all the key VWAP with momentum on this timeframe still holding bullish, suggesting at least a retest of major resistance at $5400 is on the cards. In my view, that first test of $5400 is likely to be the highest R/R short opportunity for Gold, because if we flip that into support it's pretty clear we're headed for new highs, whereas if that holds as a lower-high / complacency shoulder for Gold I think it is likely we run the $4400 support and form a new range around it later this year, before re-accumulating for higher prices many months later.
Price: 57,055
Weekly:
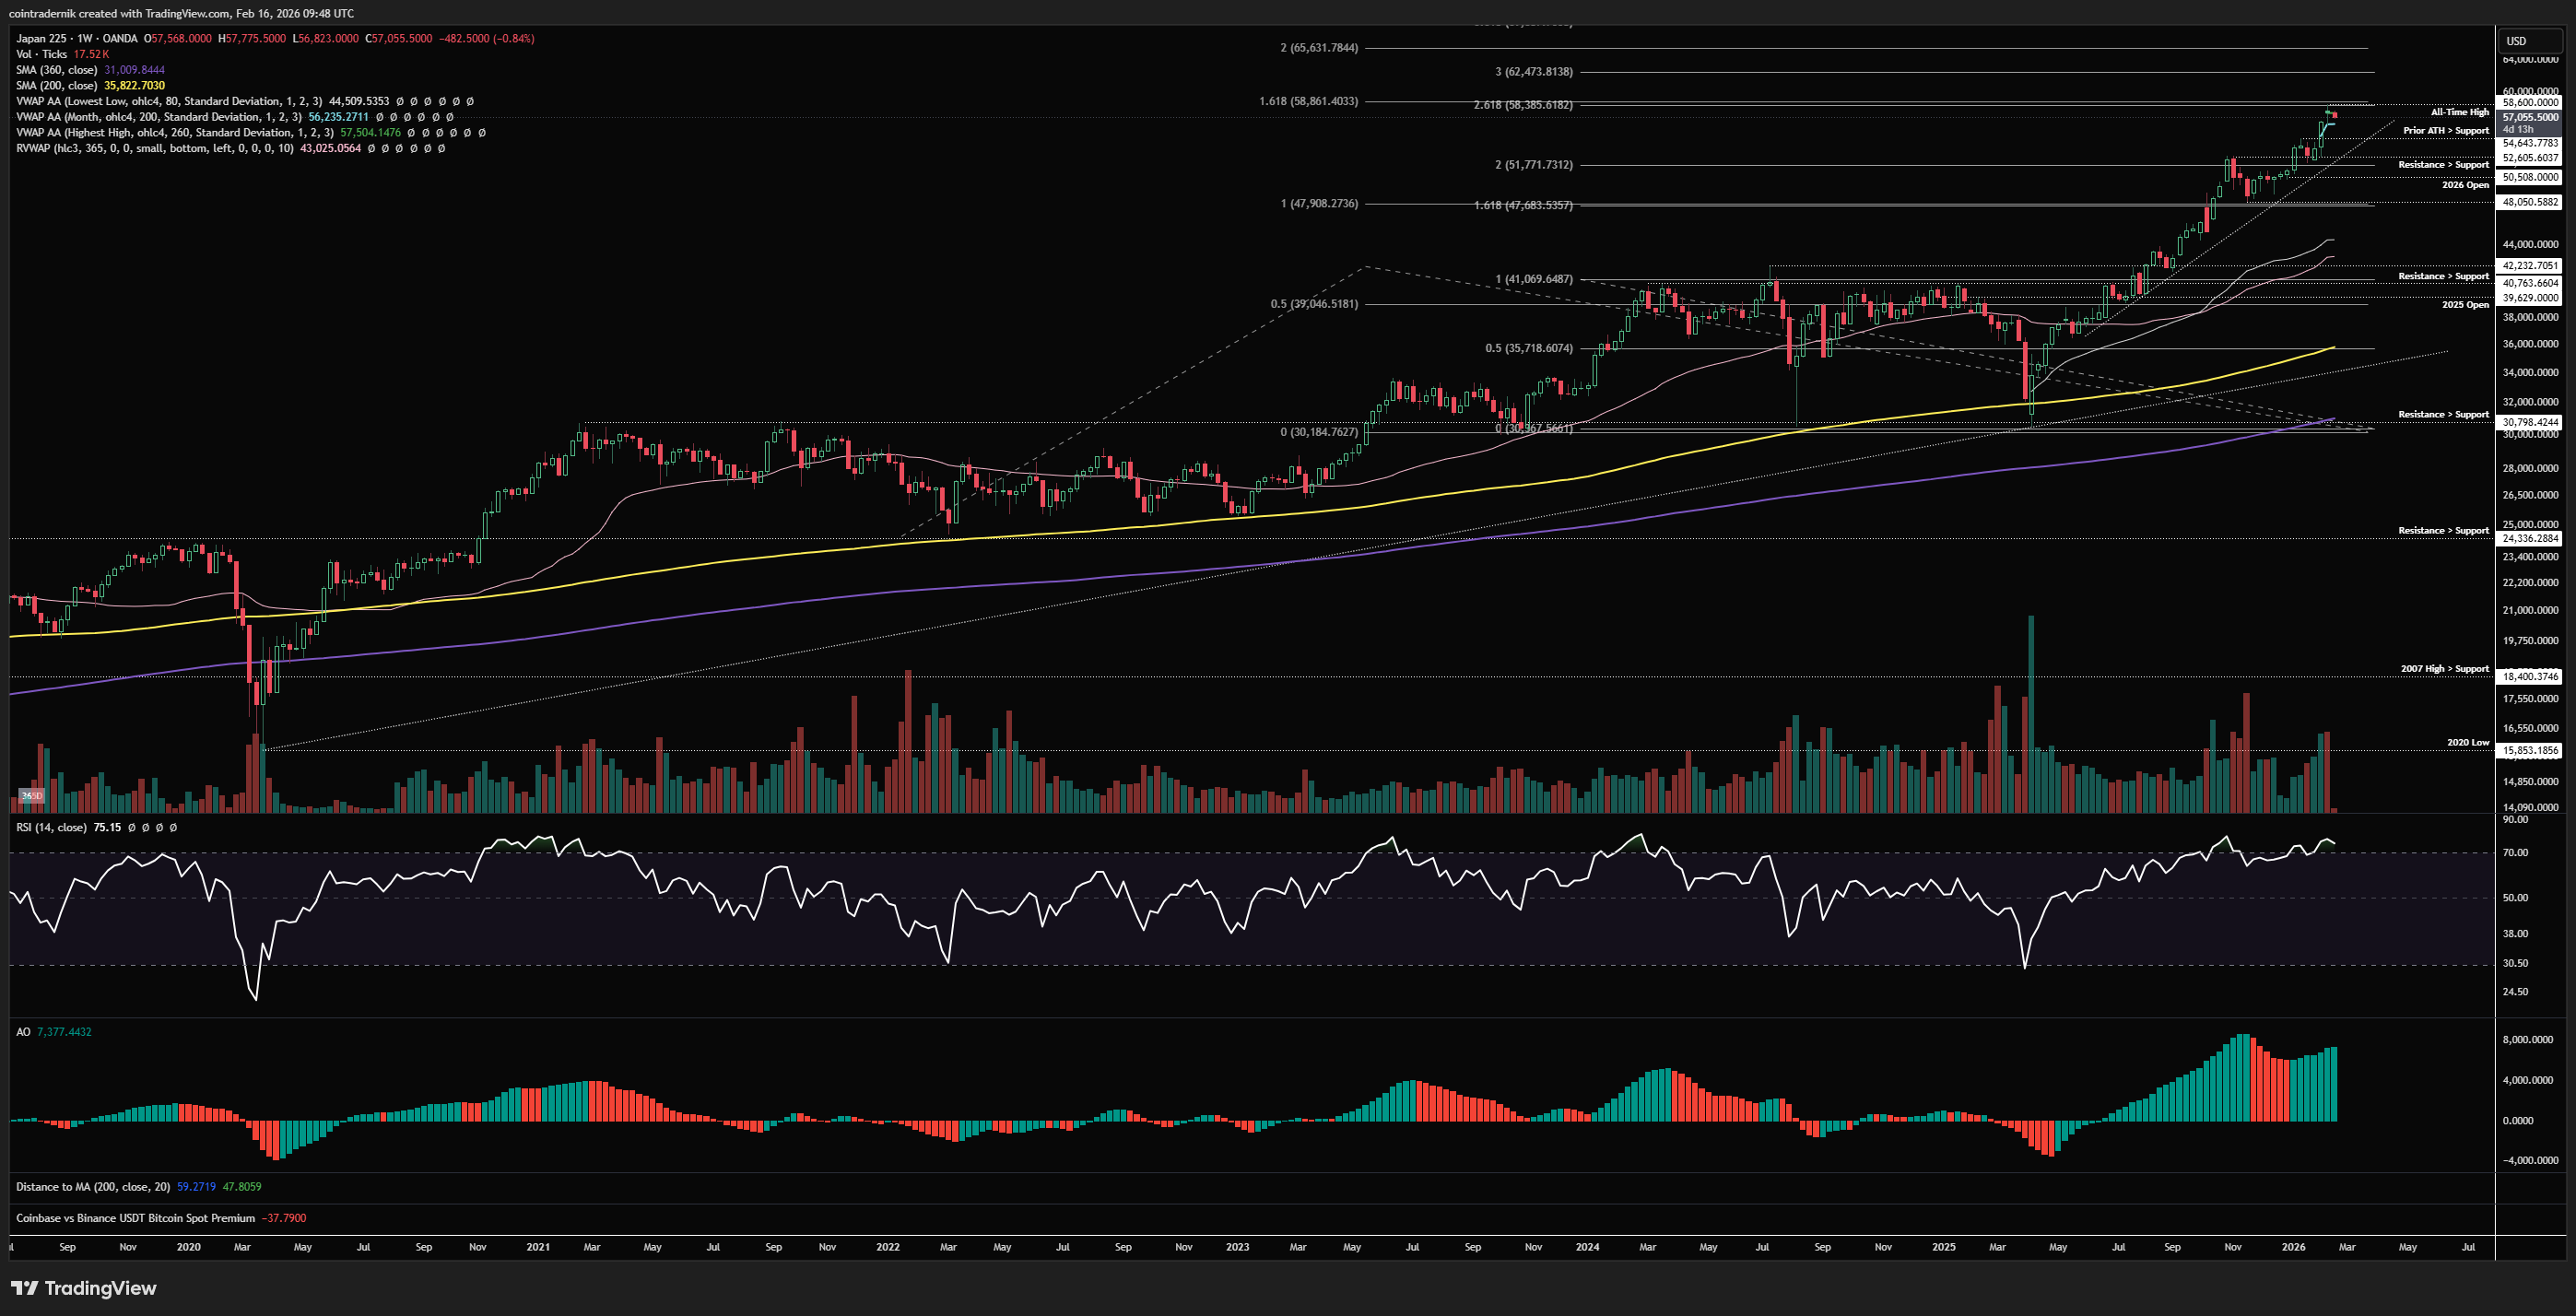
Beginning with the weekly view for the Nikkei, we can see that price played out perfectly following our long setup a few weeks ago, with prior resistance turning support above the trendline as anticipated at 52,600ish, and price then rallying off that swing-low to fresh highs beyond 54,643 into 58,600 as of last week, right around the confluence of fib extensions. Momentum remains bullish here, as does structure, but this may be where we find some sellers step in short-term. If we see acceptance above last week's high, the next target would be 62,500ish - although, to be clear, I am all out of Nikkei longs as of last week, having left 25% on the table for 58xxx to be tagged. I would look to re-enter longs back towards 55kish depending on the setup. There are no reasons to be majorly bearish on Japanese equities right here based on the technicals, however. The technically bearish setup would only really become a strong one if we flip 52,600 into resistance, having broken trendline support - then we have a longer-term top formation in play. Until then, it is a dip-buying market.
Daily:
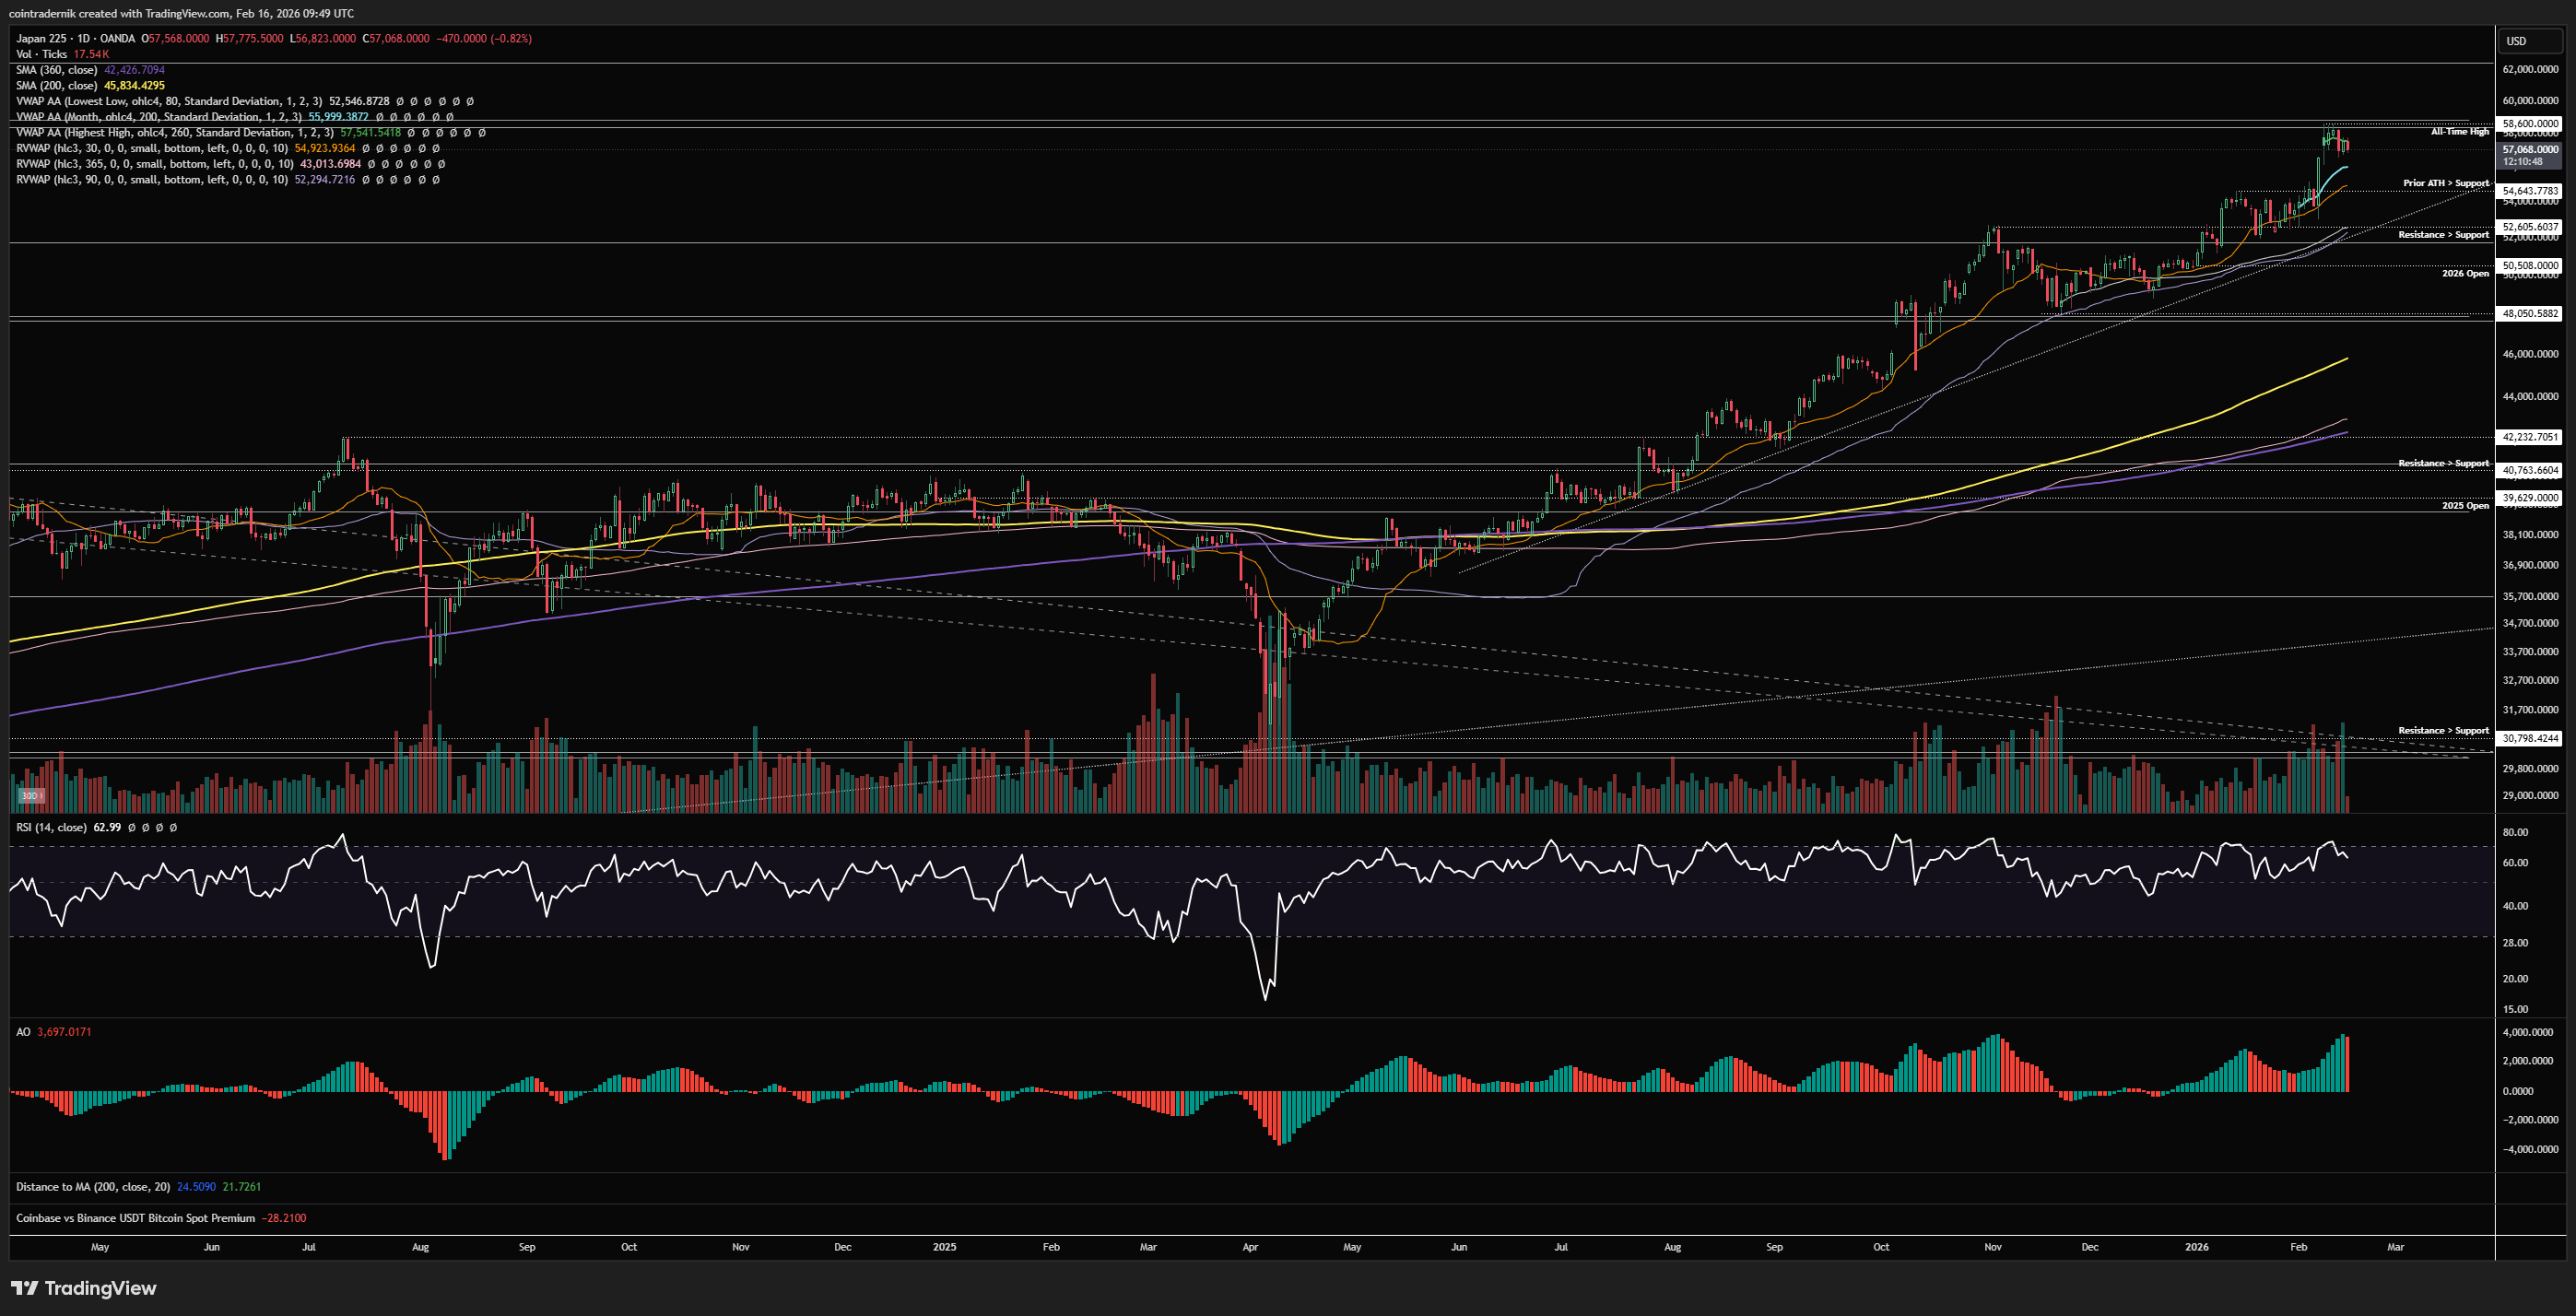
Looking at the daily, we can see that daily structure and momentum also remain bullish here, with no signs of trend exhaustion and clear higher-highs and lows, as it was when I took the long at 52,600. The rally is steepening a tad here, having broken above 54,640, so we need to be wary of jumping into longs at locally overextended levels, but we are firmly above the Feb VWAP, 30d rolling VWAP, anchored VWAP from the prior range lows and the 90d rolling VWAP - in short, this is not a bearish market. Rejection last week at key fibs does open up another pull-back, but in my view that would present yet another textbook long if we saw 55k tagged this week, where the 30d rolling VWAP and prior highs are sat, yet untested as support. Invalidation would be a close below 52,300, with 62,500 as the first overhead target should I get a fill...
Receive the latest updates directly to your inbox

Price: 153.55
Weekly:
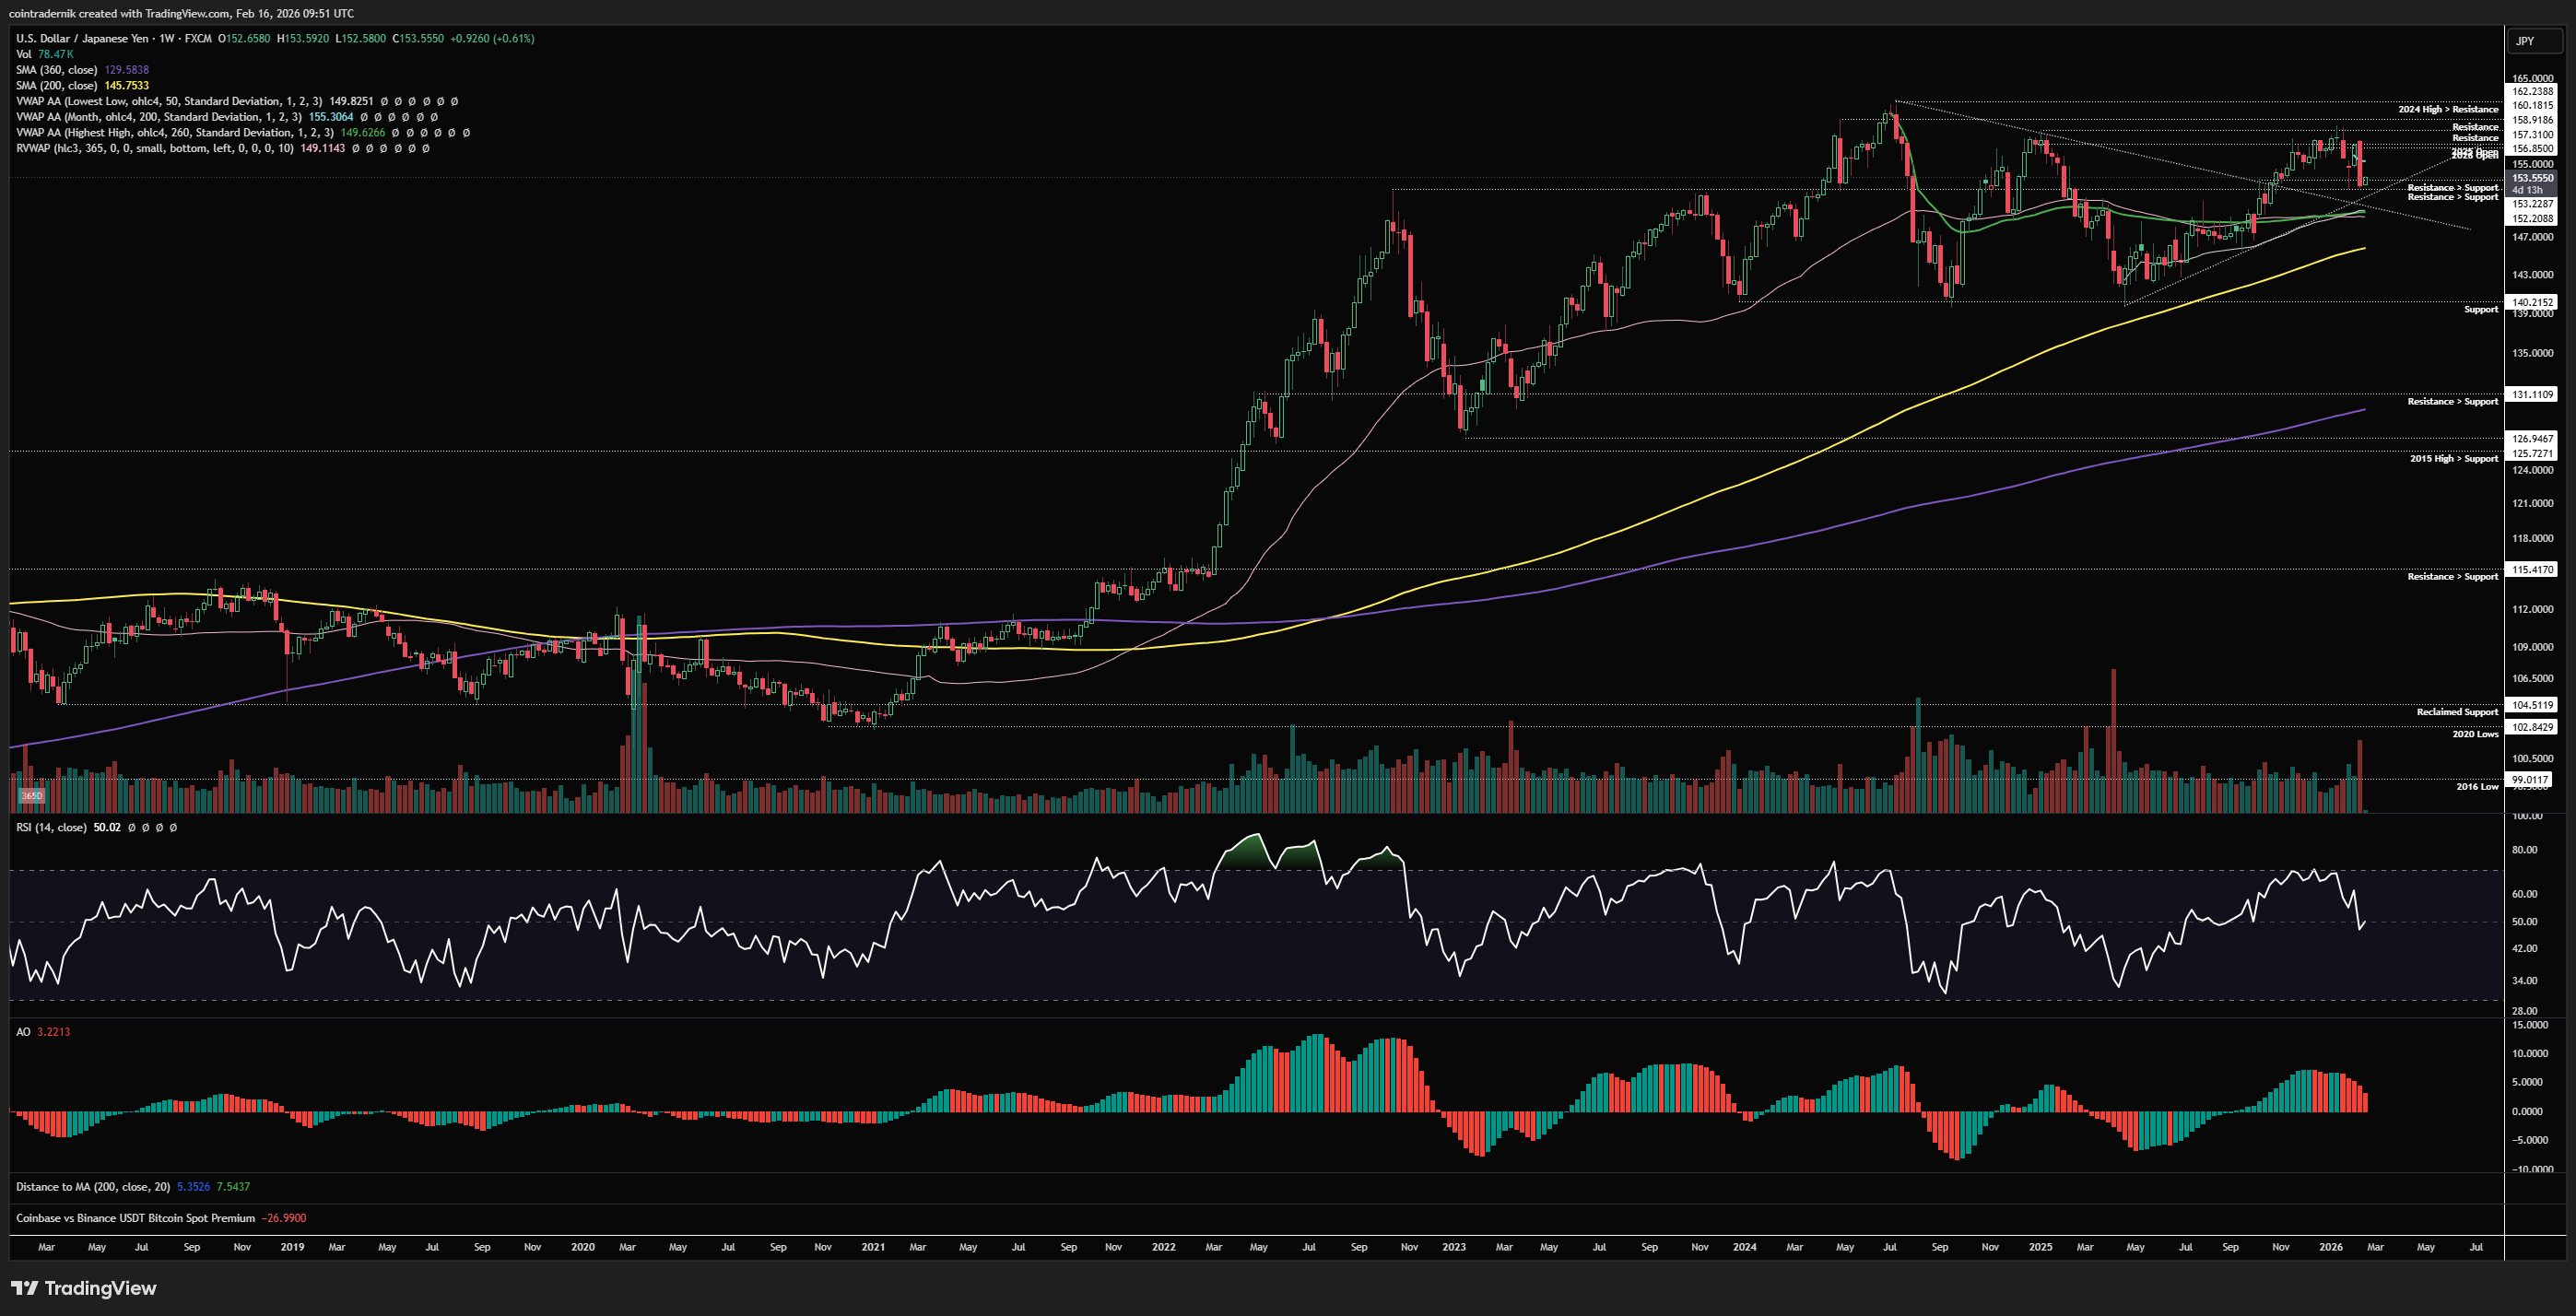
Beginning with the weekly, we can see that USDJPY rejected at major resistance last week, selling off from the open and retracing the entire bounce off support at 152 to close the week marginally above that at 152.6. Weekly RSI has reset to 50 and weekly structure is still supportive of higher prices, with price still holding trendline support from the April 2025 lows and holding above the anchored VWAP from that low. We have trendline resistance turned support below us, confluent with that VWAP, so I think any further weakness here into that 150ish area is likely to find buyers stepping in. Now, if we break and close below the confluence of support around 150, flipping it into resistance, then the picture becomes quite different and it would look like USDJPY has another date with 140, like August 2024 and the April 2025 lows, potentially a signal for market-wide vol. Until then, however, I think it is poor R/R to look for shorts if/when we tag that support. I am holding off on any positions here, but will look for longs a little lower should we get it.
Daily:
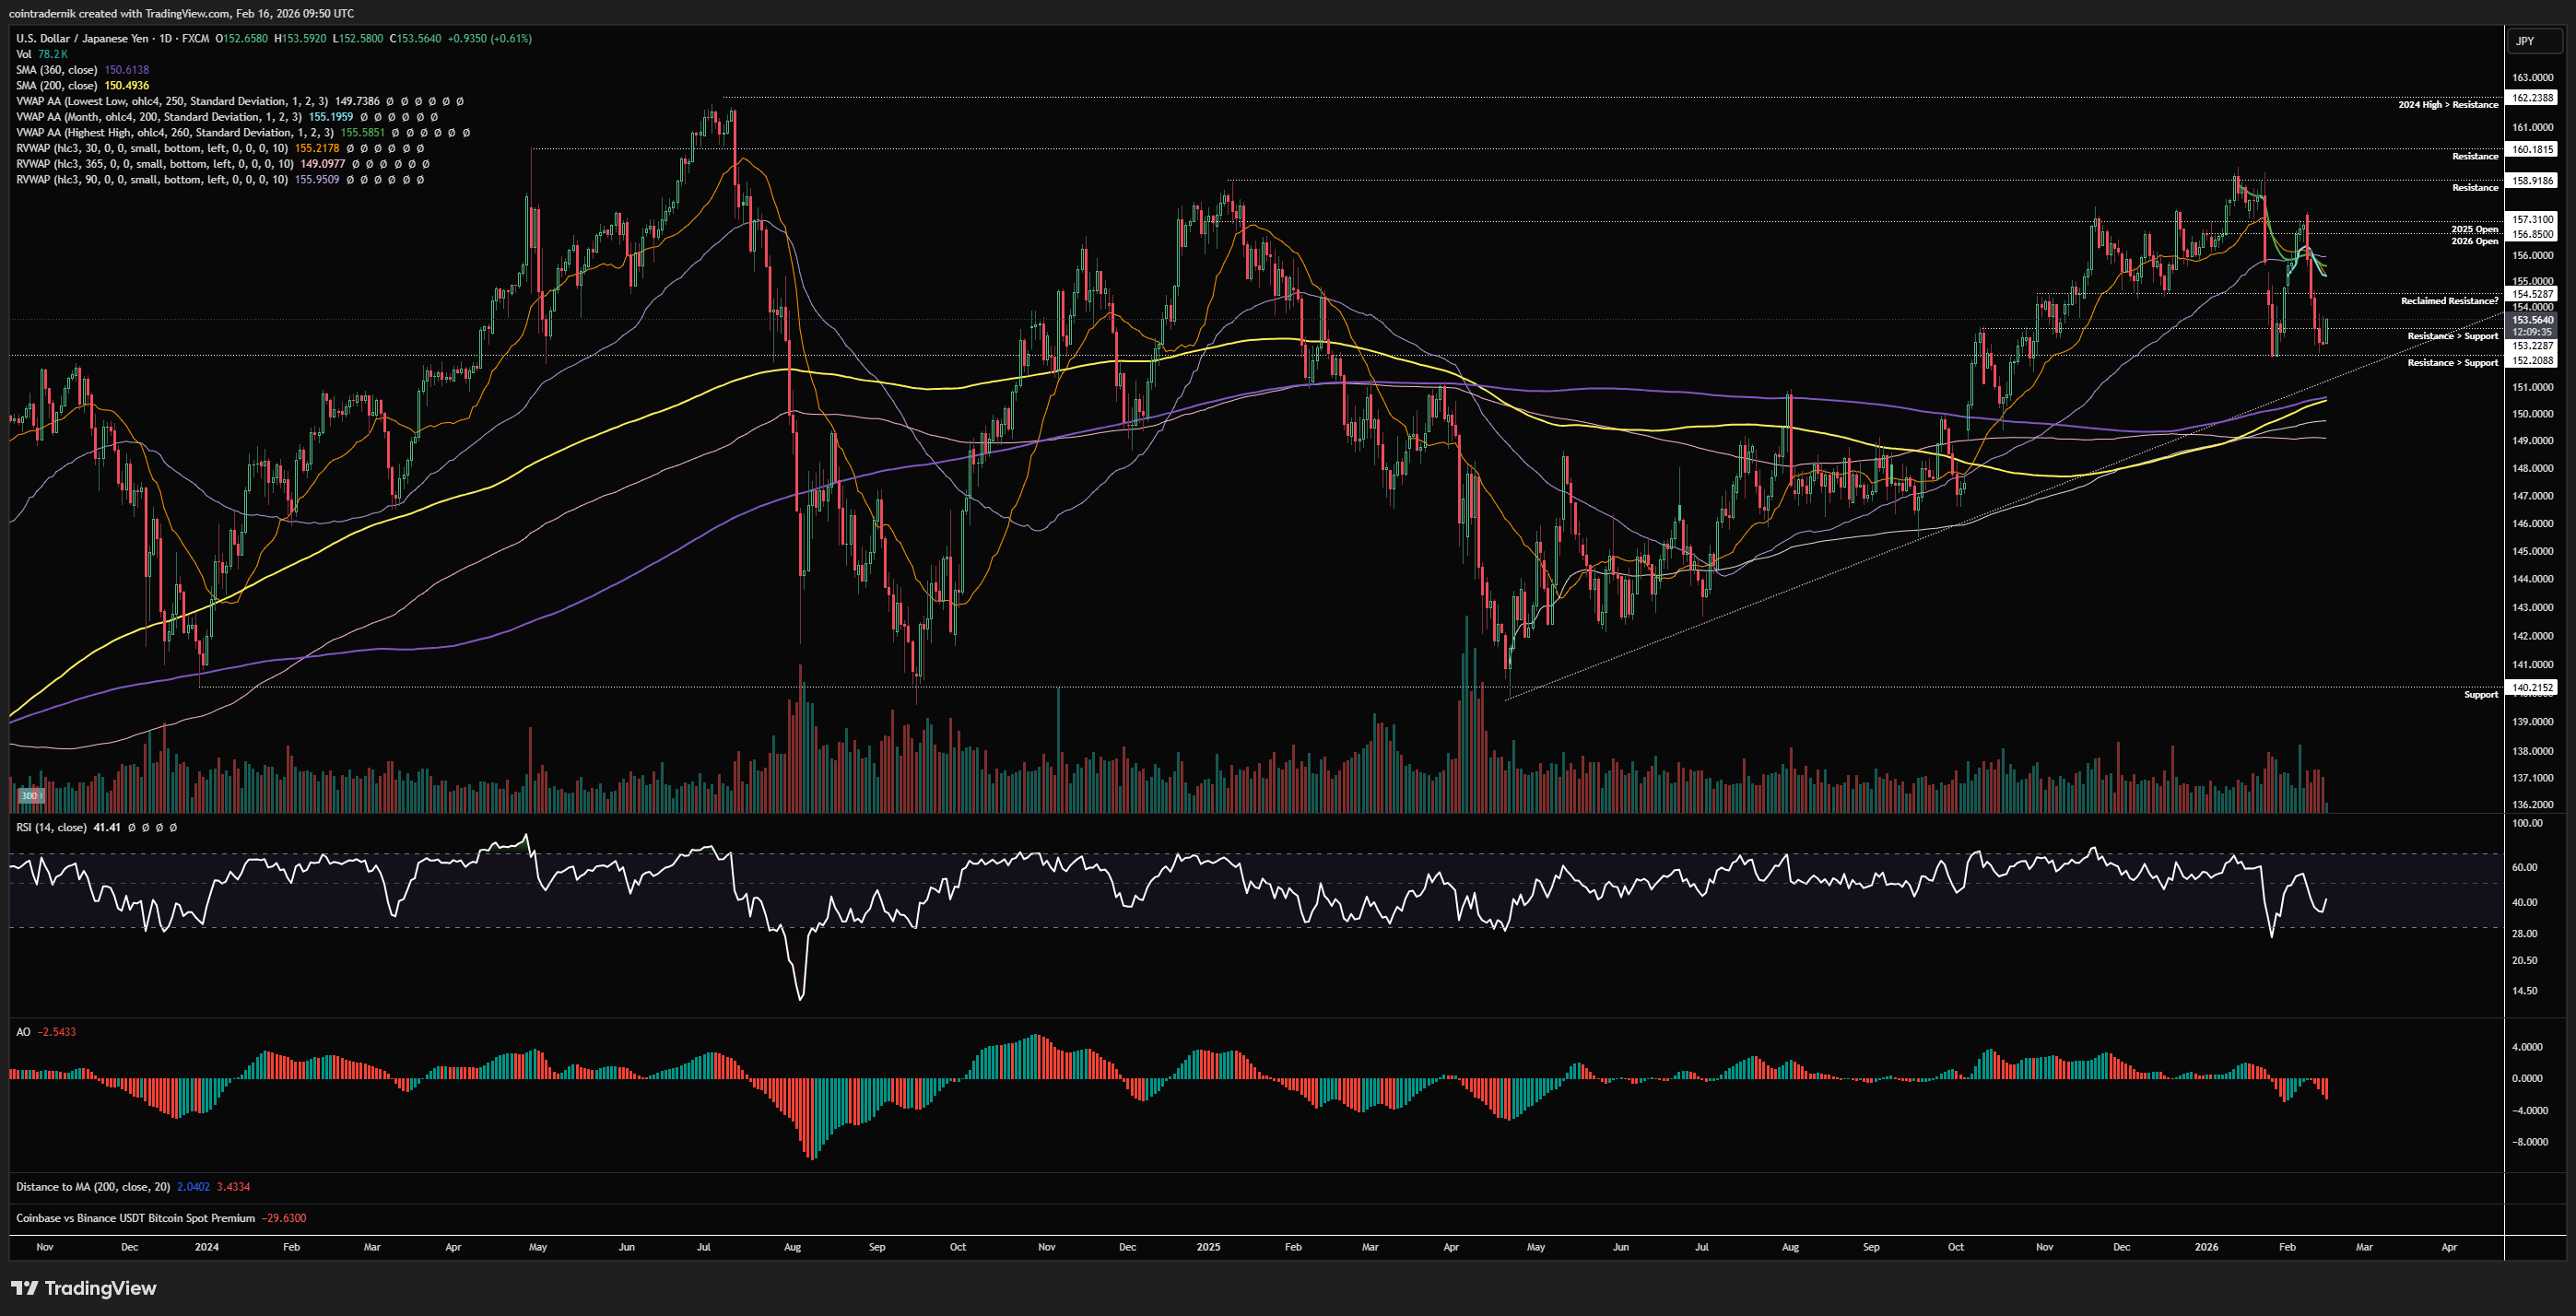
Turning to the daily, we can see that price has thus far formed a higher-low above 152.2 as resistance turned support, with momentum also marking out a higher-low, though obviously with no trend exhaustion to point to. We got the fakeout above the cluster of VWAPS as expected into a deviation above the 2025 and 2026 opens, with price poking through 157.3 before rejecting hard and retracing the entire bounce. This is now where the market shows its hand, in my view, with continued coordination to keep a lid on USDJPY despite the election headlines leading to that news failure, but now price sat above major support. If we reject below that cluster of VWAPS around 155 this week and then break and close below 152, structure is firmly bearish with lower-highs and lower-lows and I would expect 149-150 to act as major support on the subsequent leg lower. As mentioned above, if we lose that support into the 365d rolling VWAP at 149, the probability we retrace the entire run off the April lows grows materially, and I would be looking to sell rallies below that area towards 140 (and also potentially shifting my view on broader market risk. What I think is the likely path here is consolidation into trendline support and then a grind higher off the 150s towards 157 again, acceptance above which will make it almost inevitable we sweep 159 into 160, which has capped price for much of the past two years.
Price: $0.708
Weekly:
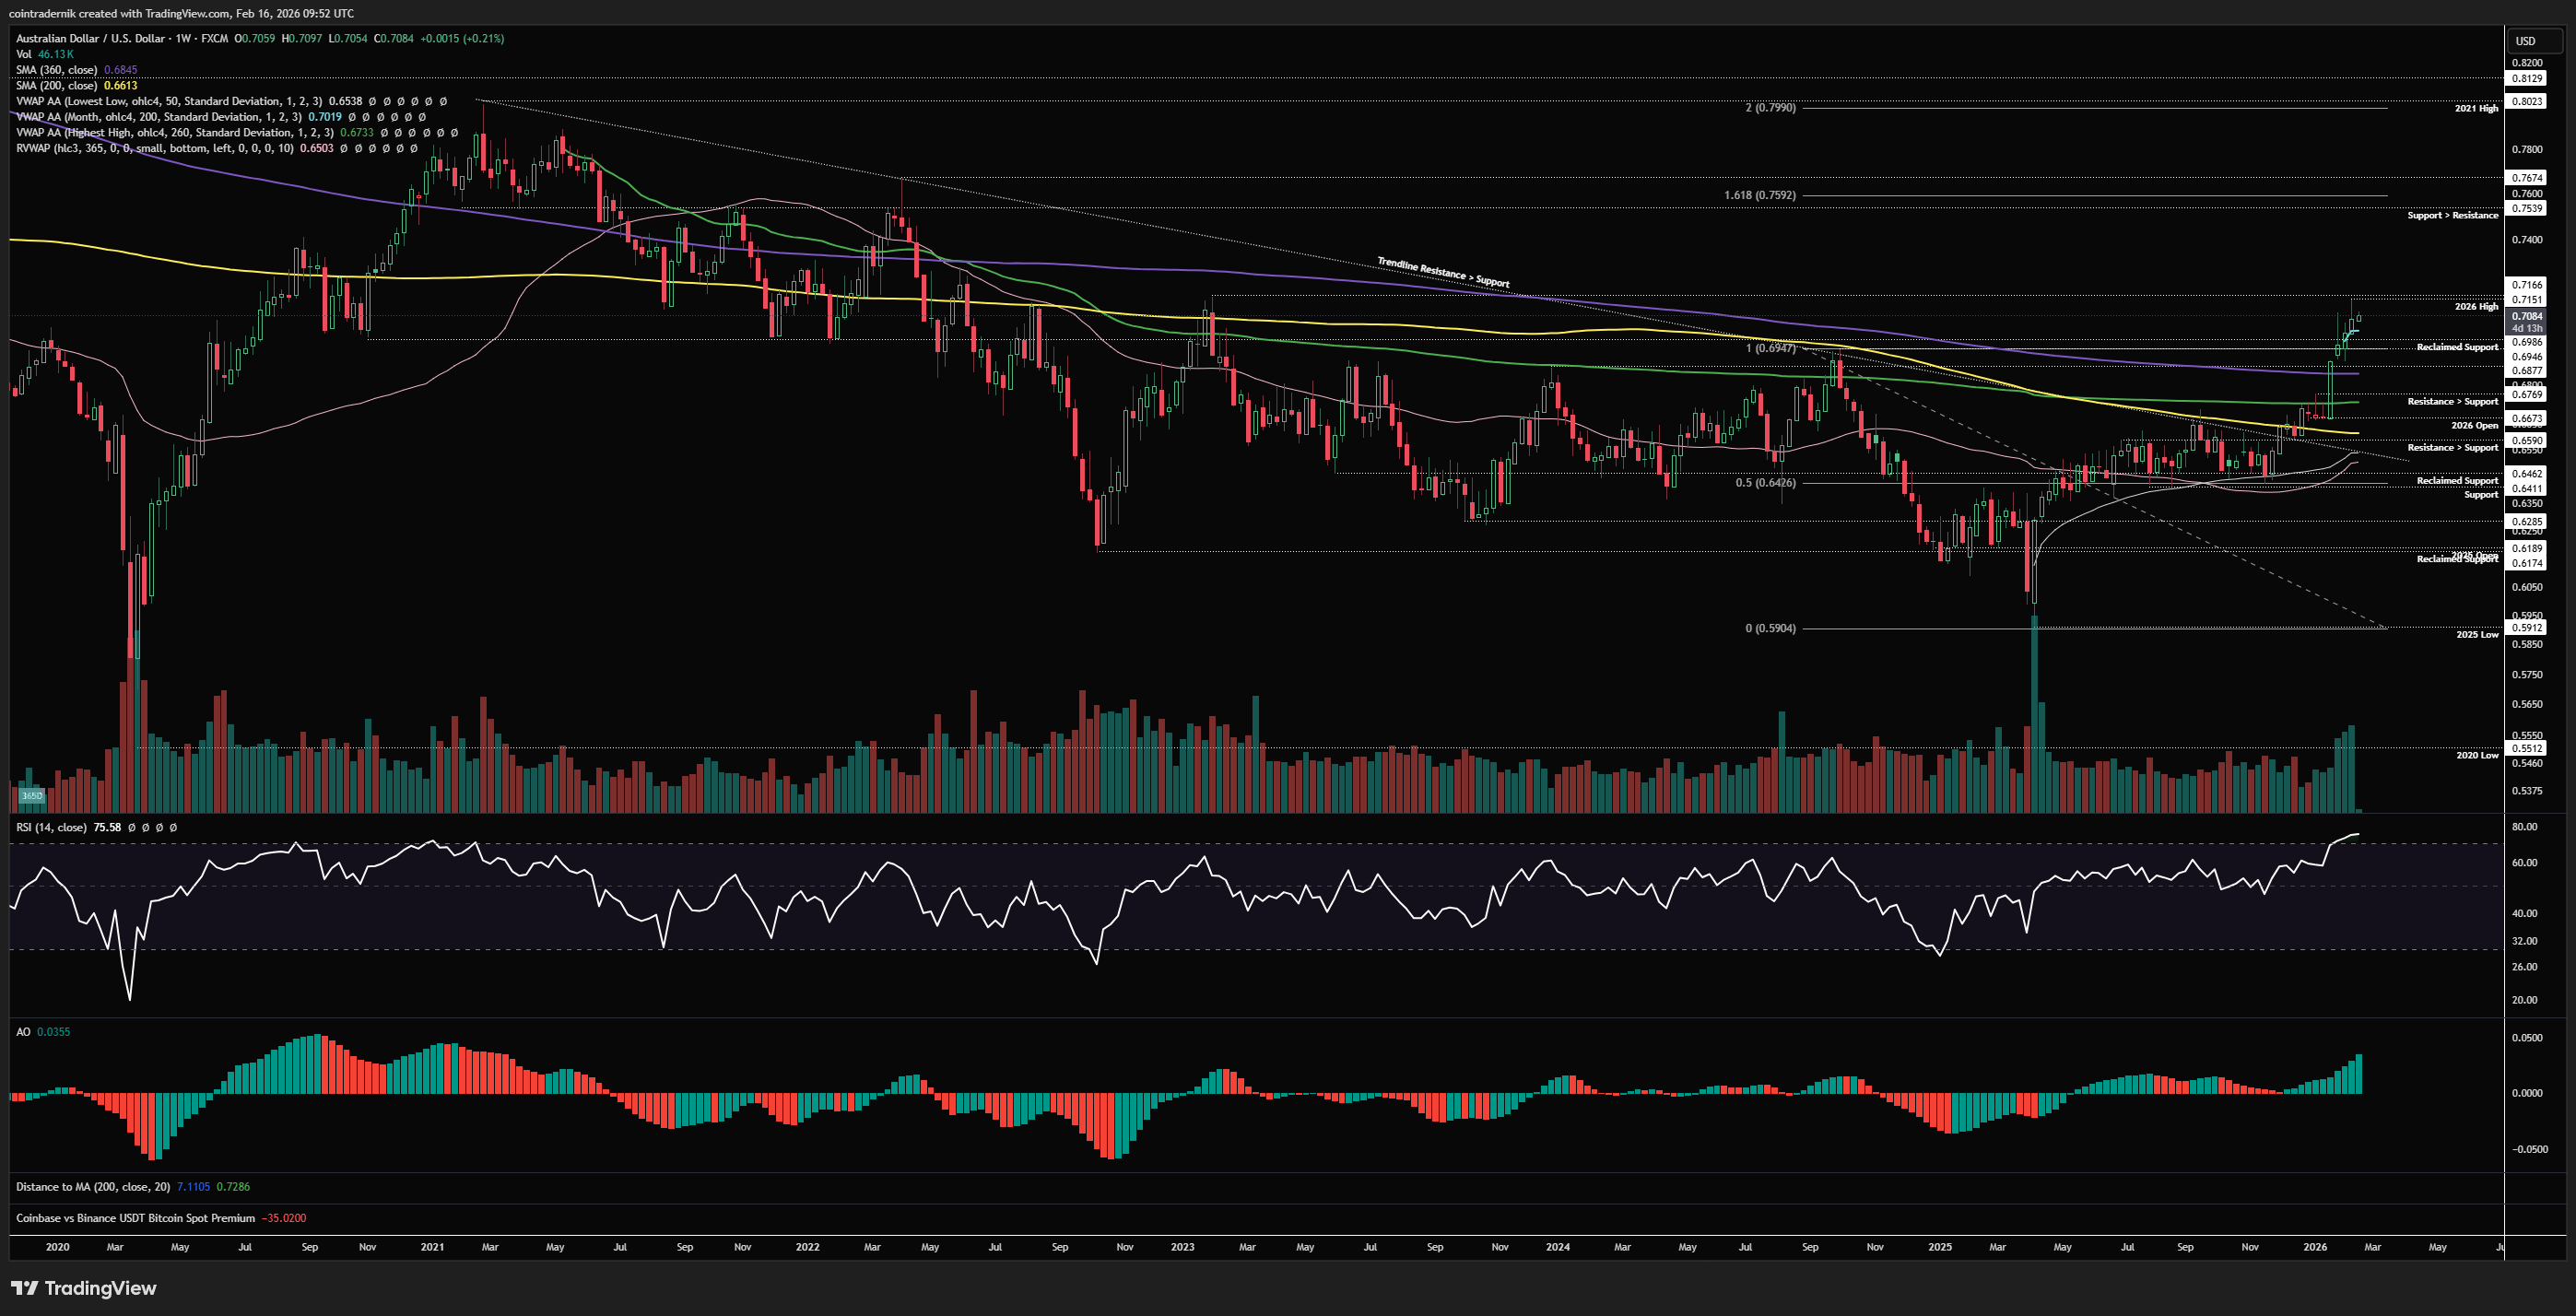
Beginning with the weekly for Aussie, we can see that the pair continues to perform well, having broken out of multi-year resistance, pushed into fresh 2026 highs at $0.715 as of last week and rejected, now consolidating above the Feb VWAP at $0.702 and well above prior resistance turned support. There is little on the higher timeframes that is bearish AUDUSD, but we are now right at the level that preceded a major top 3 years ago, after running hard for several weeks straight. I would not be surprised to see some further chop and consolidation here between $0.70 as support and $0.716 as resistance. Should we close the week above that latter level, turning it into support, in my view there is no major resistance all the way back to $0.75, which is a huge support turned resistance level for the 2021 top - and my H1 target. If we actually break lower here and bears can force this back below $0.70, I would love to go long-hunting in that $0.677 - $0.688 range. Until then, sideways is more probable and I wouldn't be looking to take any entries between these two levels if you are sidelined.
Daily:
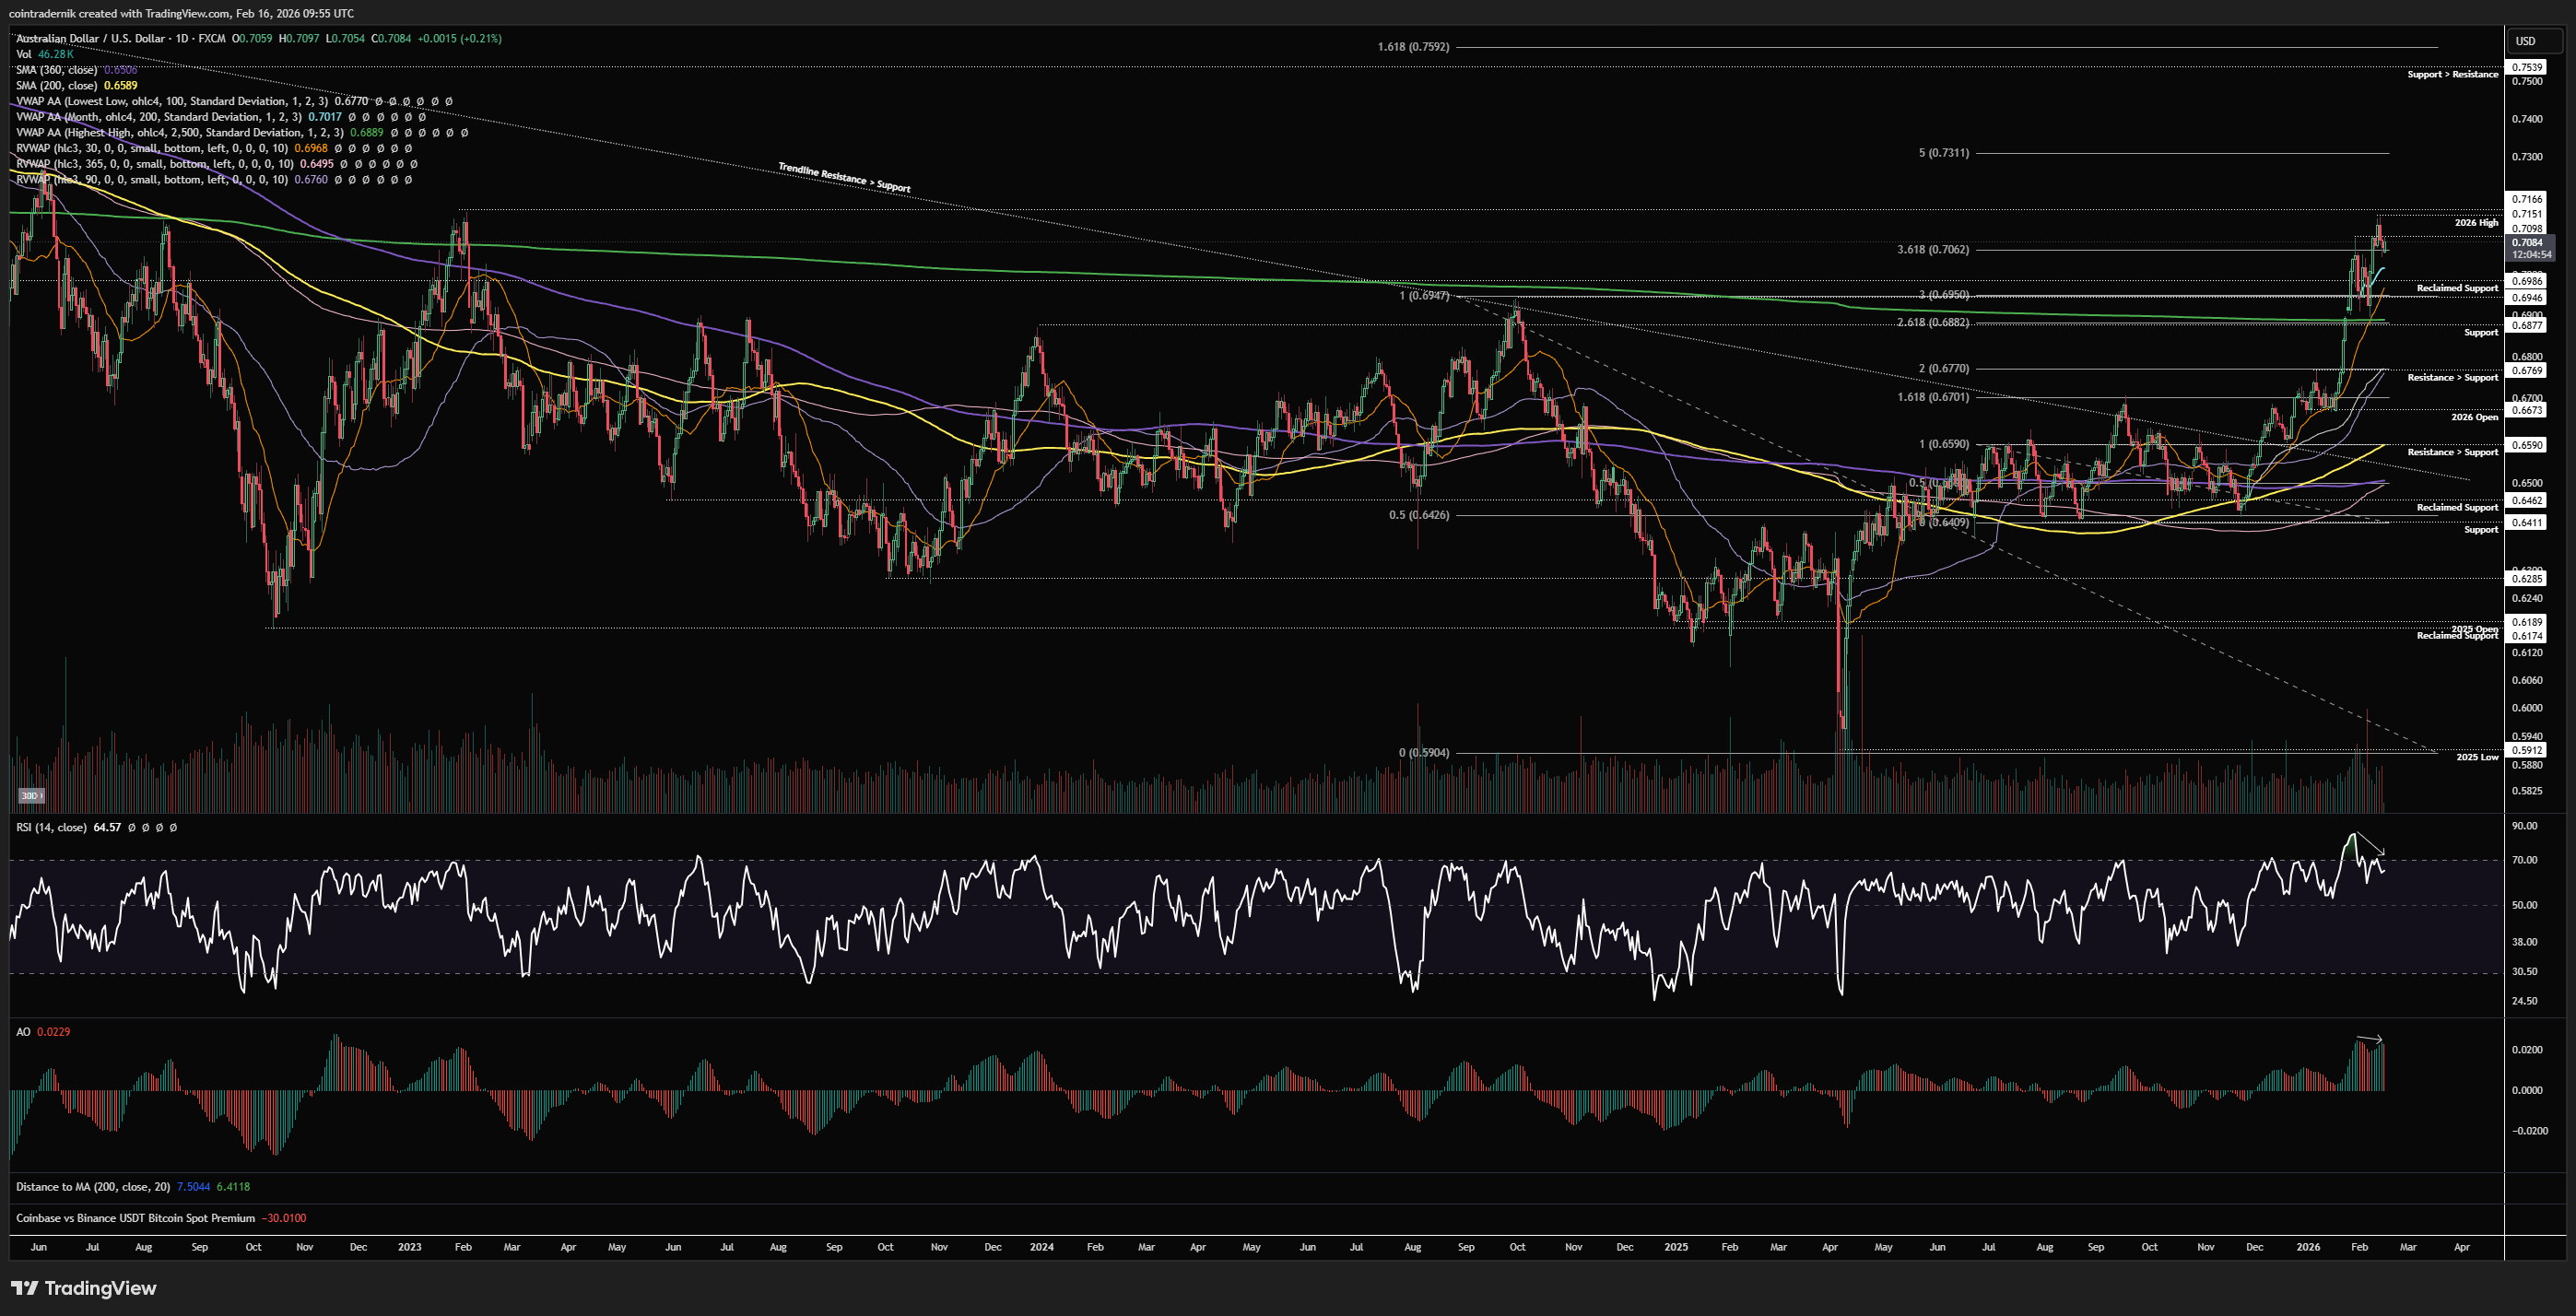
Turning to the daily, we can see that price is also forming some trend exhaustion here into these highs after this strong leg higher through $0.677 resistance. This is confluence for at the very least some consolidation below $0.716, if not a corrective move lower. We should certainly not be jumping into fresh longs here. Now, that said, those who read these Outlooks each week will know that momentum divergences in strong trends often get invalidated, so, if we see price break and close above $0.716 and RSI break above 70 with AO making a higher-high, that's your sign that the trend exhaustion has failed and price is likely to rip higher towards $0.73 as minor resistance, within a broader move towards $0.75. If, instead, price does reject here, a daily close below the Feb VWAP at $0.0702 likely opens up a retest of major support at $0.6877, which is the swing-low that preceded this high and sits right on the anchored VWAP from 2021 highs. If that level gives way, we may be so lucky as to get filled on longs into the 90d rolling VWAP above $0.0677. If you want to be a hero, you could theoretically look for shorts here with invalidation on a daily close above last week's high, but I don't really like that setup given that price could easily mark out another higher-low above the 30d rolling VWAP, so R/R is not ideal - and in strong trends that is actually what we should expect most.
Price: $1.1865
Weekly:
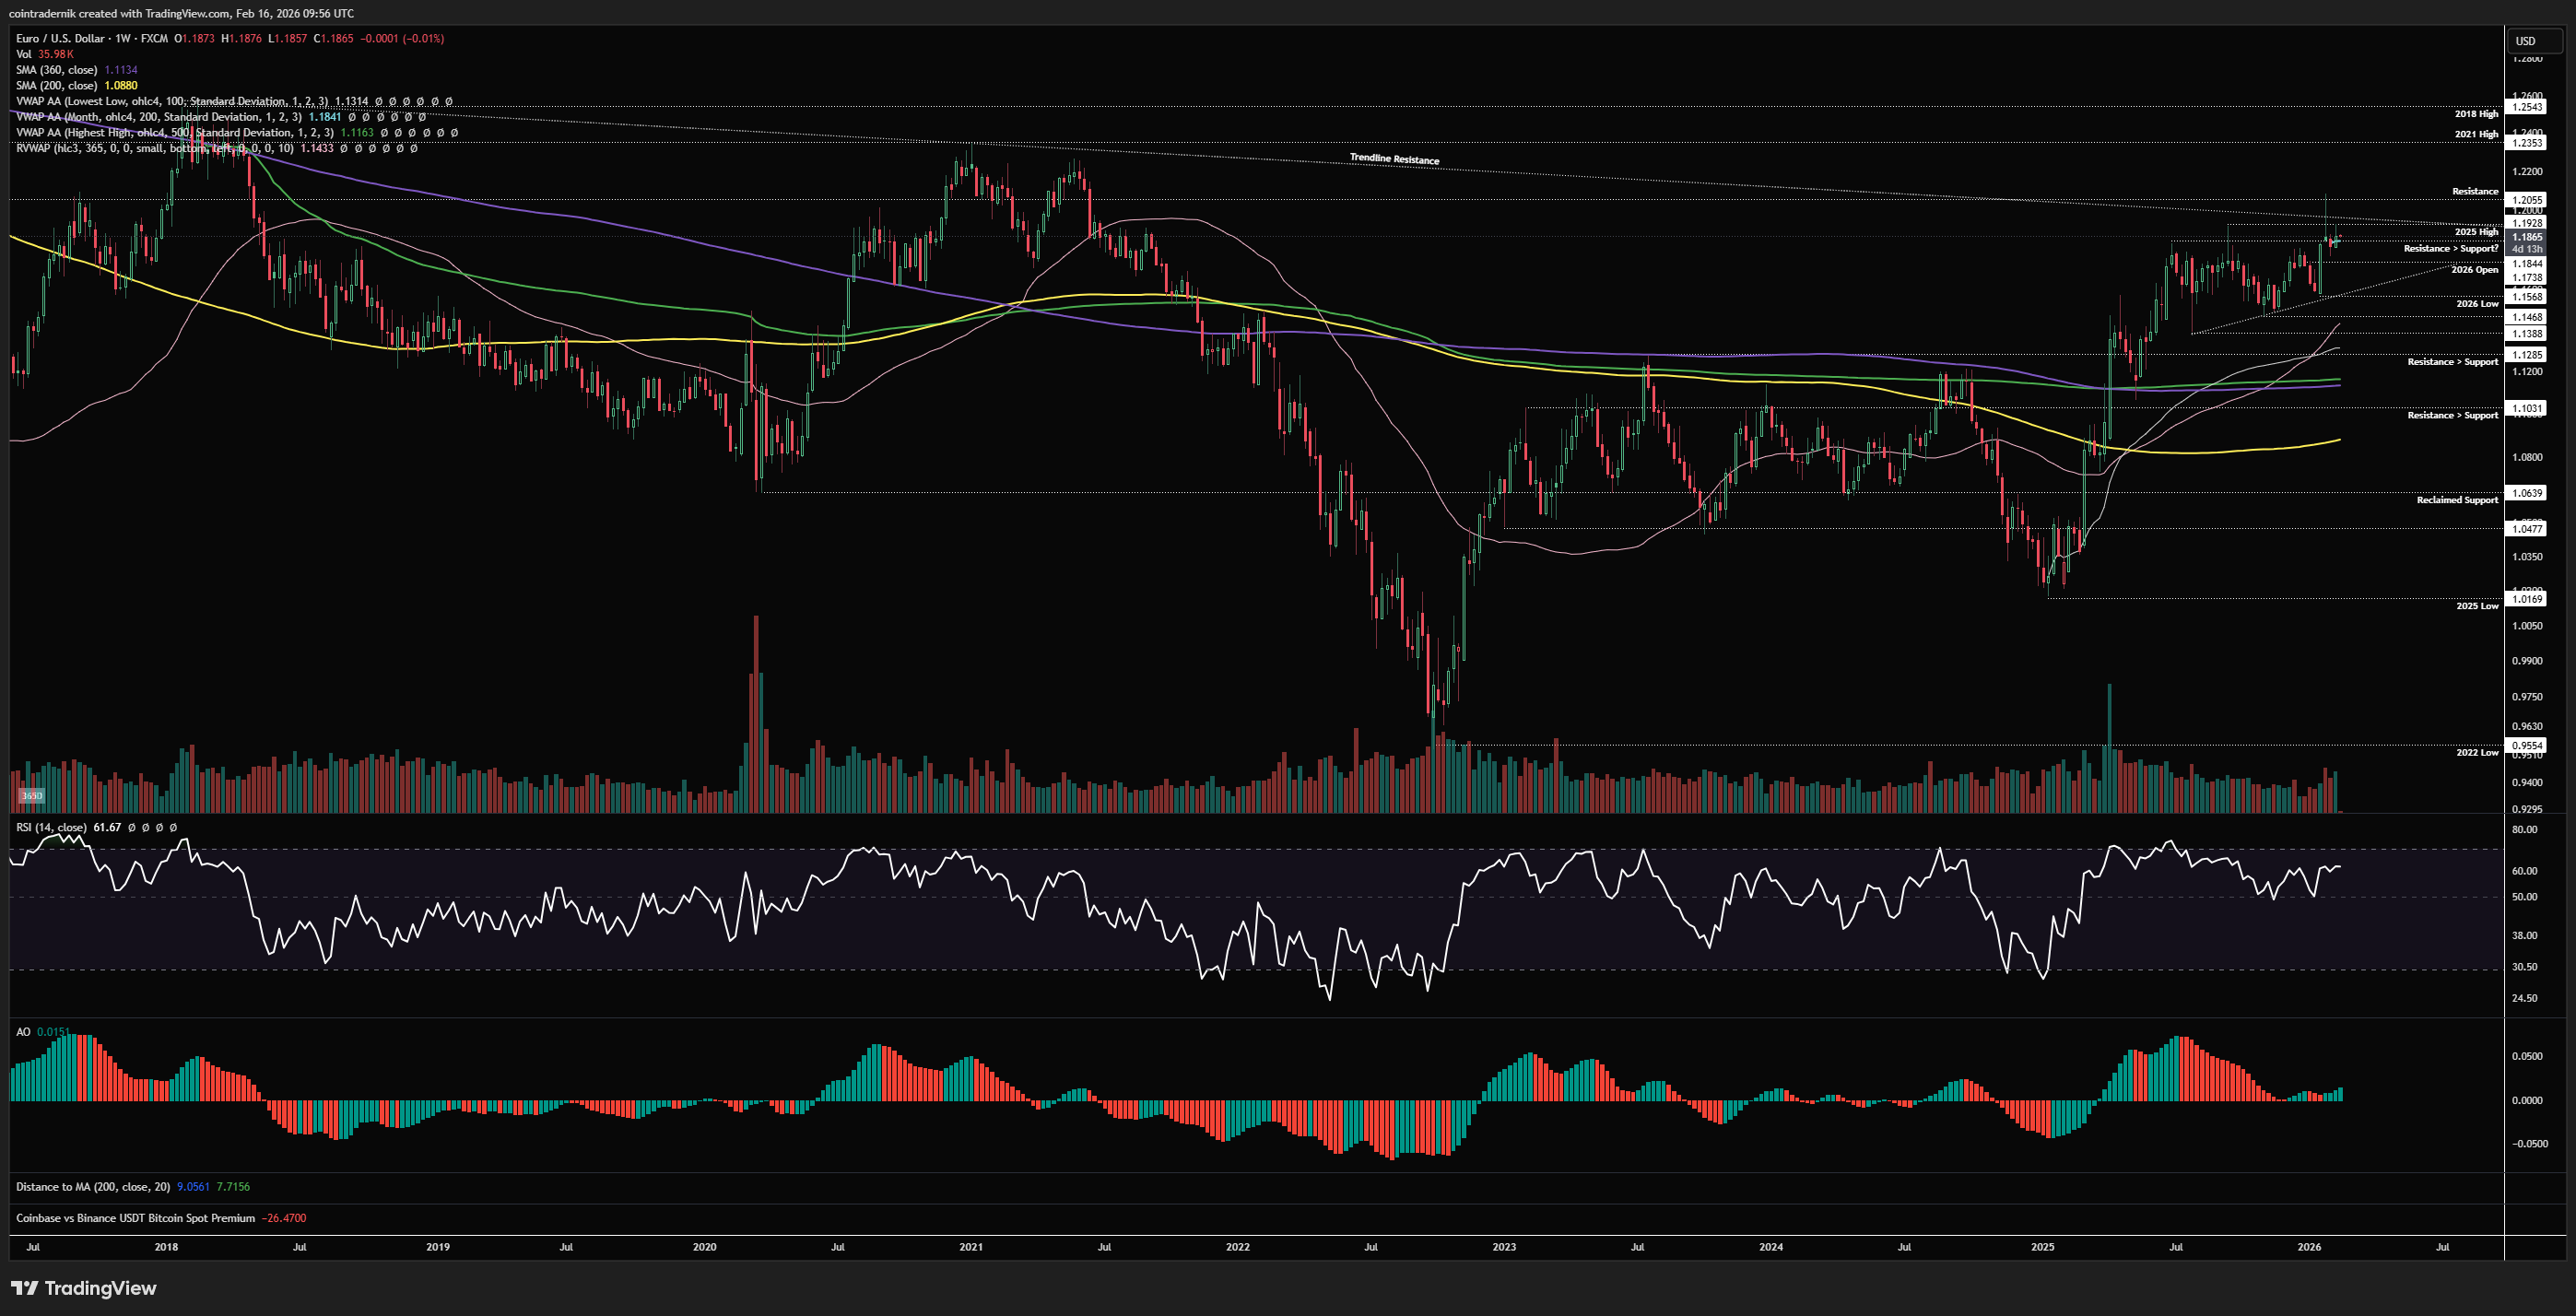
If we begin by looking at the weekly for EUR/USD, we can see that price wicked above multi-year trendline resistance into 1.205 a few weeks ago, rejected and has since been consolidating above the 2026 open at 1.1738 and below the 2025 high at 1.193, with weekly RSI holding above 50 and structure firmly bullish. It remains my view that we still have some upside to see from the pair in early H1, but the continued crowding of the short dollar position is making me less inclined to hold this view if price begins to roll over. Whilst we do still have a bullish trend, and whilst price holds above the yearly open, I am in my (refilled) EUR long from above 60 pips lower. I have already captured over 300 pips so far in 2026 from EUR and I am loathe to give this back with crowded positioning if price fails to break higher here. Momentum is still suggestive of higher prices and I would like to see a weekly close above the 2025 high and through trendline resistance to grow more confident in my expectations of one more leg higher from this ascending triangle-esque consolidation since mid-2025, with the swing-highs around 1.235 my ultimate target for H1 2026. I am now, however, not willing to hold this refilled long if we close the daily below 1.1738. In that scenario, it would look more like a failed breakout and potential reversal back towards the bottom of this consolidation, and the cluster of VWAPs below 1.14. As such, my risk outlay is marginally less than 1/4 of the upside I have already captured playing EUR long, and my upside is significant should we break beyond this resistance cluster. If this becomes a failed breakout and the Dollar looks like its turning, I am very much ready to play the other side, though I am expecting DXY strength to be a story for H2.
Daily:
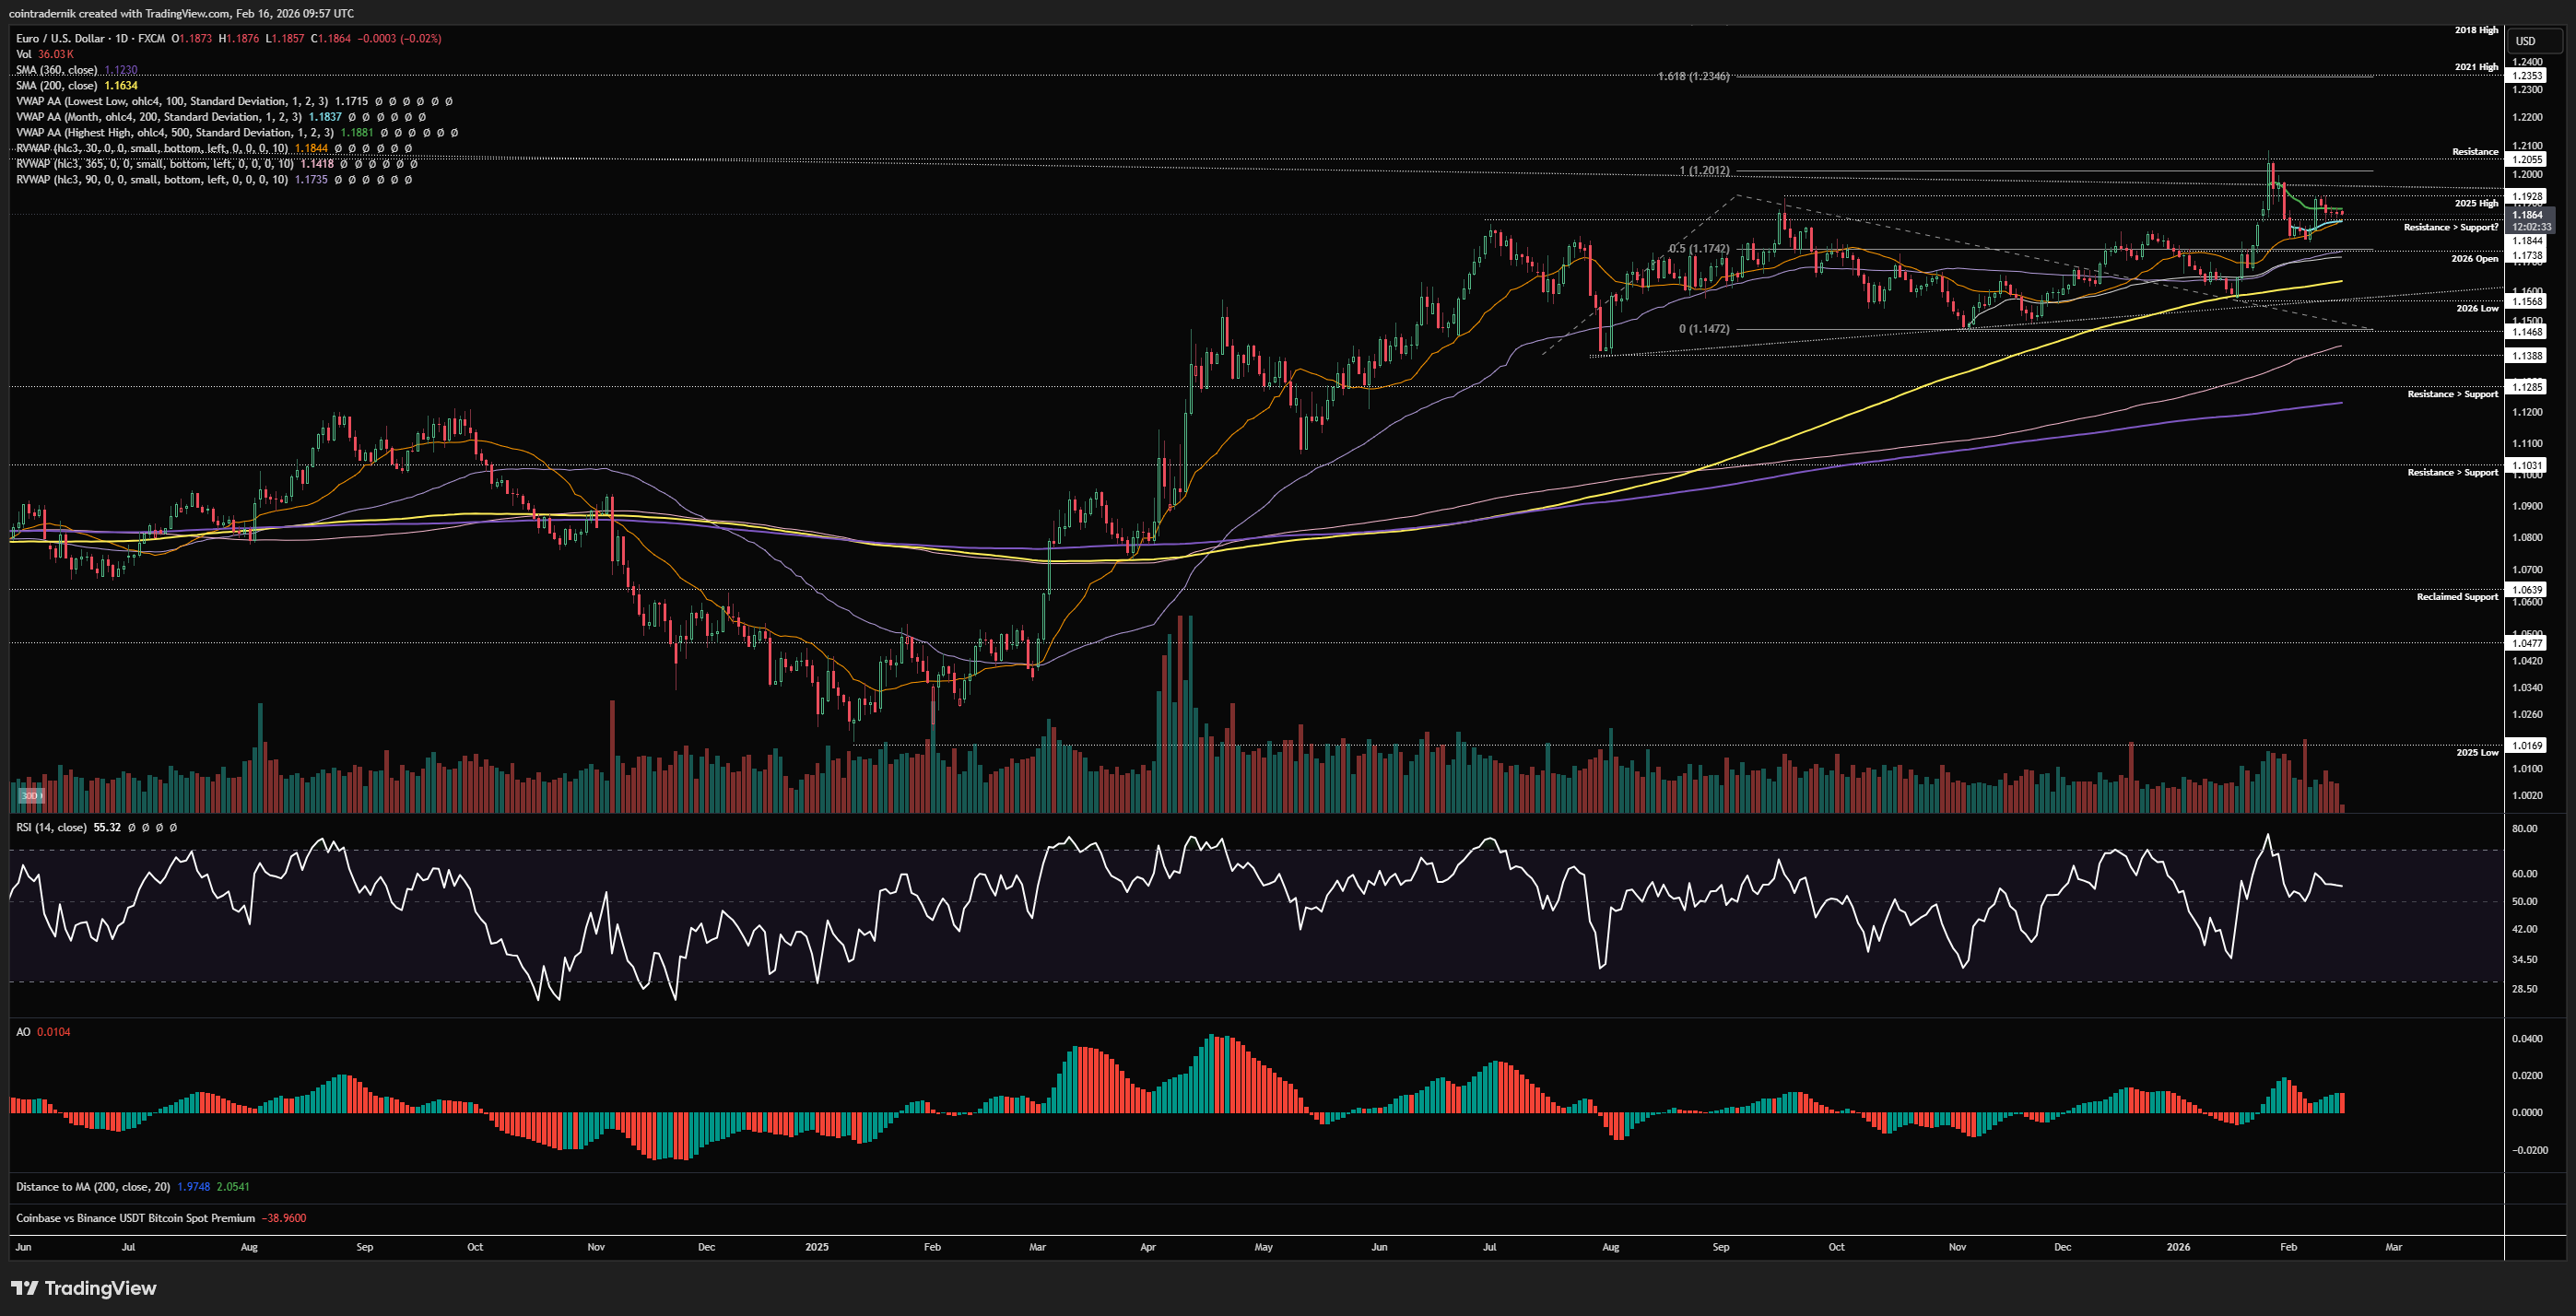
Finally, turning to the daily, we can see that price is holding above the30d rolling VWAP and Feb VWAP here, having marked out that higher-low above the yearly open as expected, which is where I refilled the longs I exited above 1.19. We are now in a tight range between this support cluster and resistance at the 2025 high and anchored VWAP from all-time highs. It is my expectation that the numerous catalysts for this week give us a range breakout either above 1.193 or below 1.184, and if we flip 1.184 into resistance it is likely we retest that yearly open, where we would then have a lower-high formation at 1.193 into that yearly open retest. This would not look particularly promising for the bullish outlook, but I would await a daily close below the yearly open and anchored VWAP from the November 2025 lows before looking to exit, reassessing on any immediate reclaim but likely sidestepping a more meaningful reversal back towards the yearly lows. Acceptance above 1.193 this week = next leg higher through 1.205 towards 1.235.
I hope you've found some value in the read this week - please RT, share, engage etc. if so!
And if you've not already signed up for Ostium, please do so and test out some of the recent updates, including:
Sign up here (you don't have to use my ref link, of course): https://ostium.app/trade?from=CL&to=USD&ref=CTNIK

.avif)