

Market Outlook #68 - American Dynamism
January 12, 2026
-
12
min read


This blog references an opinion and is for entertainment and informational purposes only. It is not intended to be investment advice. Seek a duly licensed professional for investment advice.
In this special edition of the 68th Market Outlook here at Ostium Research, we'll be taking a look at the week ahead in markets, focusing specifically on 'American Dynamism', looking at price-action, positioning and event risk for SPX, NDX, NVDA, PLTR and Copper.
Now, let's take a look at this week's stacked calendar, with plenty of inflation data and Fed speeches throughout the week:
MONDAY: VARIOUS FED SPEECHES
TUESDAY: US ADP EMPLOYMENT CHANGE (4 WEEK AVG): (CONSENSUS N/A VS PREVIOUS 11.5K)
TUESDAY: US CONSUMER PRICE INDEX (YOY) (DEC): (CONSENSUS 2.7% VS PREVIOUS 2.7%)
TUESDAY: VARIOUS FED SPEECHES
WEDNESDAY: US PRODUCER PRICE INDEX EX FOOD & ENERGY (YOY) (DEC): (CONSENSUS N/A VS PREVIOUS 2.6%)
WEDNESDAY: US RETAIL SALES (MOM) (NOV): (CONSENSUS 0.4% VS PREVIOUS 0%)
WEDNESDAY: VARIOUS FED SPEECHES
THURSDAY: US INITIAL JOBLESS CLAIMS: (CONSENSUS 208K VS PREVIOUS 208K)
THURSDAY: US NY EMPIRE STATE MANUFACTURING INDEX (JAN): (CONSENSUS 1 VS PREVIOUS -3.9)
THURSDAY: US PHILLY FED MANUFACTURING SURVEY (JAN): (CONSENSUS -5 VS PREVIOUS -10.2)
THURSDAY: VARIOUS FED SPEECHES
FRIDAY: US INDUSTRIAL PRODUCTION (MOM) (DEC): (CONSENSUS 0.2% VS PREVIOUS 0.2%)
FRIDAY: VARIOUS FED SPEECHES
Now, let's dig into asset-specific price-action for the week ahead, looking firstly at SPX:
Price: $6933
Weekly:
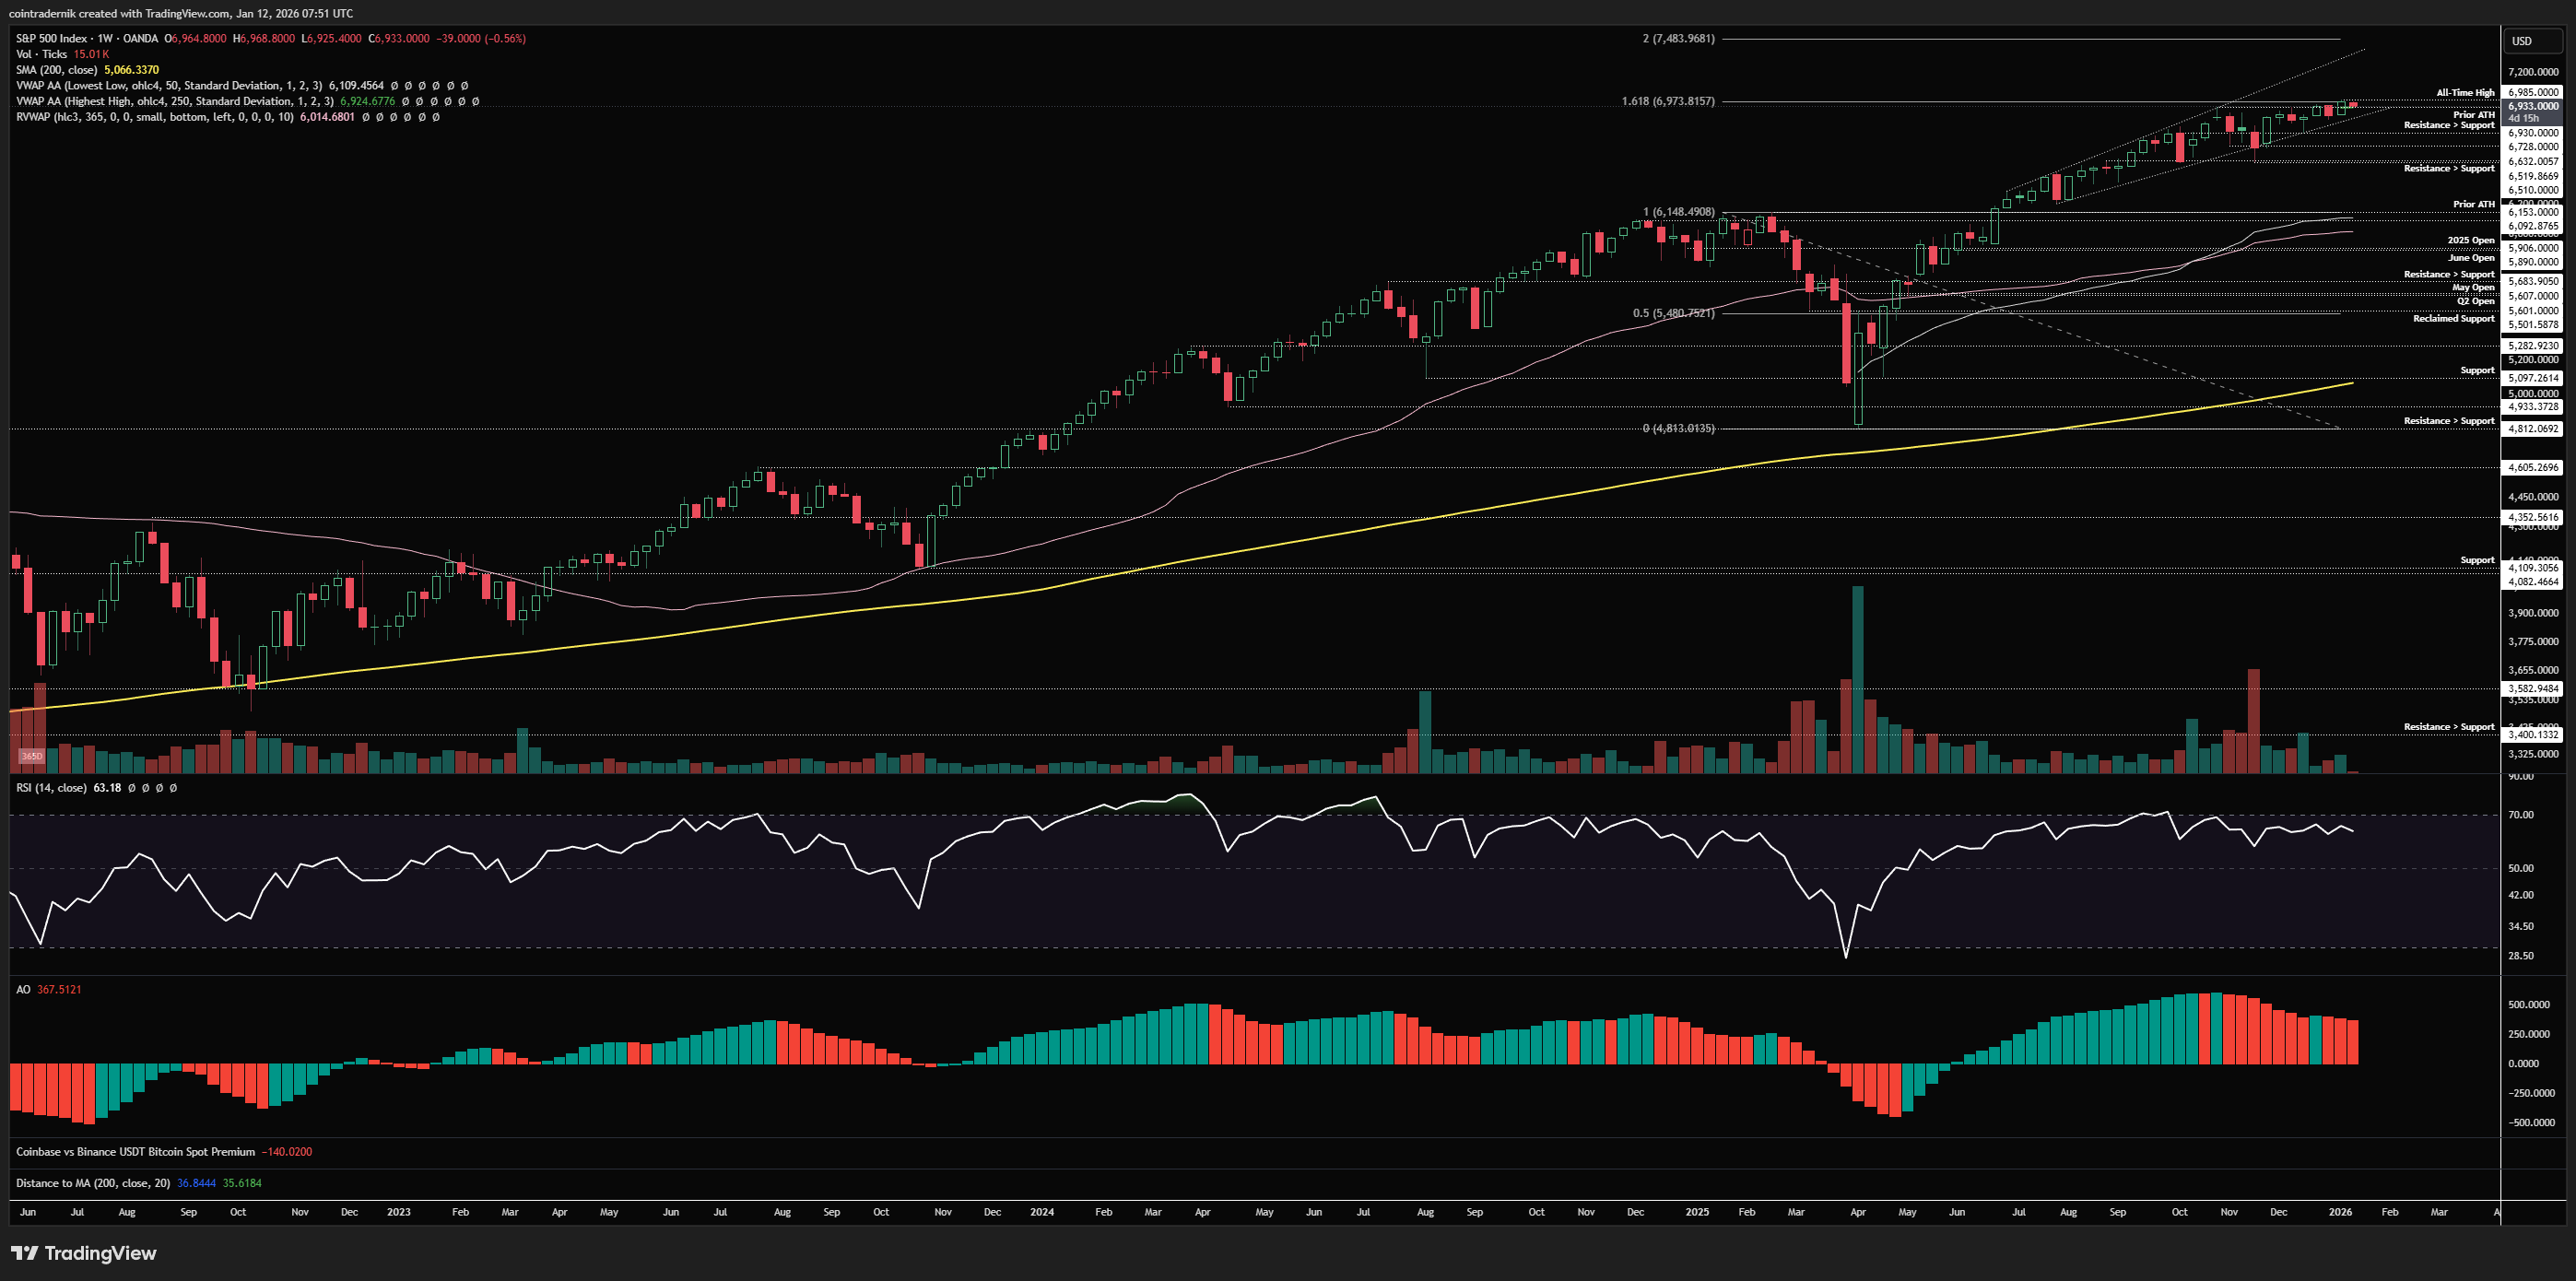
If we begin by looking at the weekly timeframe for SPX, we can see that price made new all-time highs last week at $6985, pushing above the prior high and closing the week as a bullish engulfing of the previous weekly range. Weekly momentum is still tepid here, however, and if we were to see another push above the highs followed by rejection and a weekly close below last week's low, then things begin to look shaky short-term, where I would subsequently expect price to retest (and likely sweep) the support at $6730. Only if that level gives way do I think we have a bigger problem on hand for SPX, where flipping $6730 back into resistance would make it very likely we test $6500 support for the third time - and that's not a setup I'd be keen to have exposure for nor look to bid. Until then - and whilst we remain above all key support levels with price having closed at new highs - we should continue to expect momentum to build as price breaks out of this range, leading to the next leg higher towards the 200% extension of the tariff crash at $7480, below which I expect SPX to put in a multi-week and maybe multi-month top some time before June. It's from up near that level that I think the probability of a 10-15% correction is higher before continuation towards $8000 into 2027 - but that's a long way away and many things can change between now and then.
Daily:
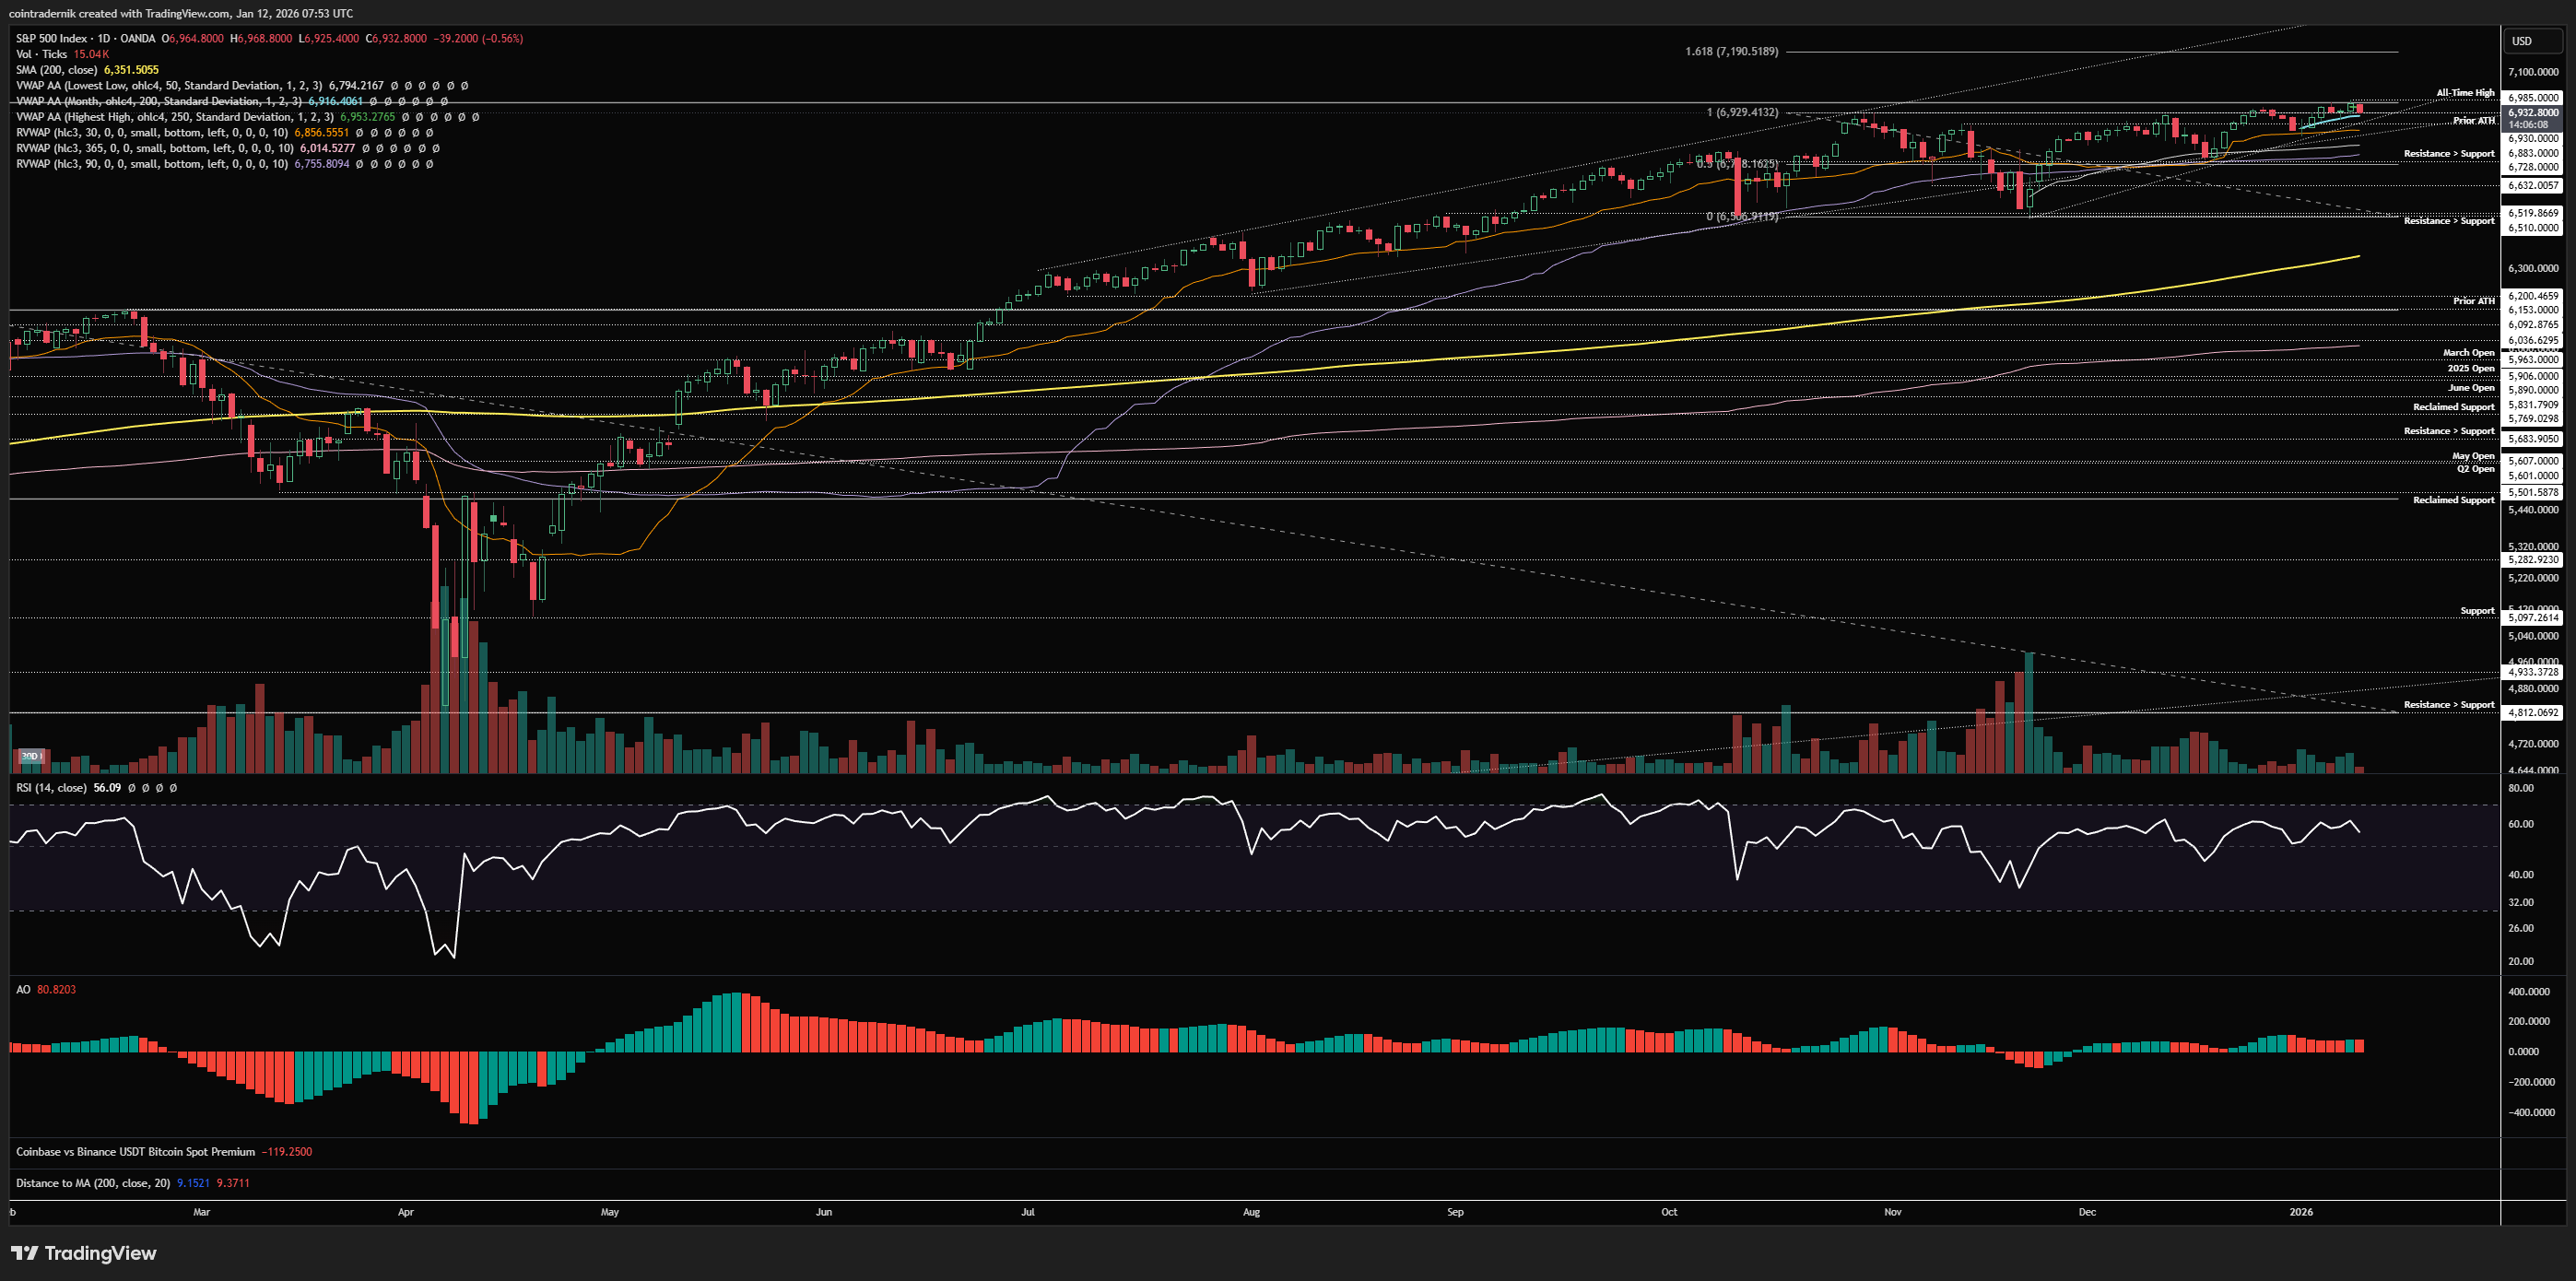
Now, dropping into the daily, we can see that price had been capped by $6930 as resistance since late October, only now beginning to flip that prior high as support as it emerges from this multi-month range, with higher-lows forming on the corrections within a broader ascending triangle-esque pattern. Many times, these patterns see false breaks before real moves occur, and so it would not surprise me to see us sweep the trendline and the 30d rolling VWAP into the anchored VWAP from the November low at ~$6800. That would be an opportunity to get long for the real breakout beyond $7000, with $7190 as the first major target, as it is the 1.618 extension of this range. Momentum is building here and there is no trend exhaustion into these highs, so if we don't get that fakeout lower then bidding the next pull-back after a clean break above last week's high is likely a high probability bet on continuation. Can't be bearish until we start breaking structure...
Price: $25,586
Weekly:
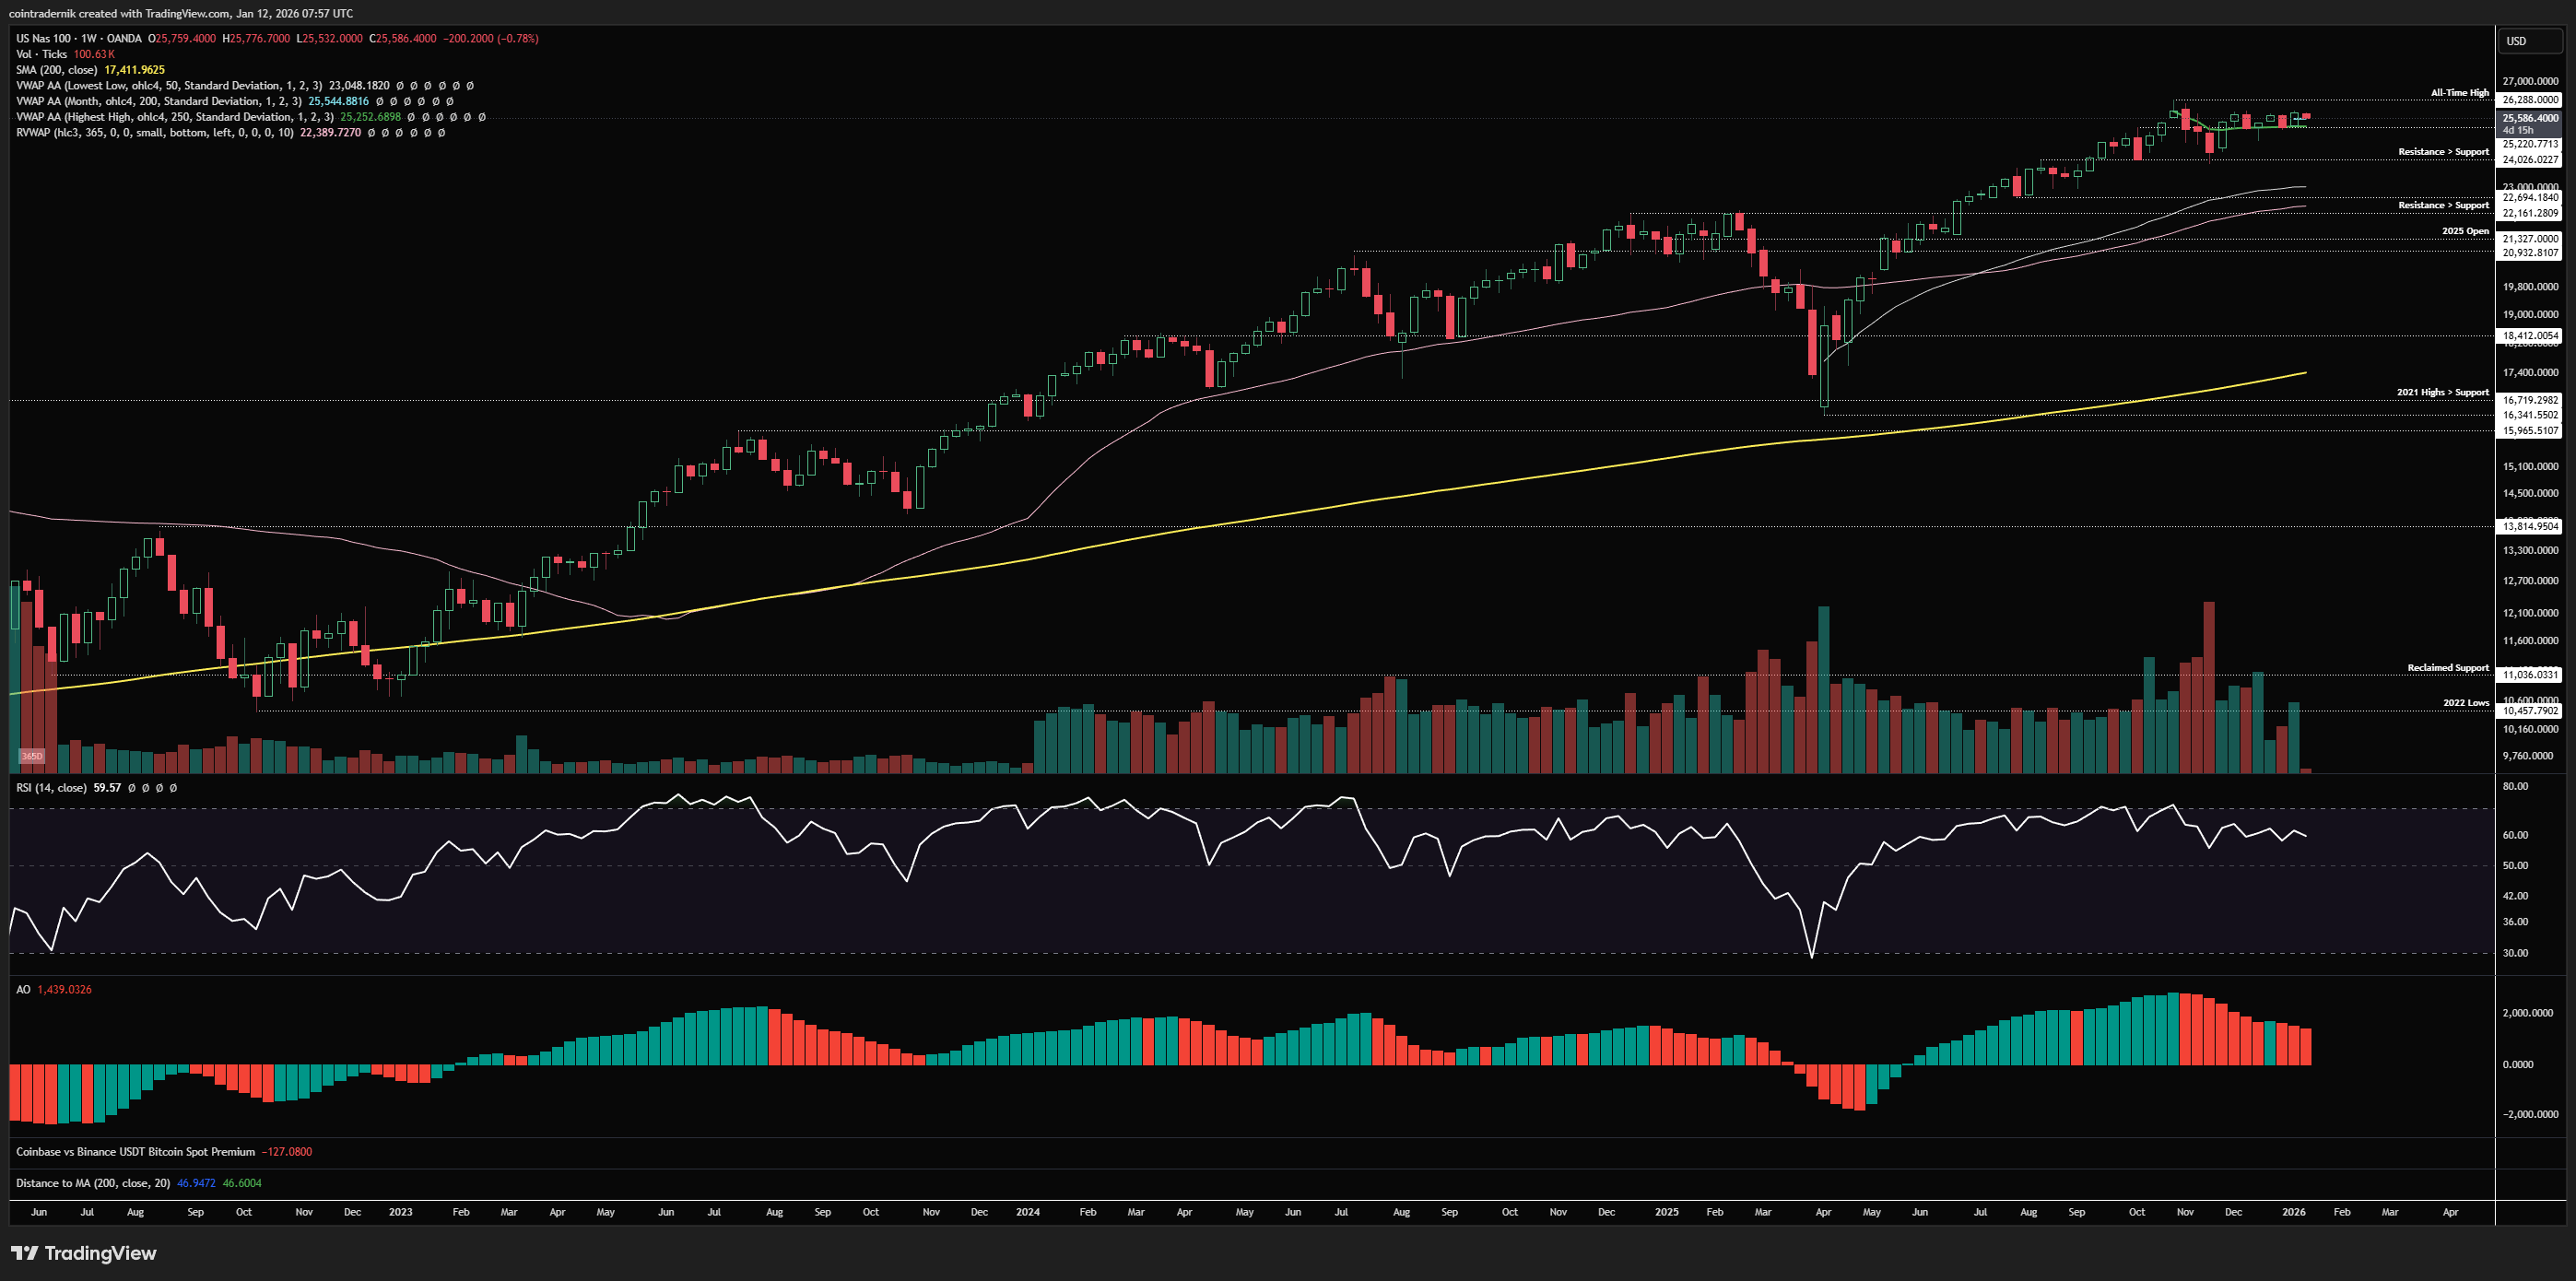
Beginning with the weekly for the Nasdaq 100, we can see that it is lagging SPX a tad, having made that all-time high in late October at $26,288, then broke lower and corrected into prior resistance turned support at $24,000, marking out a durable low there from which it has reclaimed $25,220 as support, and subsequently traded sideways for two months, marginally above the anchored VWAP from the all-time high. Given this sideways price-action, momentum has been very choppy here, but it is interesting to note that even prior to the formation of this tight range we had no trend exhaustion into the highs, unlike in Q4 2024 -> Q1 2025. We are well above the anchored VWAP from the tariff lows and, much like SPX, whilst we have bullish structure we should expect continuation here, irrespective of whether NDX continues to lag. If we break and close above $26,300, I do think that alongside SPX $7xxx ignites a less pessimistic and uncertain leg of the bull market than we saw all of 2025, post April crash.
Daily:
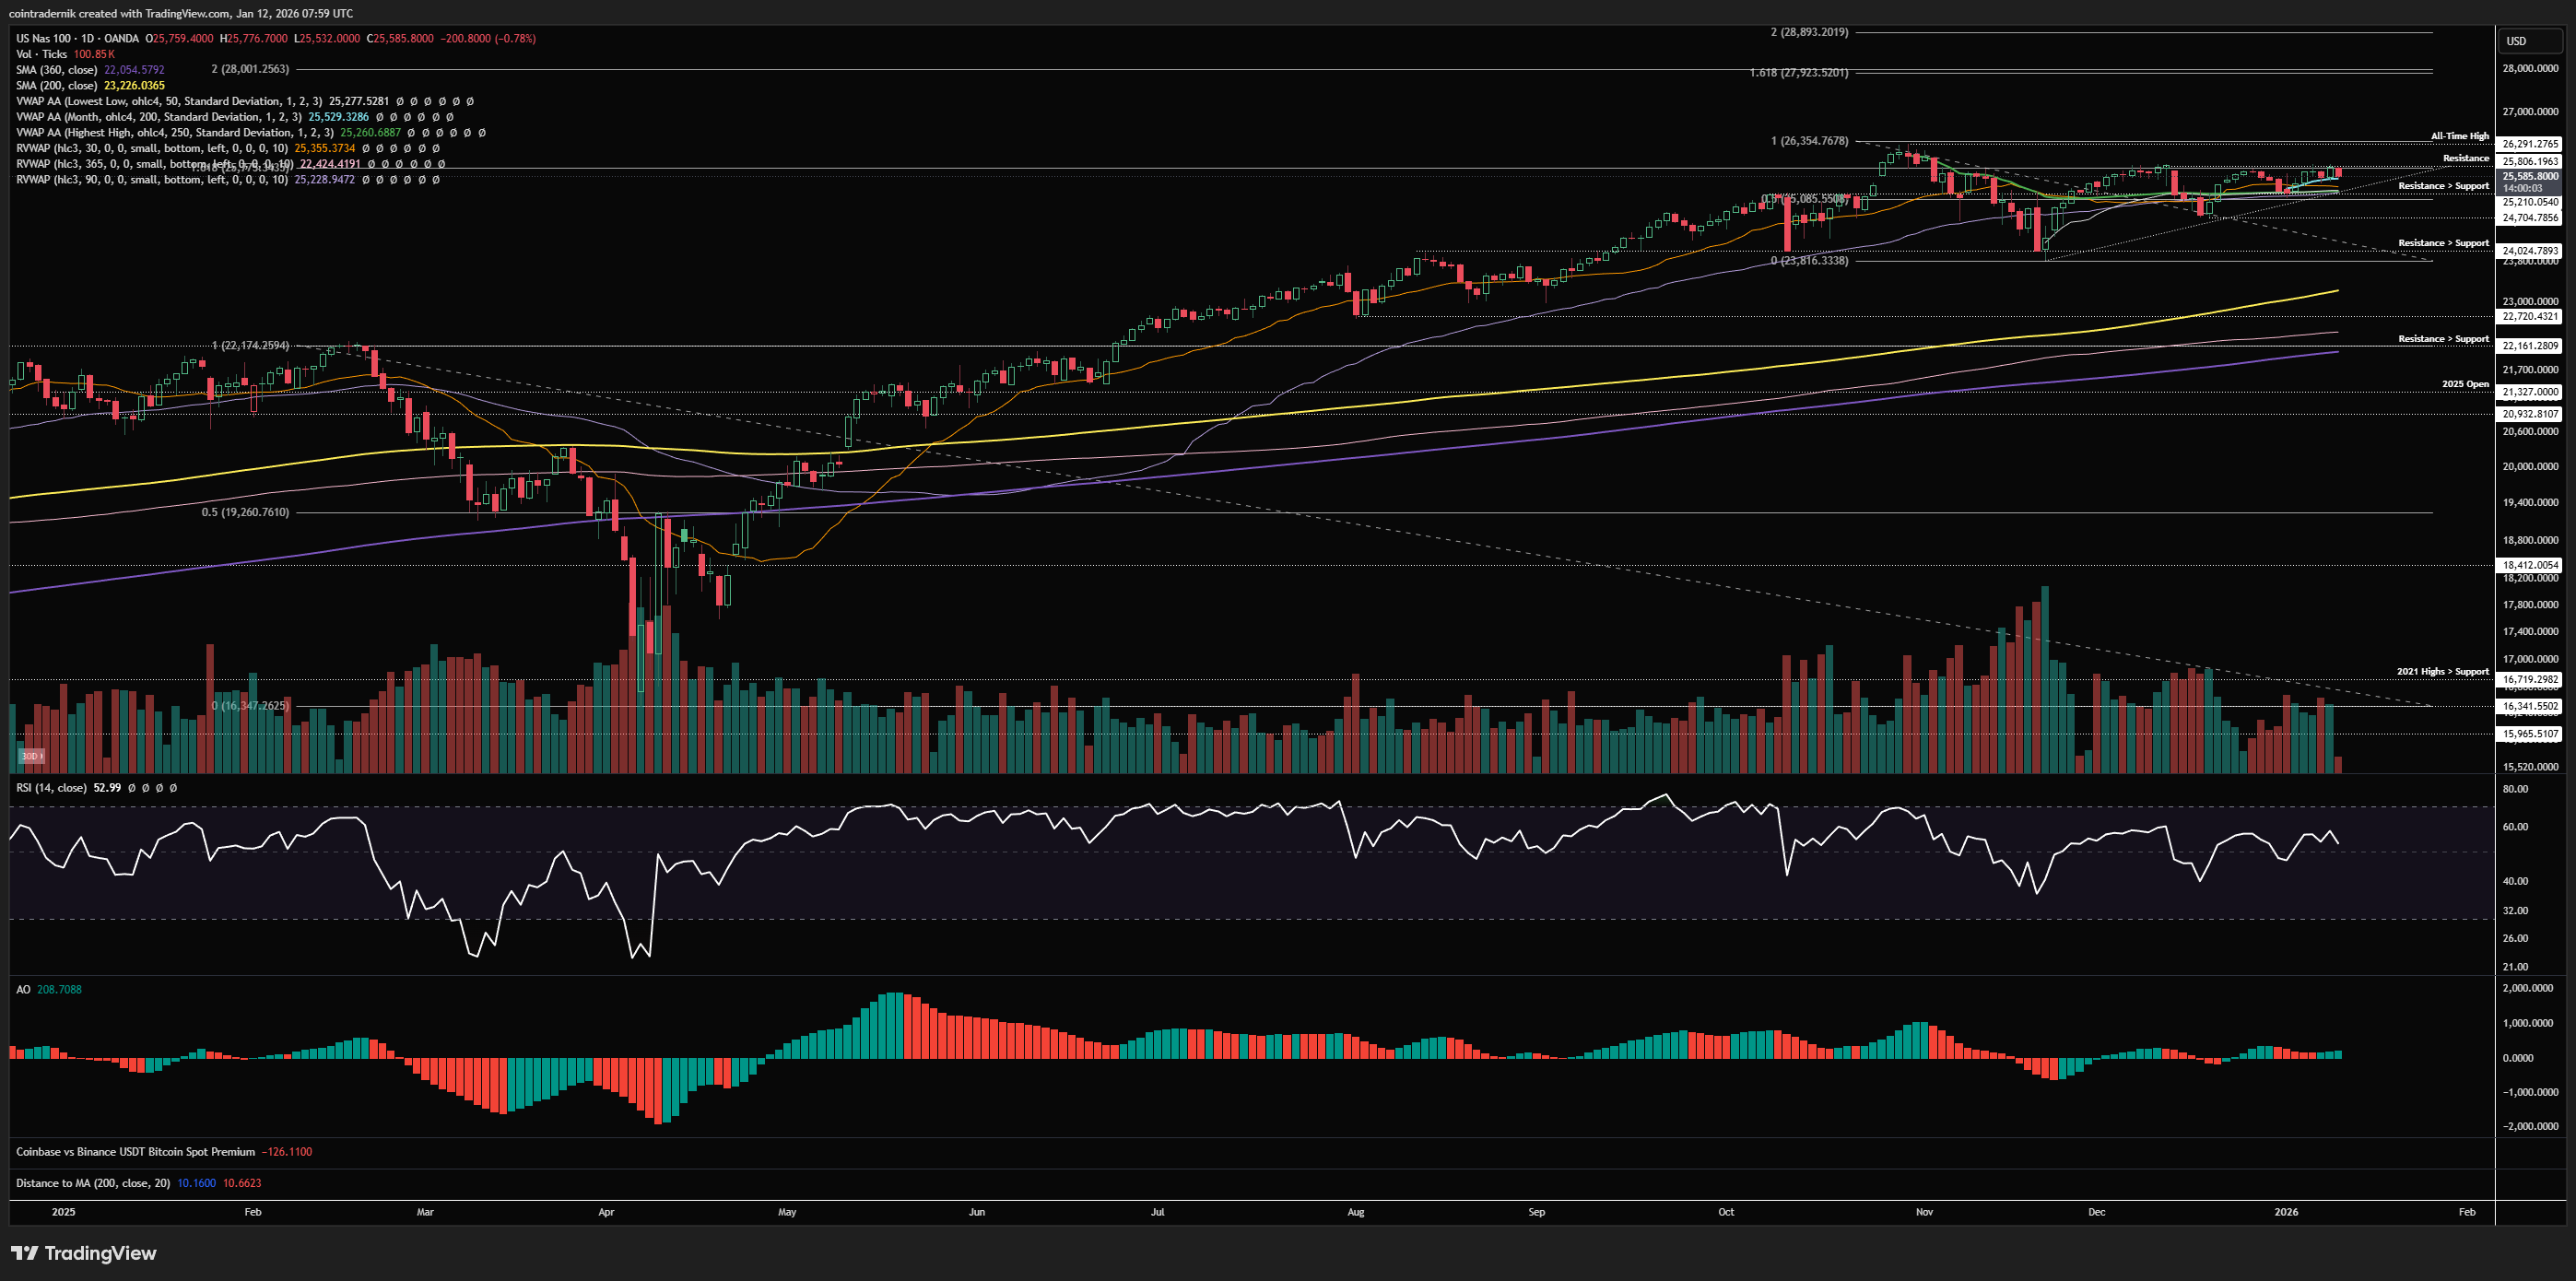
Turning to the daily, again like SPX we can see that higher-lows are forming within an ascending triangle pattern, but this time with $25,800 as resistance below the all-time high. Price is currently trading above the mid-range at $25,085, as well as above the 30d rolling VWAP, 90d rolling VWAP and anchored VWAP from that November low. None of this is bearish - however, were we to break and close below $25,085, flipping that level into resistance, we have bearish structure and the potential formation of a lower-high. This would then open up $24,700 to be retested, a break of which leads to that $24,000 level being tested for the third time - like $6500 on SPX. Again, this would not be a promising setup for the mid-term outlook, and I would not be looking to bid the next test of that support. For now, however, the setup remains bullish. We have bullish structure on the weekly and daily timeframes, and price is above multiple key levels, consolidating right around resistance. If we get a false break of the trendline and then a reclaim, that would be a nice long for $26,300, followed by $27,900 as the next likely resistance, given its confluence as the 1.618 extension of the range, as well as the 200% extension of the tariff crash.
Receive the latest updates directly to your inbox

Price: $184.86
Weekly:
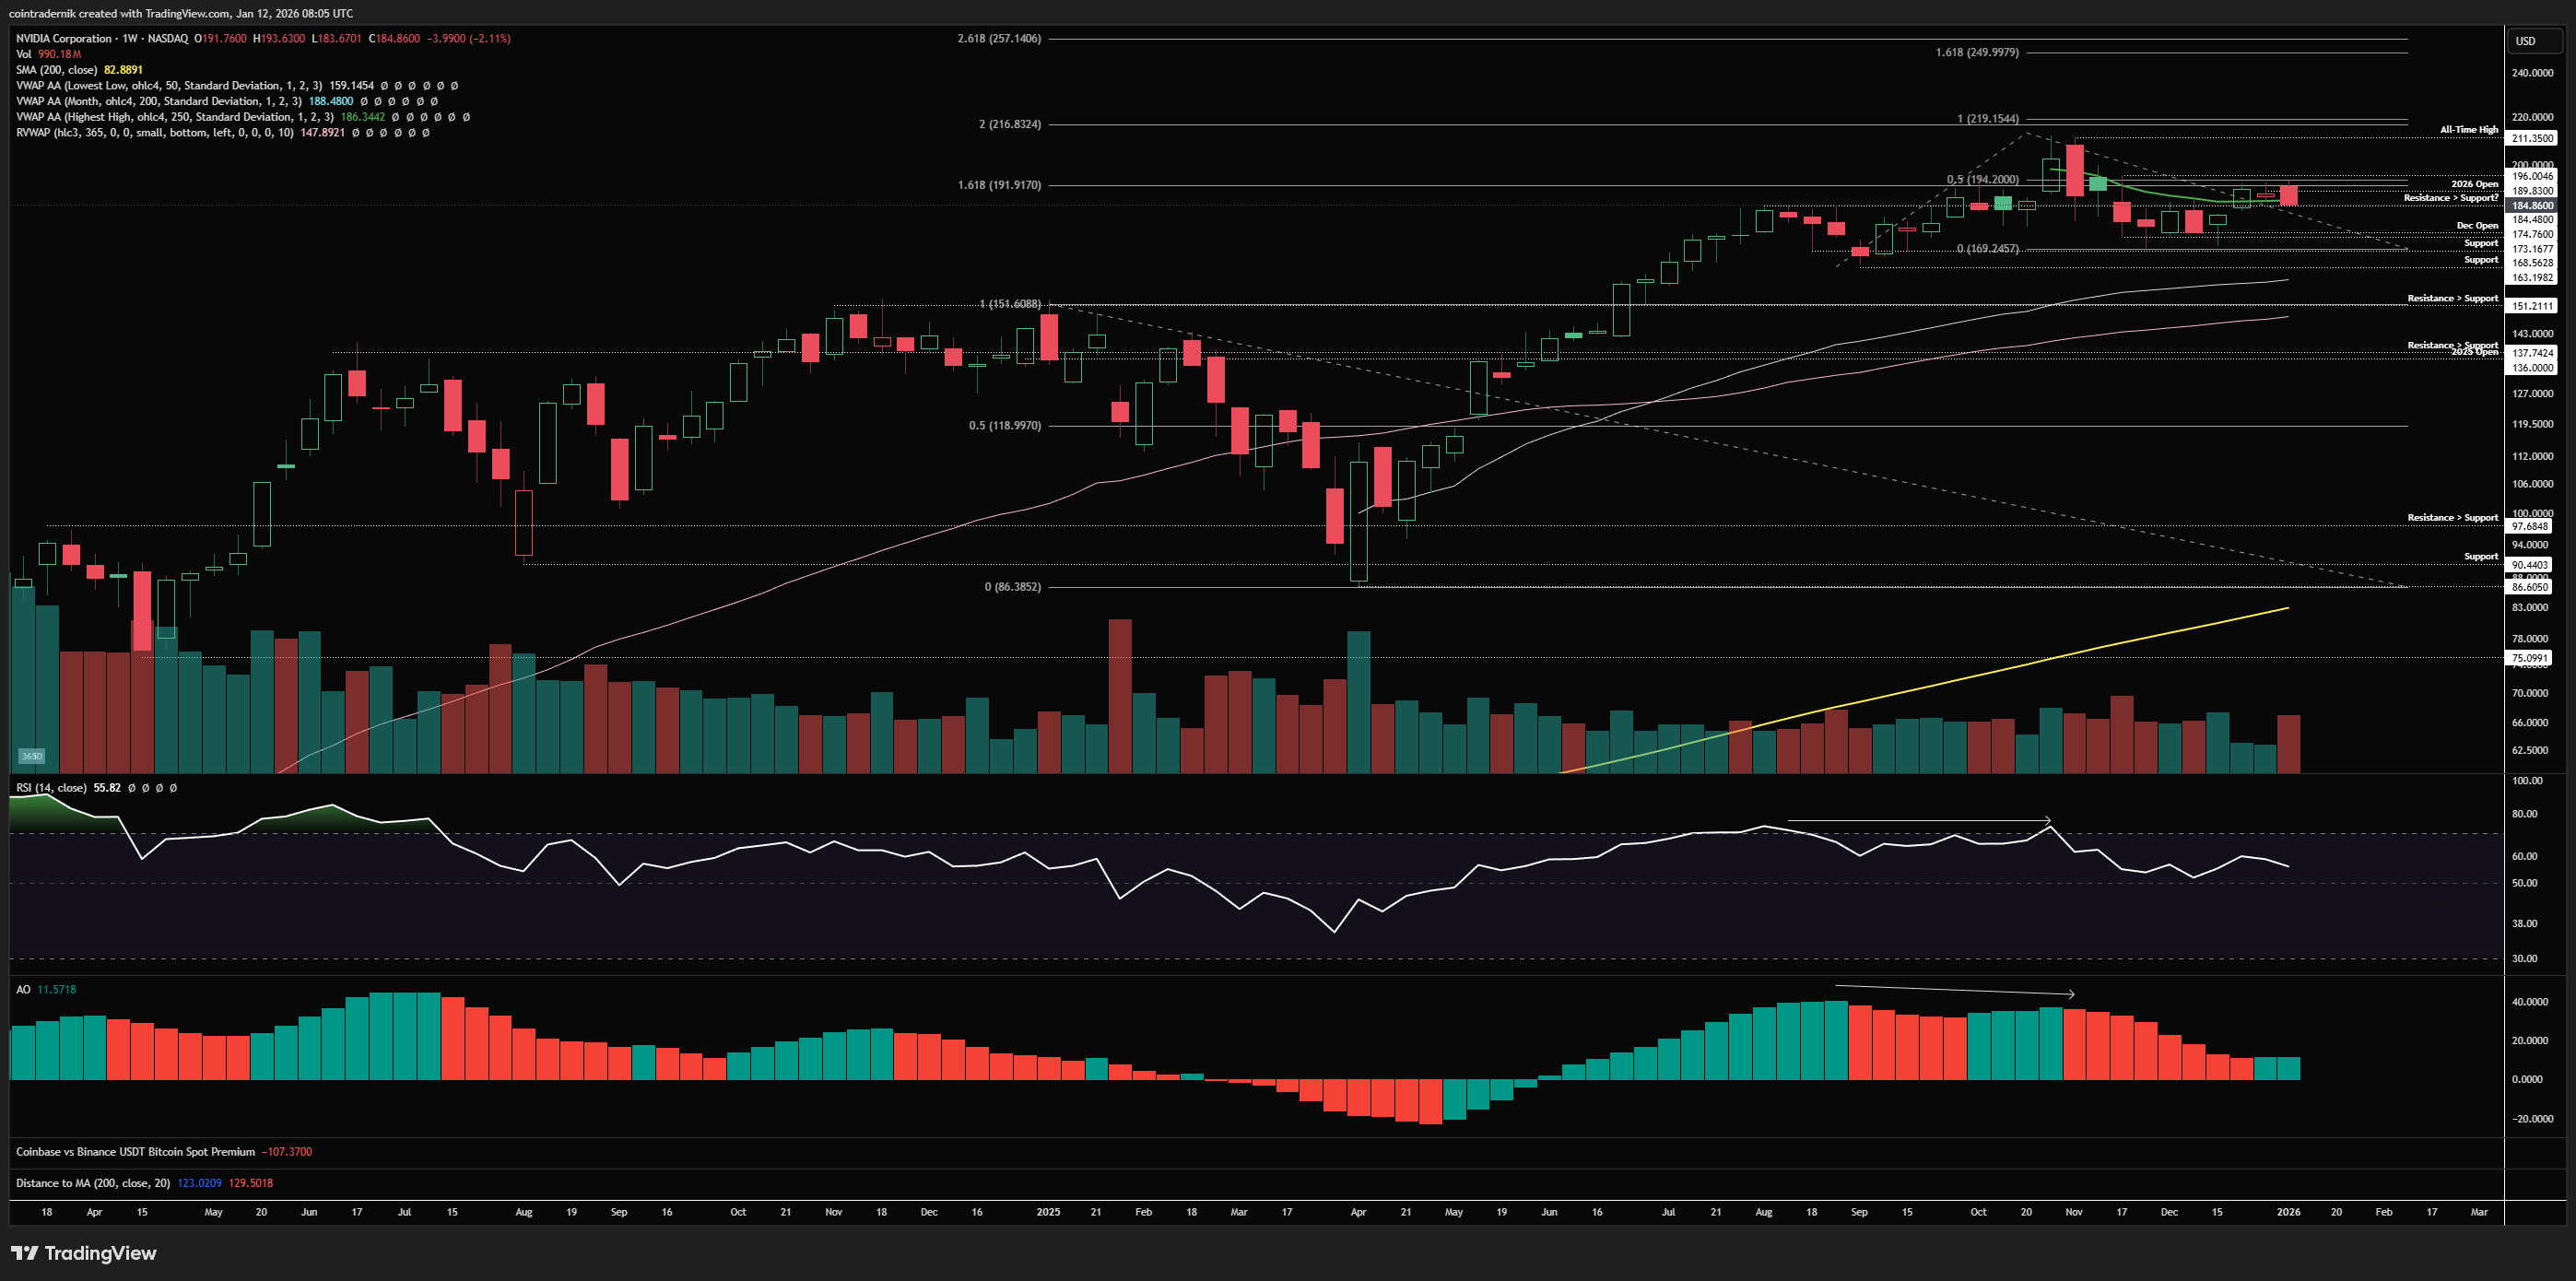
Looking firstly at the weekly chart for NVDA, we can see that - as one might expect - the setup is not too dissimilar to NDX. That said, unlike the index, we did form a higher-low in November at $169 after a momentum reset from the trend exhaustion into the highs, with weekly RSI bottoming above 50. We then consolidated above $169 before breaking higher a couple of weeks ago, closing above the anchored VWAP from all-time highs into $190, now range-bound between $184 as support and $190 as resistance. If this longer-term trend is to hold, we should see price mark out another higher-low above $169 and then break and close the weekly above $190 as major resistance, accept above which begins the next leg through the $211 high towards $250 as a massive level, where I would expect sellers to step in again. If, instead, we are forming a lower-high here on this timeframe, with $190 capping price, we should see the next move lower break the $169 support and close below it, with weekly RSI below 50, confirming a weekly structure break and a momentum breakdown, from which a larger correction is inevitable.
Daily:
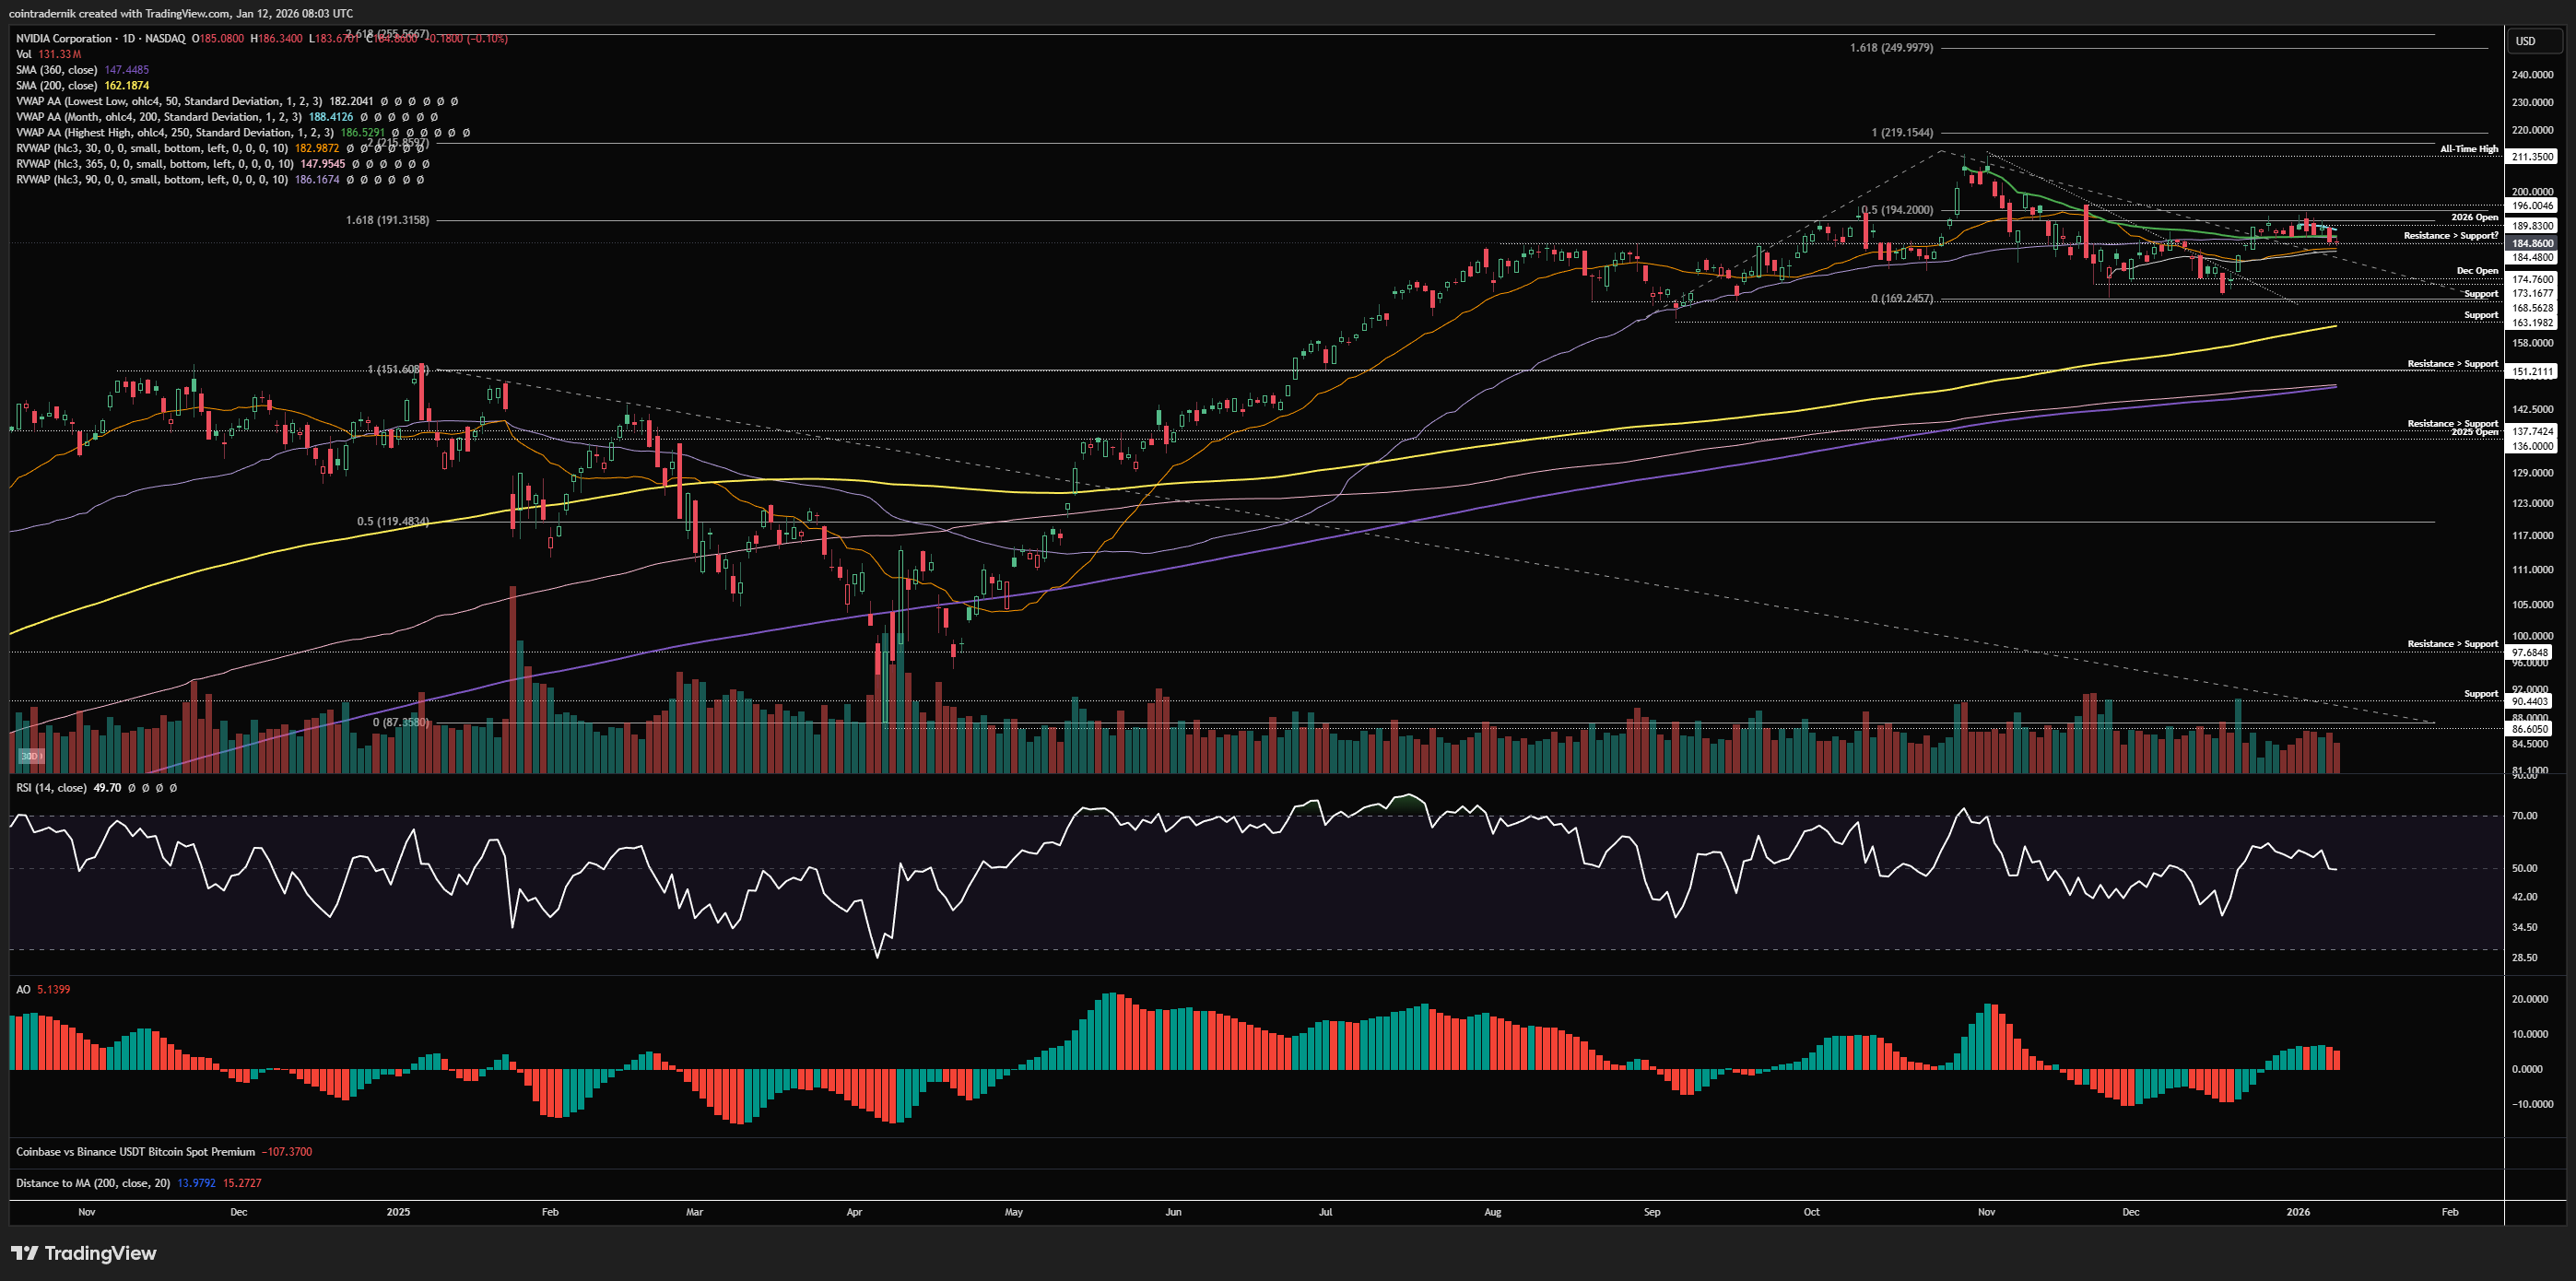
Turning to the daily, we do have bullish structure and bullish momentum for the time being, with price consolidating right around the cluster of key VWAPs at $184. If one was itching for an entry, you could punt a long right around here on the gap down at cash open today, with a really tight invalidation on a daily close below $180, looking to add on acceptance above $190 or to re-enter if stopped at $174 as the most probable area for another higher-low to form, below which - as mentioned above - structure becomes much less appealing for immediate upside. If you'd prefer to await a higher probability setup, you want to see a daily close above $190 and then rebuy the 2026 open as support from above, looking for continuation higher into all-time highs and beyond.
Price: $177.50
Weekly:
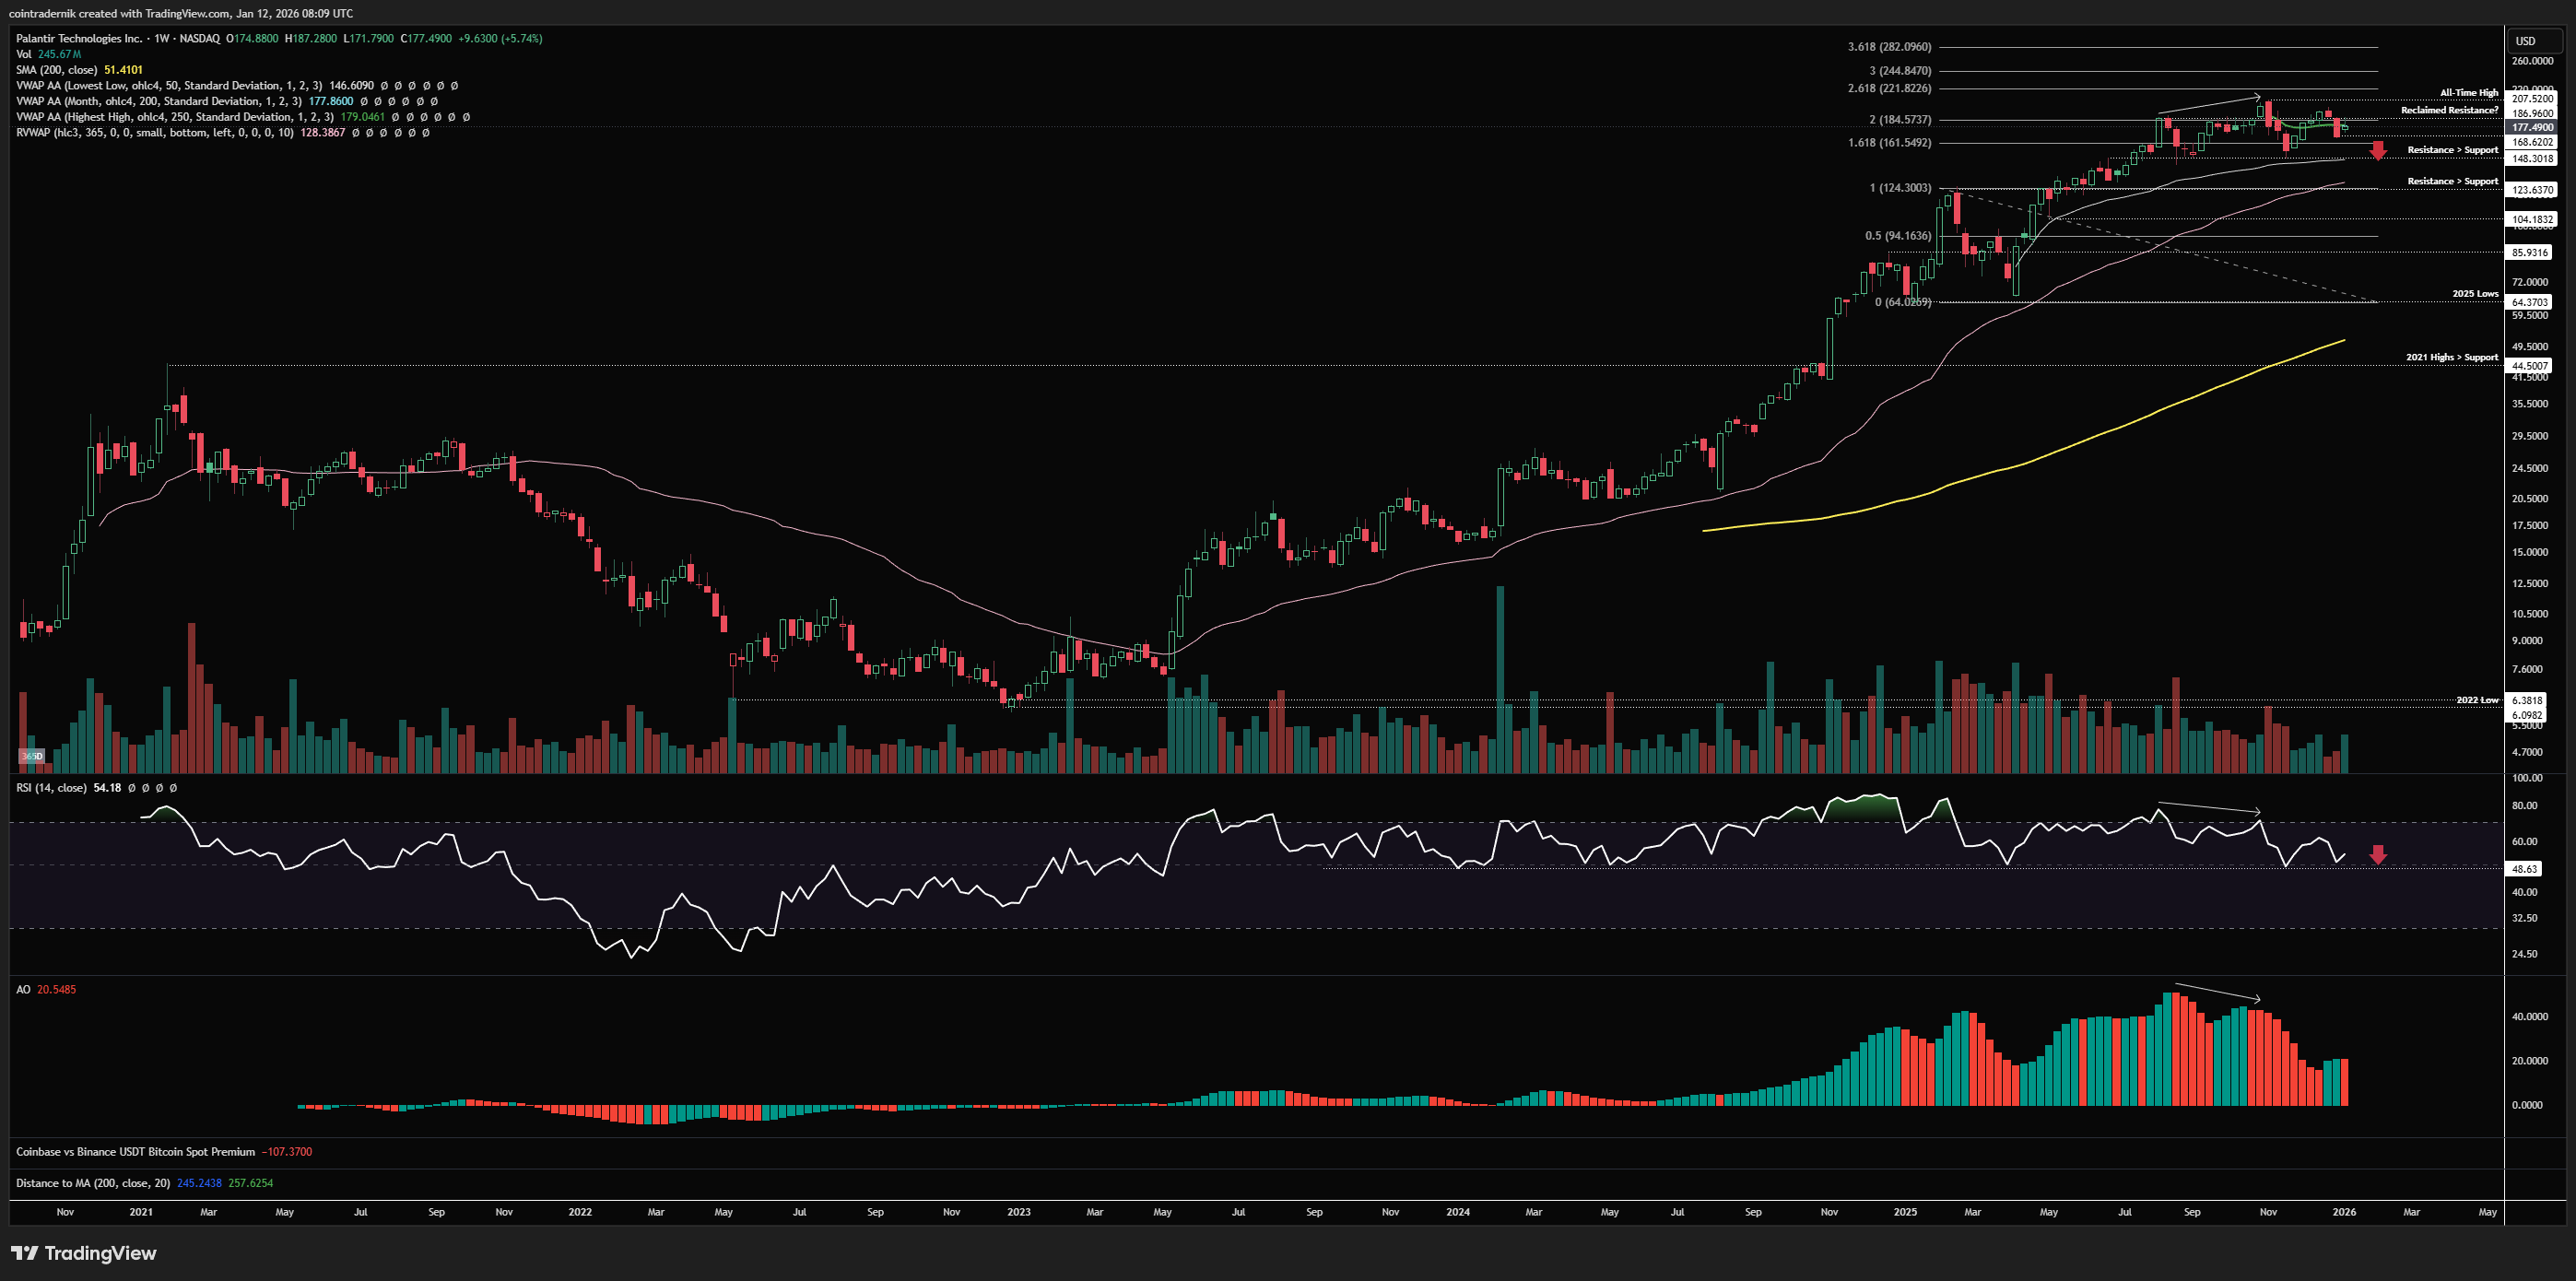
Beginning with the weekly timeframe, we can see that price formed weekly trend exhaustion on the push into the $207.50 all-time high, before rejecting and retracing back into $148 resistance turned support, marginally above the anchored VWAP from the tariff lows. This was (just about) a higher-low above the prior swing-low, with weekly momentum reset and weekly RSI holding firm above 48, where it has held throughout the bulk of this bull market. We then rallied off support, pushing towards $207 but falling short with a lower-high, with price now breaking back below the anchored VWAP from the all-time high, closing at $168. We are now consolidating within that weekly range, with bullish weekly structure but a very tasty setup for shorts should a couple of things occur from here. If PLTR fails to mark out another higher-low here and $185 continues to cap price, we would be looking for a weekly close below $148, confirming a lower-low and bearish weekly structure, as well as loss of the anchored VWAP from the tariff lows that has supported the rally. This, alongside weekly RSI below 48, would scream bearish, with $123 as the first target, followed by $104. Now, assuming we do mark out a higher-low above $148, I still don't really like longs on this until we're back above $185, flipping that ATH-anchored VWAP into support. Above $200 opens up $220 as the next major level, followed by $244. Ultimately, I think it is unlikely that both NDX and NVDA break higher and PLTR flips $148 into resistance - it's possible, but I think it's more probable that all three continue higher together, with PLTR looking weaker than the index itself.
Daily:
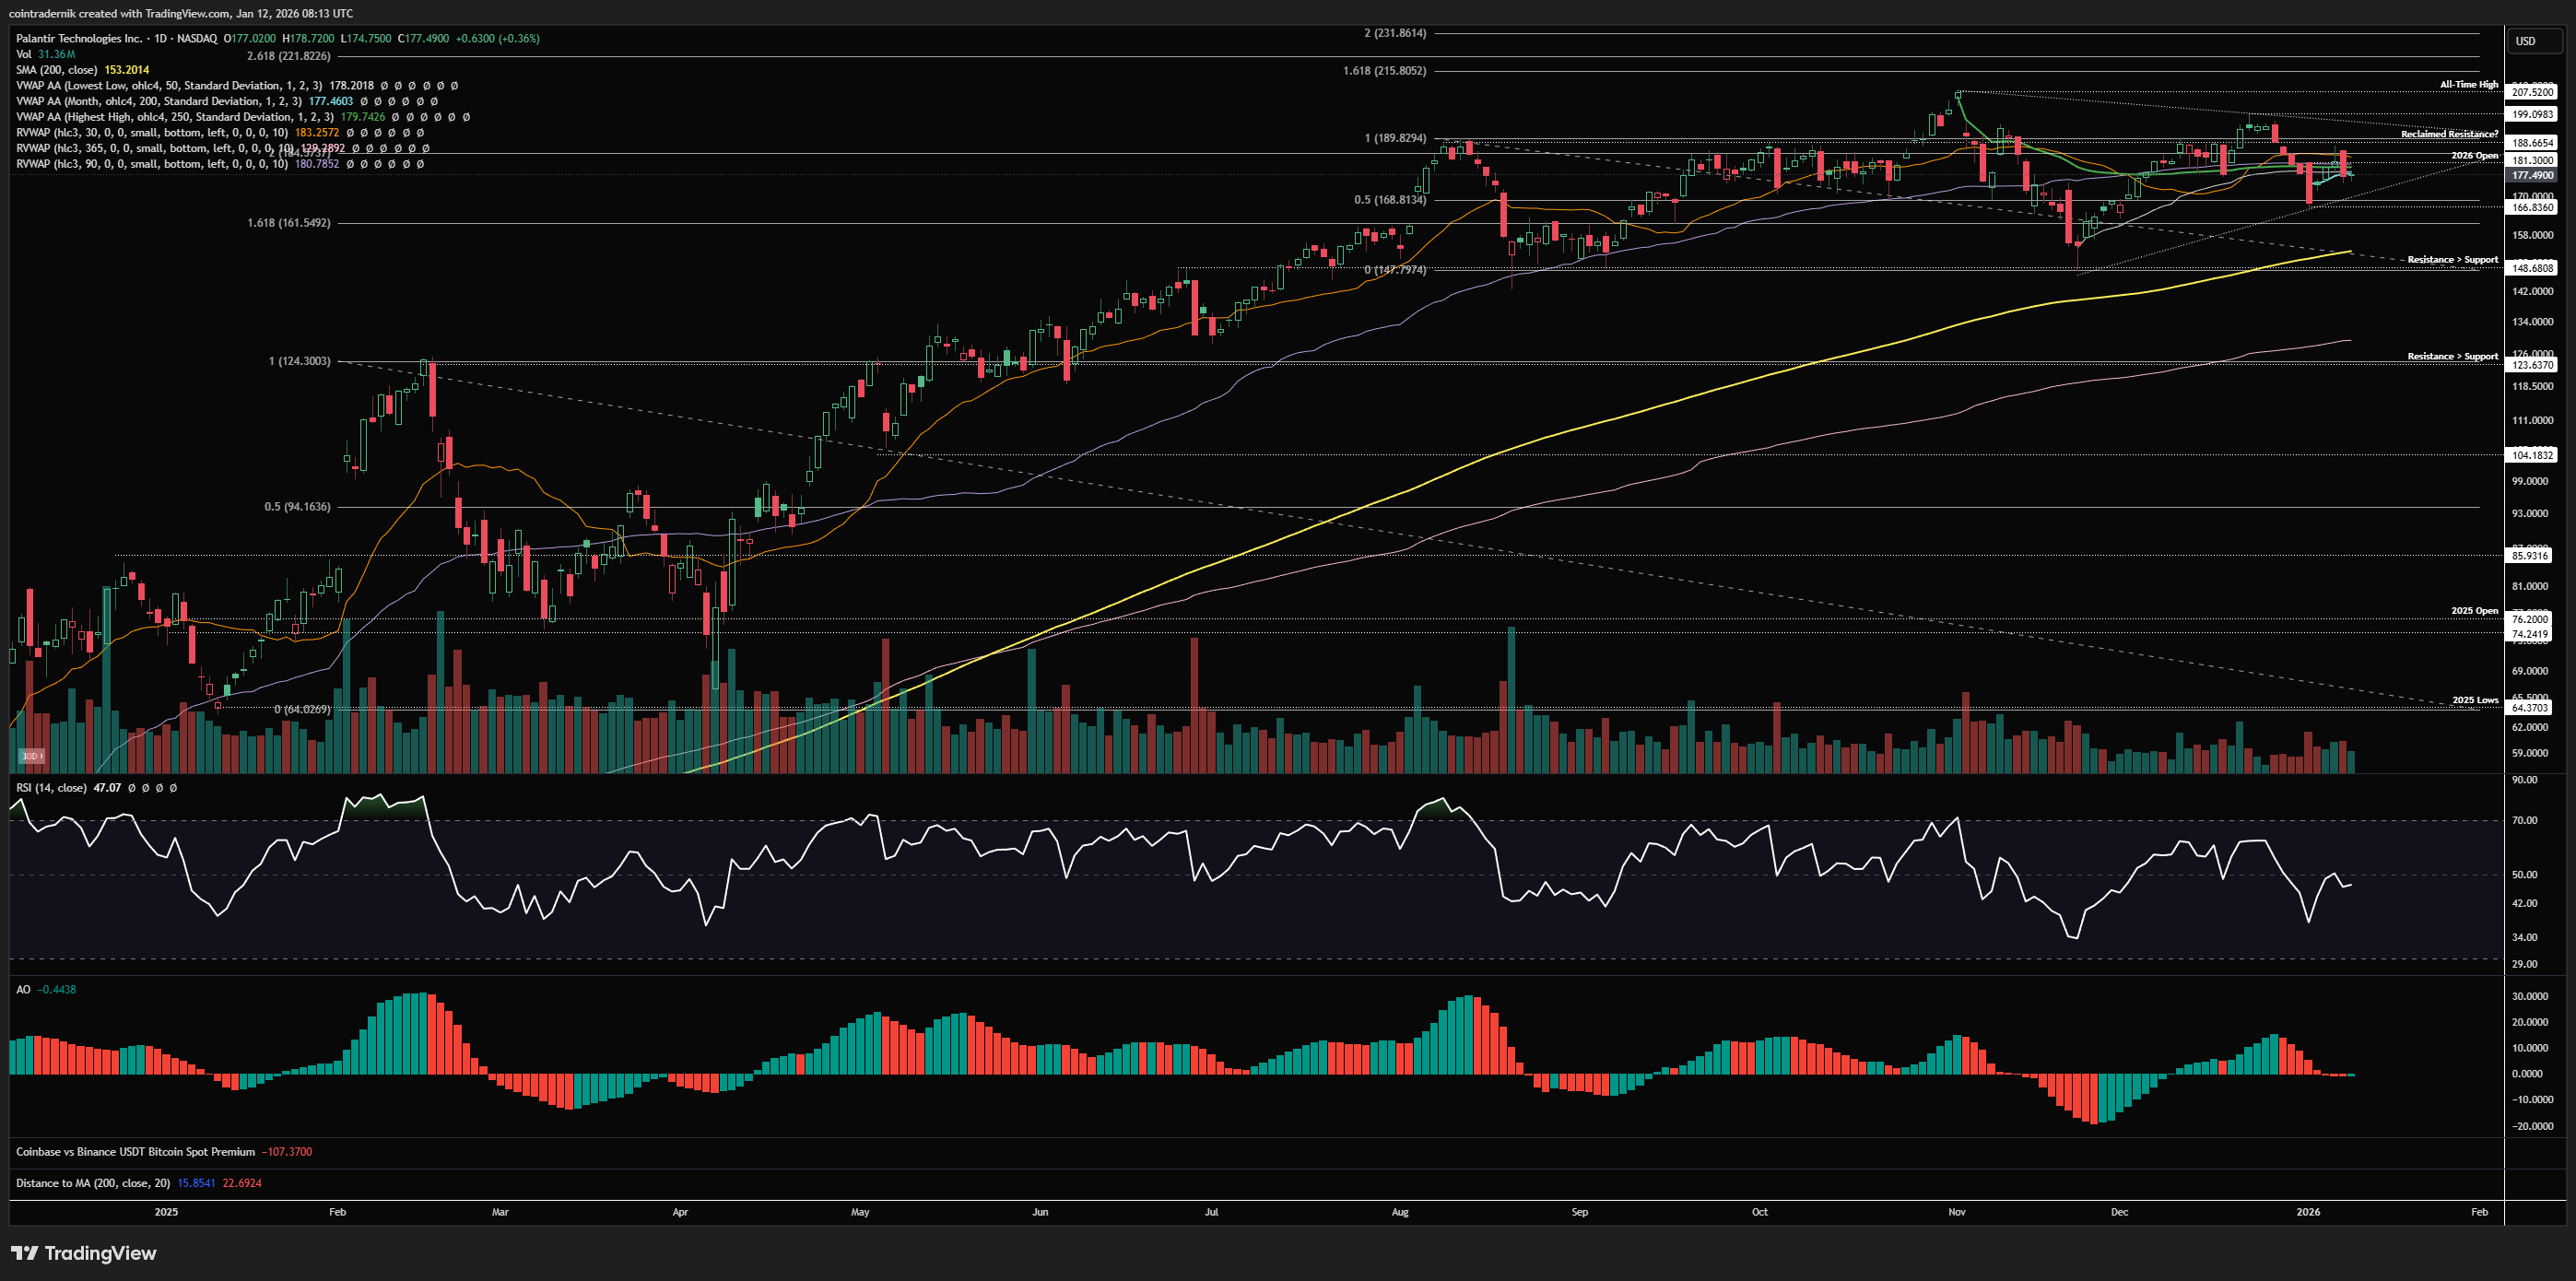
Dropping into the daily, we can see how choppy price-action is here, with a higher-low at $166 following that lower-high at $200, and price then consolidating within those two levels and right around the yearly open at $181. We are below the key cluster of VWAPs and until we reclaim them I really don't like the look of this, as also highlighted last week. What bears want to see here is the 2026 open act as resistance and price break and close below the $166 swing-low, which is also the mid-range of the $147-$190 range that has held most of the past 6 months, except that deviation above into new highs. In that scenario, you would expect the 200dMA to be retested, which is the last chance saloon for the formation of a higher-low above $148. To be honest, I just wouldn't be touching PLTR until the $190 area is cleared and we pull back into $186-$190 as support from higher...
Price: $6.036
Weekly:
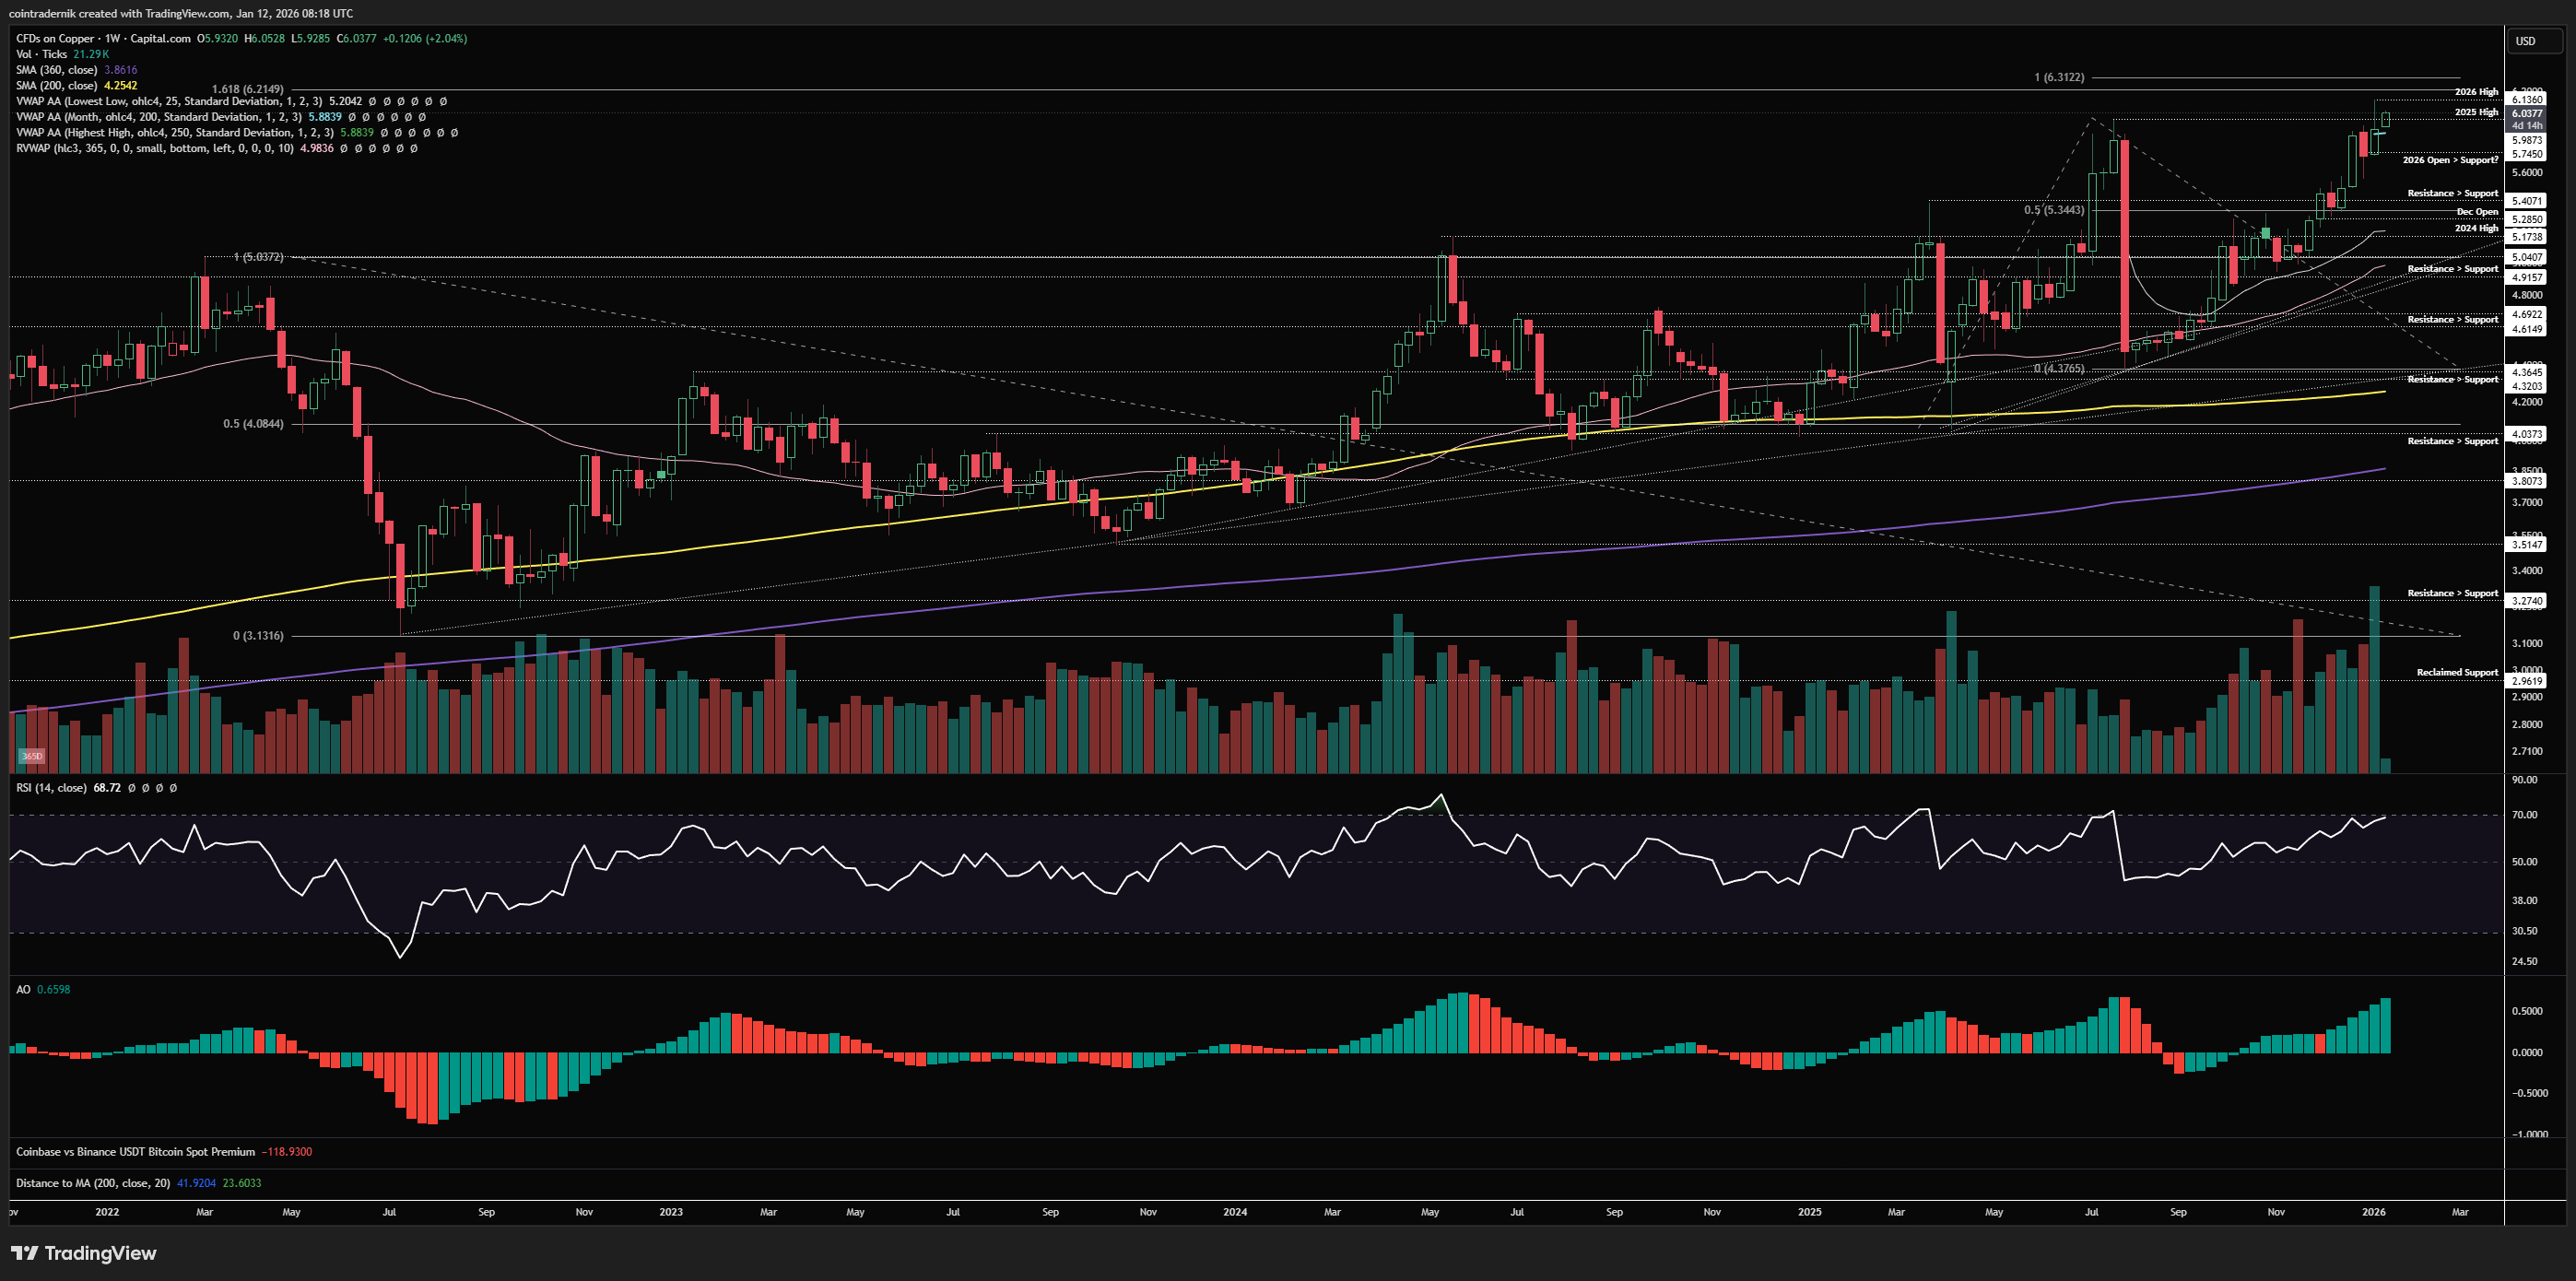
Beginning with the weekly for Copper, we can see that price formed new high last week above the 2025 high, pushing through $5.98 into $6.14 and then rejecting just shy of some key overhead fibs. We closed the week at $5.93, above the Jan VWAP and above the prior weekly high, having retested the 2026 open at $5.74 as support and bounced. Weekly momentum is bullish alongside weekly structure and price is again pushing above the 2025 high early this week, where a weekly close above $6 will lead to $6.30 being tagged as minor resistance, with major resistance likely closer towards the $7 area. Buy dips throughout Q1 into early Q2 and continue to be rewarded, in my view.
Daily:
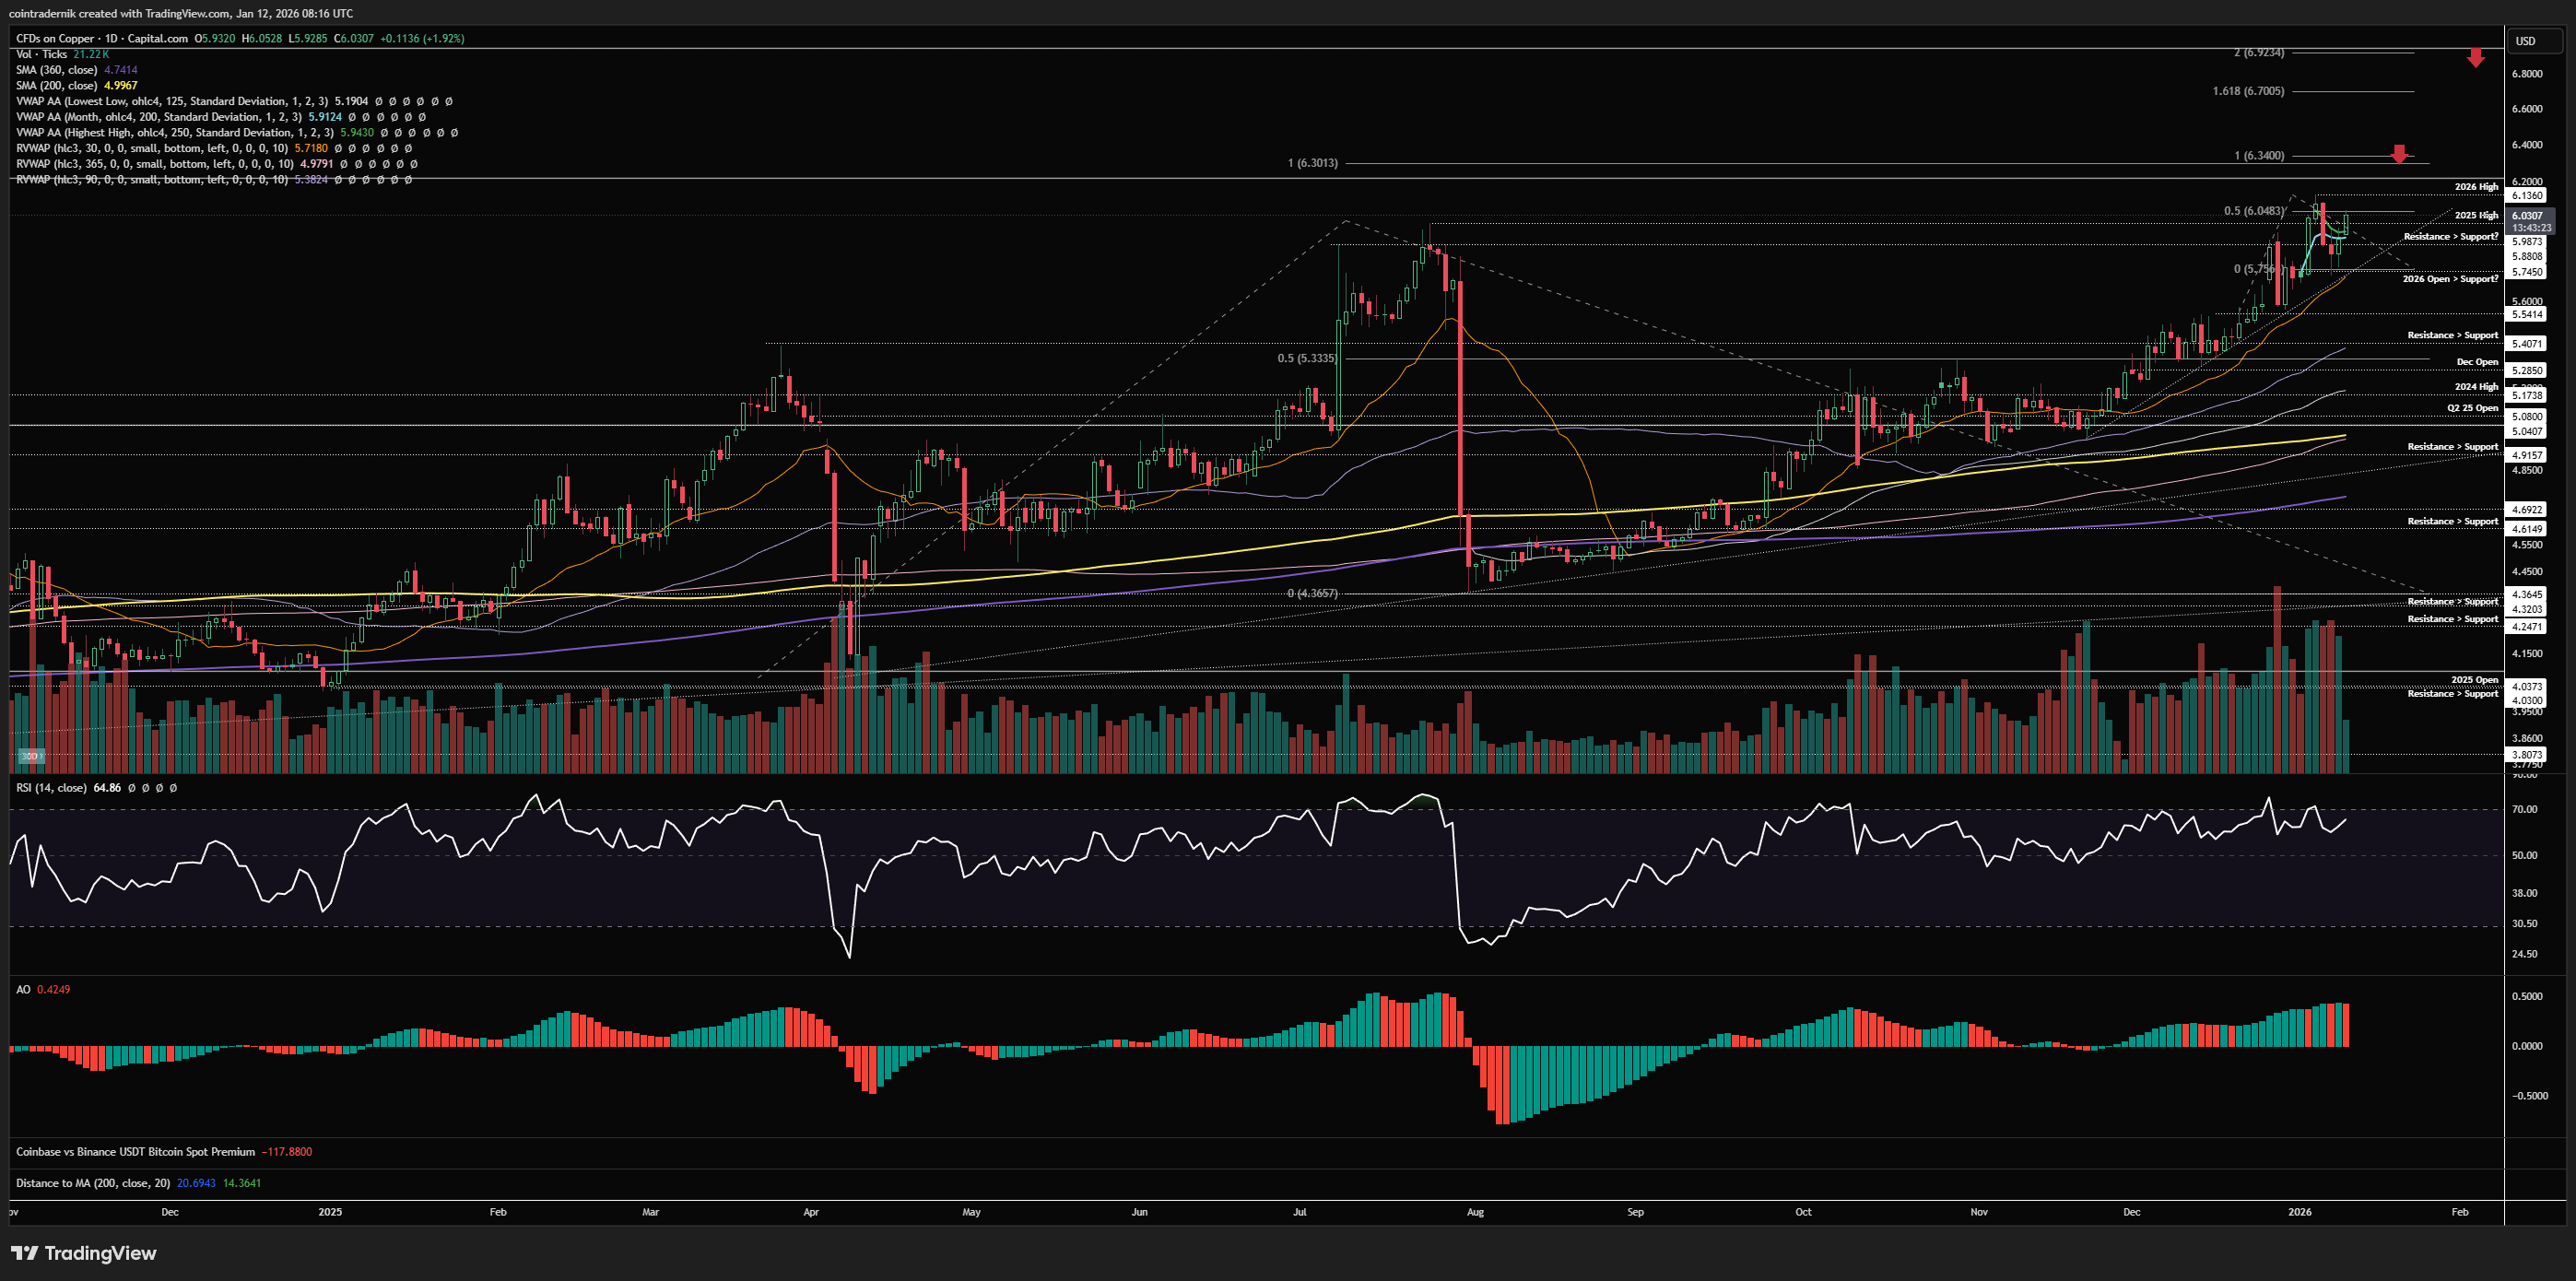
Finally, looking at the daily, we can see that there was some trend exhaustion into the most recent push to highs, but price then retraced and formed a higher-low at the yearly open and is pushing higher once again. Now, if we do form a new high this week above last week's high but daily RSI prints another lower-high, there is the possibility that we need a deeper retracement and a momentum reset on this timeframe before the next leg higher can begin, but whilst structure looks the way it does we should expect this momentum divergence to be invalidated with RSI making a higher-high as price breaks above $6.14. In that scenario, I would be looking at $6.30 as the 100% extension of the recent swing, but much higher into $6.90 before I consider taking some profits, as there is a lot of confluence up there for resistance.
I hope you've found some value in the read this week - please RT, share, engage etc. if so!
And if you've not already signed up for Ostium, please do so and test out some of the recent updates, including:
Sign up here (you don't have to use my ref link, of course): https://ostium.app/trade?from=CL&to=USD&ref=CTNIK

.avif)