

Market Outlook #67 - Metals Madness + Venezuela
January 5, 2026
-
12
min read


This blog references an opinion and is for entertainment and informational purposes only. It is not intended to be investment advice. Seek a duly licensed professional for investment advice.
In this special edition of the 67th Market Outlook here at Ostium Research, we'll be taking a look at the week ahead in markets, focusing specifically on Precious Metals following the late December 'Metals Madness', looking at price-action, positioning and event risk for Gold, Silver, Copper, Platinum and Palladium (and maybe more if you can make it to the end).
Now, let's take a look at this week's relatively busy calendar for labour market data, as the first full week of the New Year:
MONDAY: US ISM MANUFACTURING PMI (DEC): (CONSENSUS 48.3 VS PREVIOUS 48.2)
TUESDAY: US S&P GLOBAL COMPOSITE PMI (DEC): (CONSENSUS N/A VS PREVIOUS 53)
WEDNESDAY: US ADP EMPLOYMENT CHANGE (DEC): (CONSENSUS 47K VS PREVIOUS -32K)
WEDNESDAY: US FACTORY ORDERS (MOM) (OCT): (CONSENSUS -1.1% VS PREVIOUS 0.2%)
WEDNESDAY: US ISM SERVICES PMI (DEC): (CONSENSUS 52.3 VS PREVIOUS 52.6)
WEDNESDAY: US JOLTS JOB OPENINGS (NOV): (CONSENSUS 7.73M VS PREVIOUS 7.67M)
WEDNESDAY: FED'S BOWMAN SPEECH
THURSDAY: US INITIAL JOBLESS CLAIMS: (CONSENSUS 205K VS PREVIOUS 199K)
FRIDAY: US NONFARM PAYROLLS: (CONSENSUS 57K VS PREVIOUS 64K)
Now, let's dig into asset-specific price-action for the week ahead, looking firstly at Gold:
Price: $4422
Weekly:
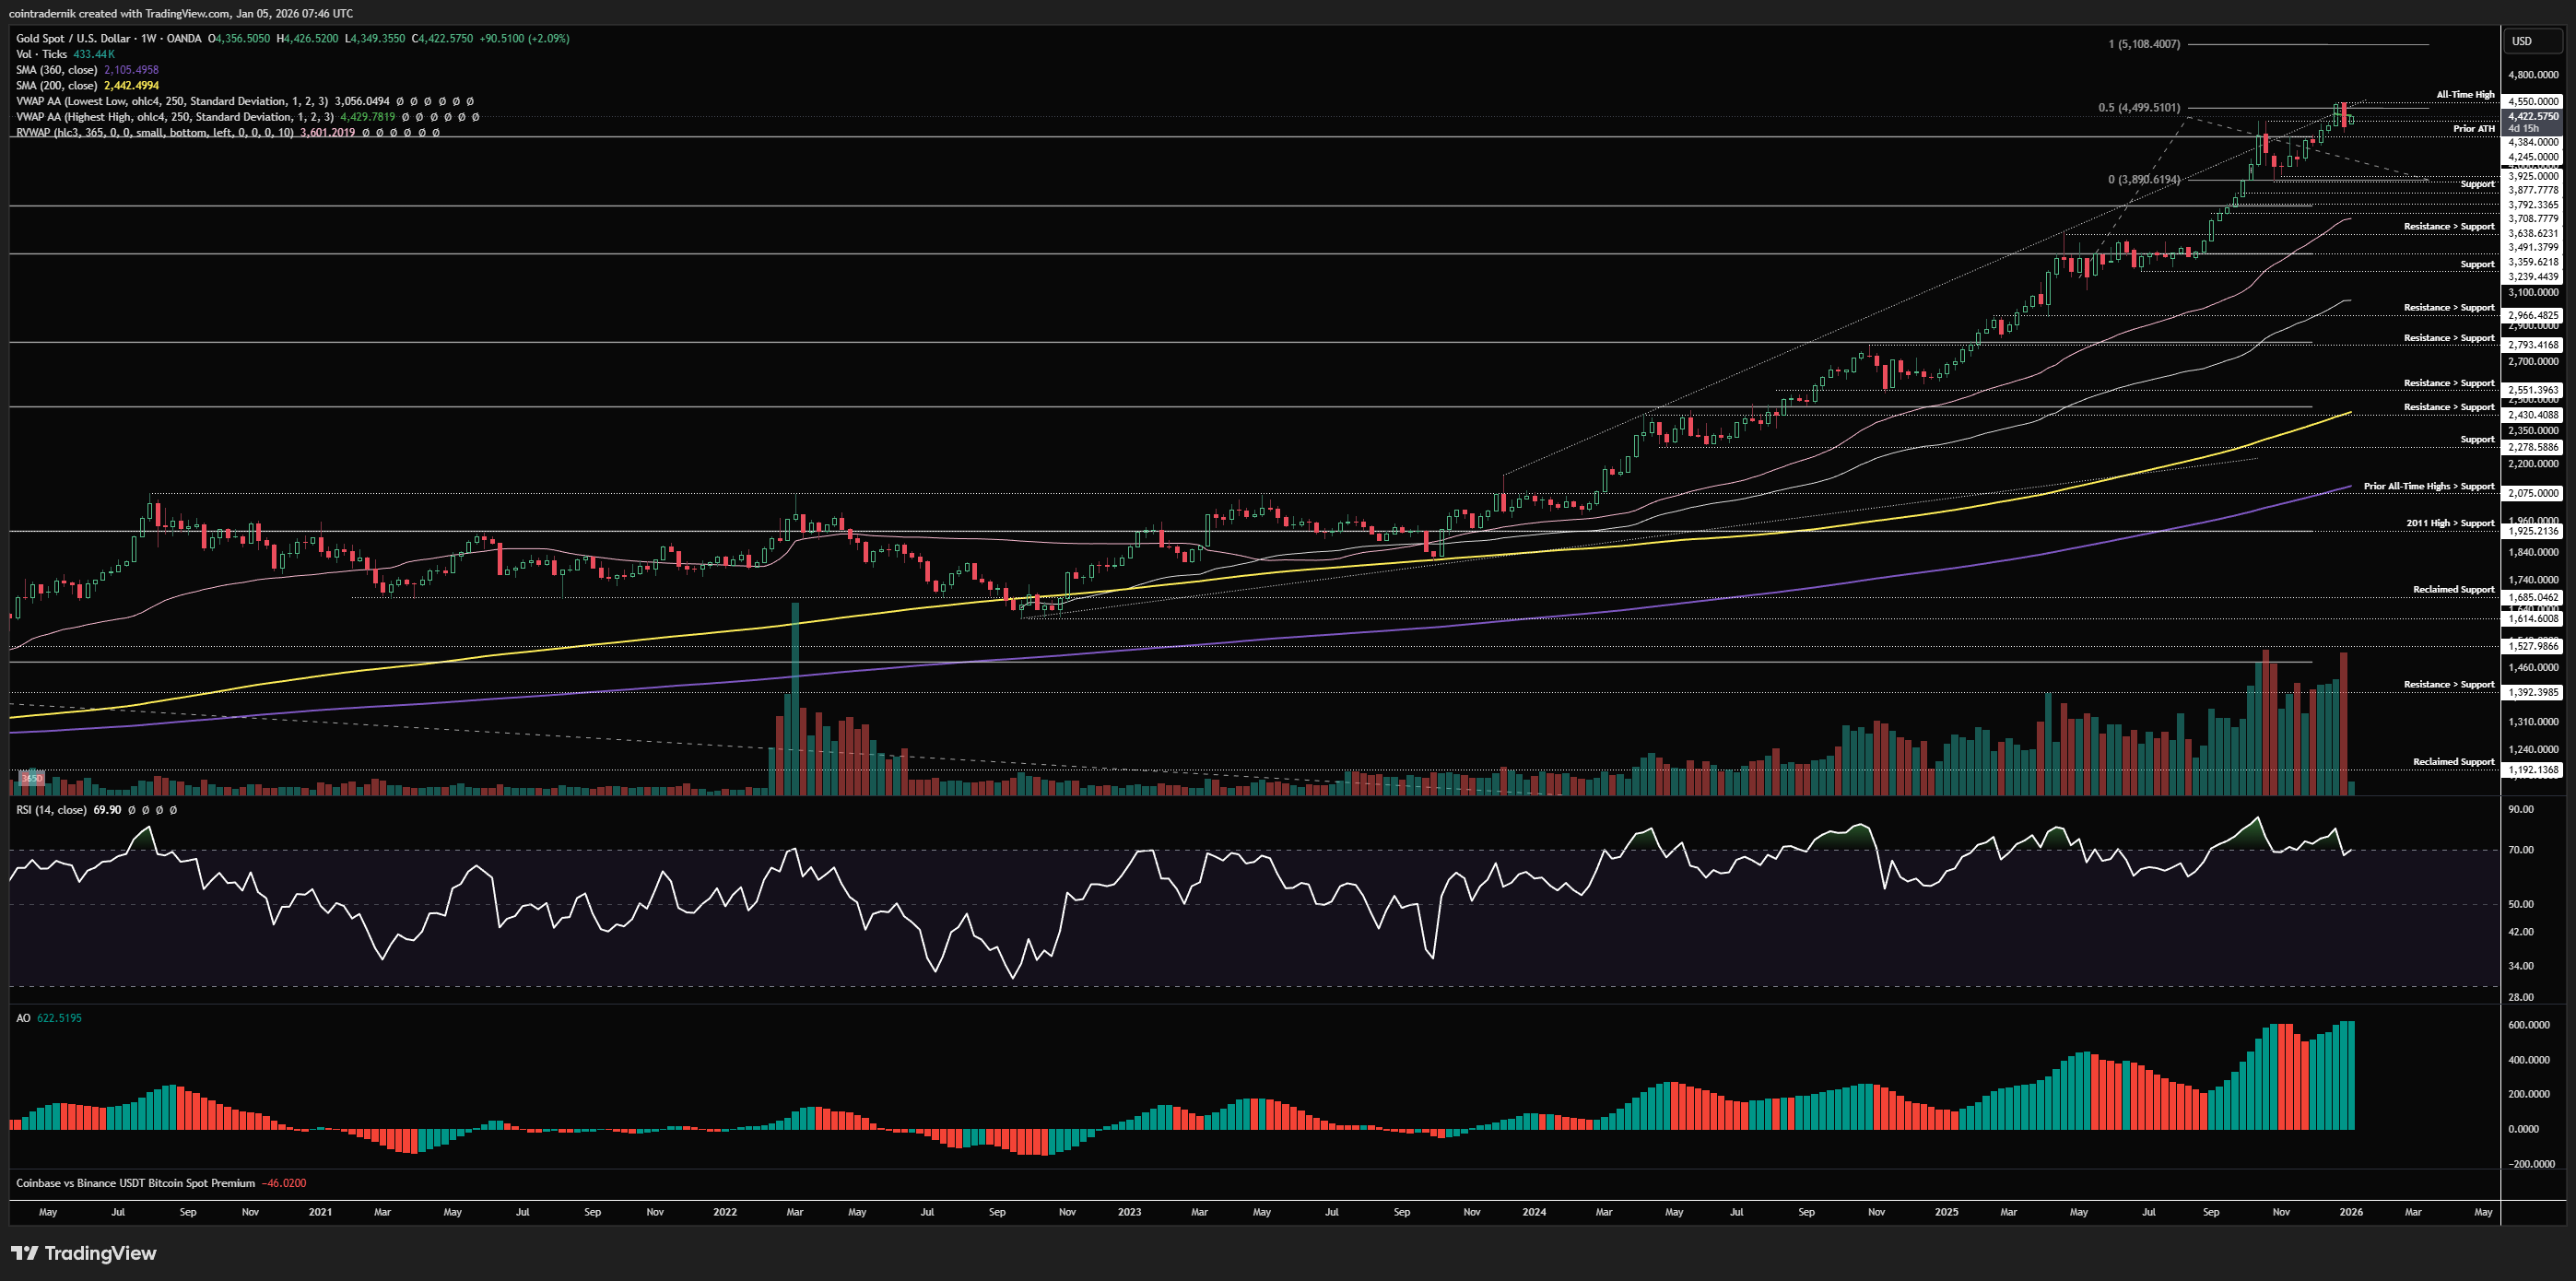
If we begin by looking at the weekly for Gold, we can see that price formed that new all-time high into year-end at $4550, then subsequently rejected, retracing off the open last week back below prior highs at $4384 towards $4245 support, frontrunning that level but closing at $4356. The weekly failed breakout also printed weekly trend exhaustion with that momentum divergence, and now Gold is in a really important spot for continuation or trend shift. If we can catch a bid this week and reclaim prior highs at $4384 as support, there is hope yet for short-term Gold bulls, where I would then expect a push back towards and beyond the highs at $4550, from which we are likely to see another leg higher towards the major $5000 level, along with invalidation of this bearish divergence; conversely, should we reject again above $4384 this week, breaking back below that level and closing below last week's low, it kinda looks cooked and as though the buyers above $4400 into year-end are now trapped. In that scenario, I would expect a full retrace of the rally off that $3900 support area over the coming months and the formation of a longer-term range between that level and $4400 as resistance. Whilst we are above prior highs, I think it makes more sense to expect continuation higher, but you really need to see some demand step in this week. If we zoom out, we have rallied for over 3 years with only minor pull-backs and consolidations, running off $1600 to $4550 during that period. Sure, the fiat debasement game is very much real, and the central bank reallocation game is likely in its early innings, but we have pulled forward so much of that upside in such a short span of time (relative to historical performance in Gold). It would not surprise me at all to see a longer consolidation range form below the big $5000 level before continuation through it in the years to come: and with all this said, I still cannot see a major Gold drawdown beyond say 20%. I think we got just shy of 25% from August 2020 to September 2022 and that was a different market environment for Gold than the one we are now in (and are likely in for many years to come).
Daily:
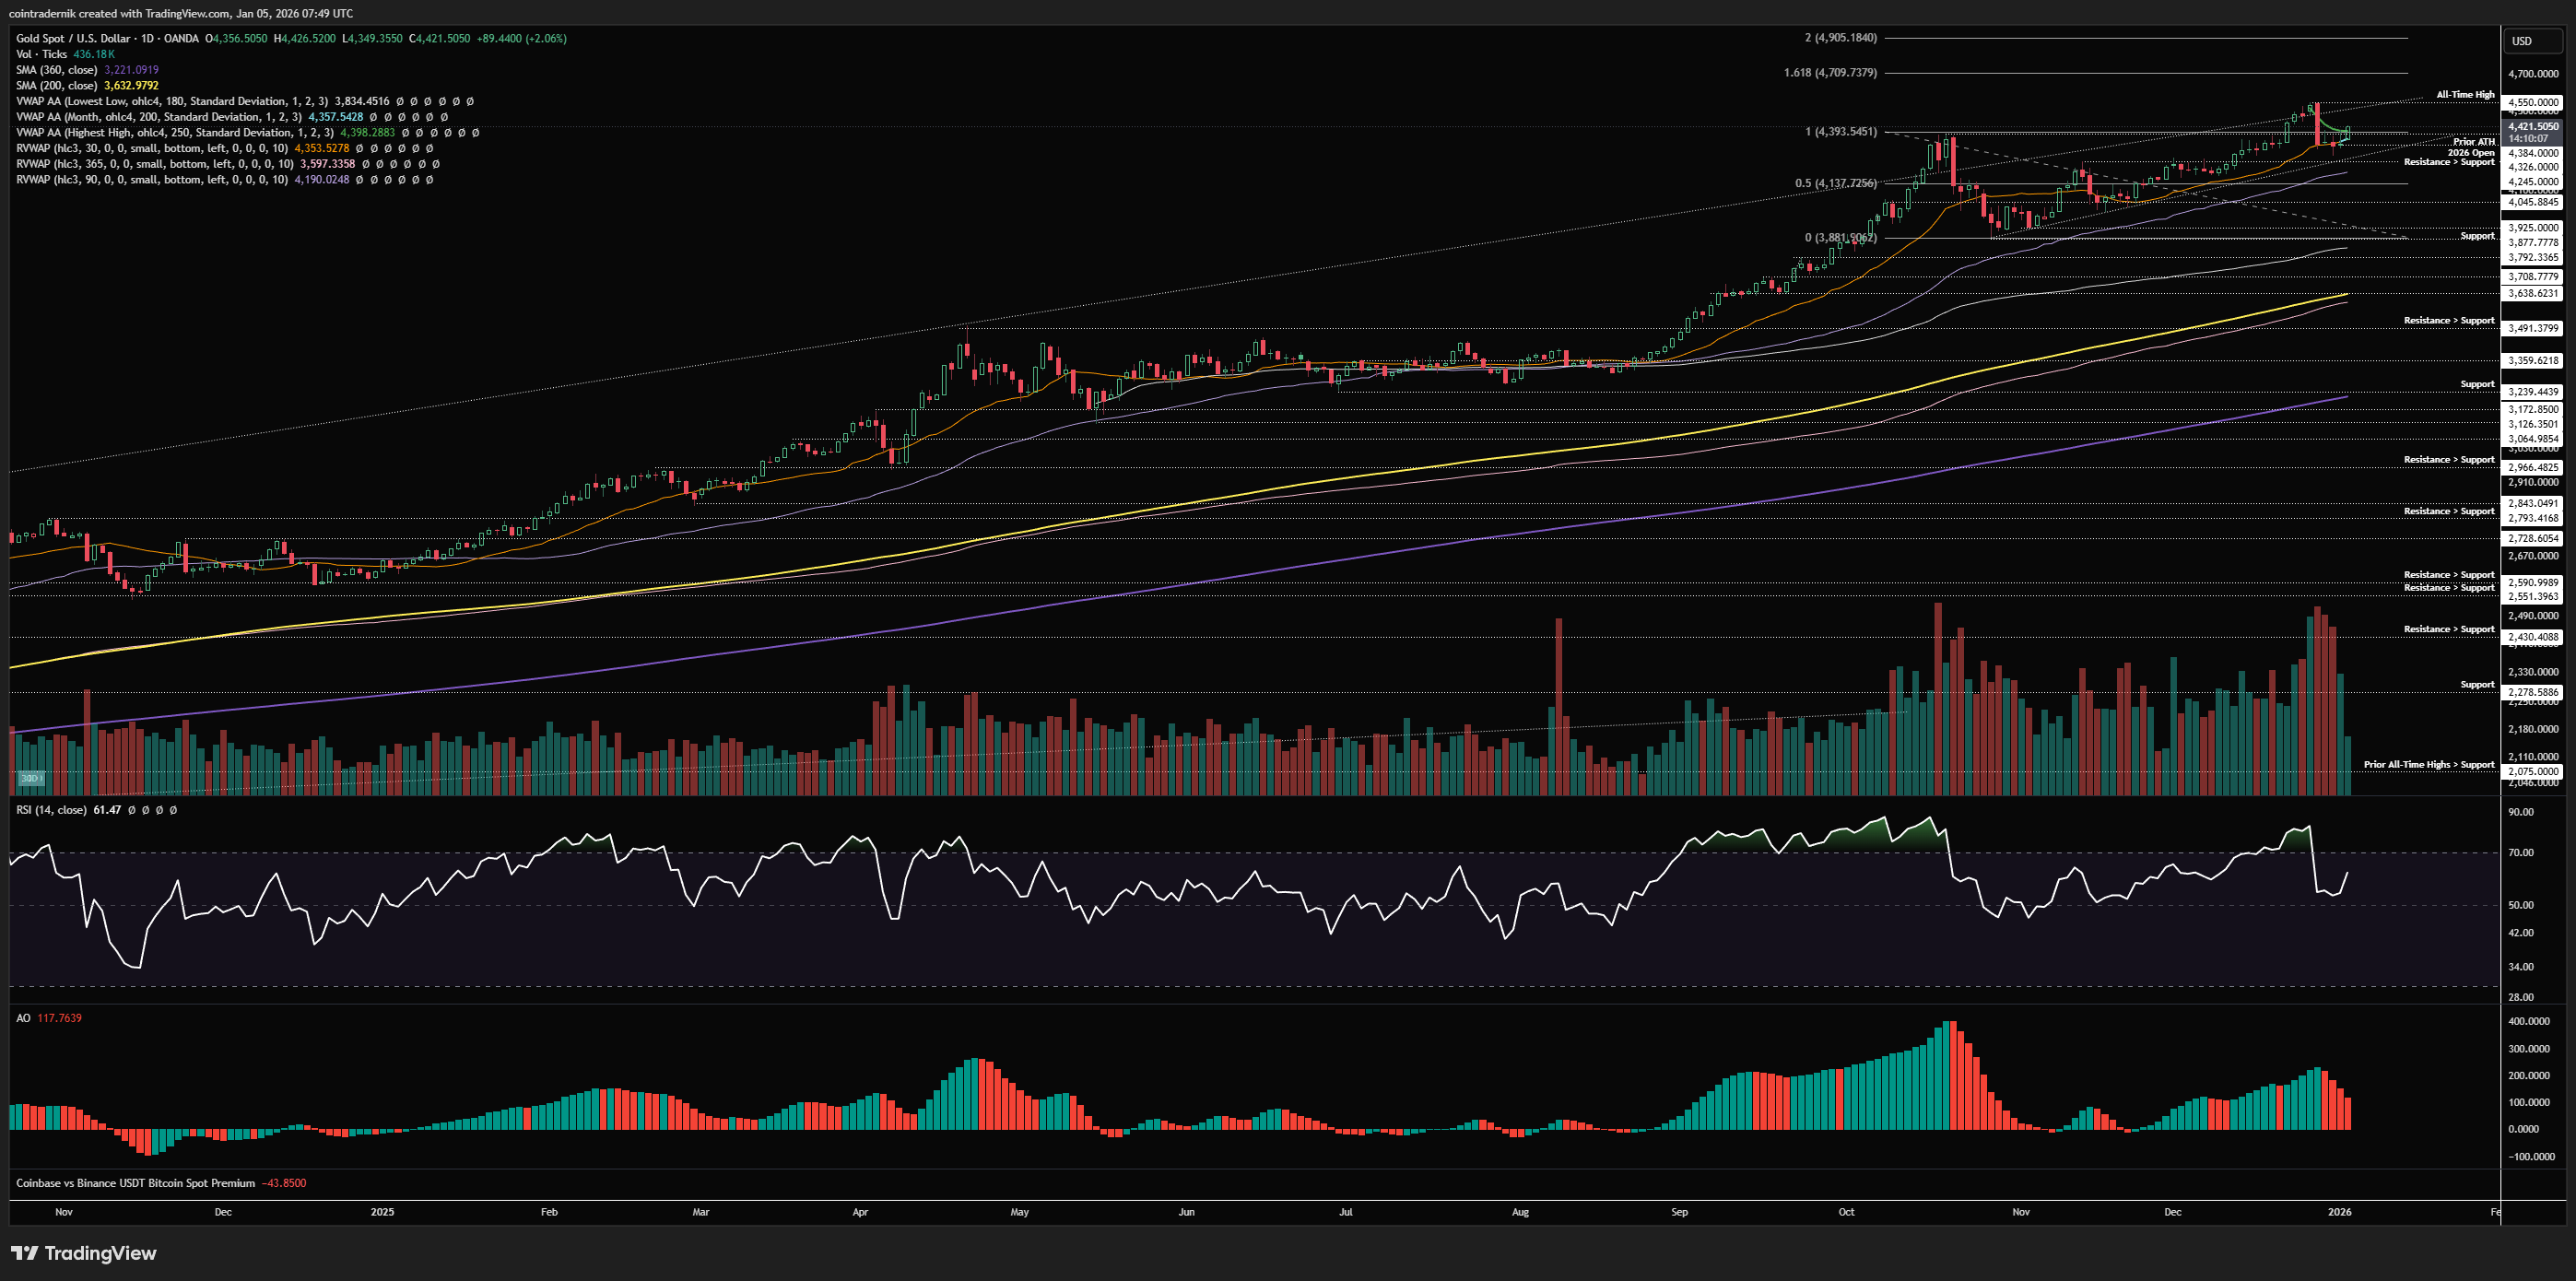
Turning to the daily timeframe, we can see that Gold sold off hard early last week off that all-time high print as X was flooded with non-stop commentary on metals, but, as outlined in last week's Outlook, buying the first shakeout after a major breakout into key support would likely prove fruitful, and I was filled at $4307 before exiting at $4380 for my first booked win of 2026. We found support above trendline resistance from the November lows, which was just below the 30d rolling VWAP - price wicked below that VWAP towards key support and bounced, reclaiming $4350 and pushing higher. As of this morning, we have gapped higher, breaking back above prior highs and marginally back above the anchored VWAP from all-time highs sat at $4400. This is promising for continuation, with last week's move lower looking like a shakeout of late longs that has formed a higher swing-low above the trend. If last week's low is protected this week and we can flip $4400 into support, I think we push back above $4550 later this week or sometime next week, where the reaction will dictate whether we have the juice for a move towards the 1.618 extension at $4709 or we form bearish divergence on the daily and reject, confirming the 'it's cooked' scenario. Big couple of weeks ahead for Gold...
Price: $75.54
Weekly:
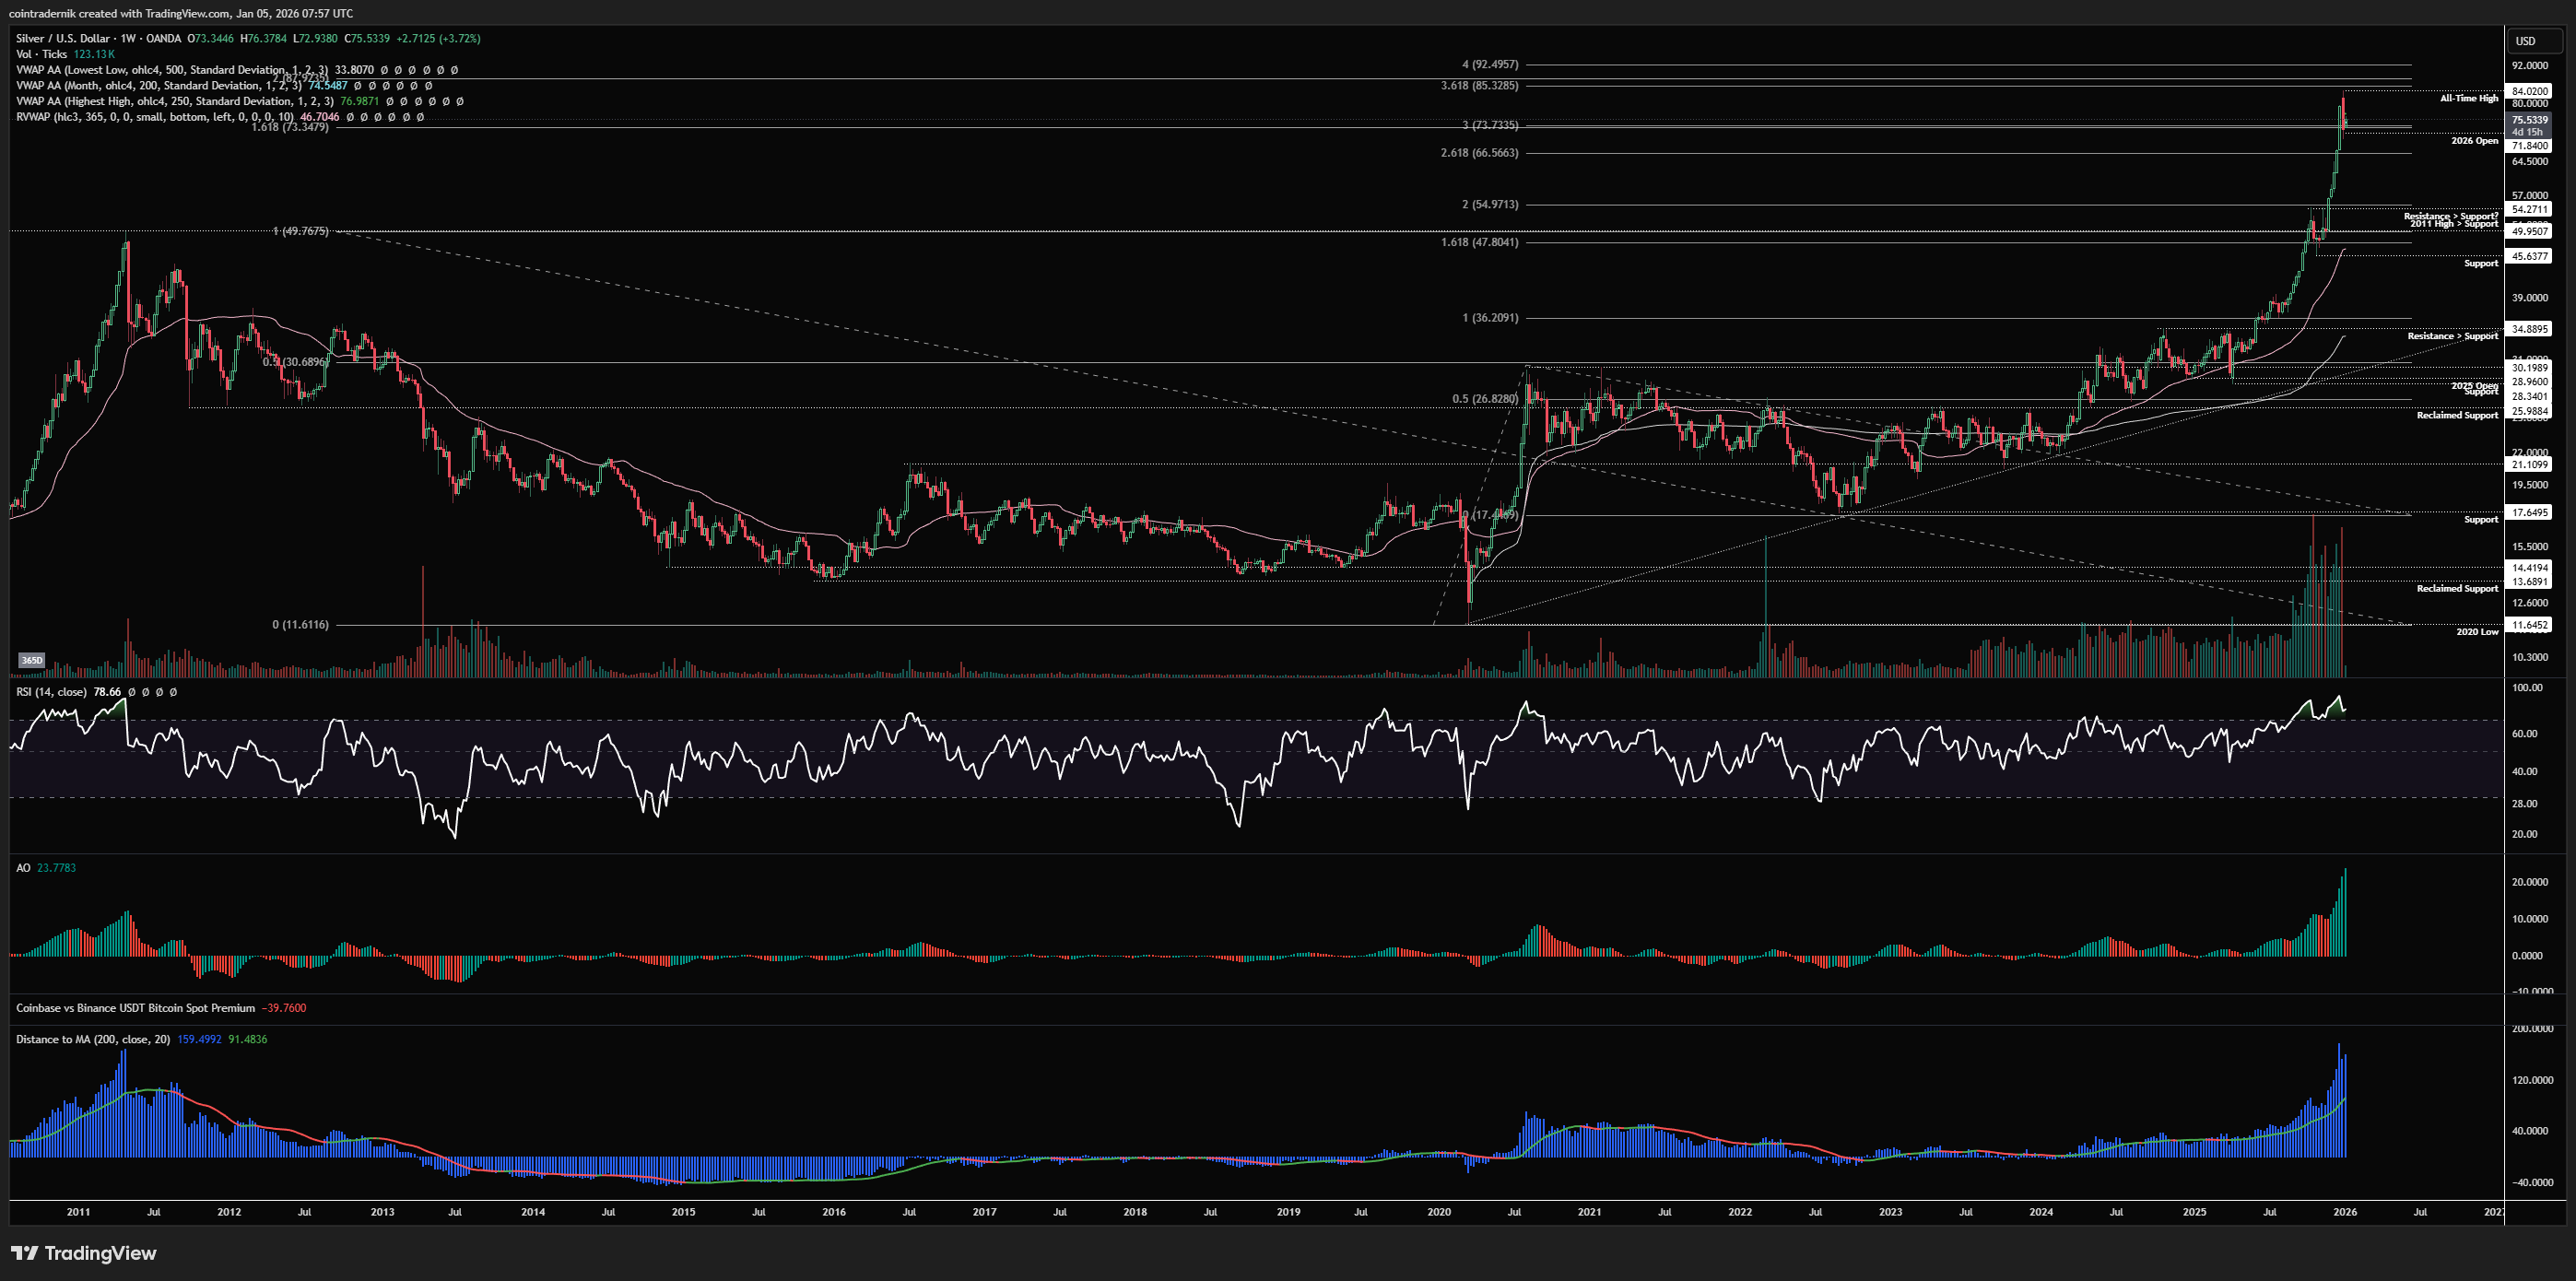
Beginning with the weekly for Silver, we can see just how parabolic the recent price-action has been for the lesser-loved metal of prior years, with price rallying from $29 at the 2025 open to new all-time highs of $84 into year-end, over 65% higher than the 2011 highs. In fact, we rallied from $45.60 to that $84 high just in Q4. It took years of coiling price-action and seething Silver bulls but in the end the breakout was triumphant, with price rejecting just shy of the 200% extension of the 2011-2020 bear market. As those who have glanced at the bottom pane on the above chart will have noticed, Silver is now as overextended from its 200-week moving average as it was at that 2011 peak. This unequivocally does not mean step in front of the parabolic chain with a naked short, but it does mean that chasing fresh longs here is dangerous territory. I am short Silver but only by ways of a notionally-equivalent pair trade for my long Bitcoin position, expecting the latter to outperform the former in H1 2026. I reiterate that I would not just blindly short this just because it is historically overextended, but it does seem about the right time to expect other assets to perform better in the mid-term. Looking at price-action, we still obviously have bullish structure and we have no trend exhaustion, which means we should expect continuation of the trend short-term. Price rejected $84 and trading back into $72 last week, finding support around the 1.618 extension of the 2011-2020 bear market and the 300% extension of the current trend from the 2020 lows. This would be where I expect a little more consolidation to take place akin to the $54 high into the $45.64 low of H2 2025 before the next leg higher, but looking at the chart we are already near-vertical - if we do get one leg higher beyond $84 as the current technicals are suggesting, I expect it will be the last for a good long while unless candles can start travelling backwards in time. I would be looking at the 400% extension at $92.50 followed by the major $100 level (also 100% higher than the 2011 peak). Whilst I do not doubt the underlying fundamentals of the Silver trade, much like the Gold trade, and the fact that it has been suppressed for many years, it is undeniable that should we trade above $84 over the coming weeks, price will be historically overextended and that just does not make for good short-term forward returns and therefore a much better place to offload with the intention of rebuying than to jump in. It almost feels like buying ~$100 Silver would be buying $20k BTC in Dec 2017. Again, I do not contest the idea that the long-term trend is now very much bullish, but there is scope to be tactical here for H1 2026 and I think Silver is very close to putting in that multi-month top.
Daily:
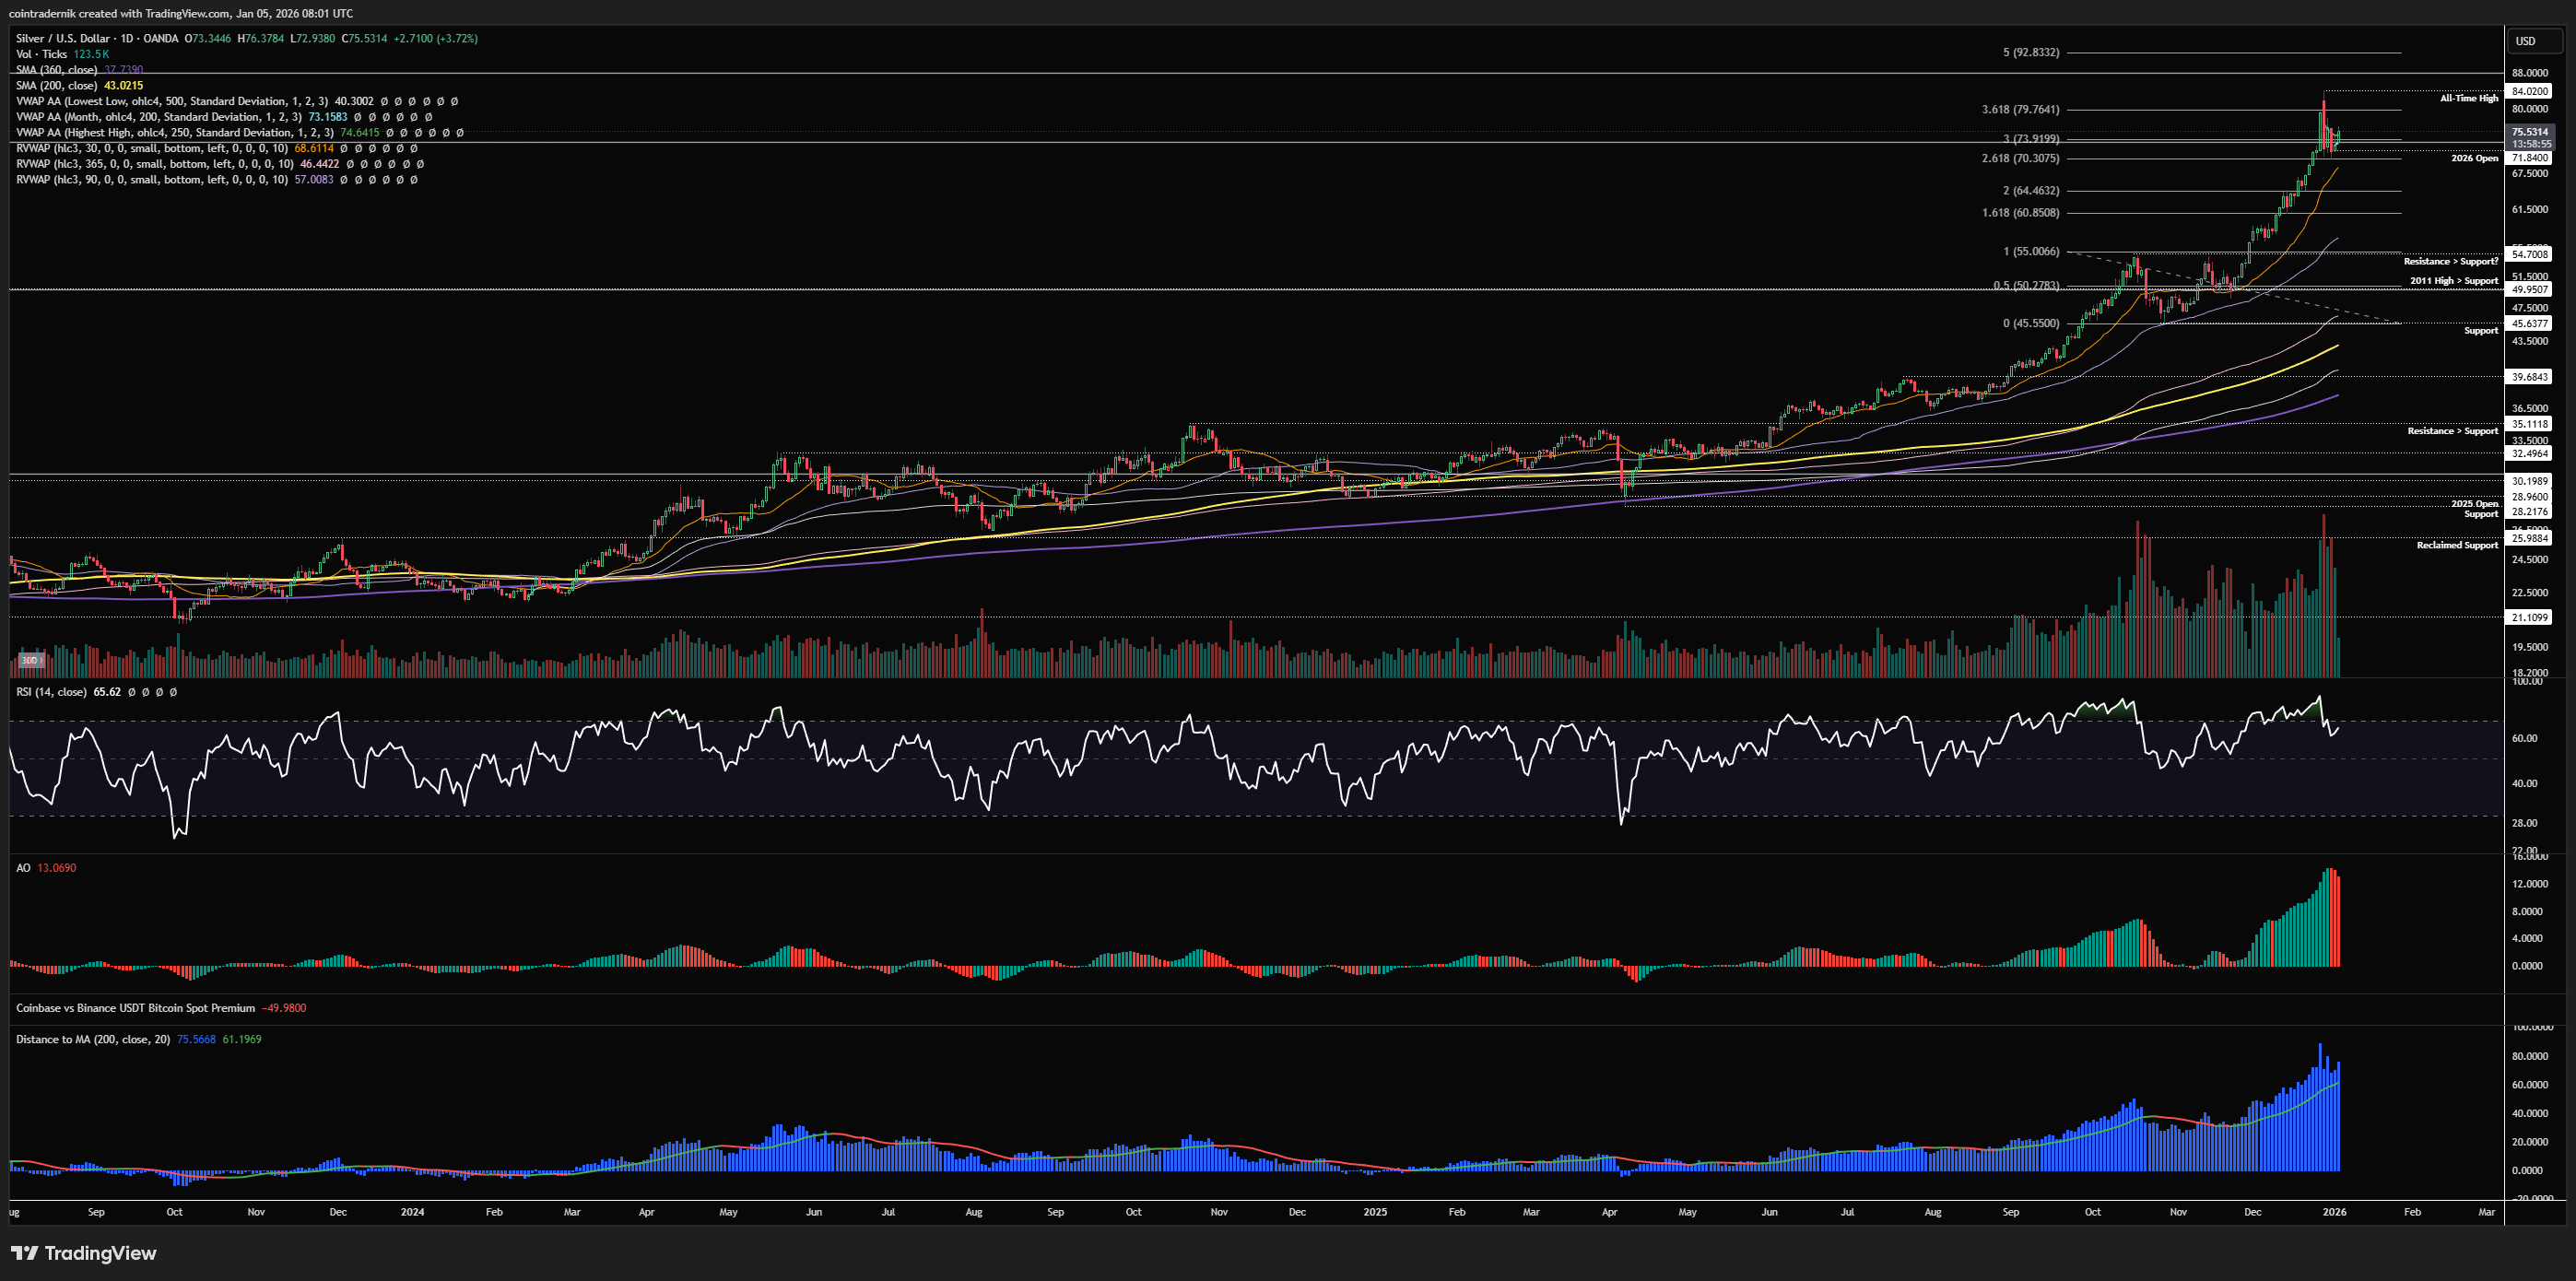
Now, looking at the daily, we can see that price has been ripping higher since November, putting in a Q4 low at $45.63 and then blasting through $54.70 resistance and running higher all of December, tagging the 3.618 extension of the October consolidation range. We are above the 30d rolling VWAP and look - as of this morning - to be putting in a higher-low above $70. Daily momentum is still strong, with no trend exhaustion and with RSI having reset a touch on the correction off the high. That said, we are now also the most overextended we have been from the 200-day moving average throughout this trend (so multiple timeframes are showing overextension). Again, just being overextended doesn't mean anything in isolation, and given the structure and momentum here we should expect another test of all-time highs to follow, but should we then see some daily trend exhaustion above $84 and buyers trapped above that high as price rejects again, I'd be quite confident we've put in at least a quarterly top. Assuming we break through $84 cleanly, I would be looking at $93 and then $100 for signs of exhaustion. I am not looking for Silver longs up here despite the structure, because I just don't see very good risk/reward - I suppose if you were fishing for a long you could enter on a pullback into $73.90 this week with a stop on a daily close below $70, looking for new highs, but I don't really like it. Should we fail to make new highs and break lower below $70, I think this returns towards the 90d rolling VWAP currently at $57 sometime in H1.
Receive the latest updates directly to your inbox

Price: $5.88
Weekly:
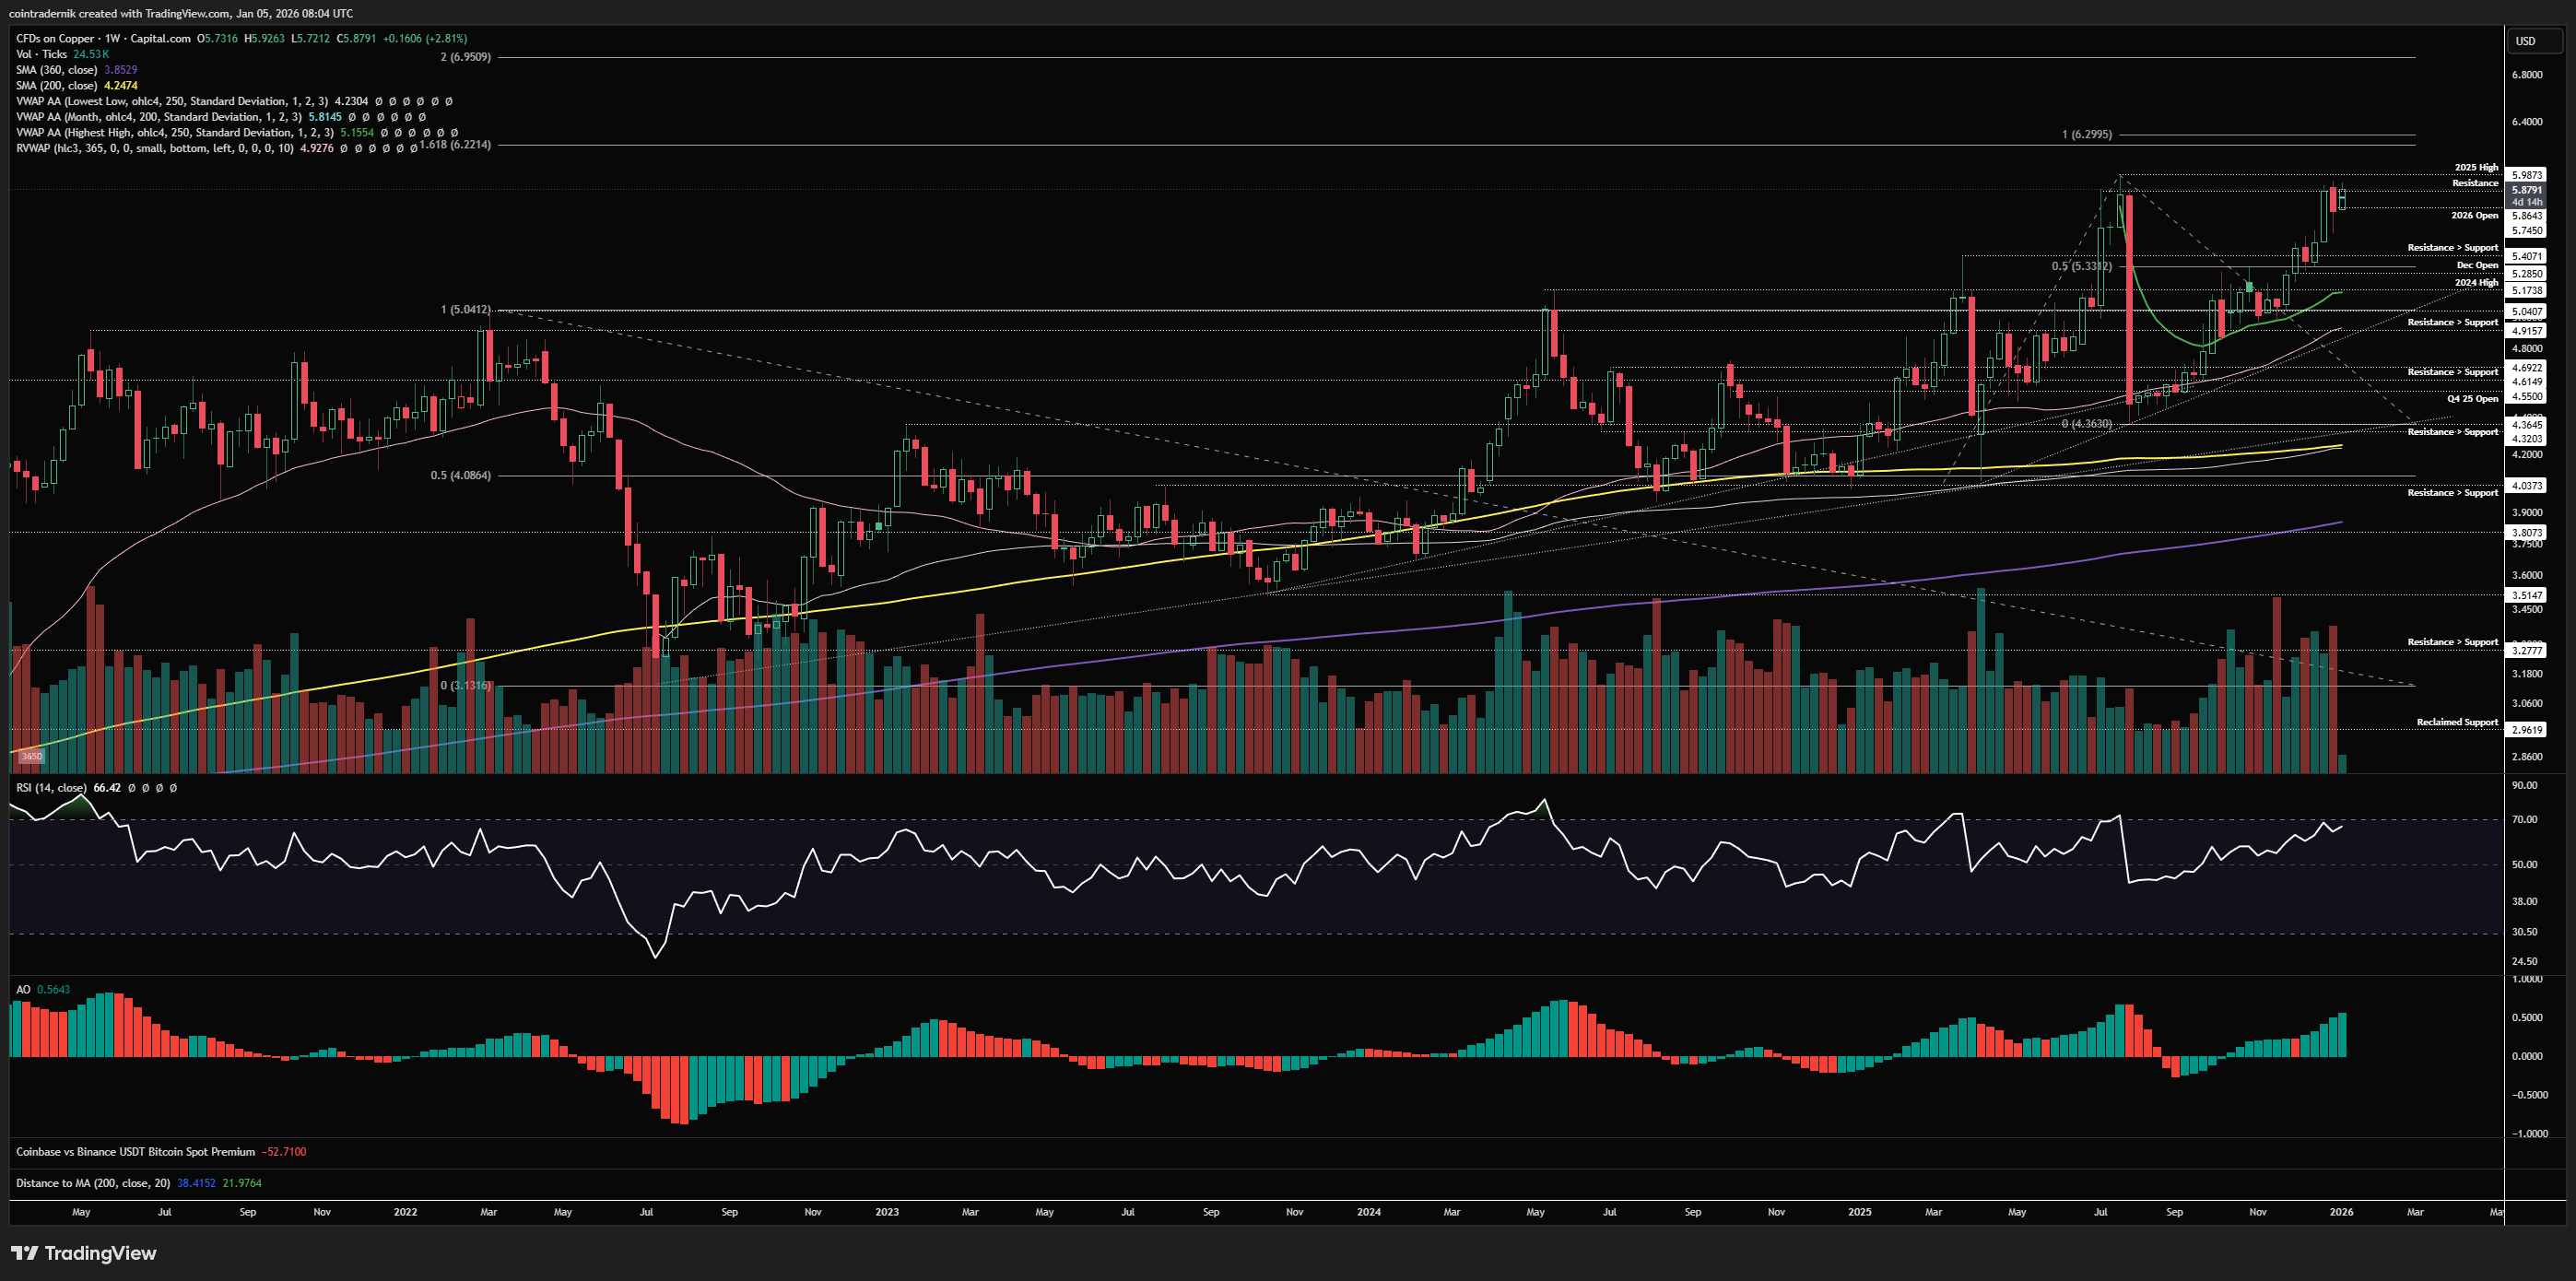
Beginning with the weekly for Copper, we can see that price is in a strong multi-year uptrend that continues to print higher-lows despite numerous major shakeouts and volatility events. The trend is actually steepening, albeit slowly, as price now approaches the 2025 high at $5.98, above which Copper is in price discovery, with $6.30 as the next target above that, but the 200% extension of the 2022 bear market up nearer $6.95. I have been a Copper bull since $4, pretty much exclusively trading longs, buying dips etc. throughout that period, most recently buying the pull-back into the anchored VWAP from the all-time high in Q4. I am now expecting to ride this position for most of Q1 and Q2, which is seasonally strong for Copper and likely to be particularly bullish given the structure and momentum profile here. If we get a weekly close above $6, I think this accelerates very swiftly into $6.30 but we don't find much resistance until we're closer to $7, where I would be looking for signs of exhaustion. Copper is, in my view, a much more favourable bet here for H1 than Silver, for example, given where both are sat technically.
Daily:
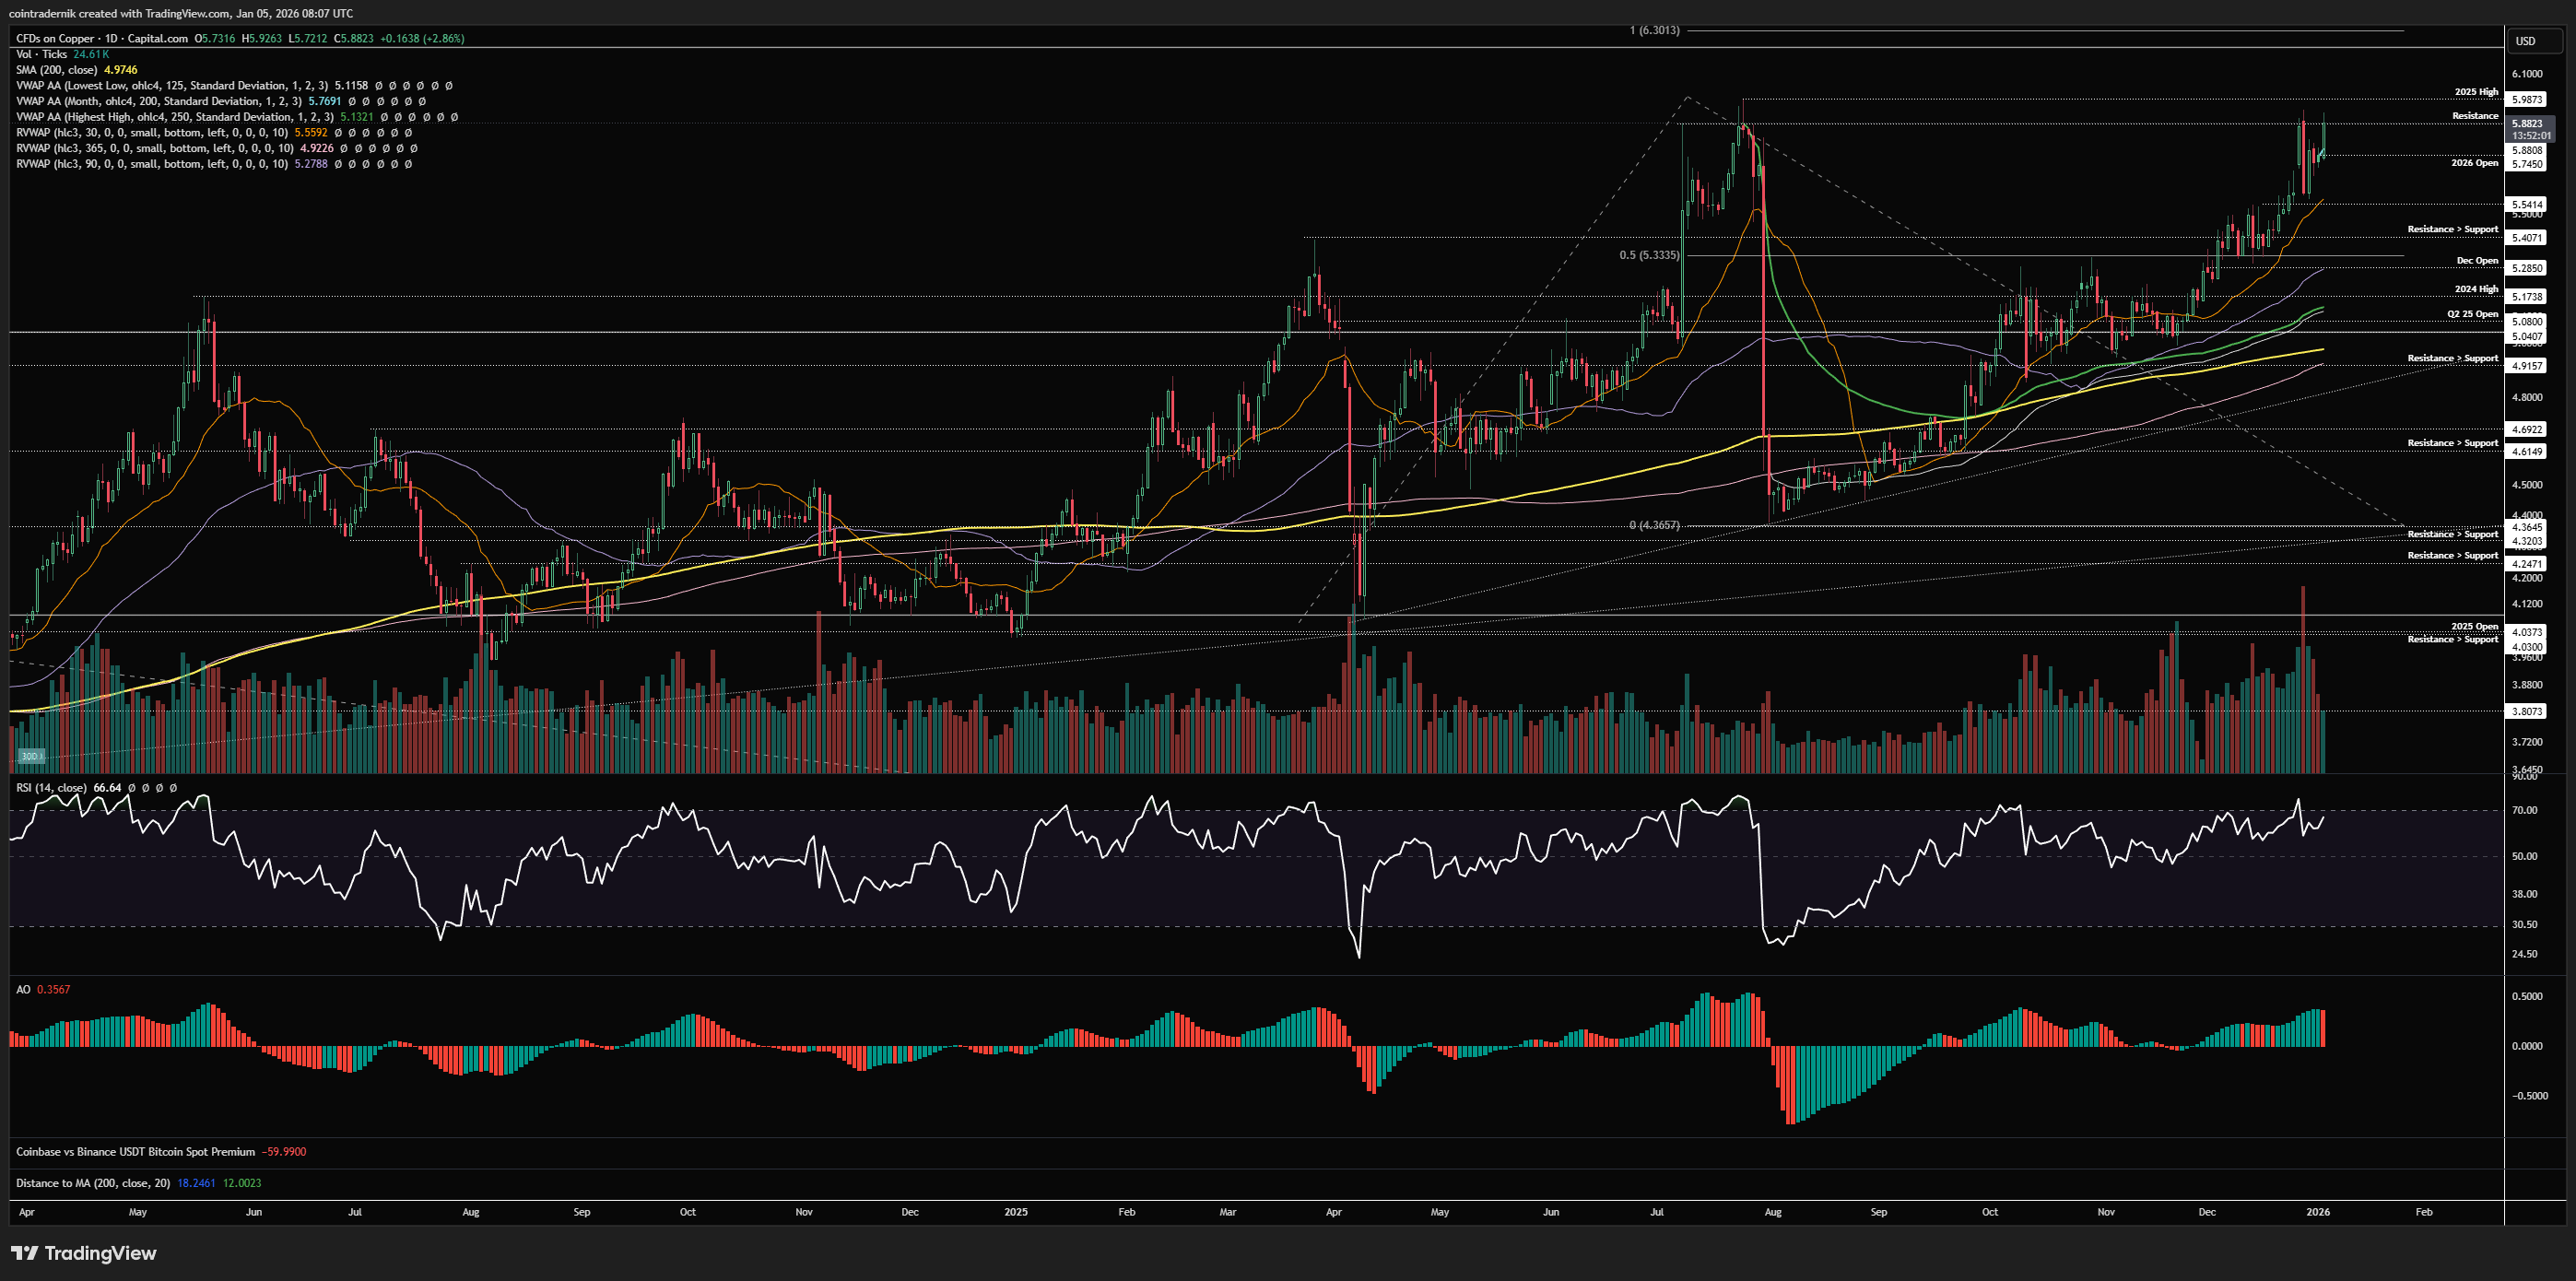
Turning to the daily, we can see the trend more clearly, and it has been brutal for its many whipsaws, though each time marking out a higher-low, which is notable. We most recently marked out a low in August at $4.36, then consolidating in a tight upwards channel for a couple of months before breaking out and beginning the next leg higher, riding the 30d rolling VWAP all the way into $5.30, where price found resistance in Q4. We then consolidated and pulled back multiple times into the anchored VWAP from all-time highs as momentum reset, then pushing off the confluence of that anchored VWAP and the 90d rolling VWAP in late November. Since, Copper has ridden the 'Metals Madness' wave, albeit more slowly than others, but is now sat consolidating below resistance at $5.90, having closed 2025 at $5.75. We are a stone's throw from new highs now as price breaks higher this morning, and both momentum and structure are supportive of price discovery in January. Flipping $6 into support on the daily will begin that next leg higher, where I would expect Copper to begin outperforming Gold and Silver towards May.
Price: $2188
Weekly:
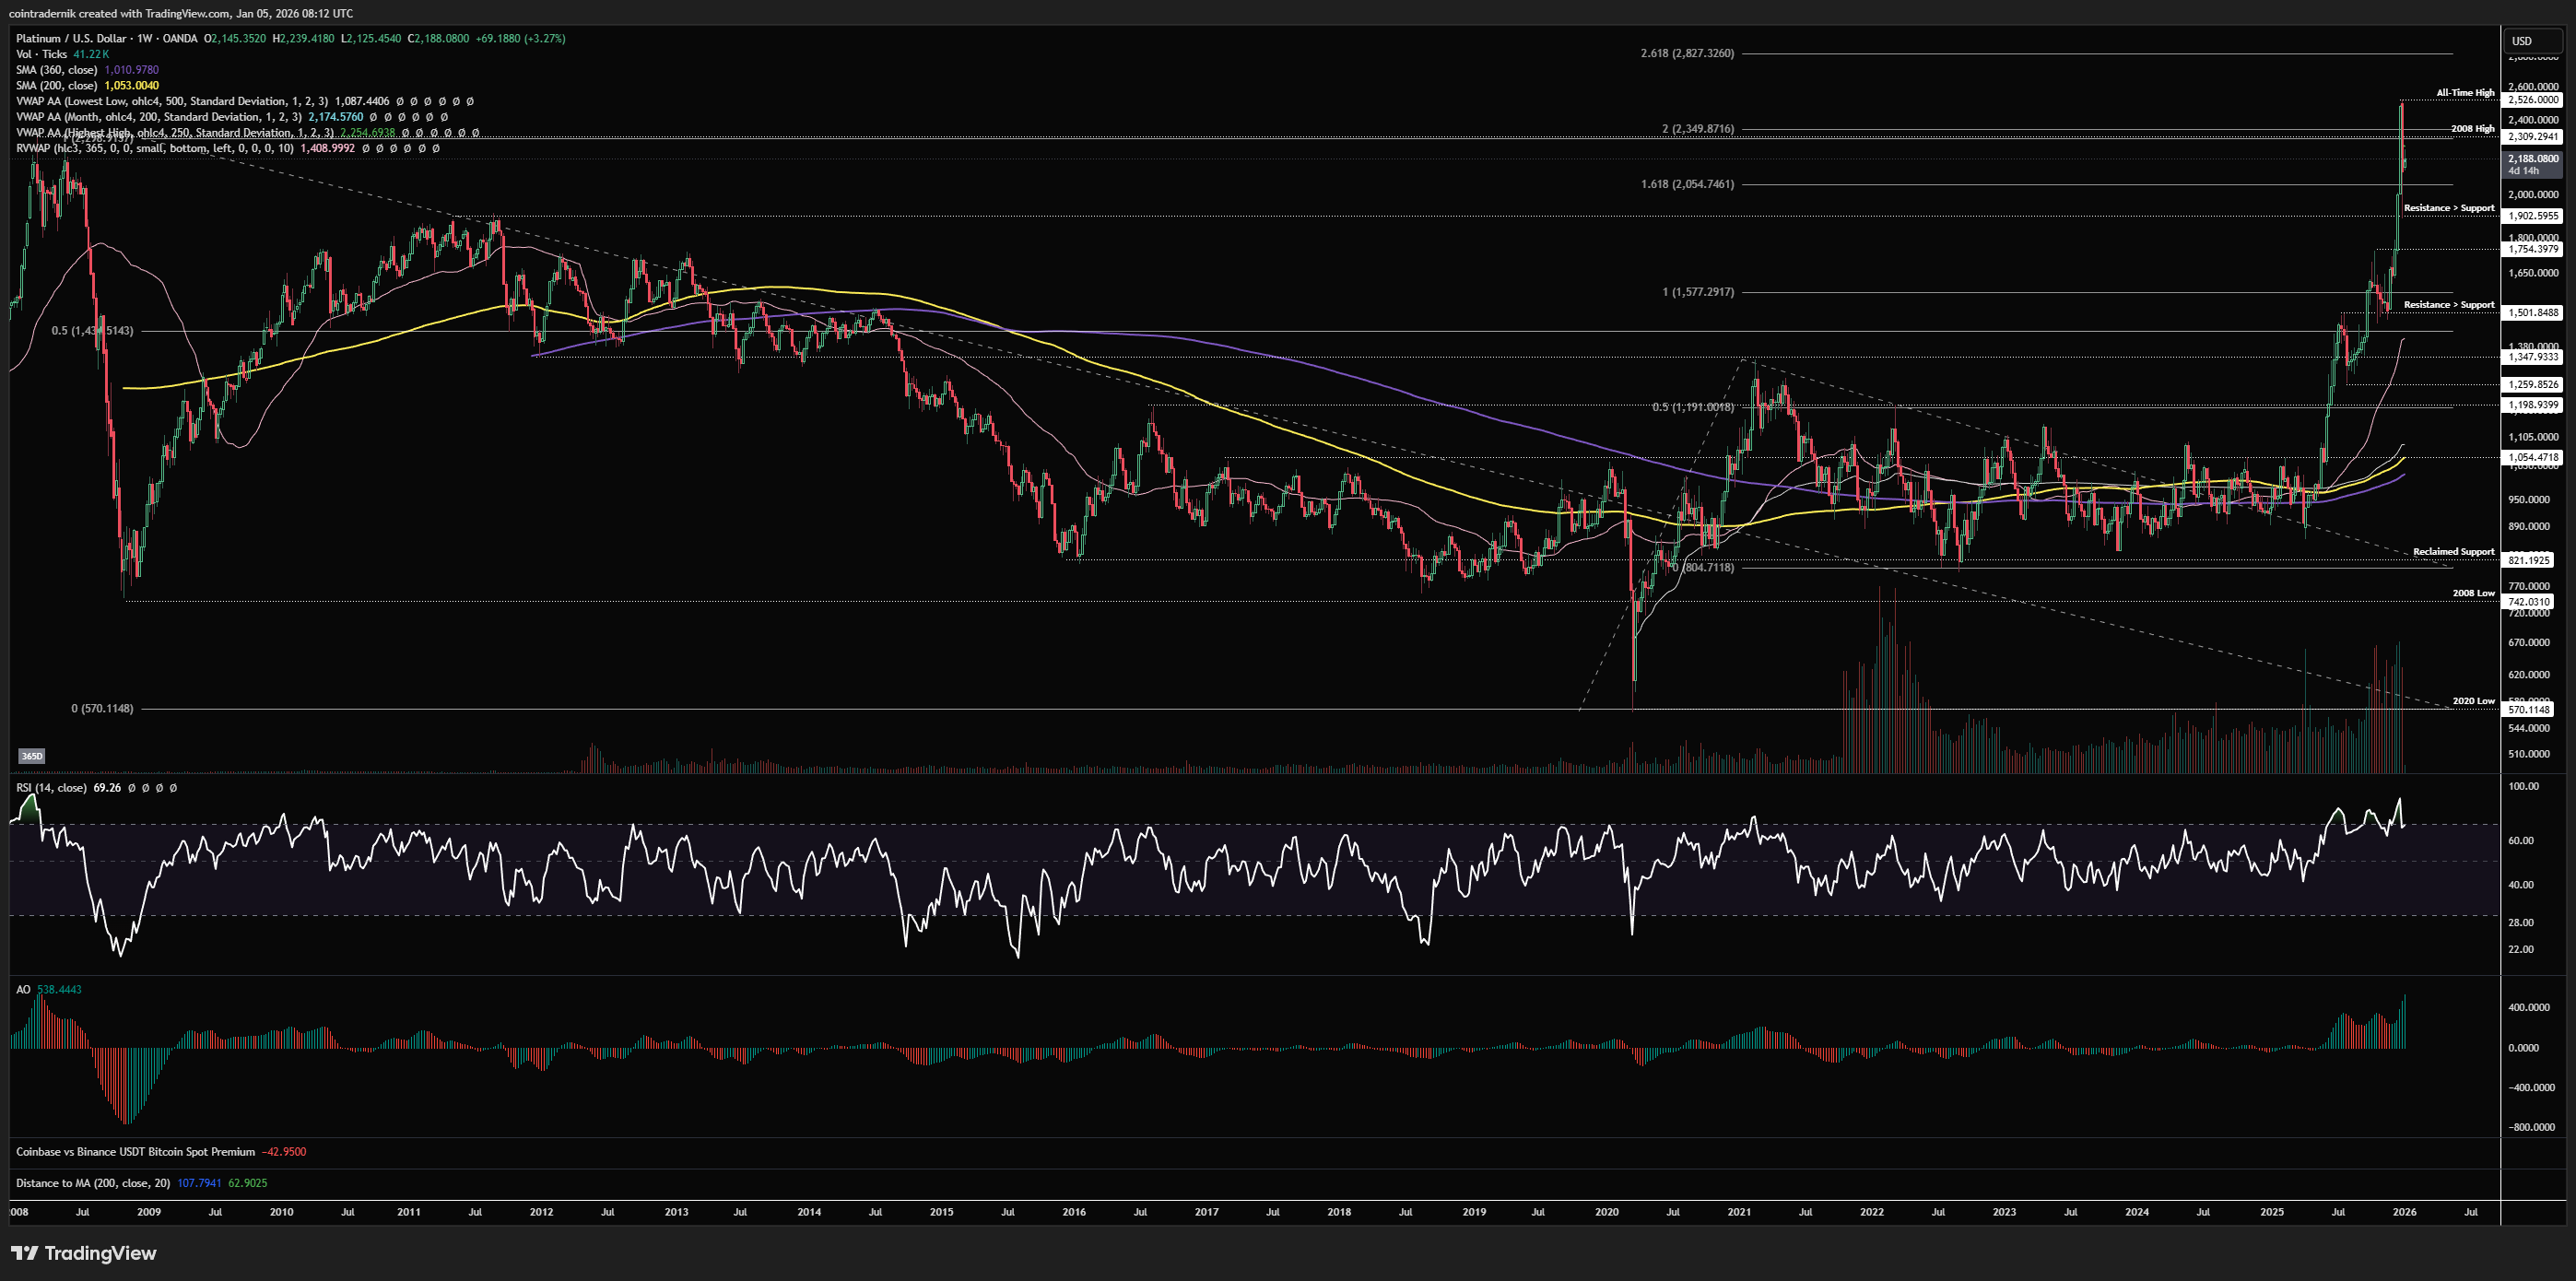
Beginning with the weekly for Platinum, this metal has been almost as parabolic as Silver through Q4, rallying off prior resistance turned support at $1500 into new all-time highs at $2526, above the 2008 highs at $2309, in the space of a couple of months. Weekly momentum is still bullish here with no signs of higher timeframe exhaustion, but Platinum also suffered from the snapback off the highs last week, closing the week at $2145, firmly back below both the new all-time high and that 2008 high. Despite this, we are still well above the next level of resistance turned support at $1900, and if weekly momentum is bottoming out here we should expect a reclaim of the 2008 high as support to follow: flip that $2309 level into support on the weekly and I think we push towards $2827 as the 2.618 extension of the current trend off the 2020 lows.
Daily:
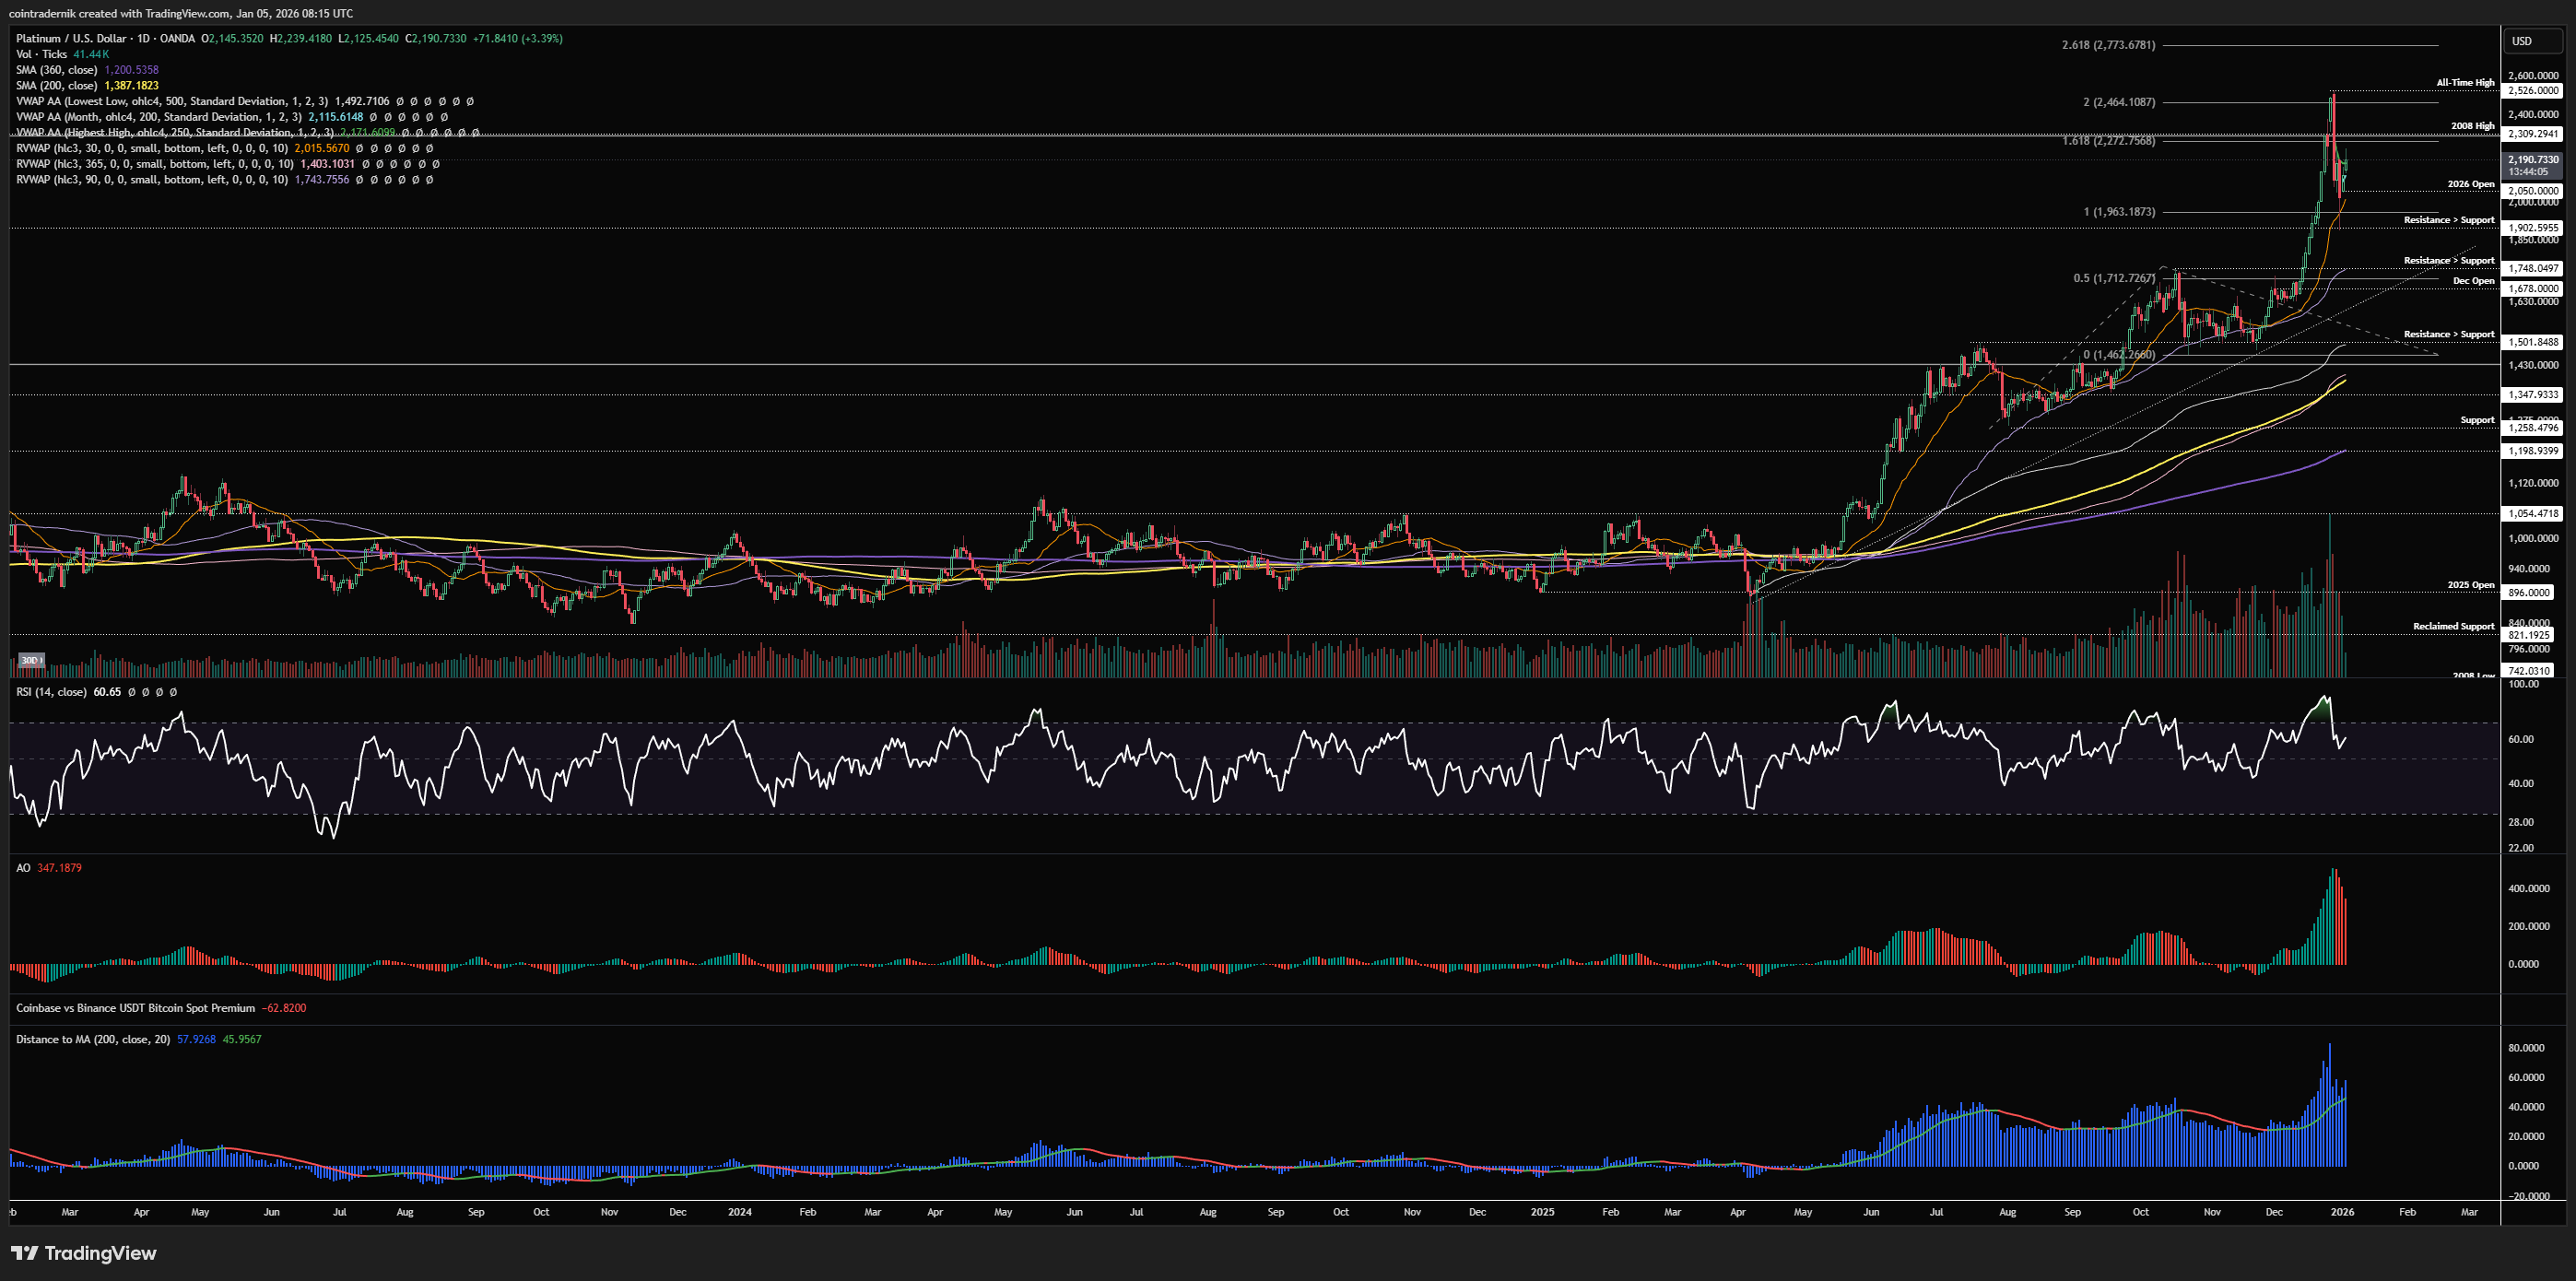
Looking at the daily, we can see that daily momentum is also still supportive of trend continuation with no exhaustion as of yet, but we do need to be wary of the same dynamics as Gold, where we have broken above a prior all-time high amidst peak social interest in metals and then immediately closed back below it. If the 2008 high acts as resistance this week and we reject below $2309, look for a daily close below the 30d rolling VWAP at $2015, as that would look very much like an interim top, from which we would be likely to return to prior resistance turned support and the 90d rolling VWAP at $1750. That $1750 area is where I would begin to look for swing-long setups to form should we get down there, with a view to riding the longer-term trend higher back above all-time highs. Should this current structure hold and price flip $2309 into support this week, the 2.618 extension of the prior swing is near enough where that higher timeframe fib extension is sat, and so we should be looking at somewhere between $2775-$2825 as the range for the next round of sellers to step in. Again, I would not be looking for fresh longs right here because we have the potential for a failed breakout above the 2008 high, but if we do reclaim it then you could look for longs on the lower timeframes (with tighter invalidation) towards that $2800 zone.
Price: $1696
Weekly:
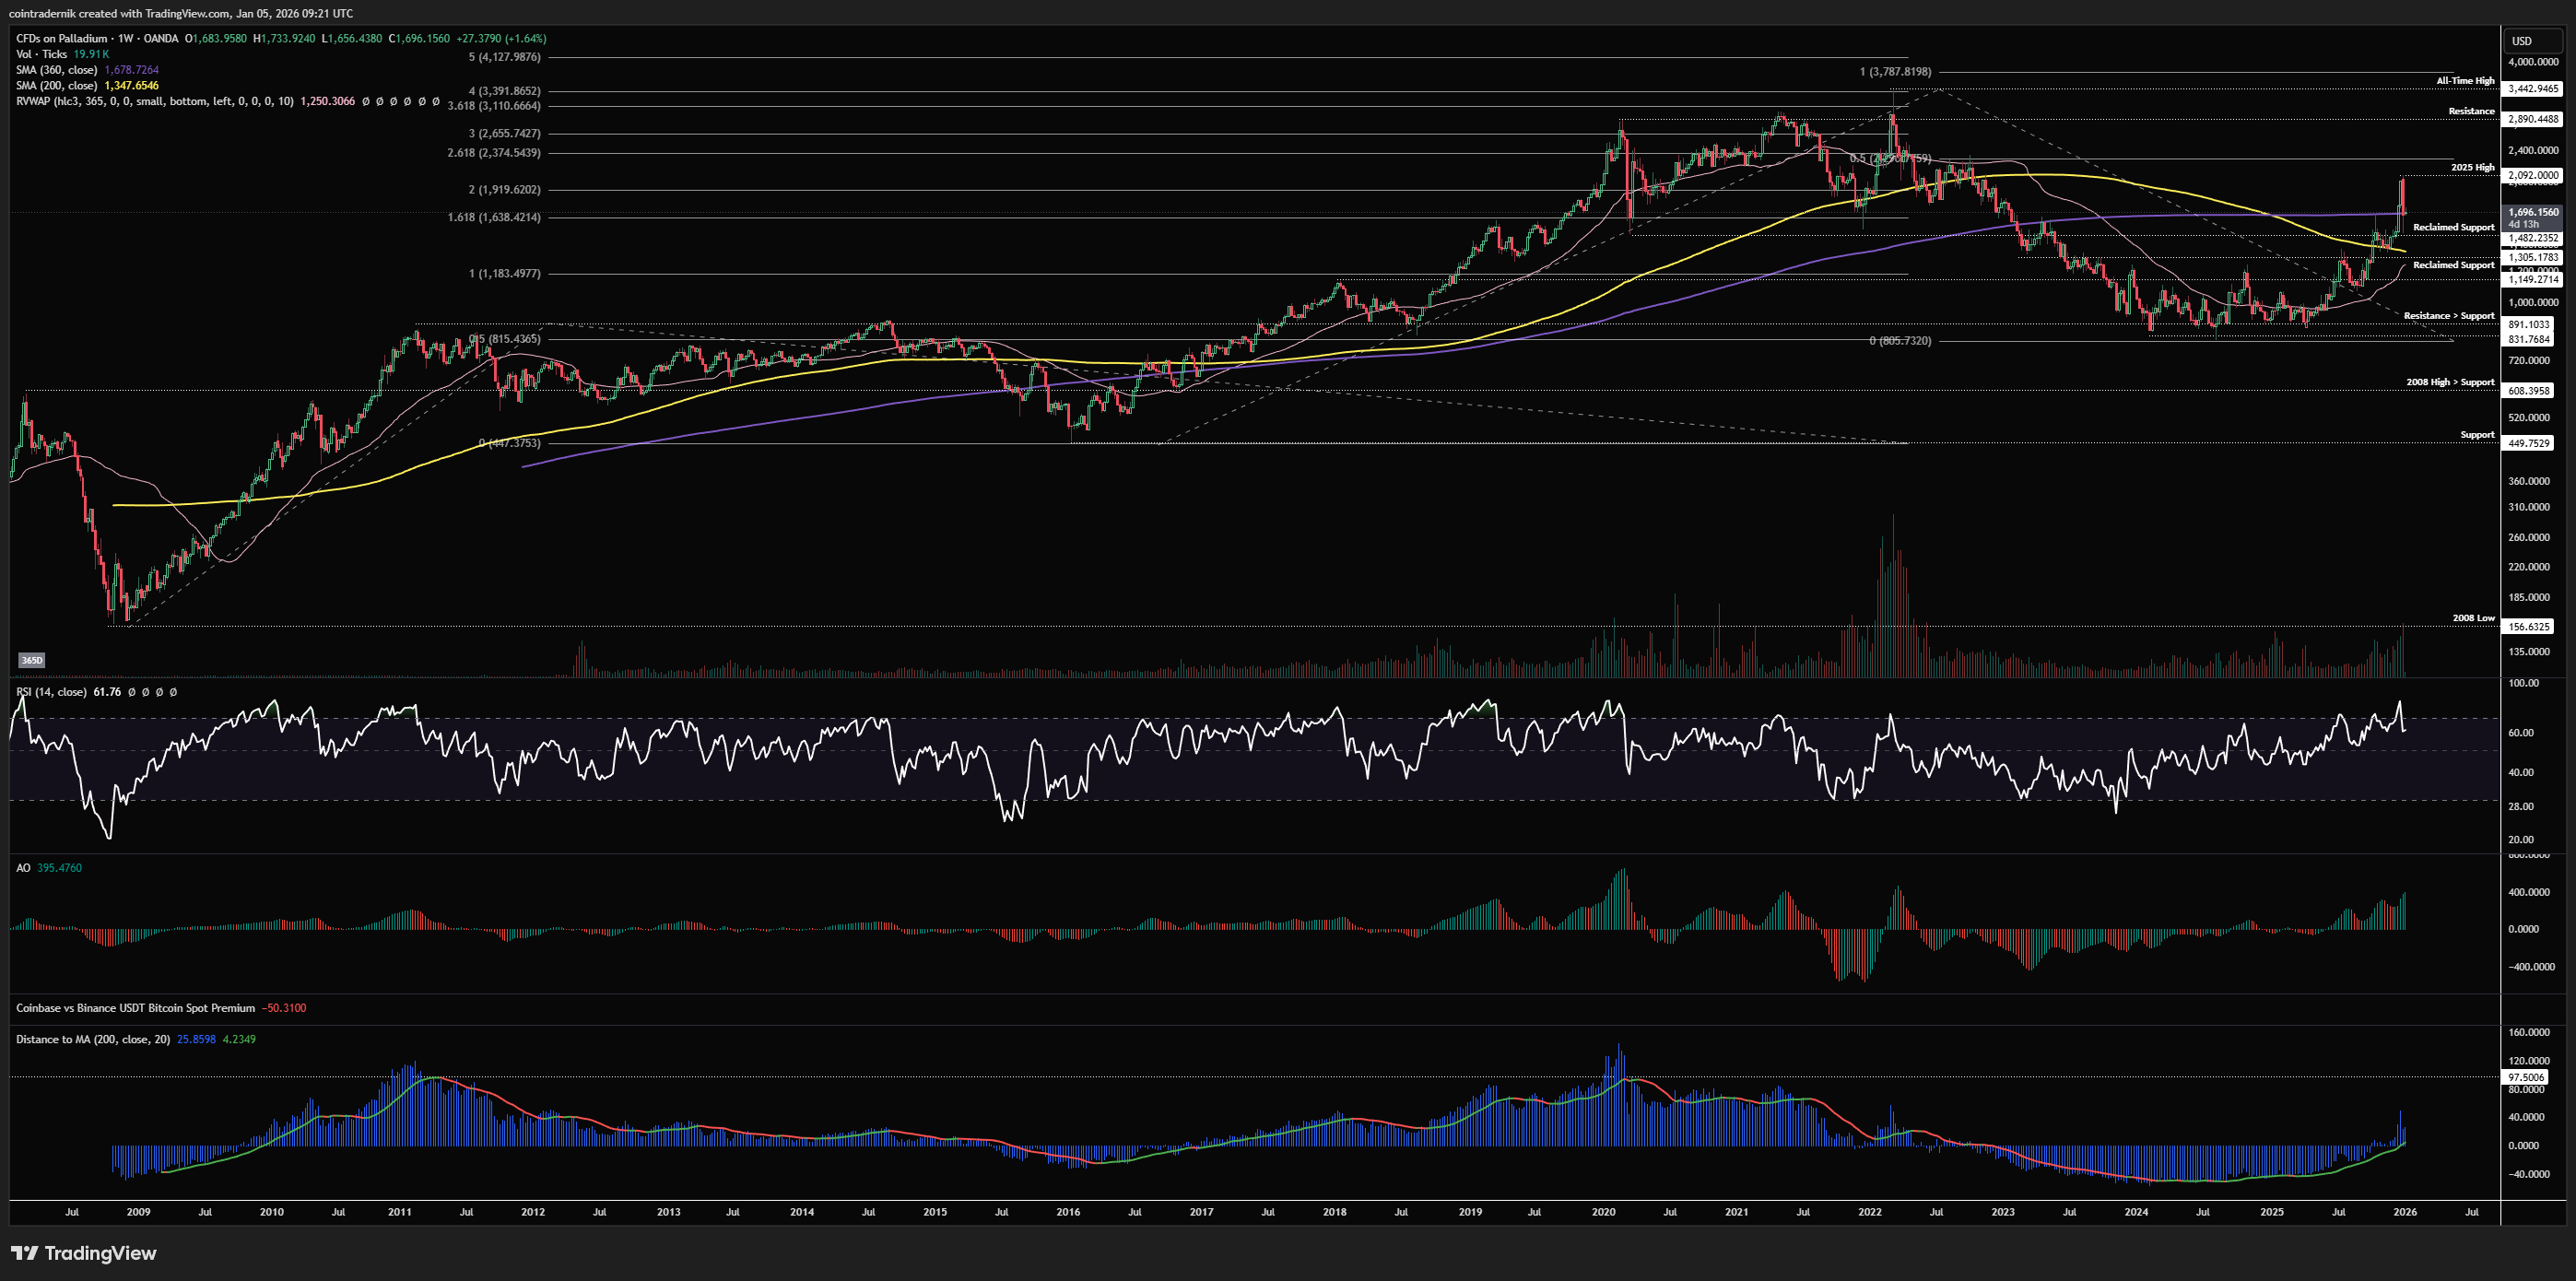
Beginning with the weekly for Palladium, we have a much nicer setup here for anyone looking to ride the trend higher than we do for say Silver, as price has been in a structural bull market since the 2009 low, marking out a higher-low in 2015 and then again in 2024/25, where price formed a re-accumulation base at the $830 resistance turned support level. We have since broken above range resistance at $1150 and begun what appears to be another leg higher in this 16-year bull market. Price flipped $1150 into support in mid-2025 and has since been textbook in its market structure, reclaiming prior support levels from the 2022 downtrend. We are now sat below the 2025 high at $2092, with price having rejected last week, retested support at $1482 and bounced to open this week at $1683. Weekly momentum is firmly bullish, and price is nowhere near historically overextended. In 2011 and 2020 we saw Palladium hit over 100% extension from the 200-week moving average and right now we are about 25% above it. I would look to buy dips for the foreseeable future in Palladium, with a view to a breakout above the 2022 all-time highs at $3442 sometime in 2026 going into 2027.
Daily:
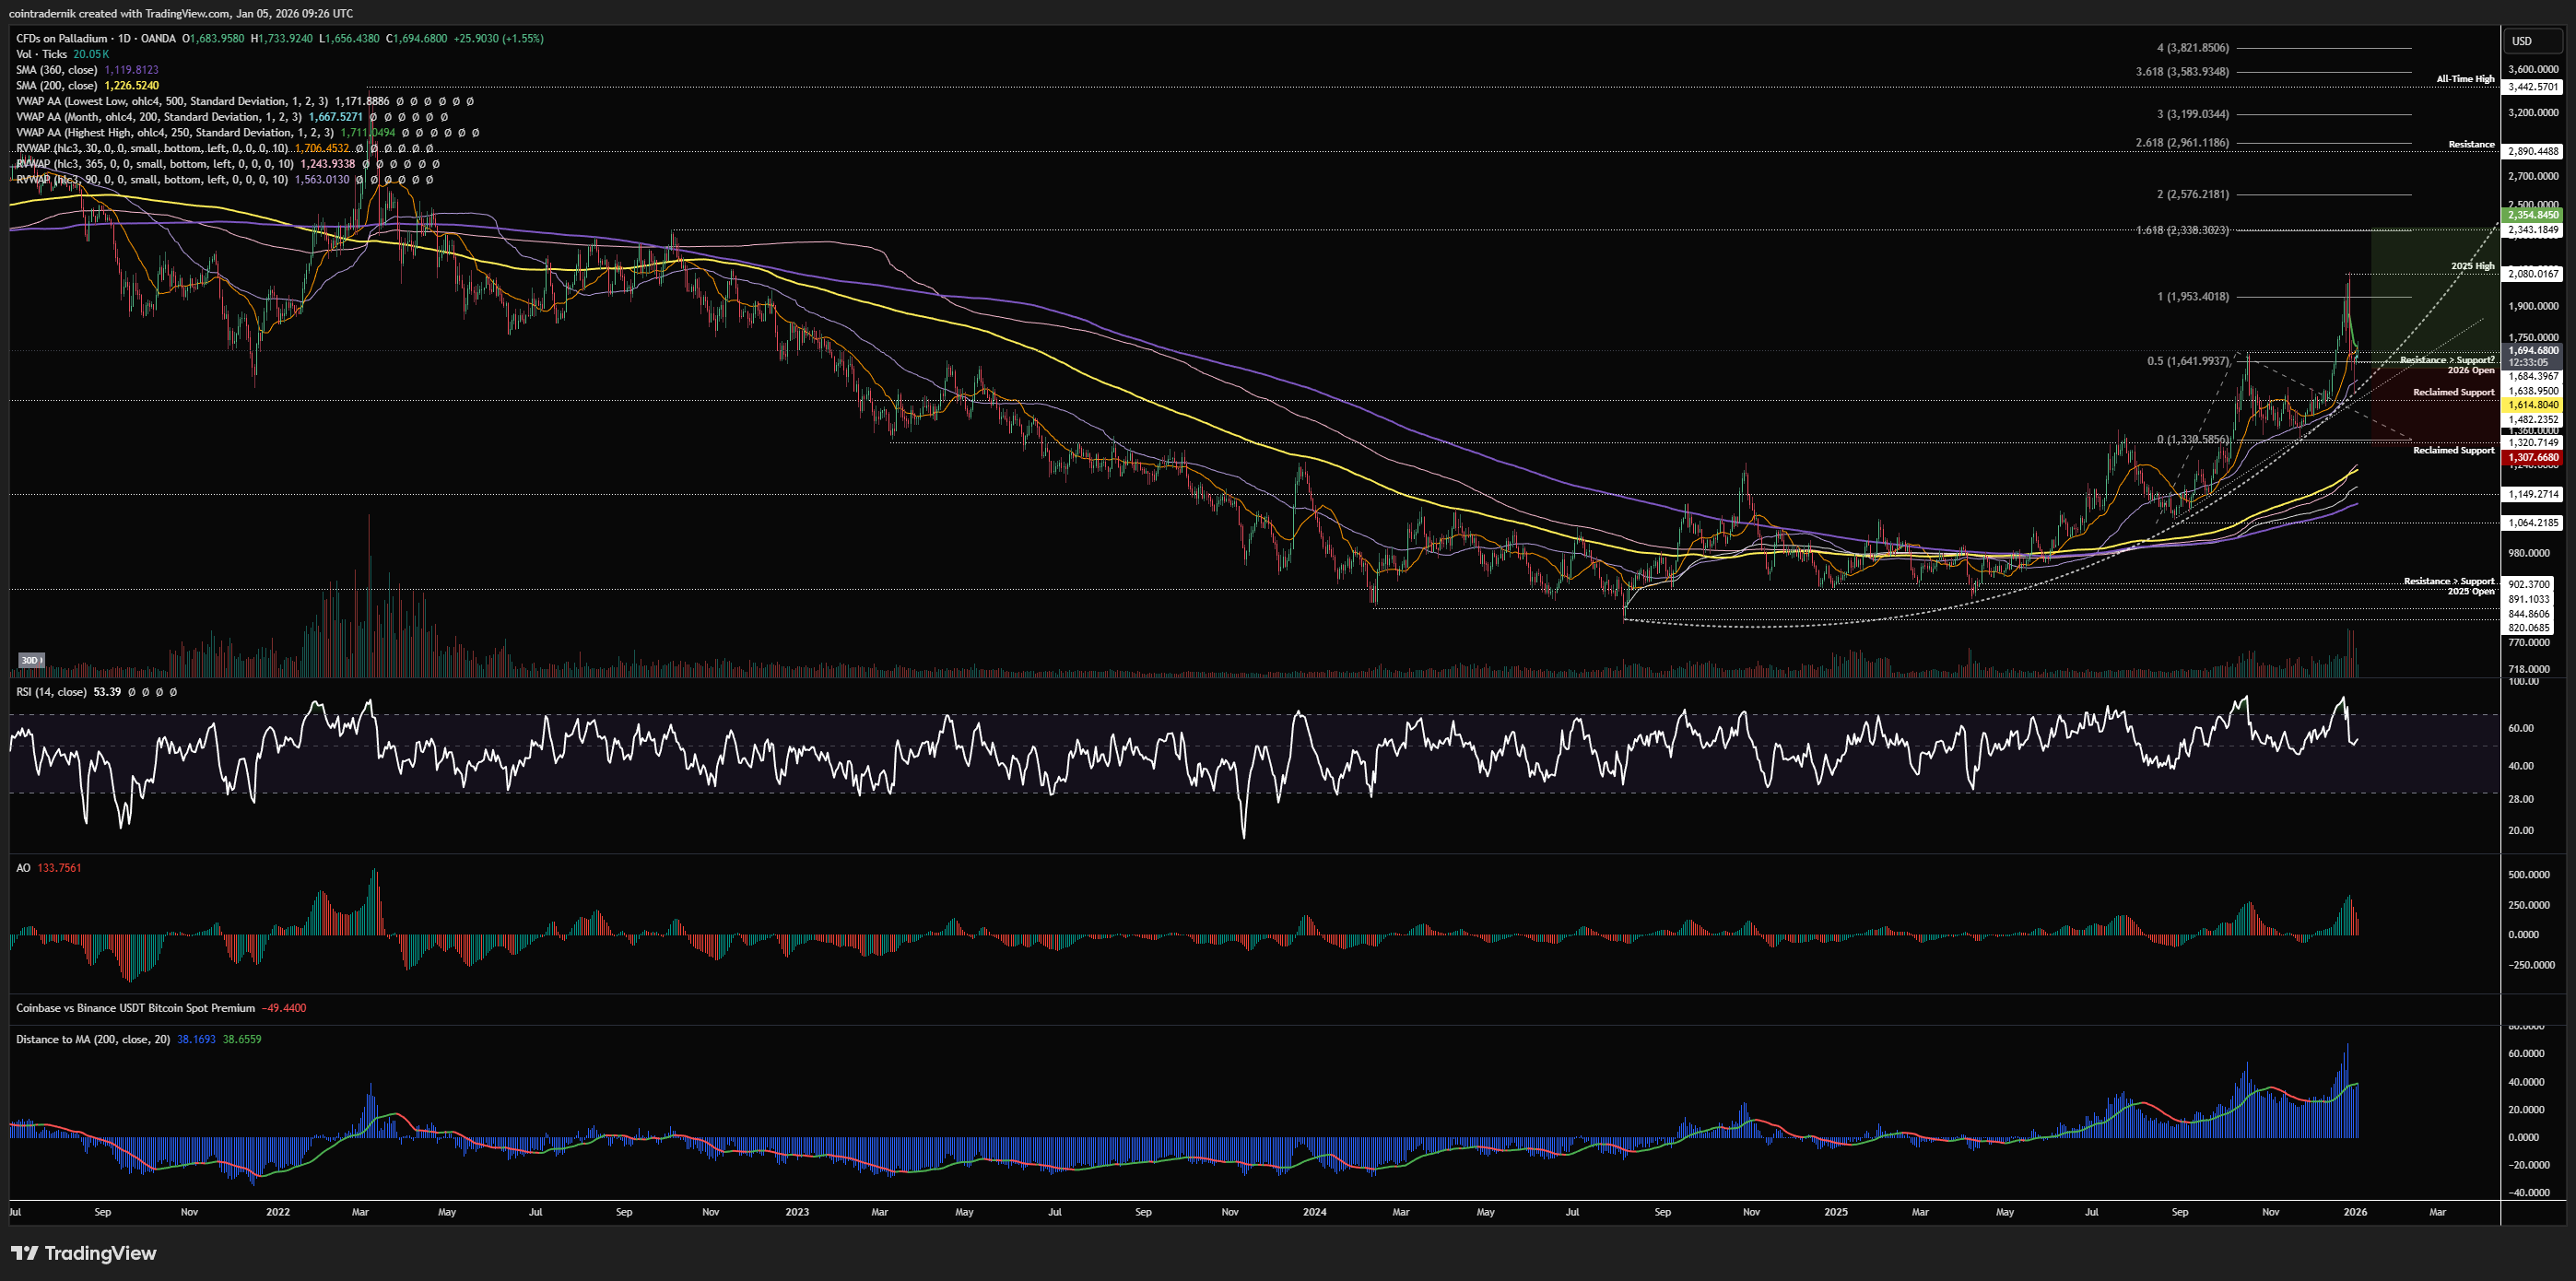
Turning finally to the daily timeframe for Palladium, we can see that structure and momentum here are also still bullish, with a parabolic trend underway following the range breakout, and with prior resistances turning support as price drives higher. We rejected at $2080 and bounced last week at the 90d rolling VWAP at $1563, above reclaimed support at $1482, and we are now sat above the prior resistance at $1684. If I was looking for a long here, I'd want to buy the next dip below the 2026 open, hopefully early this week, with invalidation near $1300 and TP1 at the 1.618 extension of the current trend at $2338, which is also a historical resistance level. I would also be looking to exit this early if we flipped the 90d rolling VWAP and $1482 into resistance. TP2 on this position should it begin to play out would be historical resistance at $2890, followed by all-time highs at $3442, although Palladium is a relatively slow mover and so I'd be wary of your funding costs if just punting a long-term position as a buy and hold. To me, it makes more sense to view this as a structural trend higher and play around that with swing positions. If we do lose $1482 as support, the picture looks quite different and I would expect $1300 to be retested at the very least...
So, if you've made it this far, congratulations: you have an attention span greater than a goldfish.
As a reward for such commitment, here's my thoughts on Crude Oil and PLTR for the week ahead - reminder that you get 2x Points and pay half fees on both of these at Ostium this week:
Price: $58.64
Weekly:
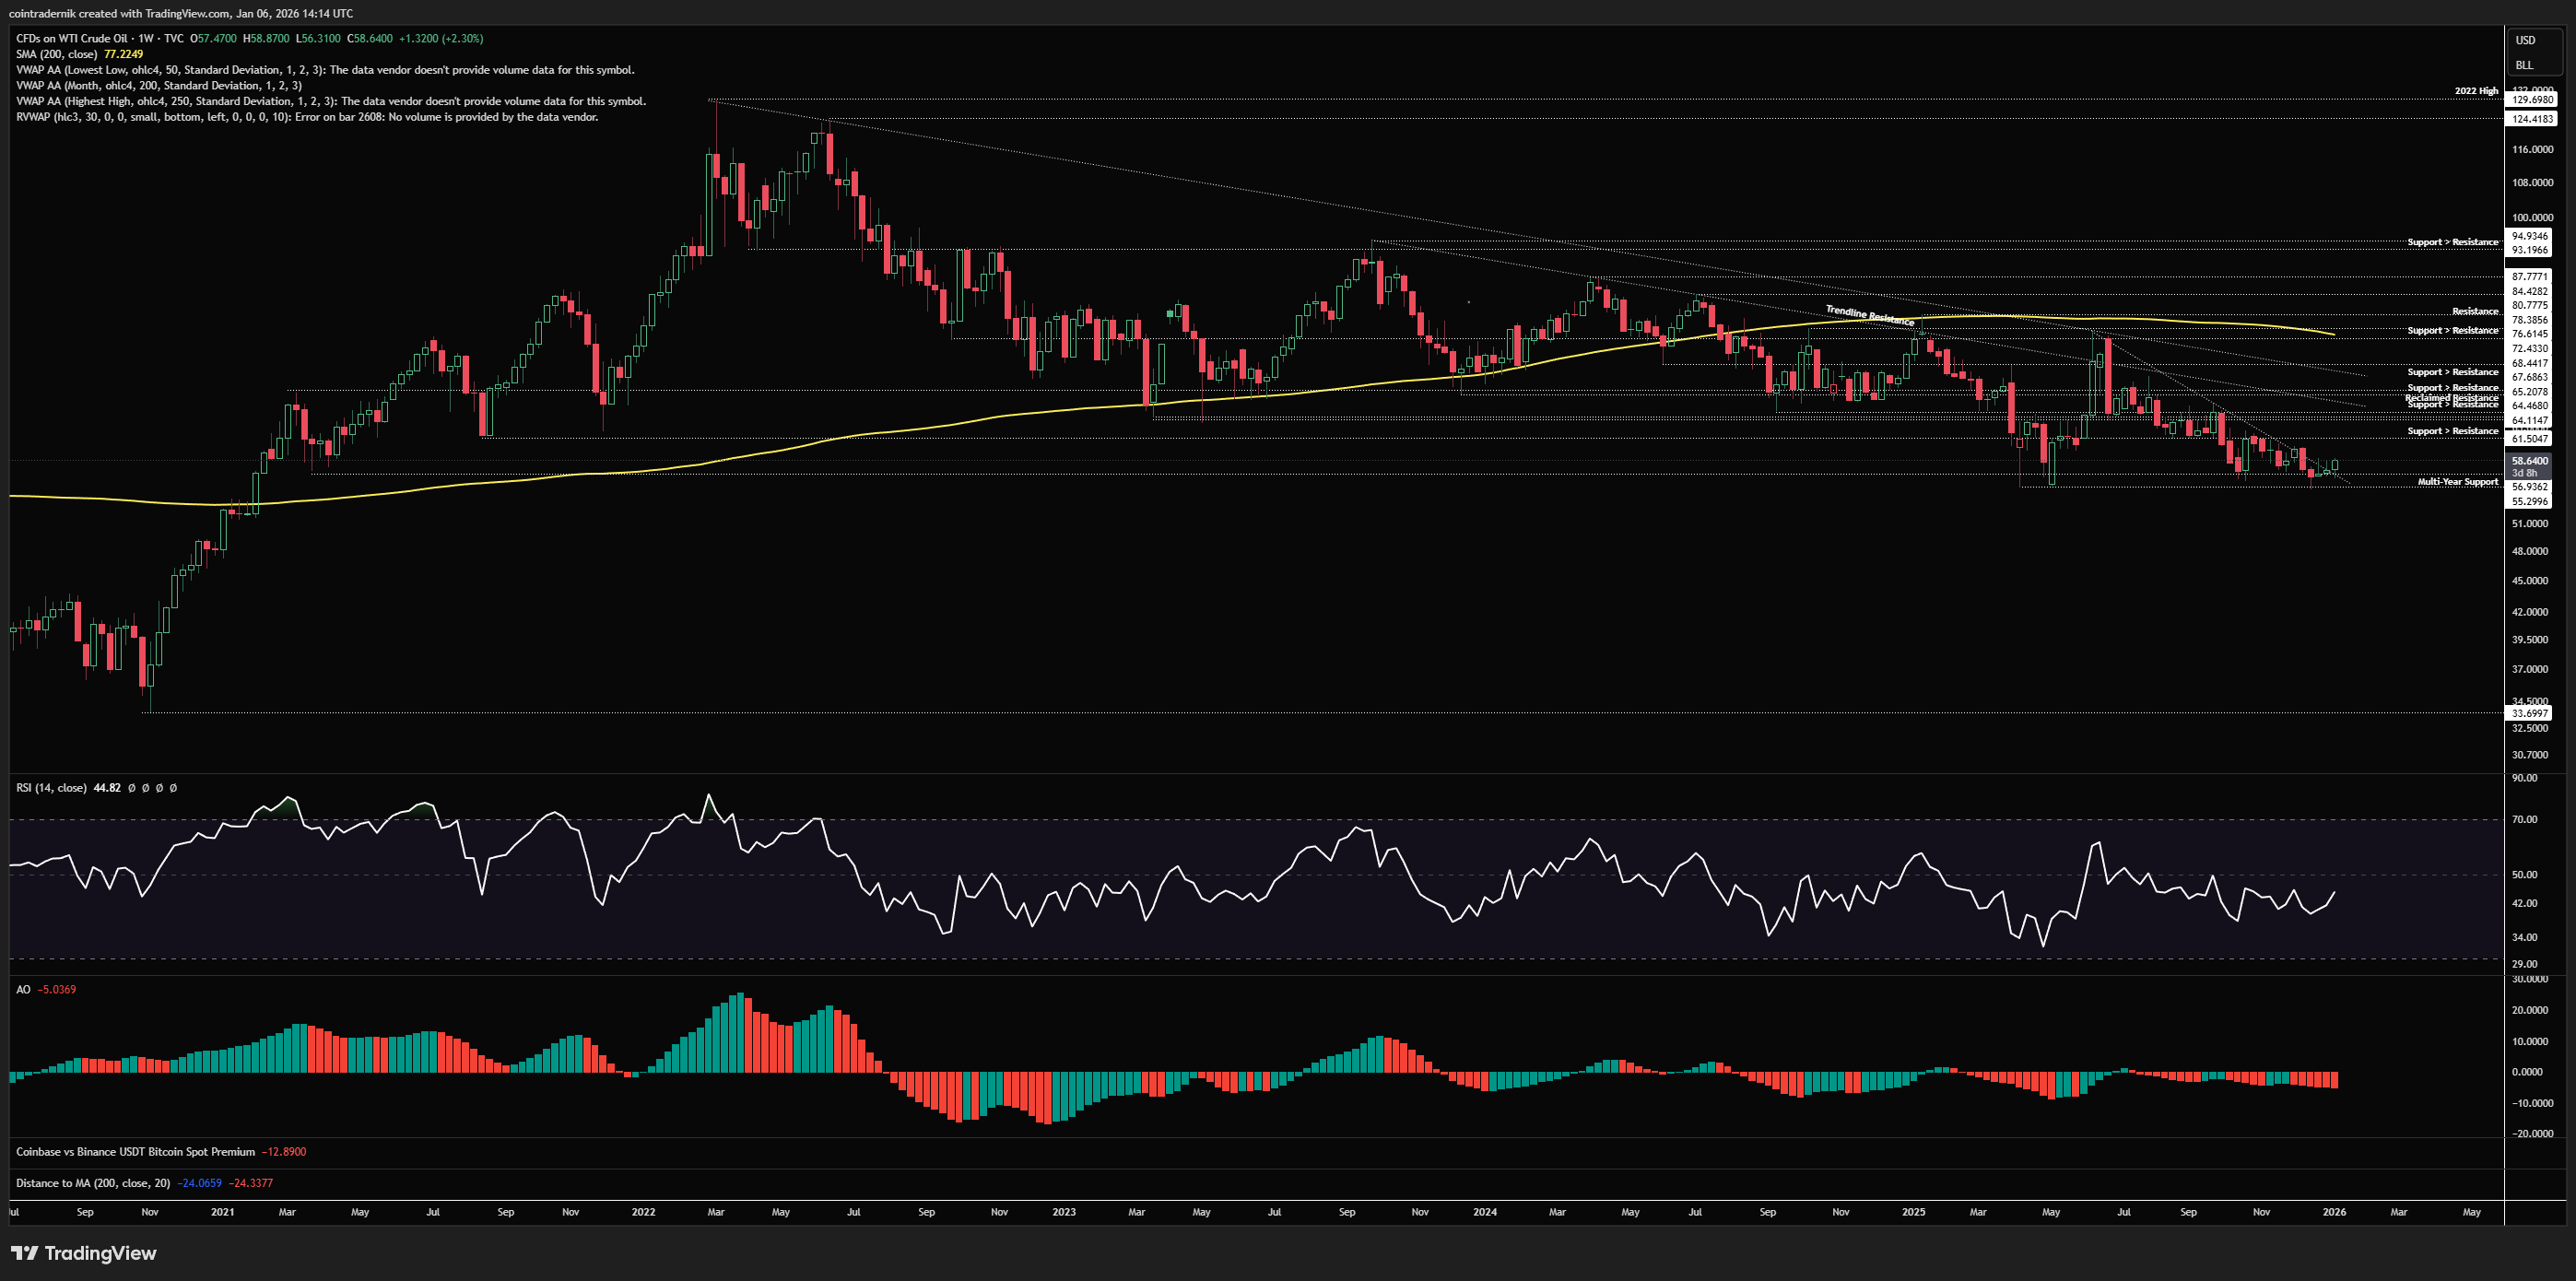
If we begin by looking at the weekly for Crude Oil, we can see that price swept the multi-year support at $57 into $55 a few weeks ago, consolidating at that support before bouncing, now pushing through trendline resistance from the summer 2025 highs at $77. This, alongside crowded Oil short positioning, could very well lead to a relief rally here, though I am not expecting a structural shift here as of yet, with many headwinds for Oil prices and with weekly structure still very much bearish. That said, buying intraweek dips back into $57 with invalidation on a weekly close below $55 makes sense from a R/R perspective for upside back towards $64 at least, where there is plenty of resistance to overcome. A weekly close above that level does turn structure bullish, but I would still anticipate the long-term downtrend and channel resistance to persist, capping prices below ~$72 in H1 2025. A weekly close below $55 is a market-altering dynamic, where there is basically no higher timeframe support all the way back towards the low $40s.
Daily:
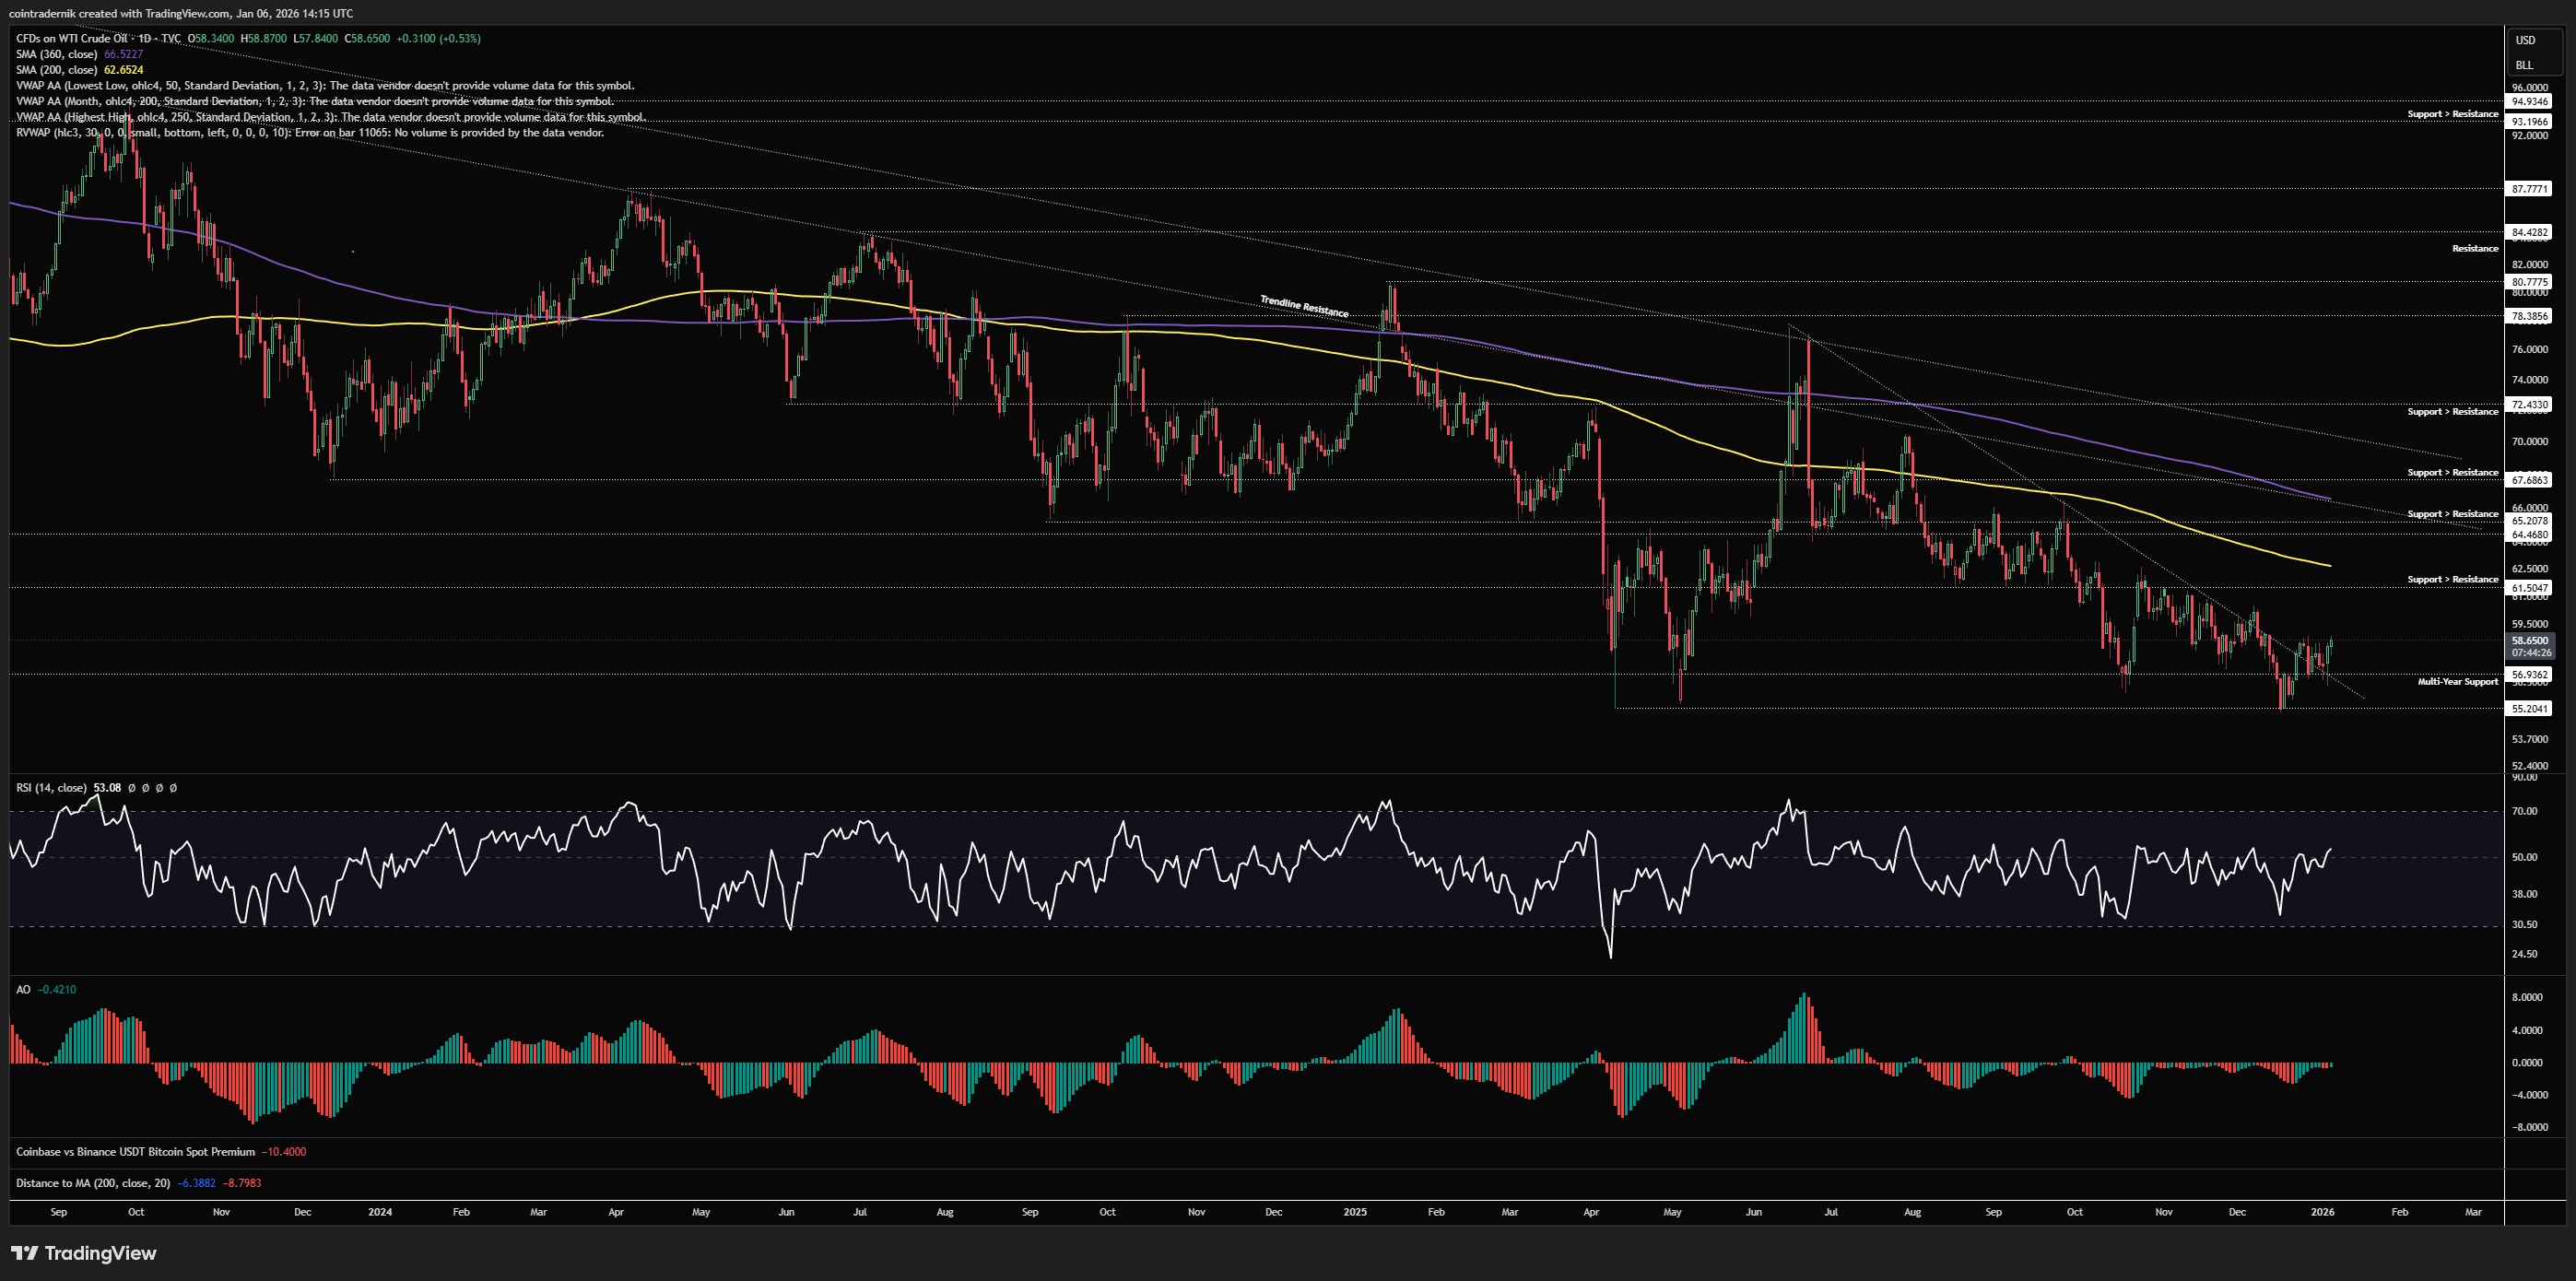
Turning to the daily, we can see this structure more clearly, with a potential spring below $56.94 that preceded this daily breakout, with a backtest of support yesterday. If that support now holds, we should see price push towards $61.50, as prior support turned resistance, with the 200dMA just above that. This would be where I would expect the first round of sellers to step in, and then it becomes a case of assessing whether a higher-low formation is likely above $57 for a second leg higher into that $64.50-$65.30 range, or whether the headwinds are too great despite crowded positioning. I do think things are set up here for a squeeze, but I would not be expecting a breakout above the long-term downtrend at this stage.
Price: $174.04
Weekly:
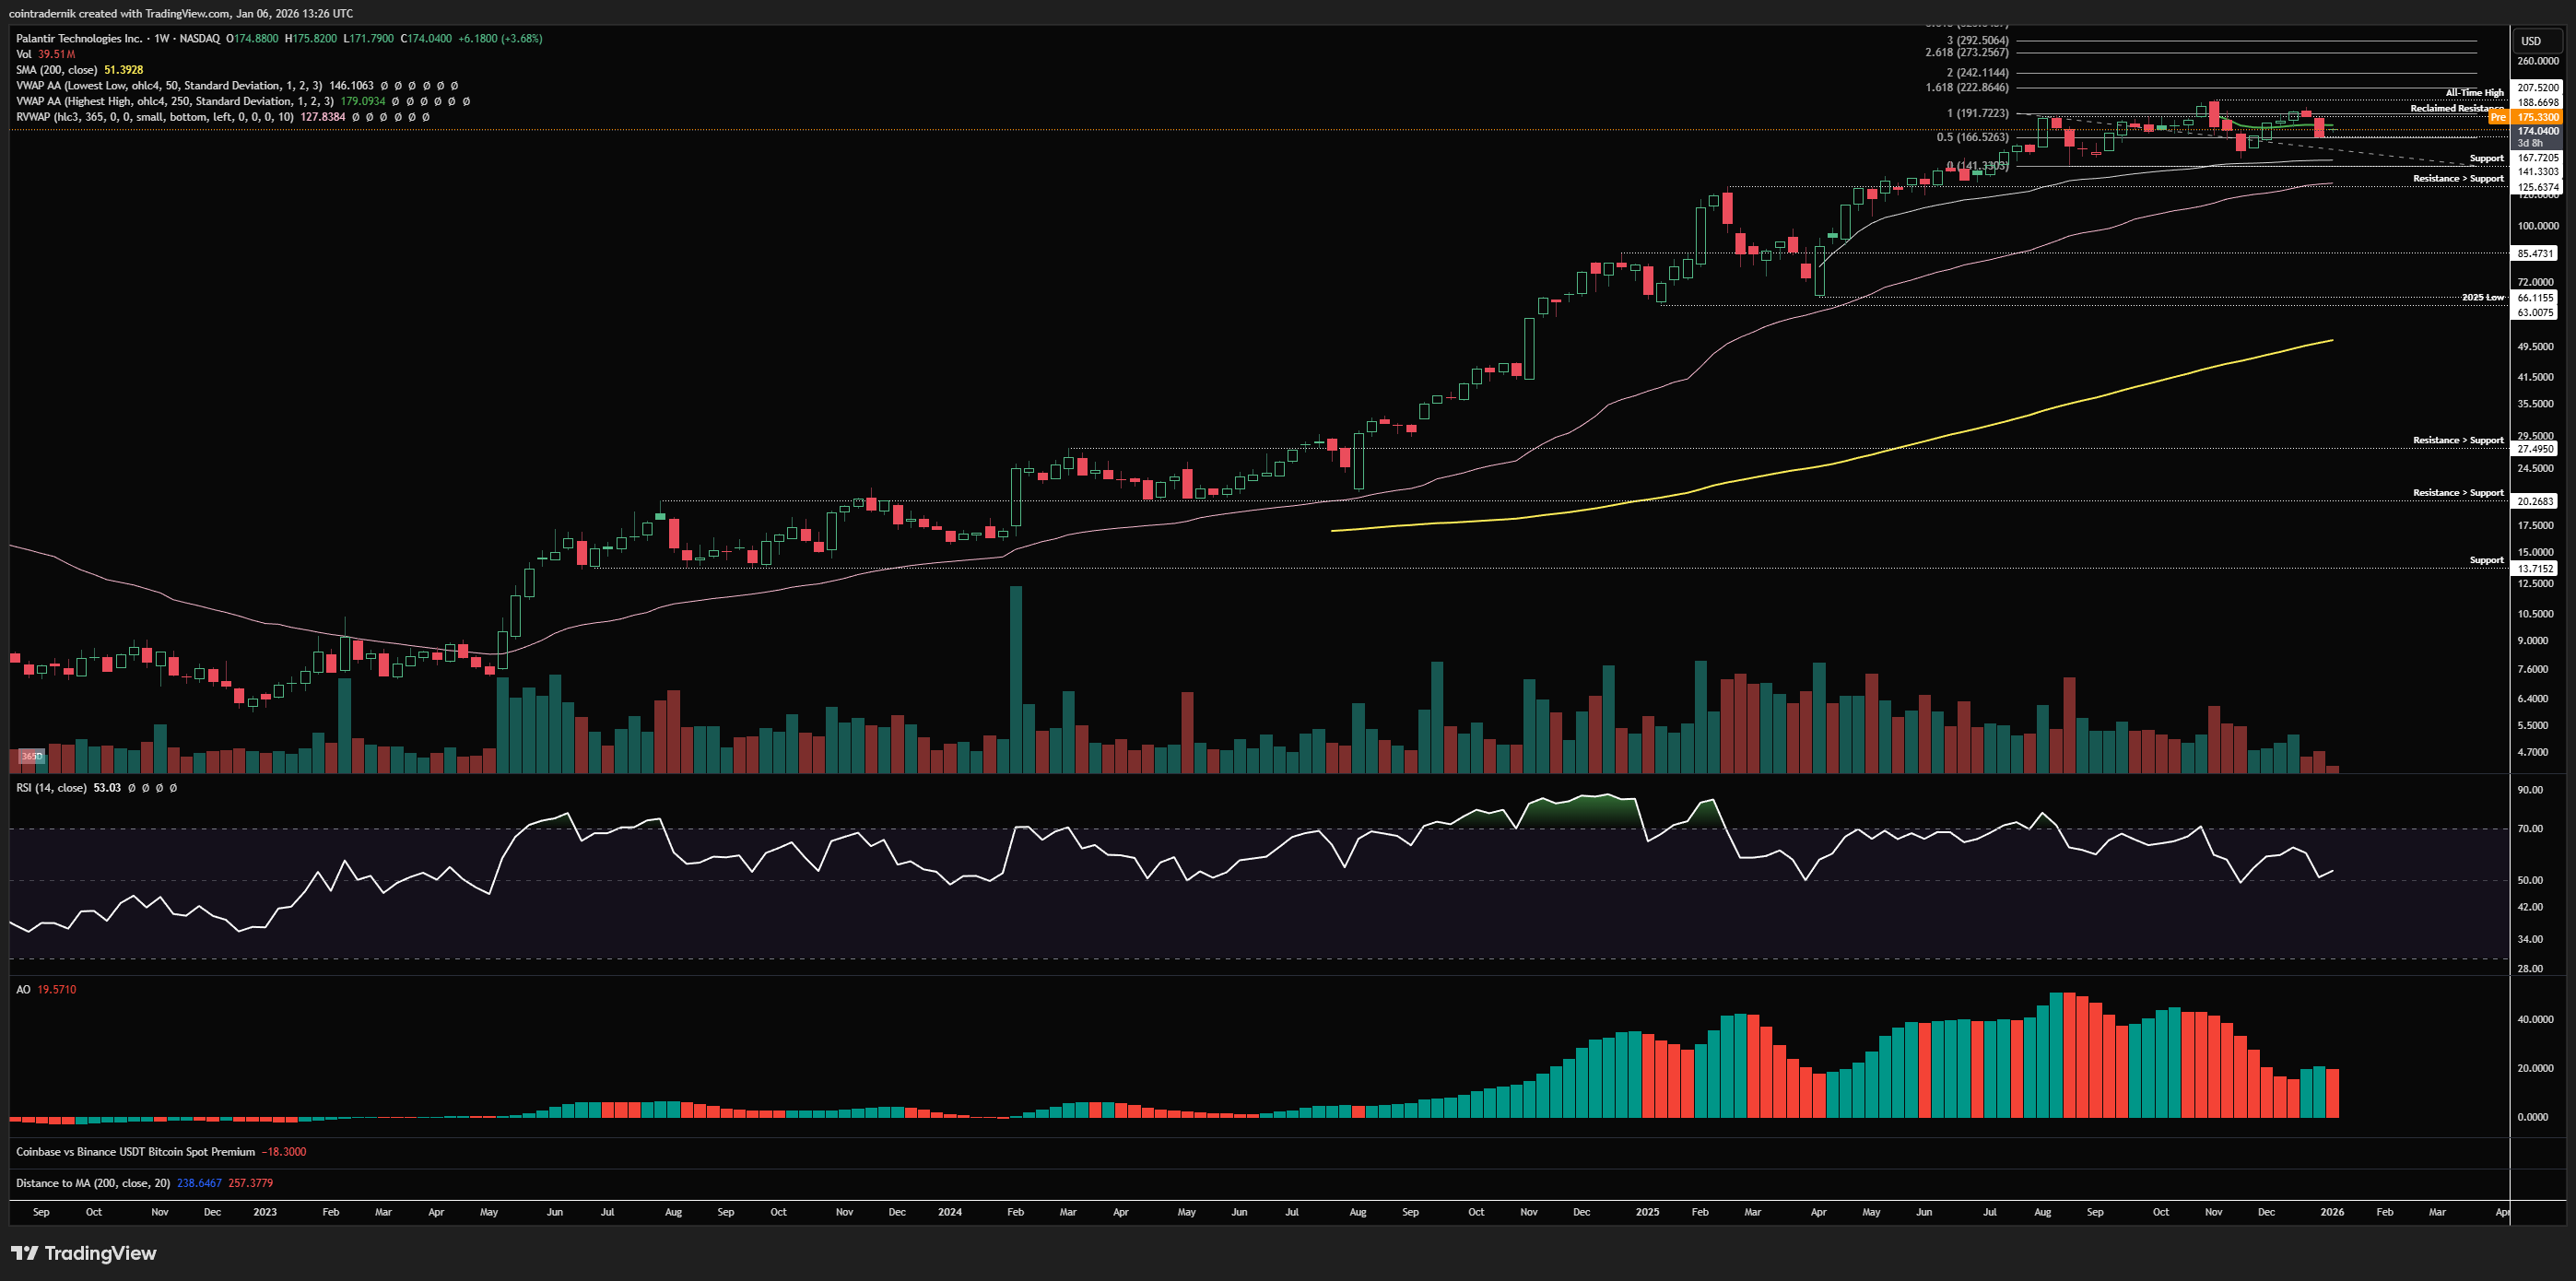
Beginning with the weekly for PLTR, we can see that price has largely been range-bound between $191 resistance and $141 support since July, breaking above the range to form a new all-time high at $207 in October, but rejecting and pushing back into range support, holding firm above that $141 level and the anchored VWAP from the Tariff crash lows. Weekly momentum is choppy here, with some divergence on the push into the fresh high but with momentum now basing above 50 on weekly RSI as price consolidates around the mid-range. We did form a lower-high at $191 a couple of weeks ago, and price is now trading back below the anchored VWAP from all-time highs. What we now should be looking for is a clean break back above that level, flipping $191 range resistance into support - if we see that, I would consider that the beginning of another leg higher for PLTR after a period of consolidation, with the 1.618 extension of the range at $222, followed by $242. If, instead, $191 caps price and we break lower here, back below the mid-range, I would expect $141 to be retested as support, where acceptance below that level looks atrocious for PLTR and makes this multi-month range look like distribution, particularly if weekly RSI breaks below 50 and AO turns negative as that occurs.
Daily:
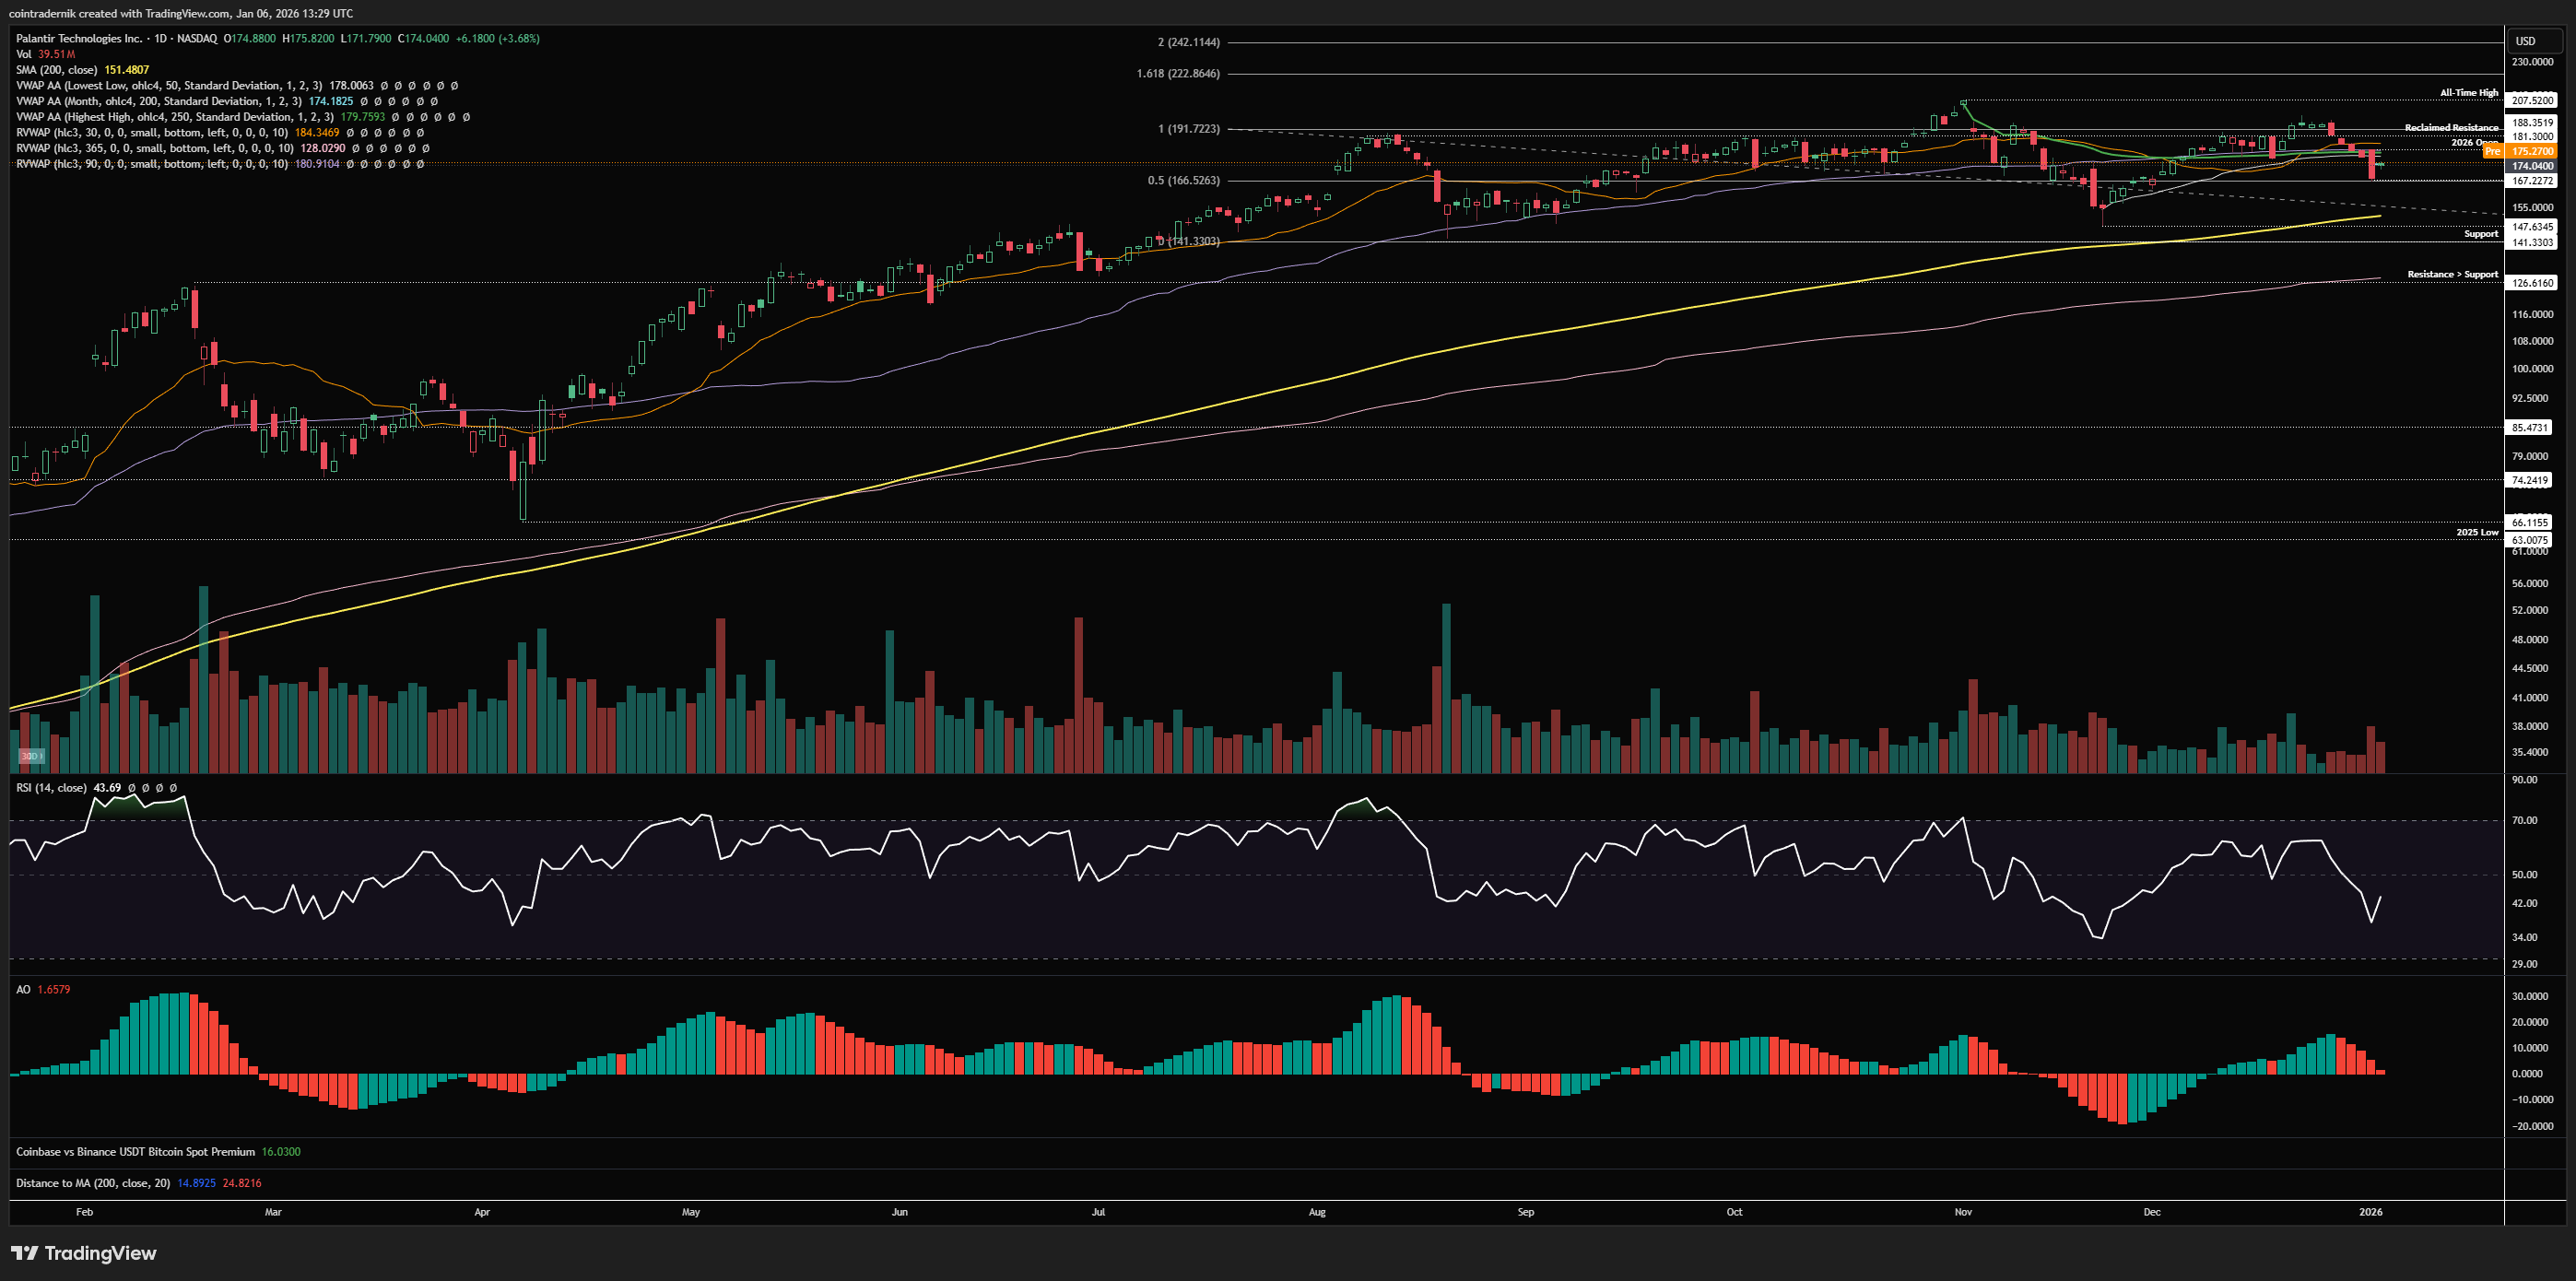
Turning to the daily, we can see that price is now also trading below the anchored VWAP from the November lows, the anchored VWAP from all-time highs and the 30d and 90d rolling VWAPs. This is not bullish short-term, and I would not be interested in longs in this area until that confluence of resistance is flipped back into support. If we push up into that cluster, you could look for shorts at $181-$184 with invalidation on a daily close above the December high, looking for the $147 swing-low to be retested, with a view to flipping bias towards fresh longs and price discovery in the event you are stopped, as structure would turn bullish and price would be accepting above a multi-month range.
I hope you've found some value in the read this week - please RT, share, engage etc. if so!
And if you've not already signed up for Ostium, please do so and test out some of the recent updates, including:
Sign up here (you don't have to use my ref link, of course): https://ostium.app/trade?from=CL&to=USD&ref=CTNIK

.avif)