

Market Outlook #66 - The Calm Before The Storm?
December 29, 2025
-
12
min read


This blog references an opinion and is for entertainment and informational purposes only. It is not intended to be investment advice. Seek a duly licensed professional for investment advice.
In this 66th Market Outlook here at Ostium Research, we'll be taking a look at the week ahead in markets, focusing specifically on price-action, positioning and event risk for Bitcoin, Ethereum, the Dollar Index, SPX and Gold.
At the end of the week - likely on Friday - I will be publishing a more detailed 2026 Outlook, which should be taken with a large grain of salt as I am very much of the view that much will evolve rapidly over the first quarter, but nonetheless should give you some sense of what I am expecting next year.
Following that, next week will see the usual weekly Market Outlook plus the Commodity Special I was unable to publish over the Christmas period, which should be of particular interest given the movements in metals over the past week...
Now, let's take a look at this week's calendar, which is among the quietest of the calendar year as we move into 2026:
TUESDAY: US CHICAGO PMI (DEC): (CONSENSUS 39.5 VS PREVIOUS 36.3)
TUESDAY: FOMC MINUTES
WEDNESDAY: US INITIAL JOBLESS CLAIMS: (CONSENSUS 220K VS PREVIOUS 214K)
SATURDAY: VARIOUS FED SPEECHES
Now, let's dig into asset-specific price-action for the week ahead, looking firstly at Bitcoin:
Price: $89,457
Weekly:
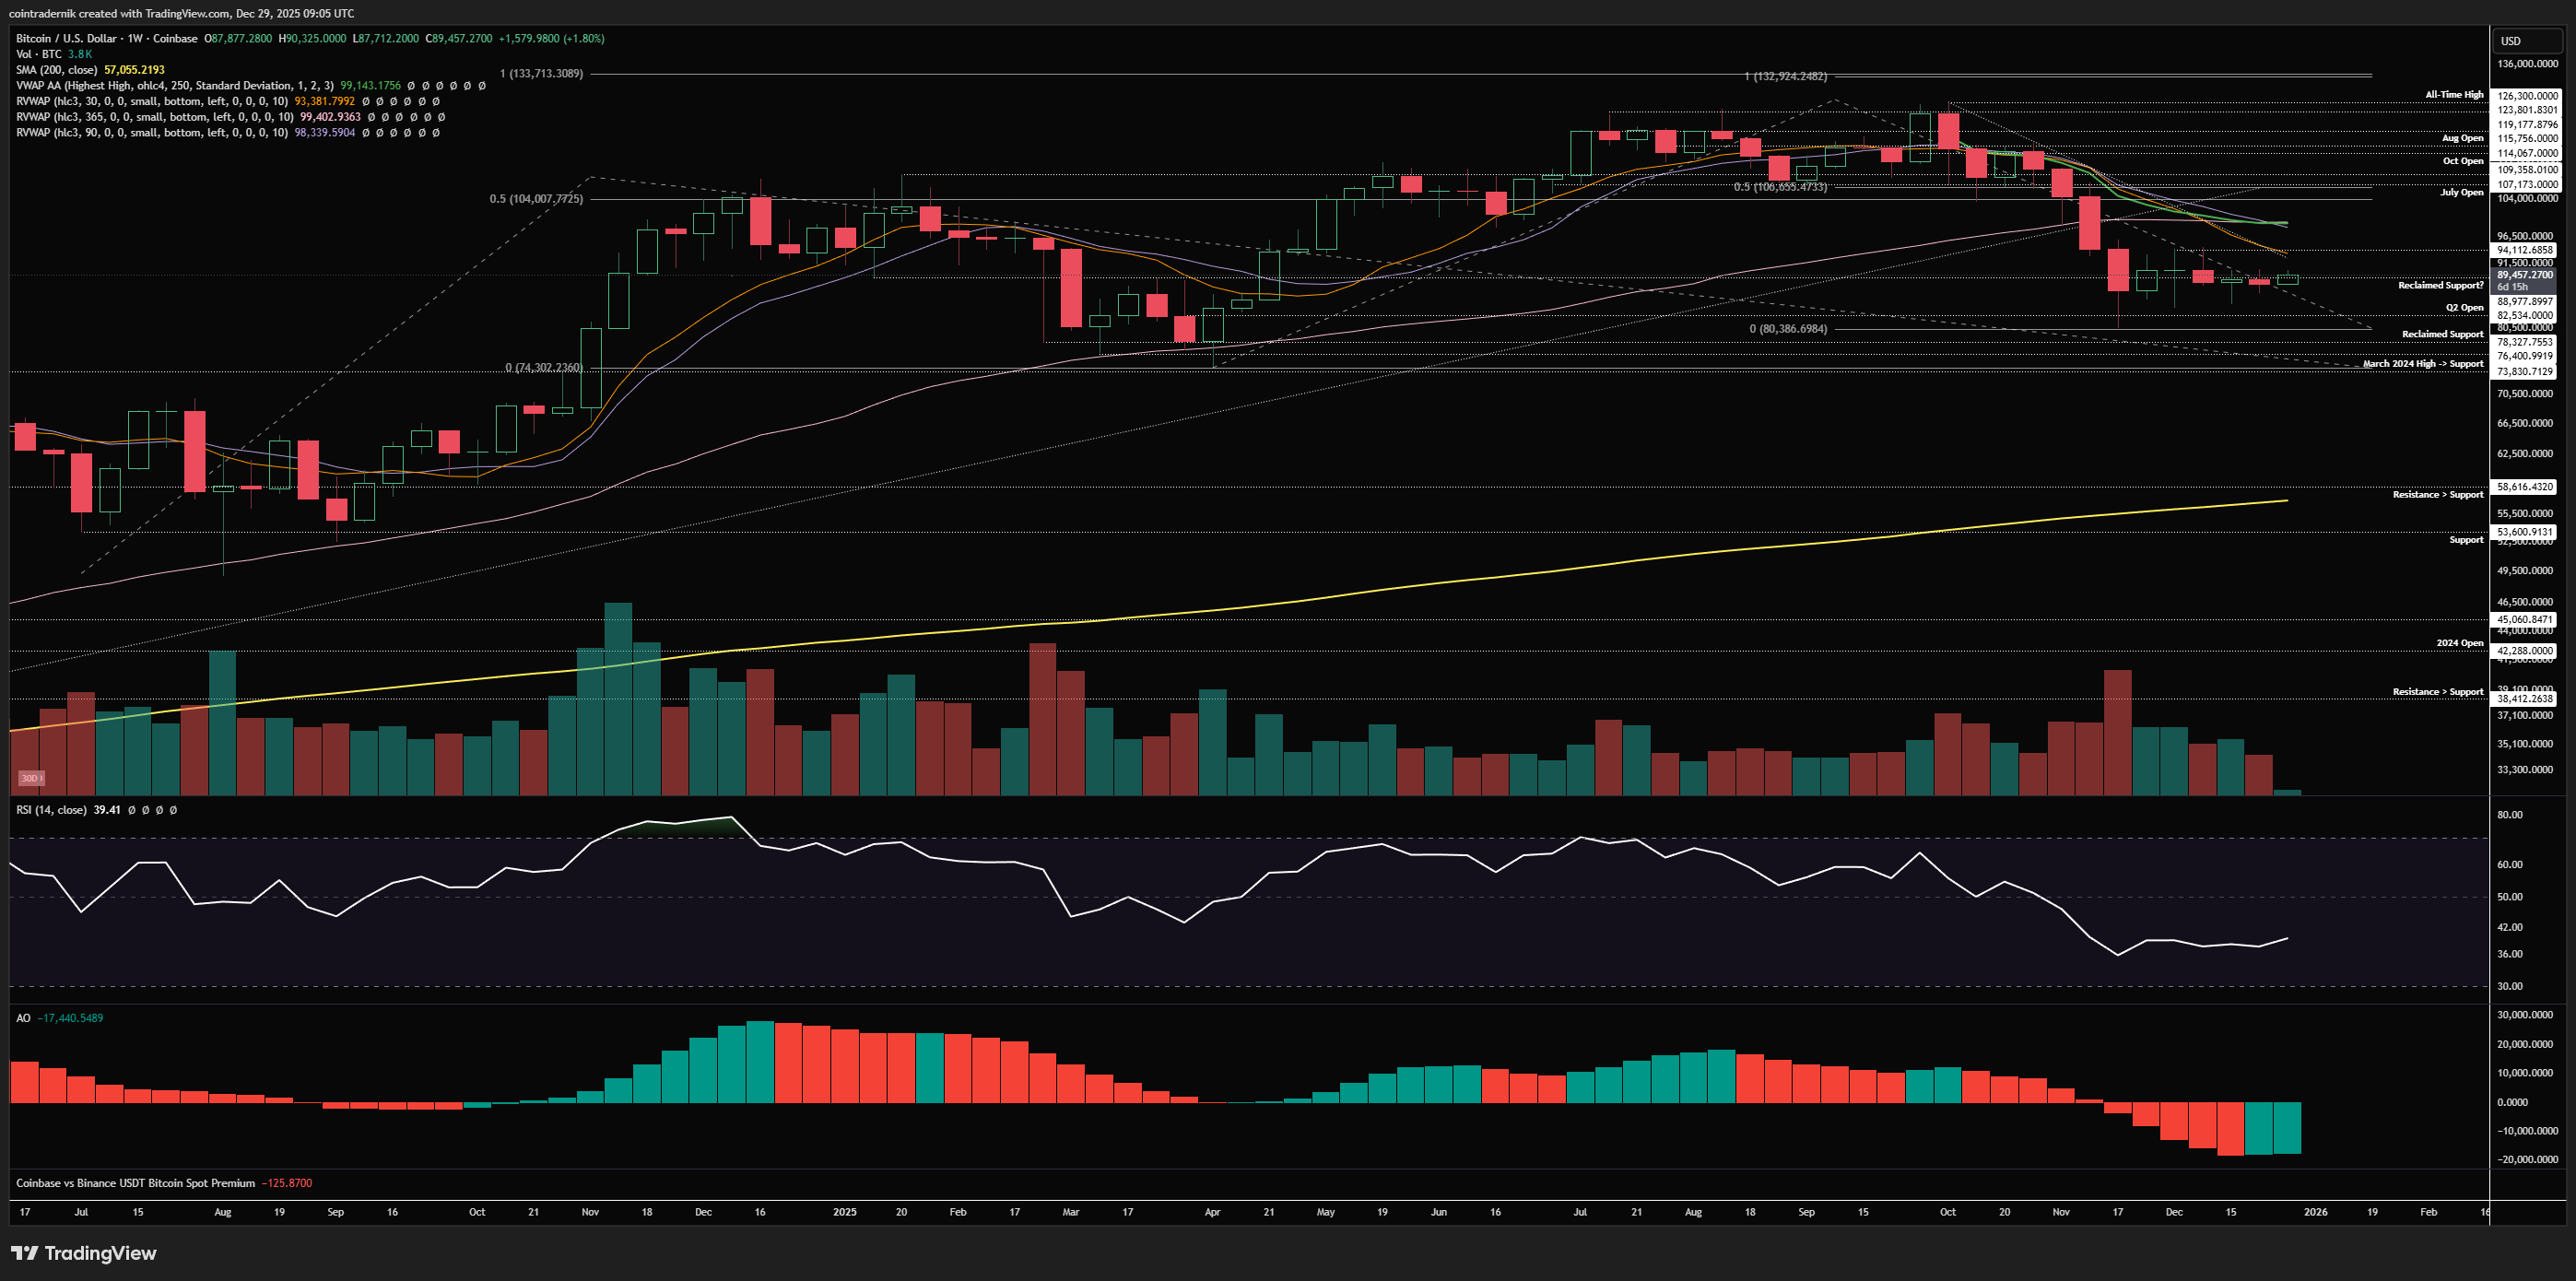
If we begin by looking at the weekly for BTC, we can see that price continues to chop around in a tight range following the November lows, with last week seeing price trade right around $89k for most of the week, marginally below which it closed on low volume. I don't know if this week is likely to see much of a change from this pattern given the low liquidity environment around the New Year, so we should expect to see price hold around $89k into next week, where the price-action is likely to become more dynamic. My view here remains that we are more likely in a bottoming range from which we return to new highs in Q1 2026 than a redistribution range from which we move below $73k. I am well aware this is non-consensus (and growingly so as we continue to chop around), and should price close the weekly below $73k in Q1 then it dramatically alters the picture for me for the forthcoming year. Where many view the most recent move off the highs into $80k as a 'structural shift unlike prior corrections', I disagree and continue to view this as a 'higher for longer' regime within which we have these 30-40% corrections, range-bound price-action chewing through supply and subsequently continue higher. Since 2022, we have not made fresh lows on a weekly timeframe below the bottoms that preceded the next highs (or, more plainly, weekly structure in the most technical sense has remained bullish with higher-highs and higher-lows). This has not changed and I place less weight on MAs, vWAPs etc. than I do on price itself, and whilst the $73k April lows that preceded the $126k all-time highs are protected, weekly structure is still bullish. I have outlined my view on why this correction has felt different (and was bound to) several times, but to reiterate it is because we had the largest liquidation event in crypto history right around the peak 4-year cycle narrative, followed by a huge November bear trap in equities and a combination of forced selling post 10/10 + LTH supply - and all of this led to a correction only a few percent larger (so far) than previous corrections within this multi-year uptrend. There has been every reason for weekly structure to have broken with a close below $73k and yet it has not happened. Perhaps it will still happen and this is redistribution and the 4-year cycle remains intact and everyone can buy the cycle low at $50k in October 2026, but this is not my view. Whilst I do think there is a decent chance we sweep the November low in early Q1, I categorically do not think we close below the April lows in H1 2026. It is also my current view that Bitcoin trades new highs in H1 2026, likely in late Q1 but perhaps in early Q2. Higher for longer.
Daily:
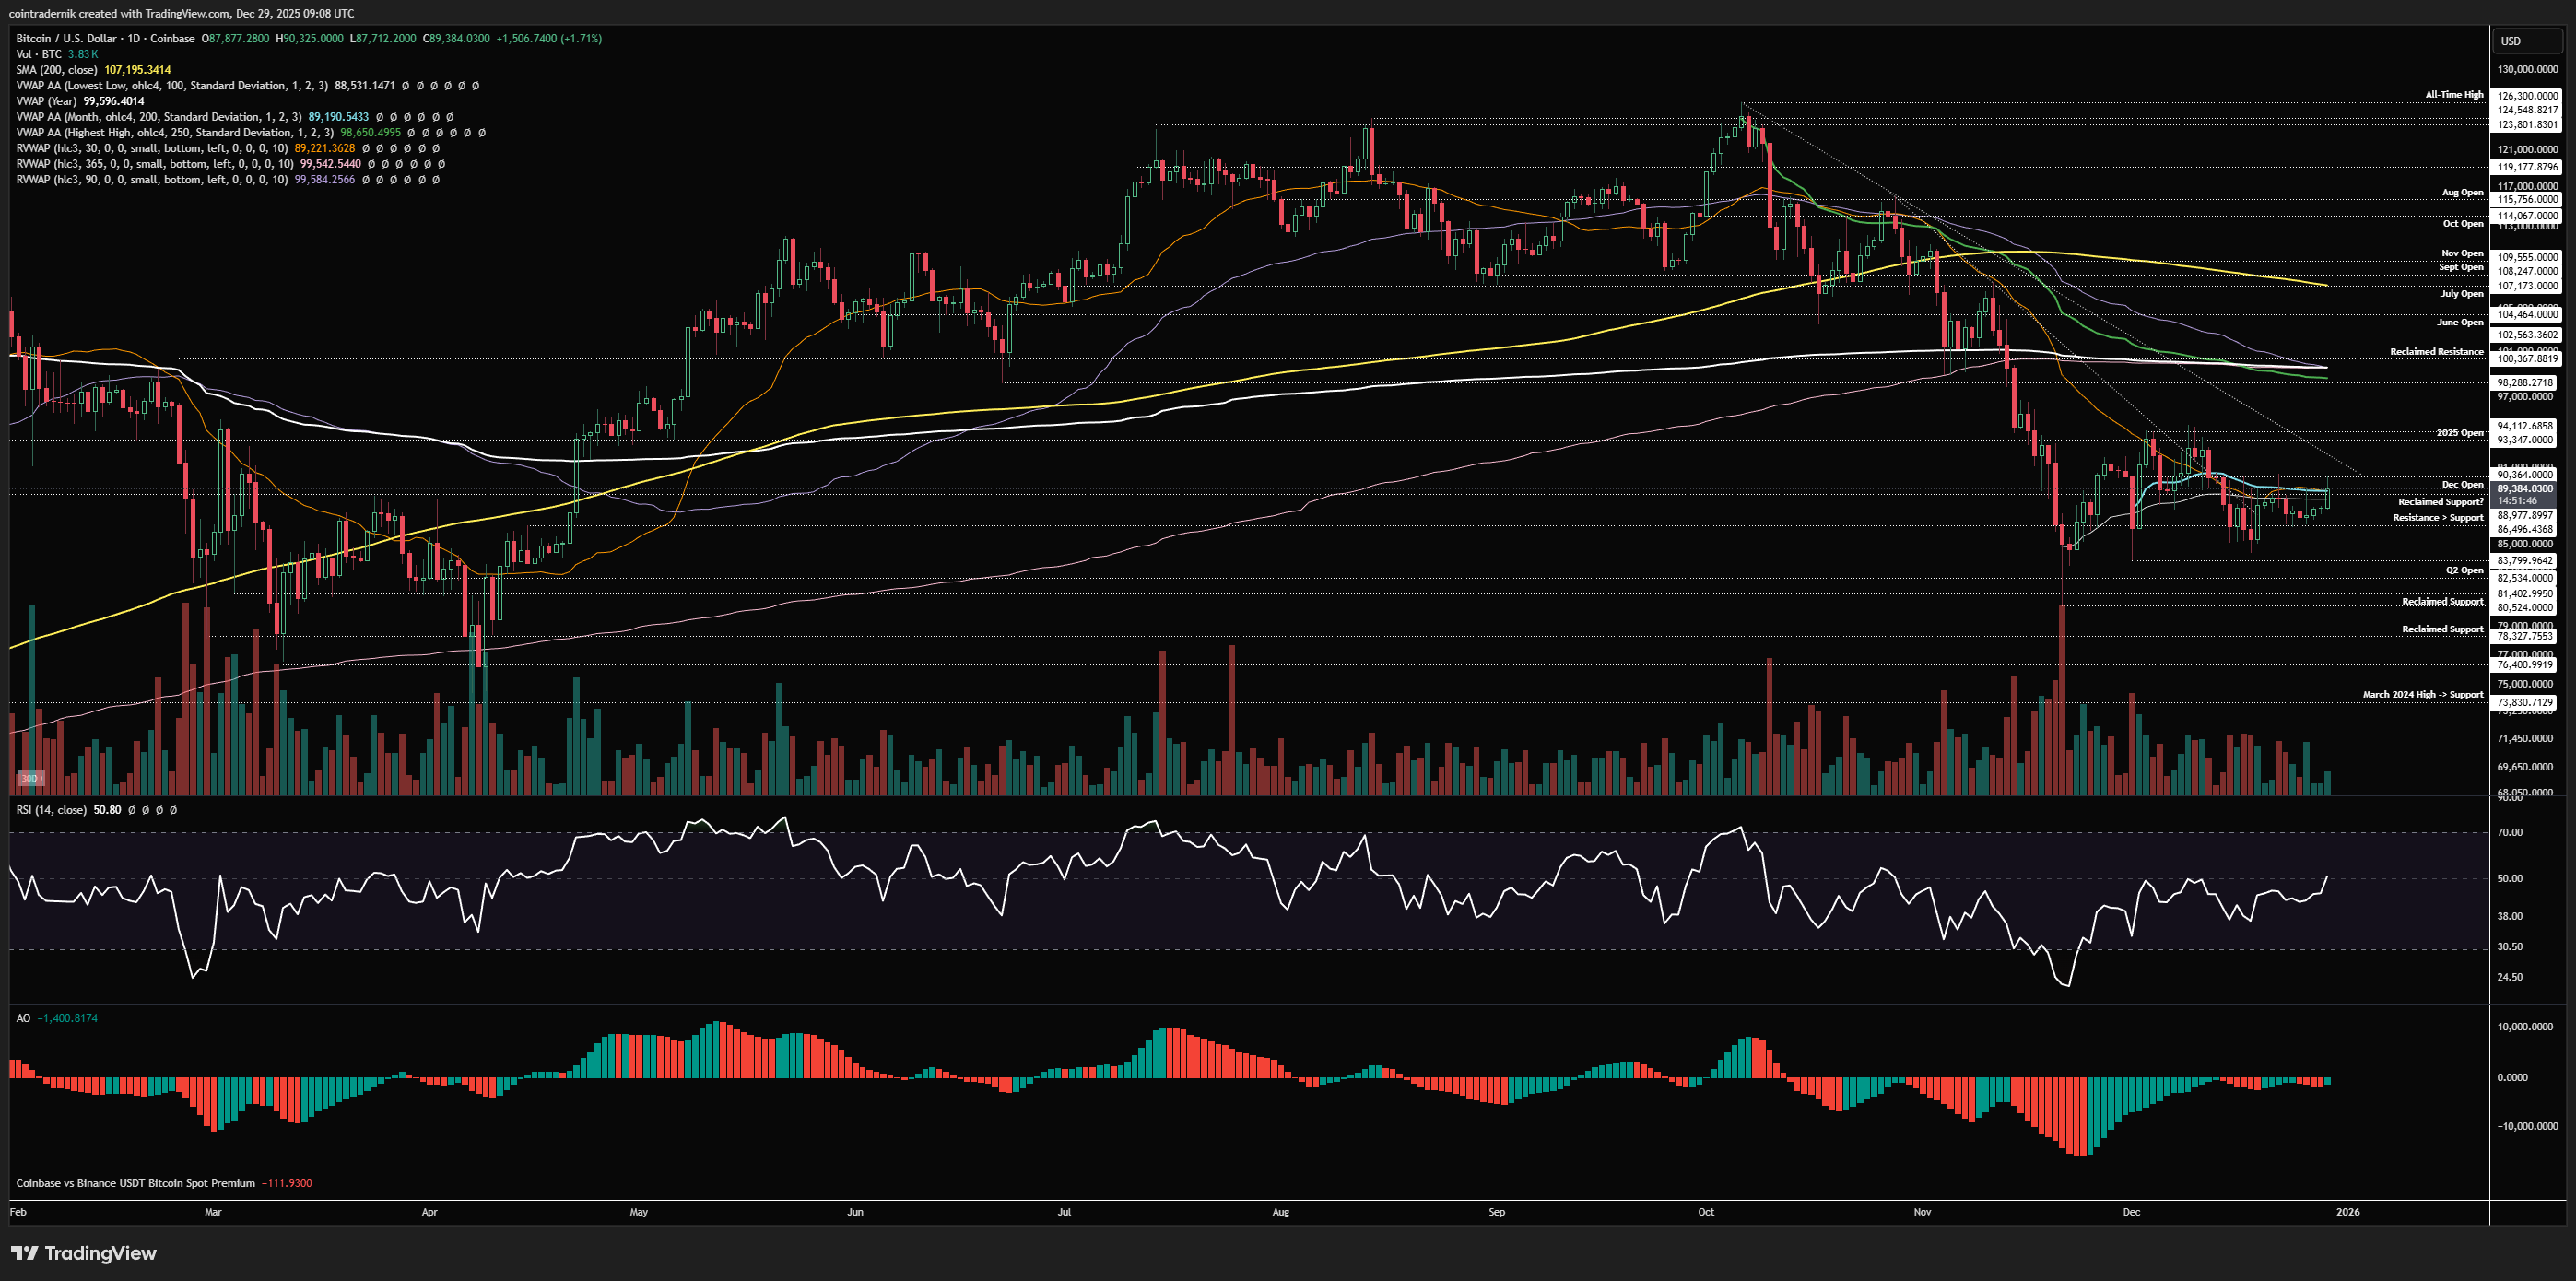
Turning to the daily, we can see how choppy and brutal the price-action has been within this range, with a dozen intraweek and intraday Barts and no real sense of direction or momentum at all. Meanwhile, price is finding it difficult to break convincingly above the 30d rolling VWAP / December VWAP and the anchored VWAP from the November lows, all around $89.3k. Whilst I am not expecting much by way of direction this week (and likely more fakeouts and Barts), going into next week what bulls want to see is price break and close above the Dec open at $90.3k and then find support above $89.3k and push higher from there back into the 2025 open at $93.3k, where I do not expect resistance to hold on another test and Bitcoin likely moves towards $100k from there. If we are to see a move below the November low at $80k in January, you would expect price to hold below this current resistance area, likely wicking above it and rejecting and then closing the daily below $86.5k support, below which we at least sweep $83.8k support. If that level gives way in early January, I think we get the sweep of $80.5k into $78k but, as outlined above, I think there will be significant demand in that area and we still hold firm above the April lows before eventually moving higher.
Now, I will not be taking any intraweek setups given the low liquidity environment and the fact you should be enjoying your New Year, but if you are so inclined then here's what I am seeing on the long side and the short side:
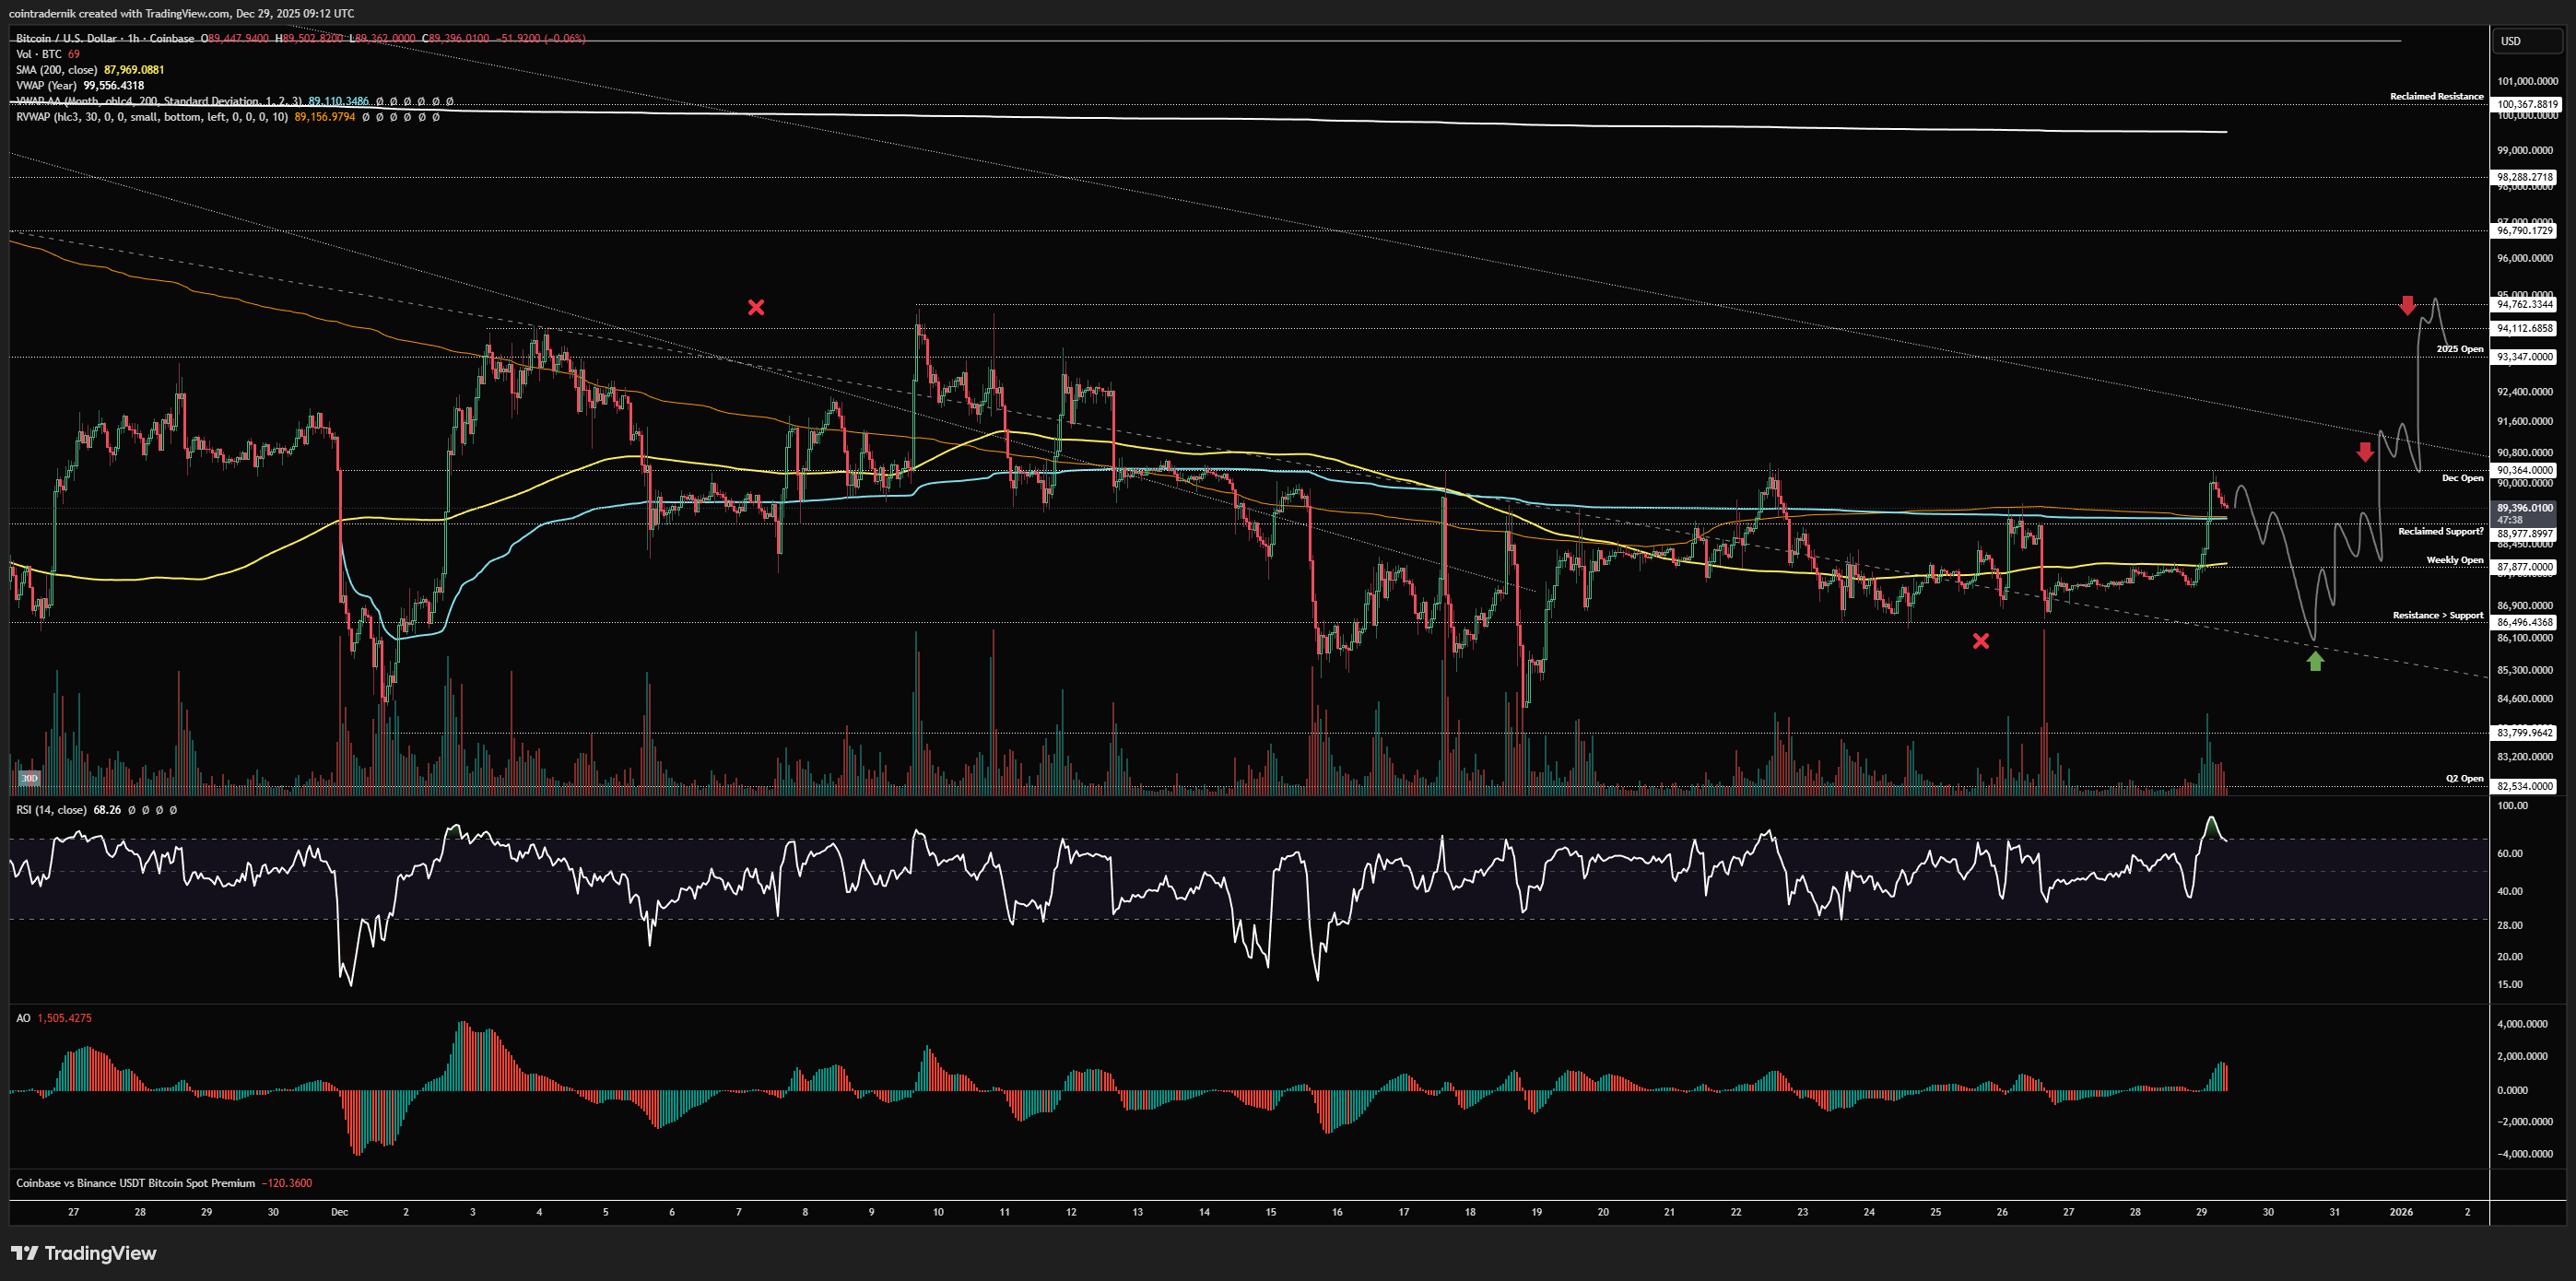
For longs this week, you want to see the current weekly high hold and price break lower early this week, ripping back below the open and running all those clustered lows into $86.5k. If we do that into the yearly close, I think that's a bid for a reversal back into $90.3k at least, with TP2 at the yearly open. Given the tight ranges we have been seeing, I don't think we tag TP2 this week if this setup plays out, but rather next week, above which obviously the run towards $100k would likely begin. A daily close below $86.5k would be a sign to bail on this idea, as outlined above:
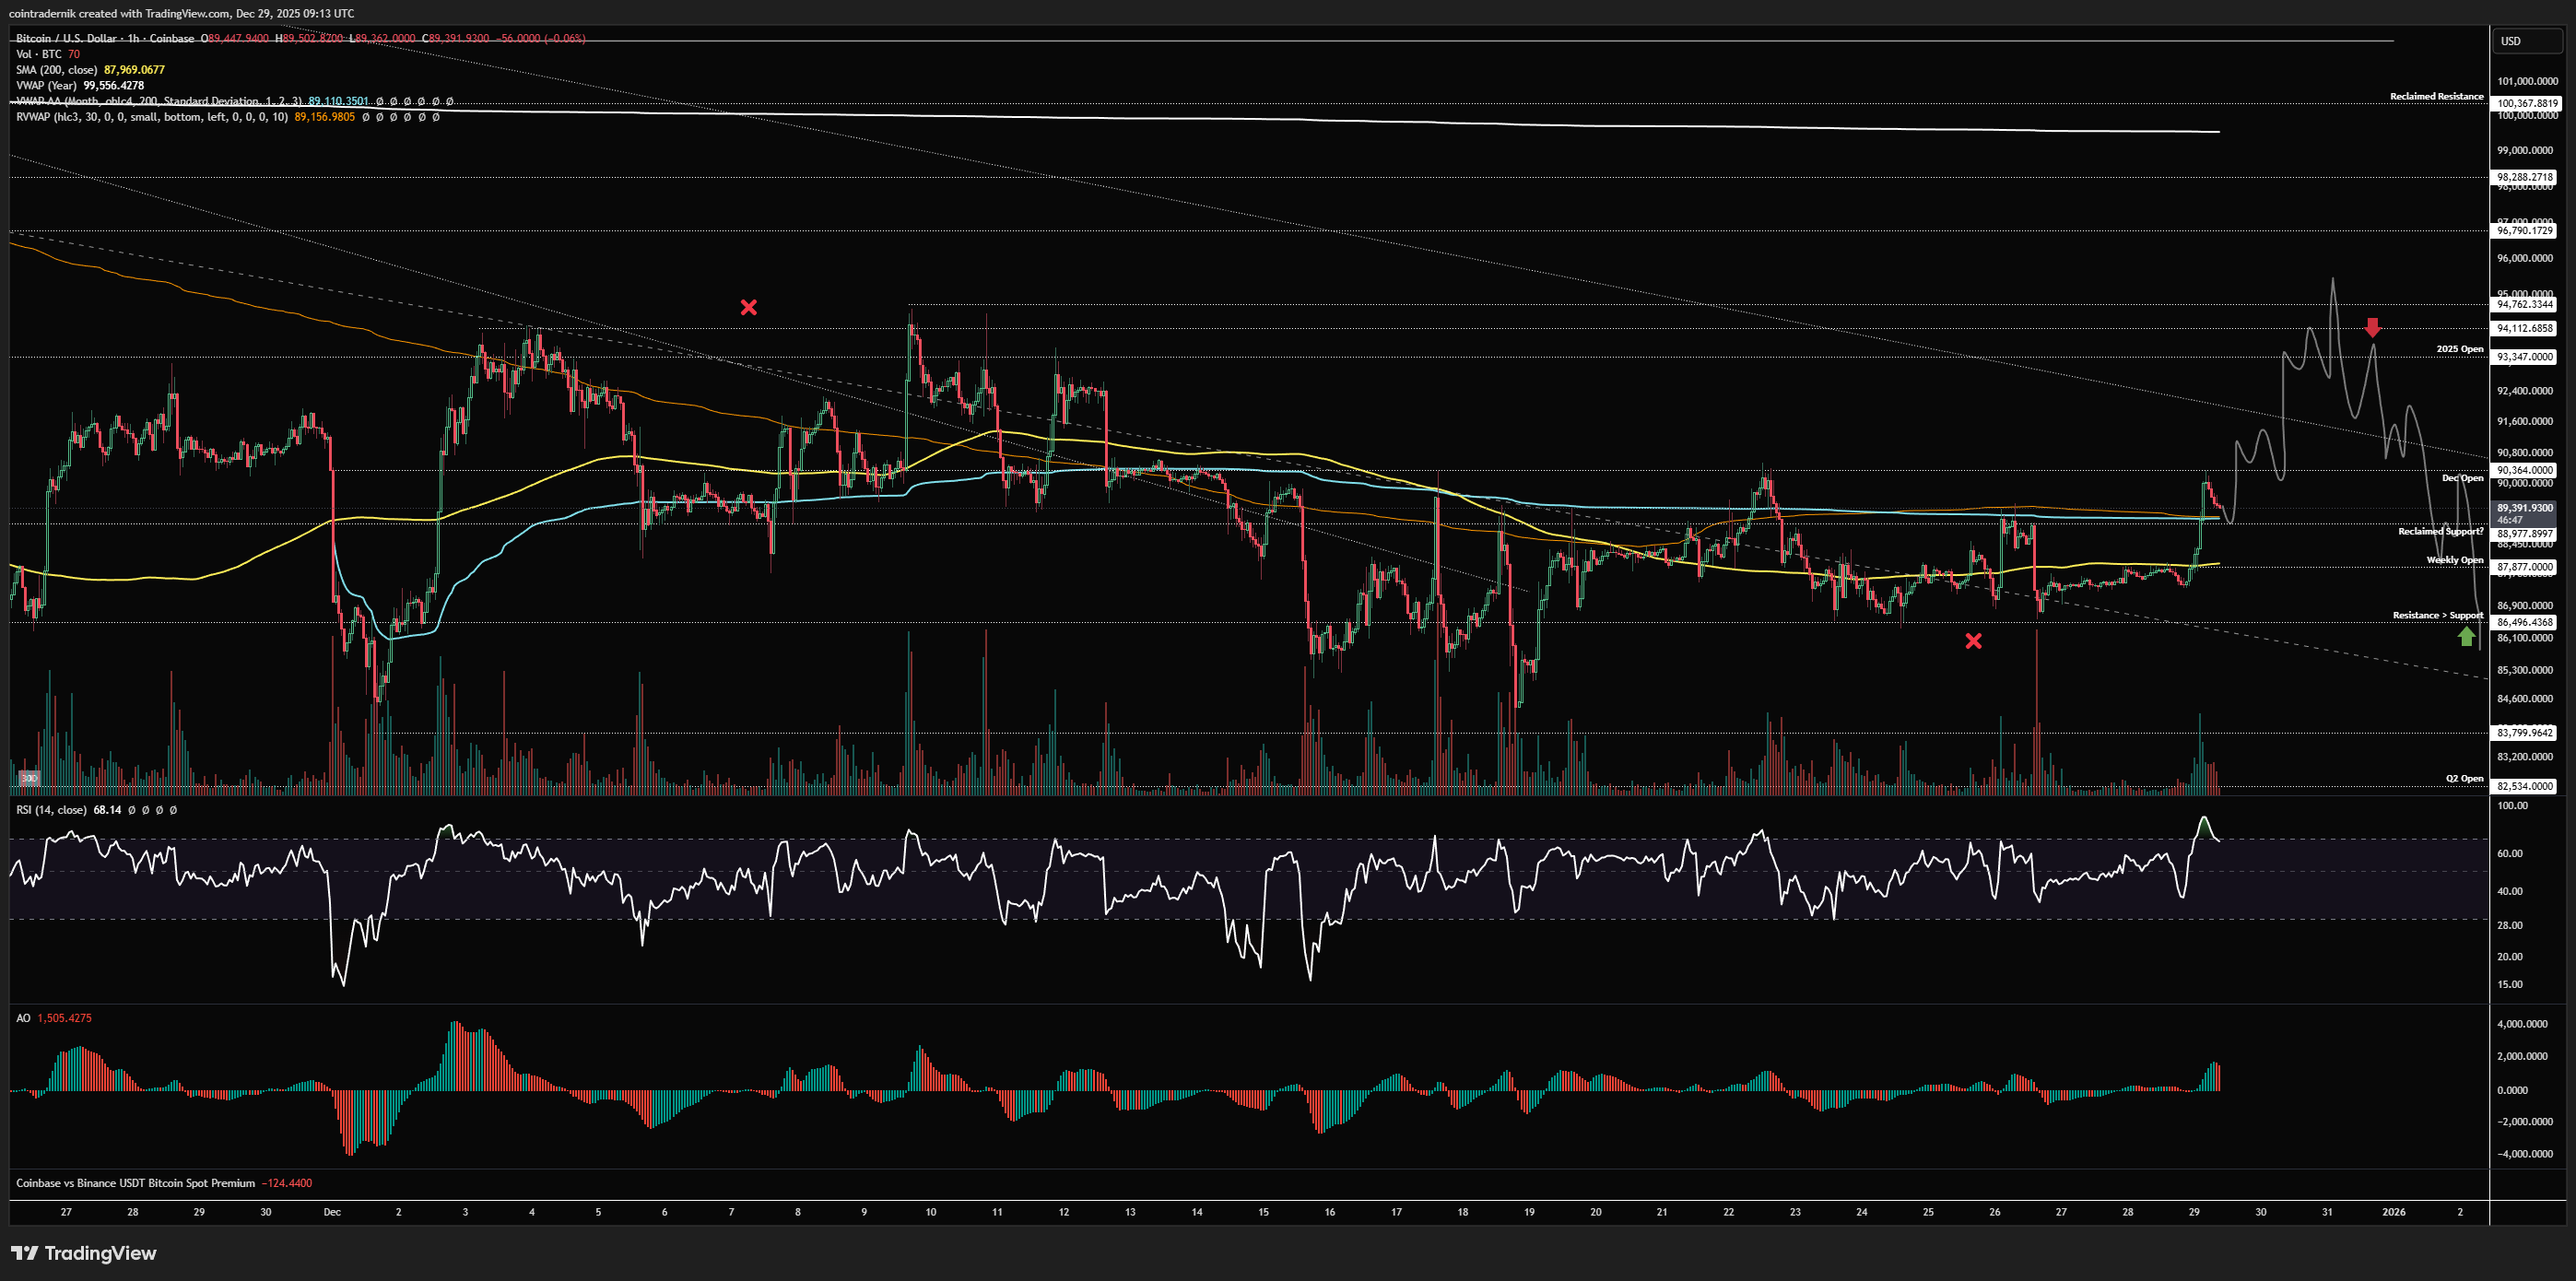
On the short side, you'd want to see a rip higher off this support, as though we were beginning some sort of larger reversal into the New Year, but then look for a sharp run of the highs at $94.7k in early Jan and then short a subsequent break and close below $93.3k again, looking for $86.5k to be tagged. Firstly, I again do not expect this all to play out in a few days given the low volume and low liquidity environment, but I also do not expect the fourth attempt at a 2025 open breakout to fail, so if it does fail then I would be much more convinced of a sweep of $80k in January:
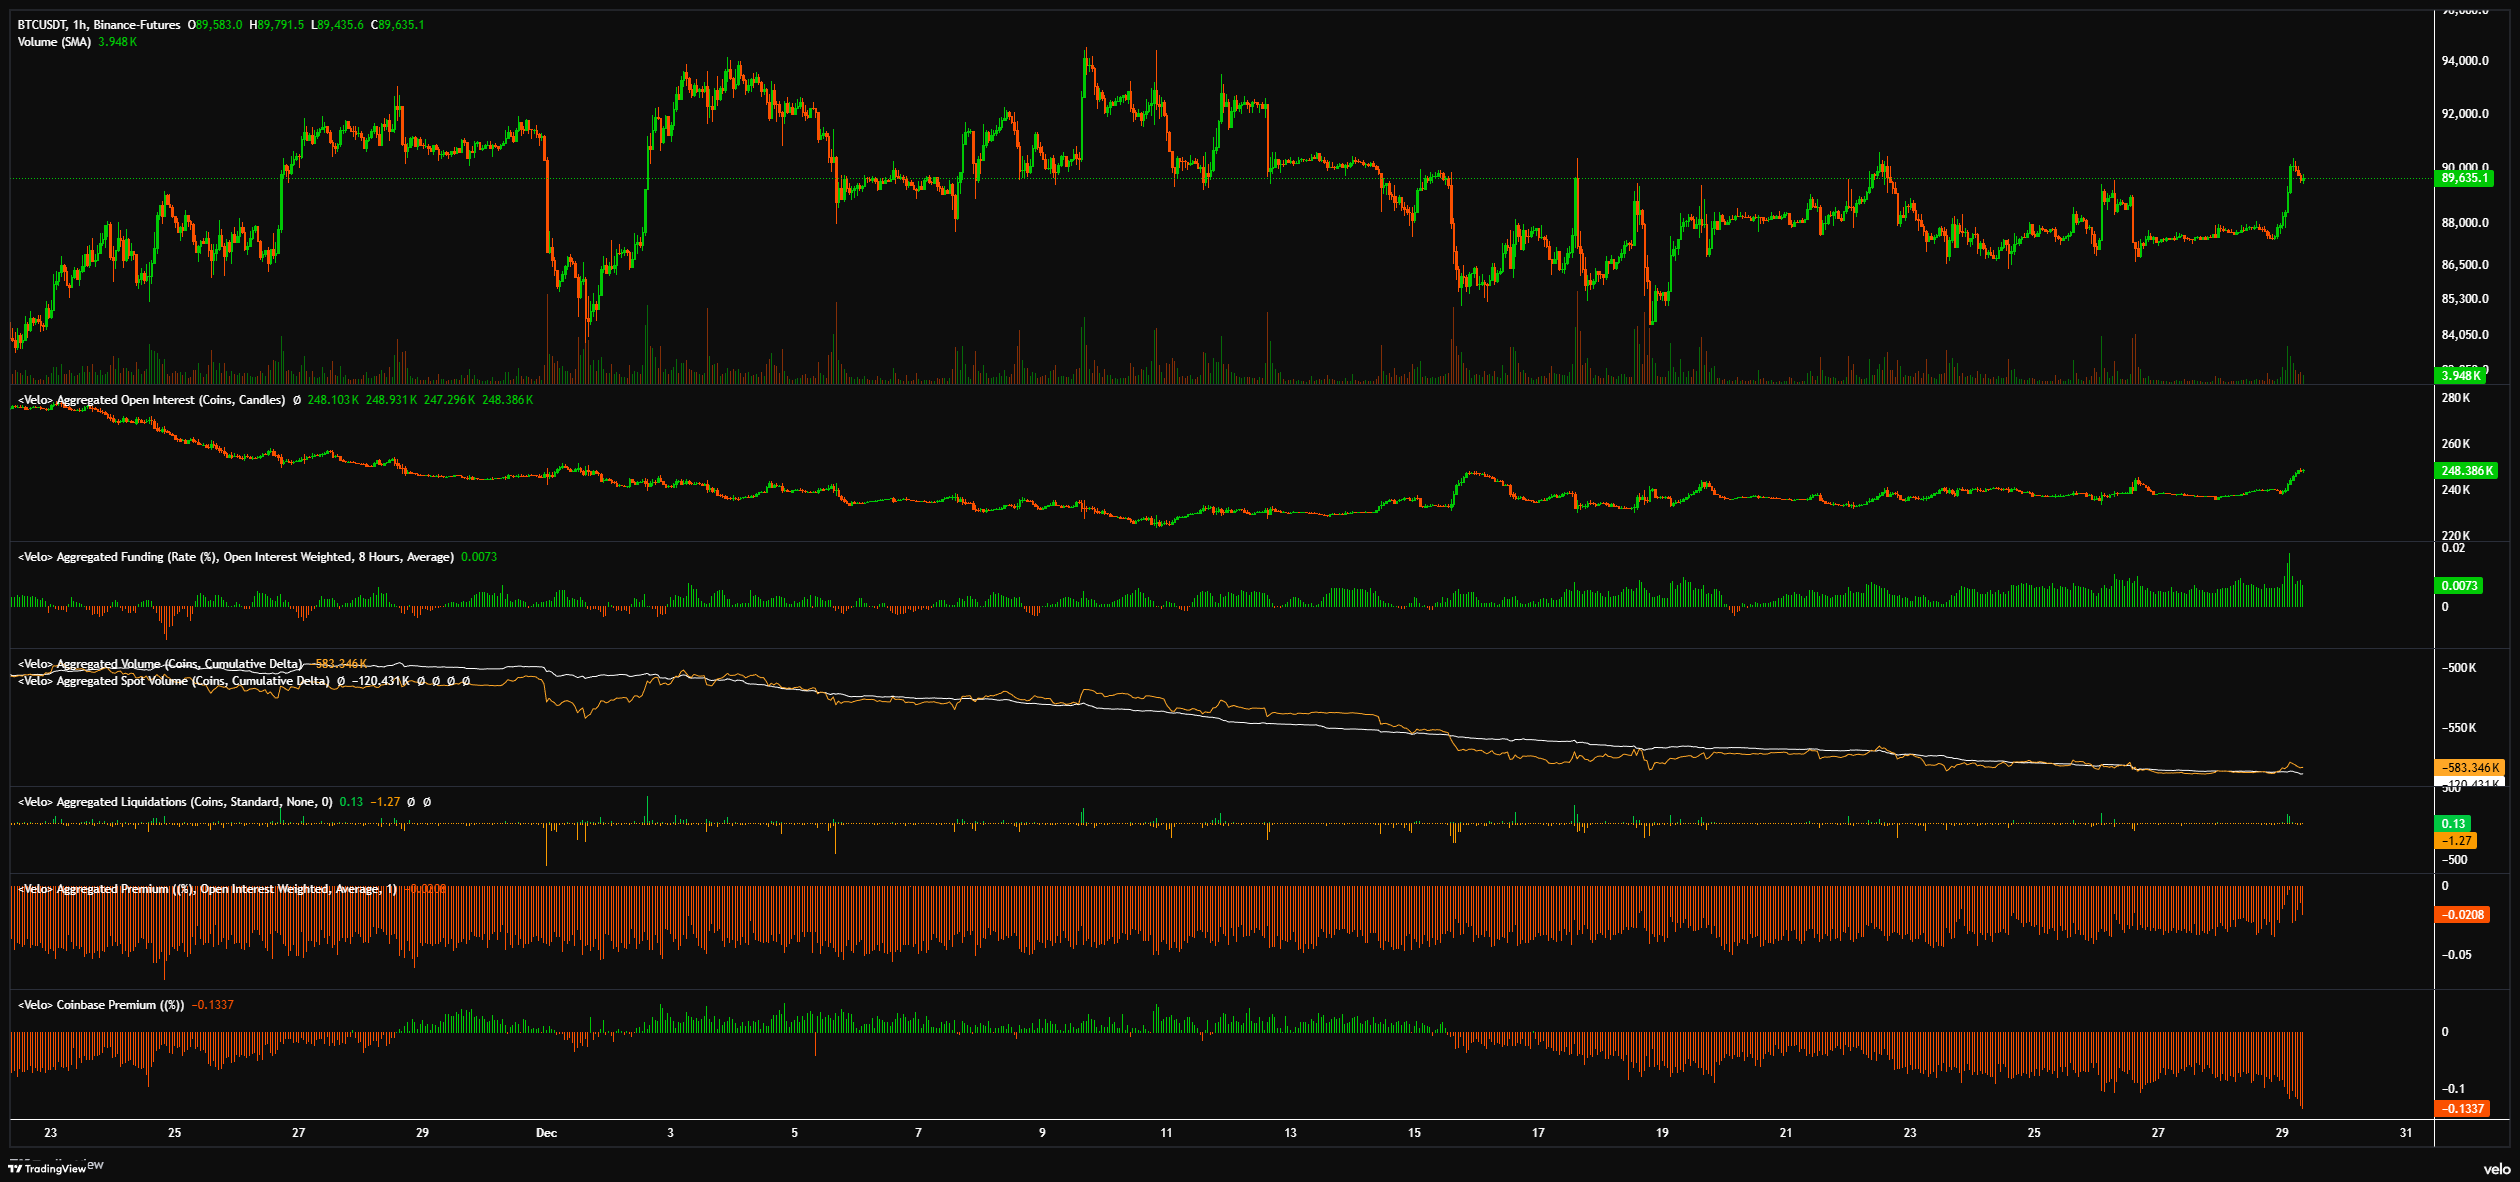
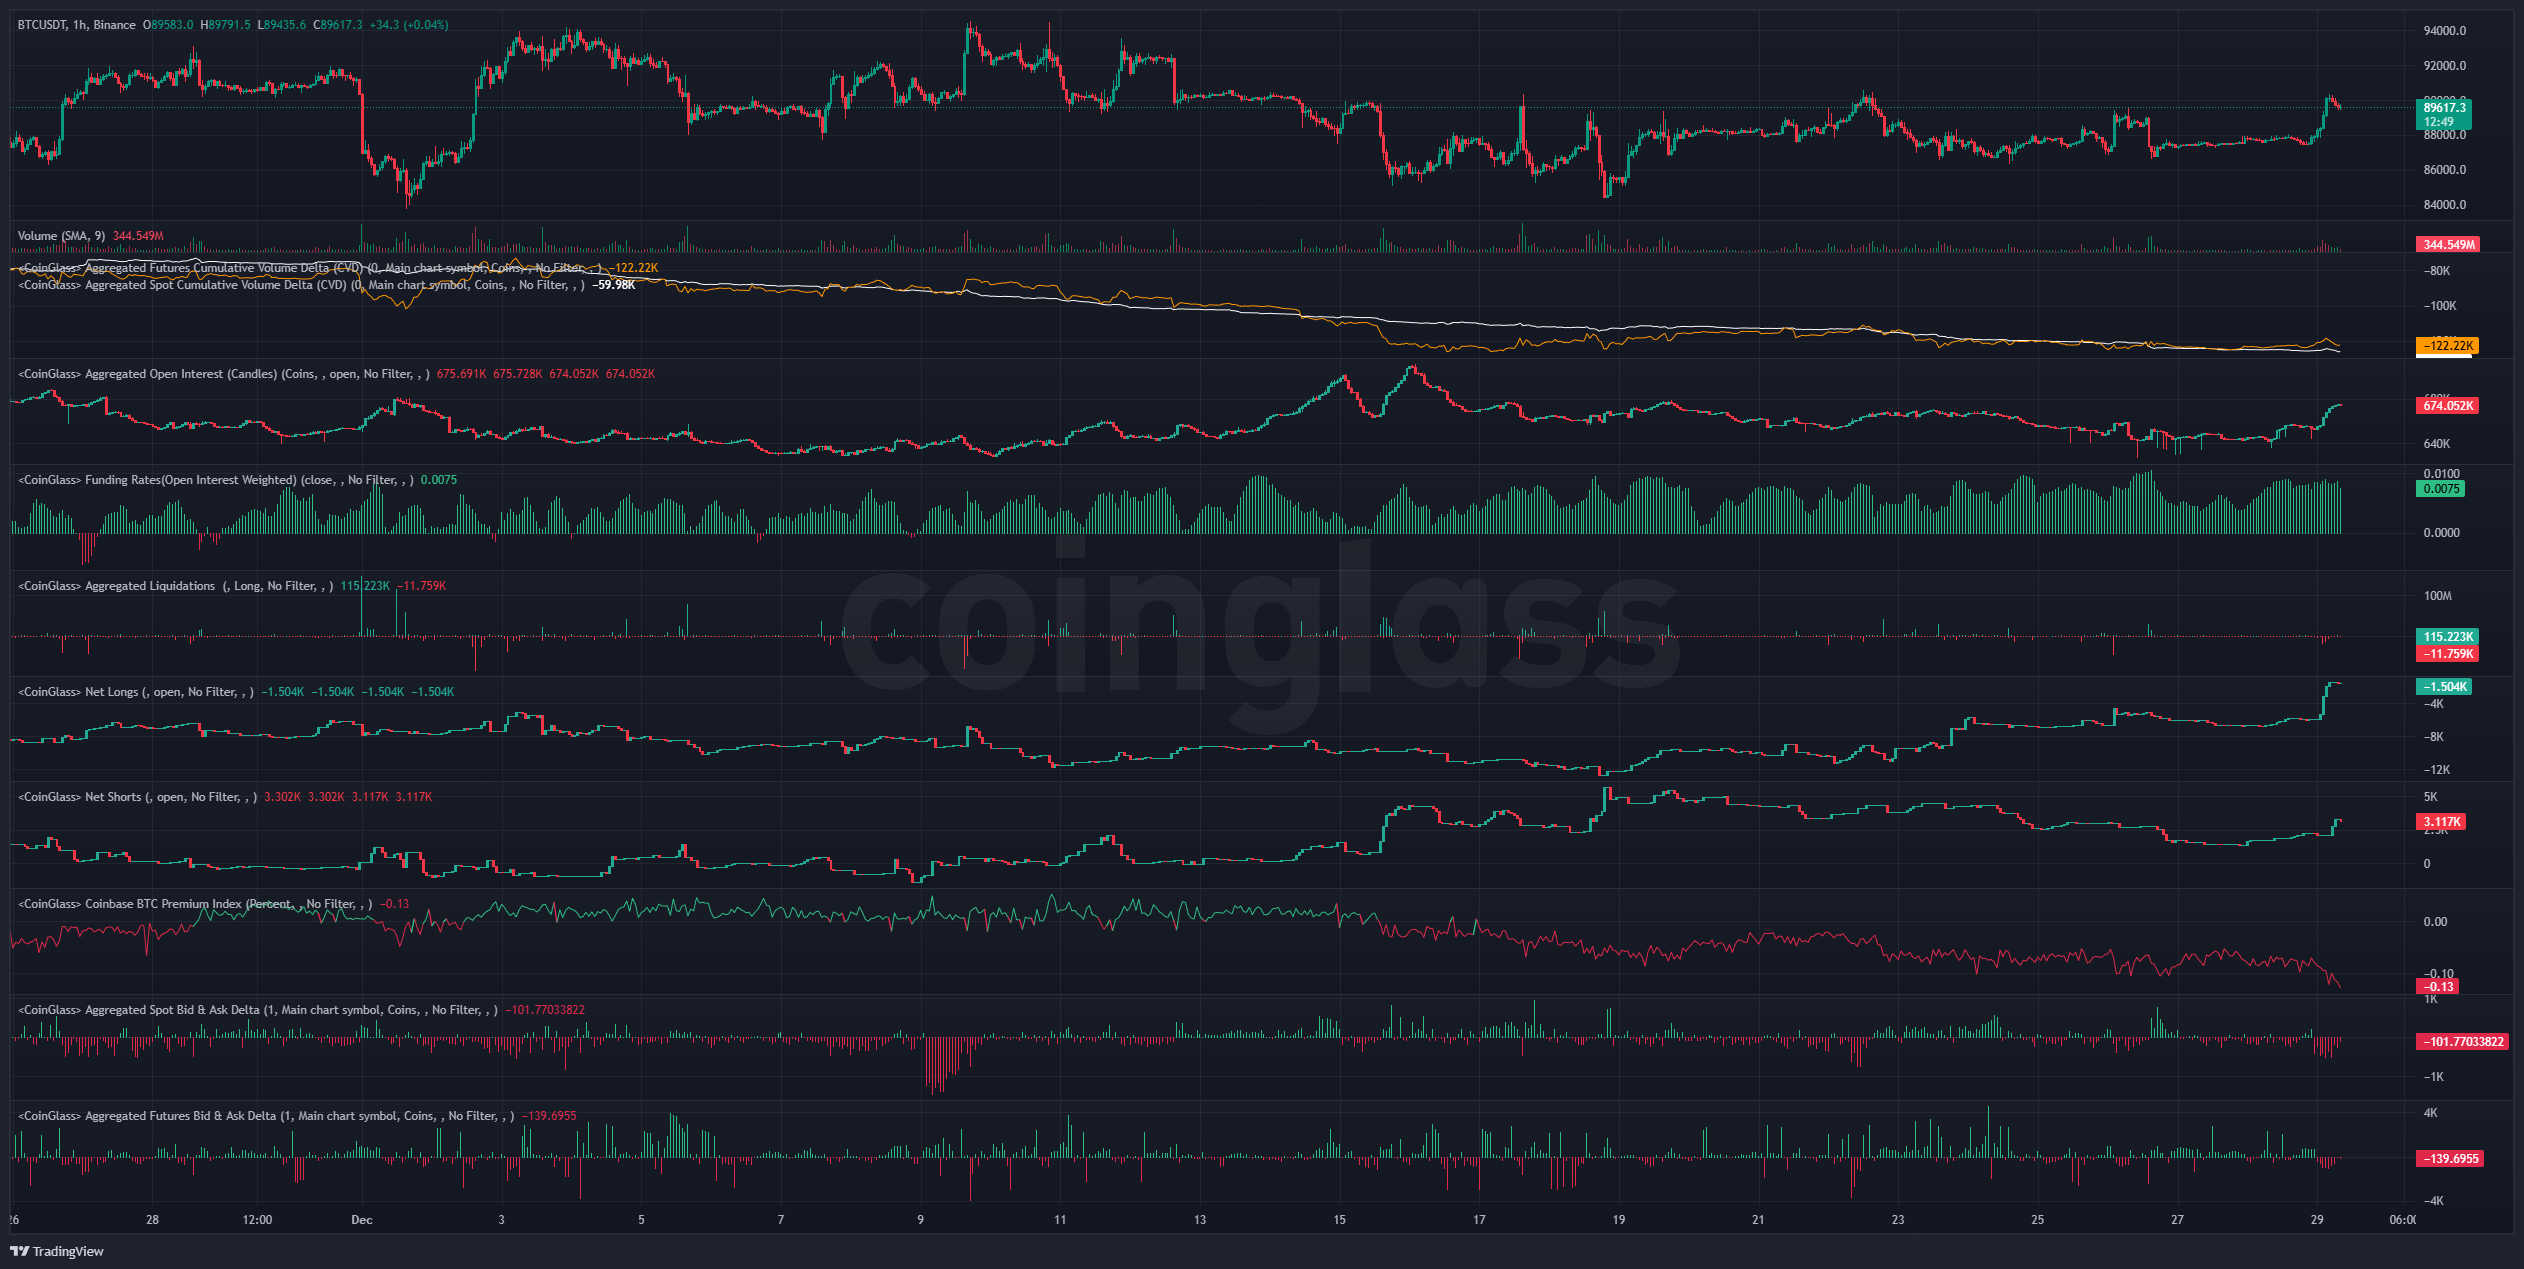
And here's a snapshot of positioning across Velo and CoinGlass:
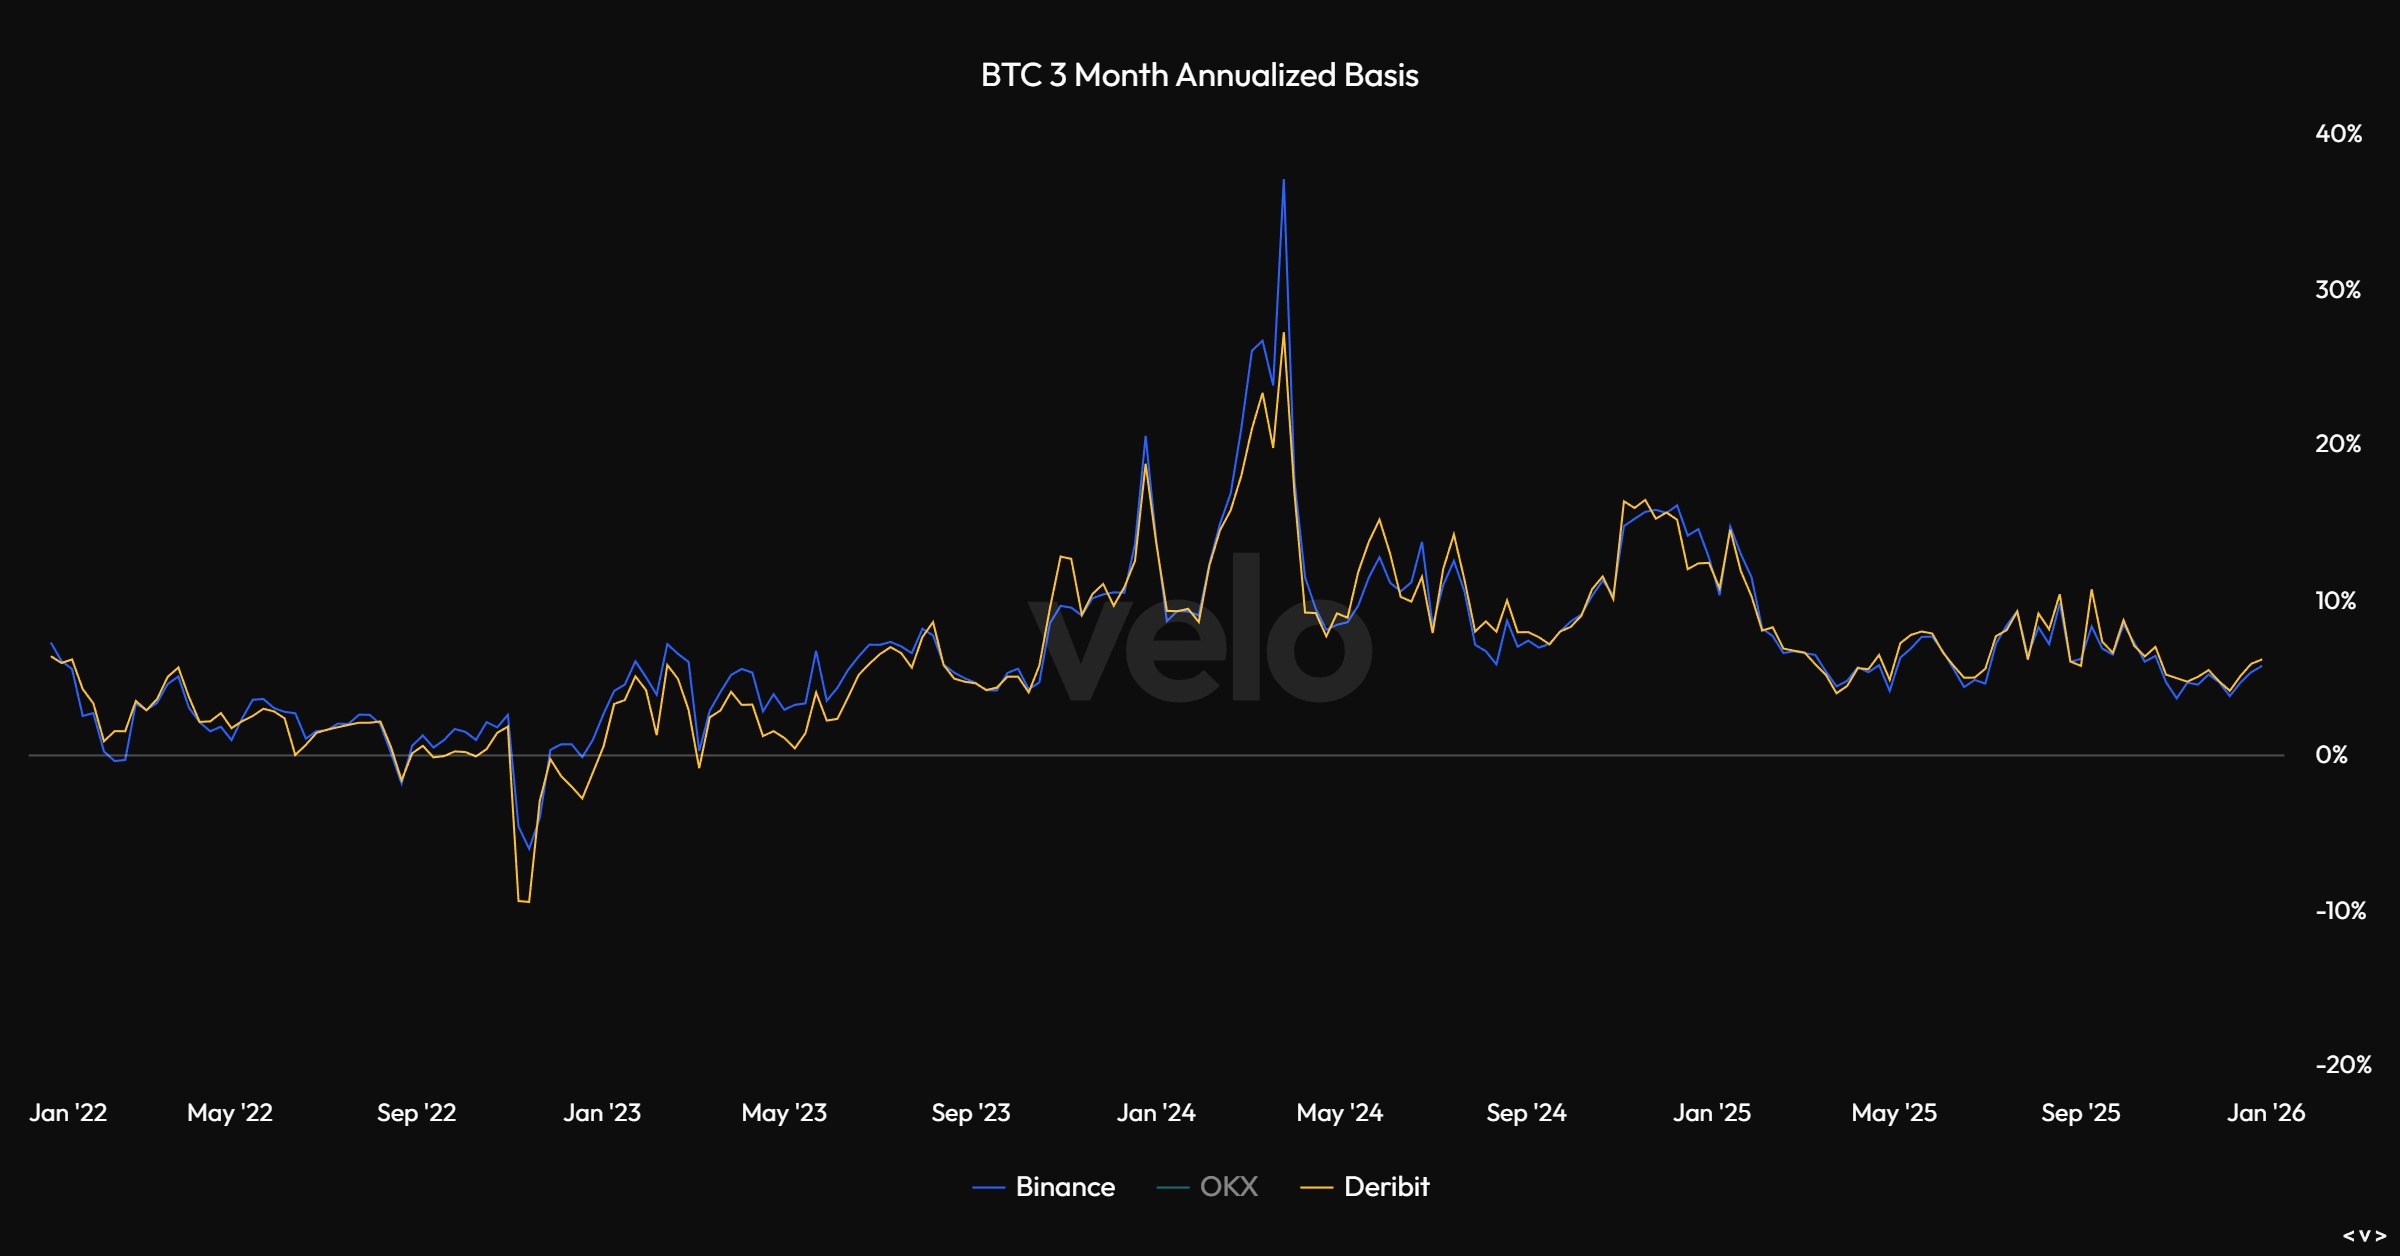
And here's 3-month annualized basis:
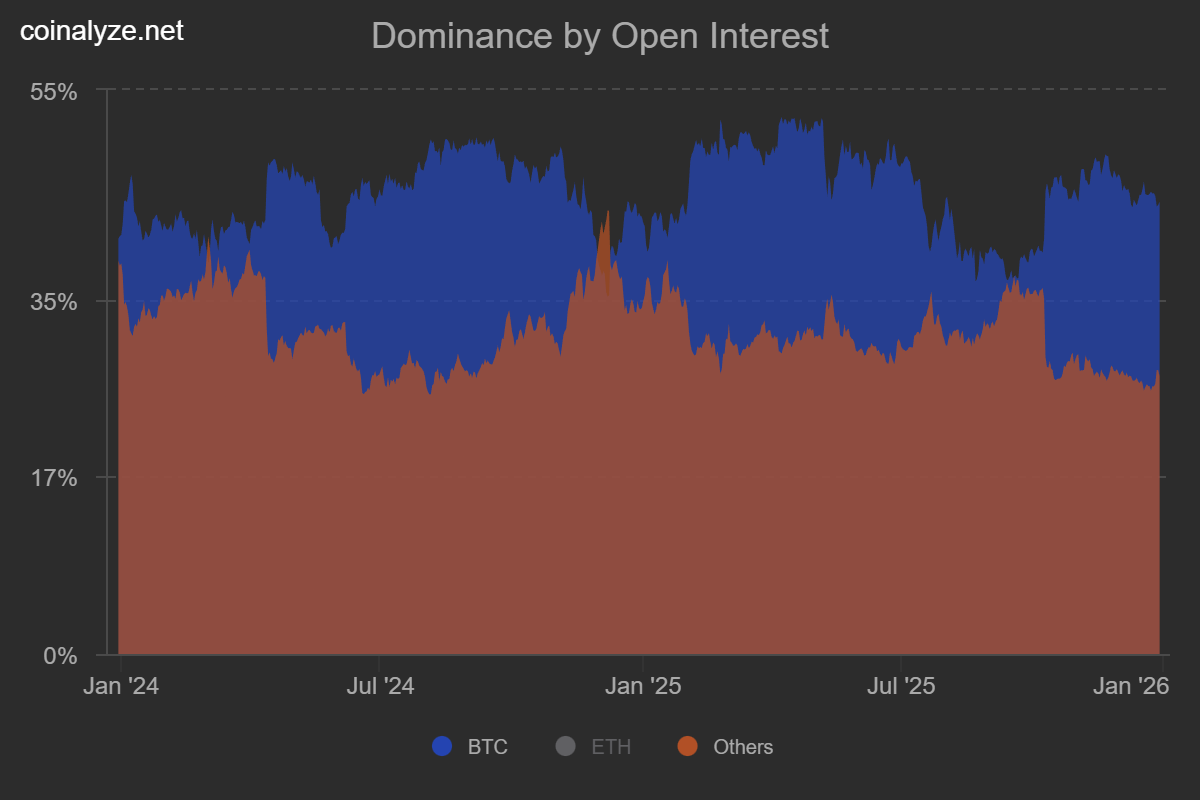
And Bitcoin OI vs Altcoin OI:
And finally some of the expected 1-week and 1-month liquidation levels:
-2025-12-29_08_46_14.png)
-2025-12-29_08_46_34.png)
Price: $3007
ETH/USD
Weekly:
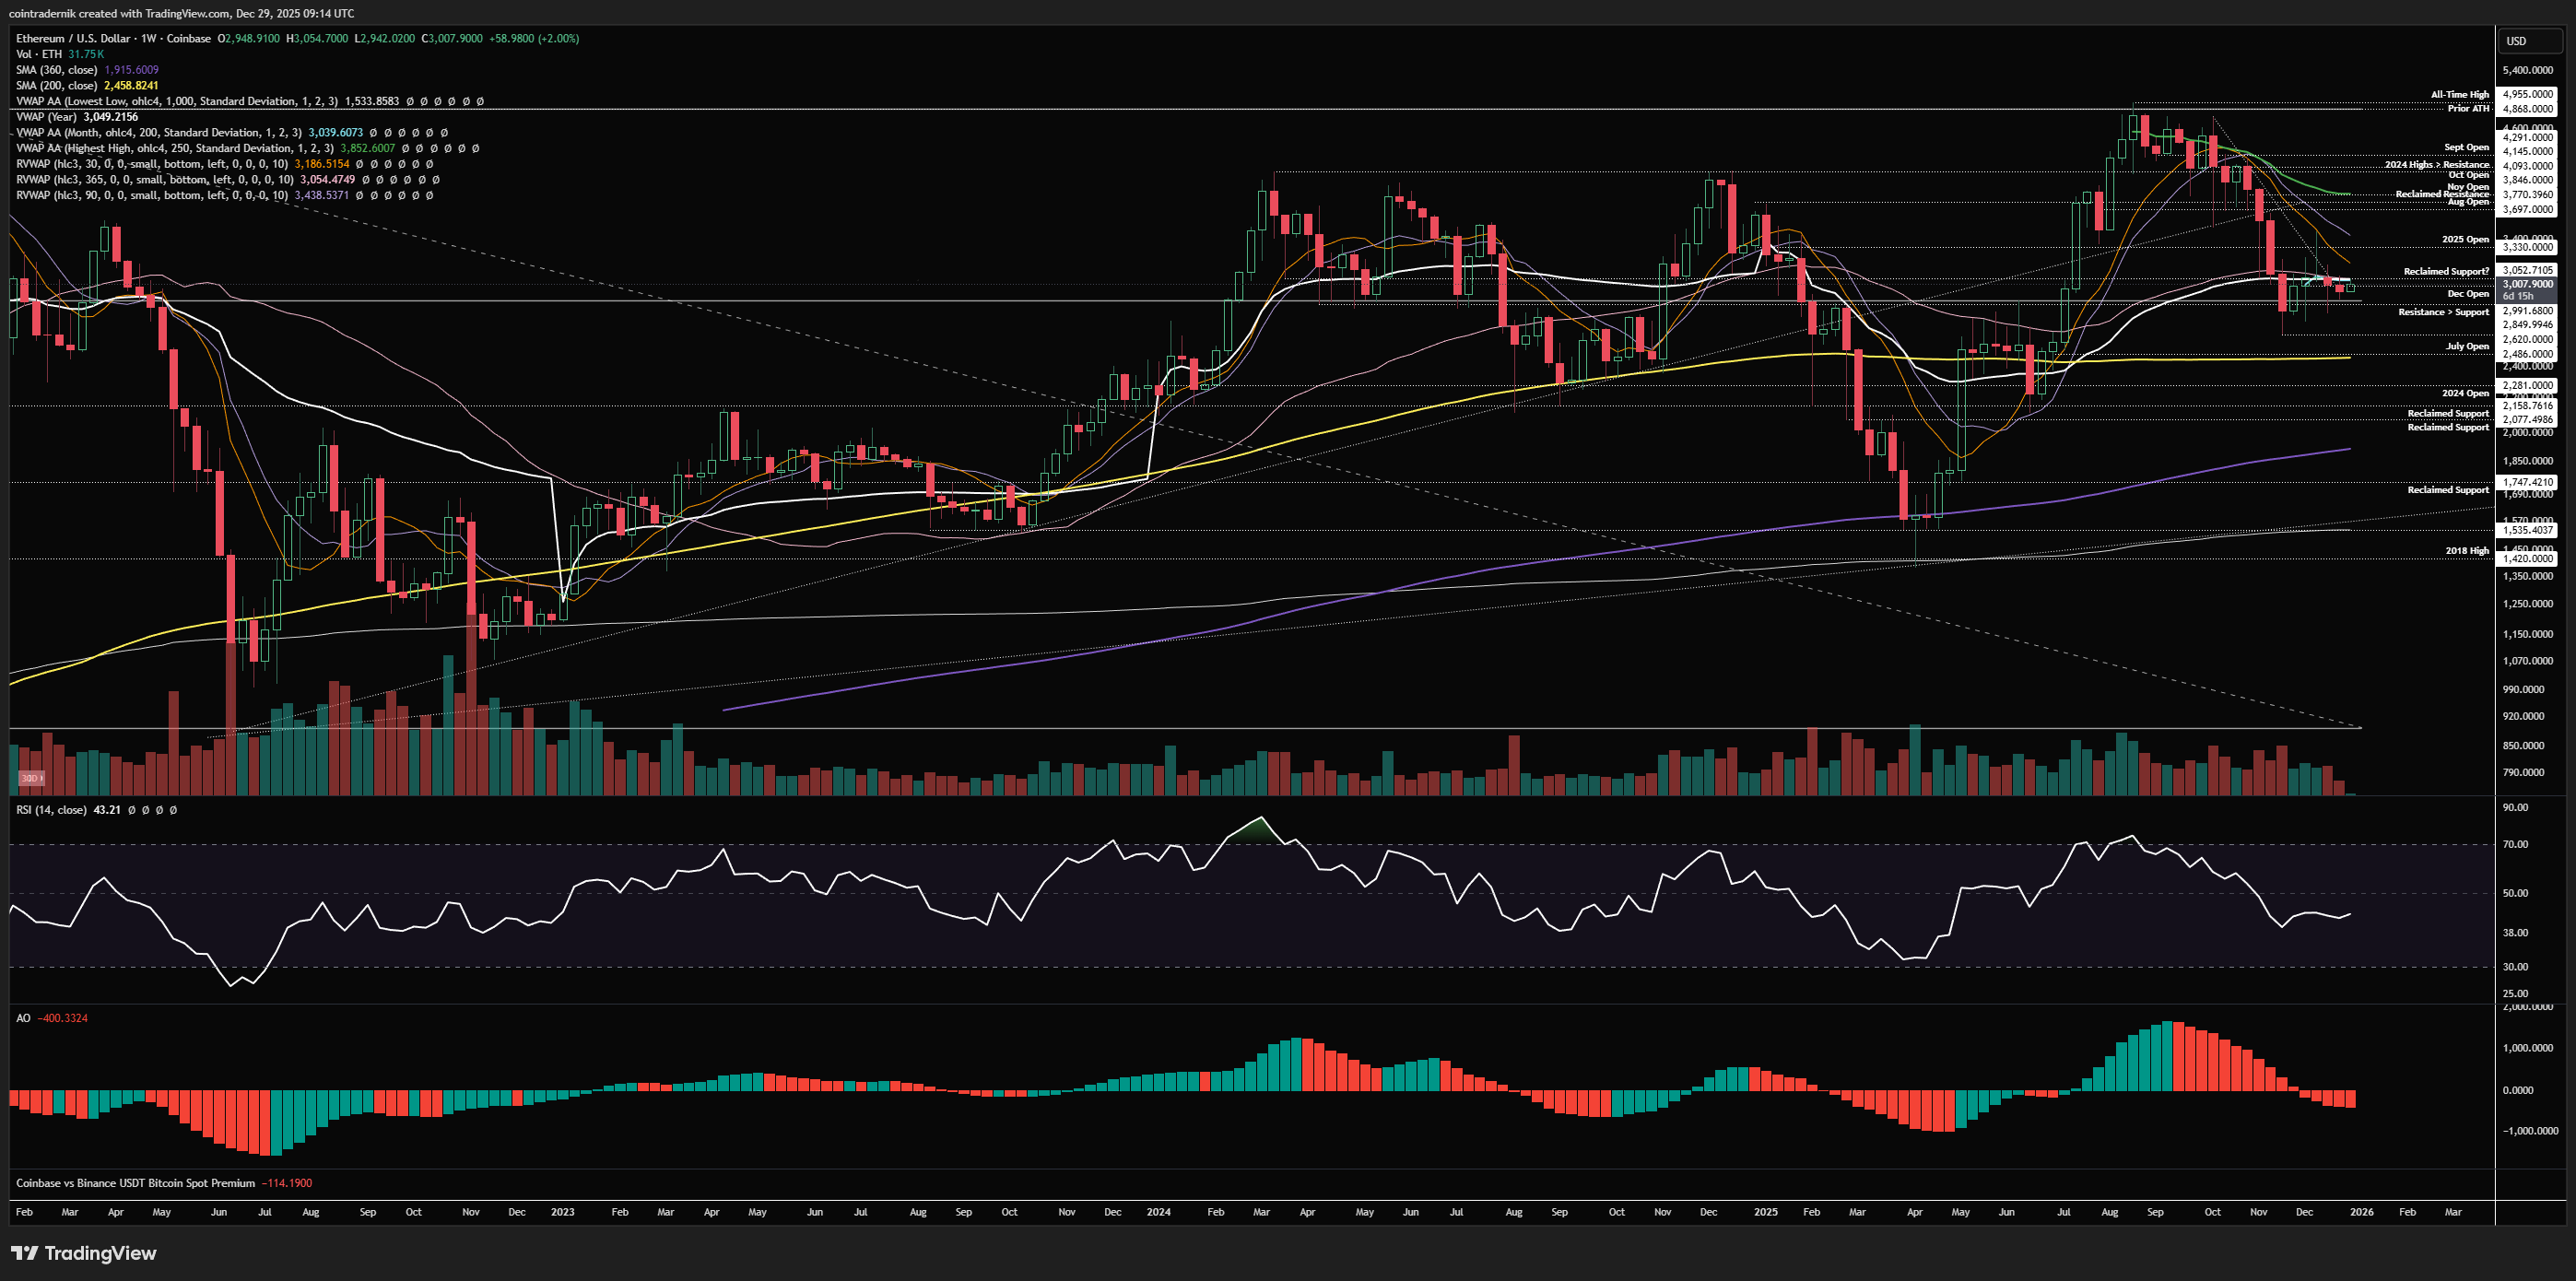
Beginning with the weekly for ETH/USD, we were unable to stick the landing above $3050, but price also failed to break convincingly lower, thus much like Bitcoin the pair continues to chop around key support in a tight range into the yearly close. We are holding above $2850 as support here but $3050 is now acting as lower timeframe resistance. I am not placing much weight on price-action right around the close to be honest, so attention should be focus on the first couple of weeks of January and how we trade within that, where acceptance above $3050, flipping that back into support, opens up $3700, whereas rejection below and a weekly close below $2850 would likely lead to the 200wMA being tagged at $2460. In the latter scenario, I think the expectation of short-term strength becomes significantly less probable and I would be keen to see how Bitcoin is trading before asserting whether ETH just chops around that area in Q1 or moves significantly lower towards $1750 - obviously, if Bitcoin lost $73k, I think ETH trades towards that bottom of the channel between $1535 and $1750.
Daily:
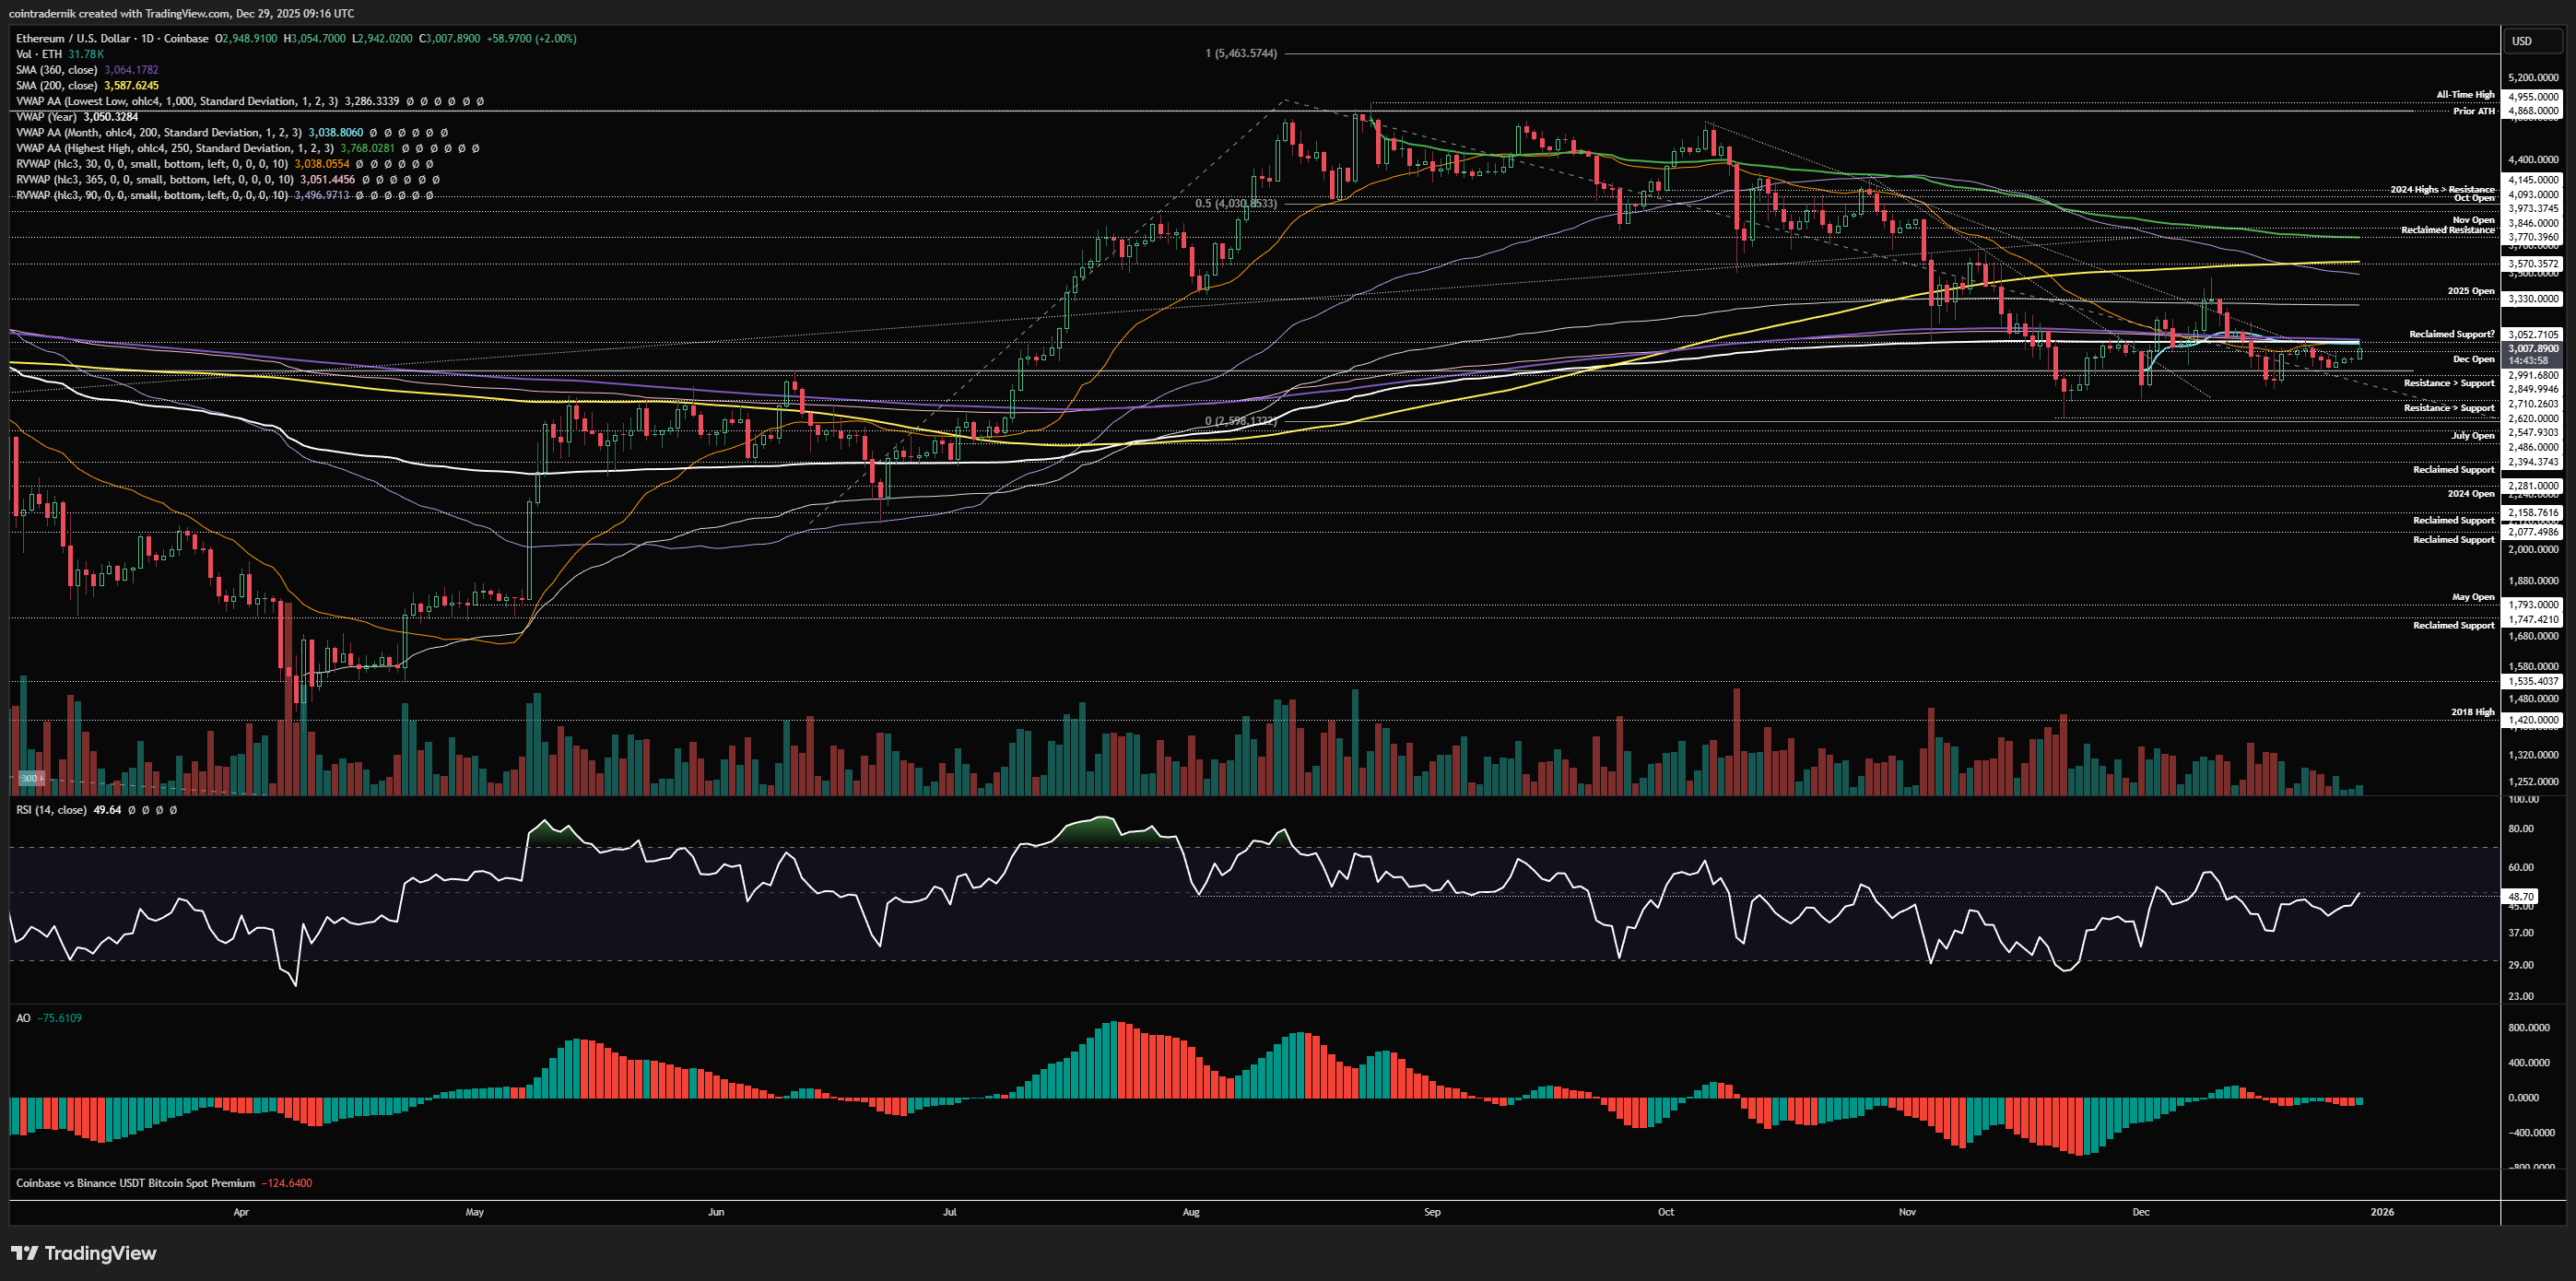
Turning to the daily, we can see that this range has formed right around the yearly VWAP, 360dMA and 30d rolling VWAP, with most of the recent price-action clustered around $3050, We did have higher-highs and lows into the 200dMA retest, but we rejected, broke lower and flipped key support into resistance, below which we continue to trade over the past week or so. If we do break and close below recent support, I think that $2620 low gets taken out and I would prefer to see shorts piling into that low and then price reverse and form a nasty bear trap if my bullish view on Q1 2026 is to remain. If, instead, we theoretically take out $2620 in January and we just see levered longs piling in as structure breaks, I think I am wrong on my view and ETH trades significantly lower, back to the bottom of the multi-year channel. Now, assuming we hold above that November low, a move above $3050 in January that then holds above that level as reclaimed support likely leads to $3770 being retested as major resistance.
ETH/BTC
Weekly:
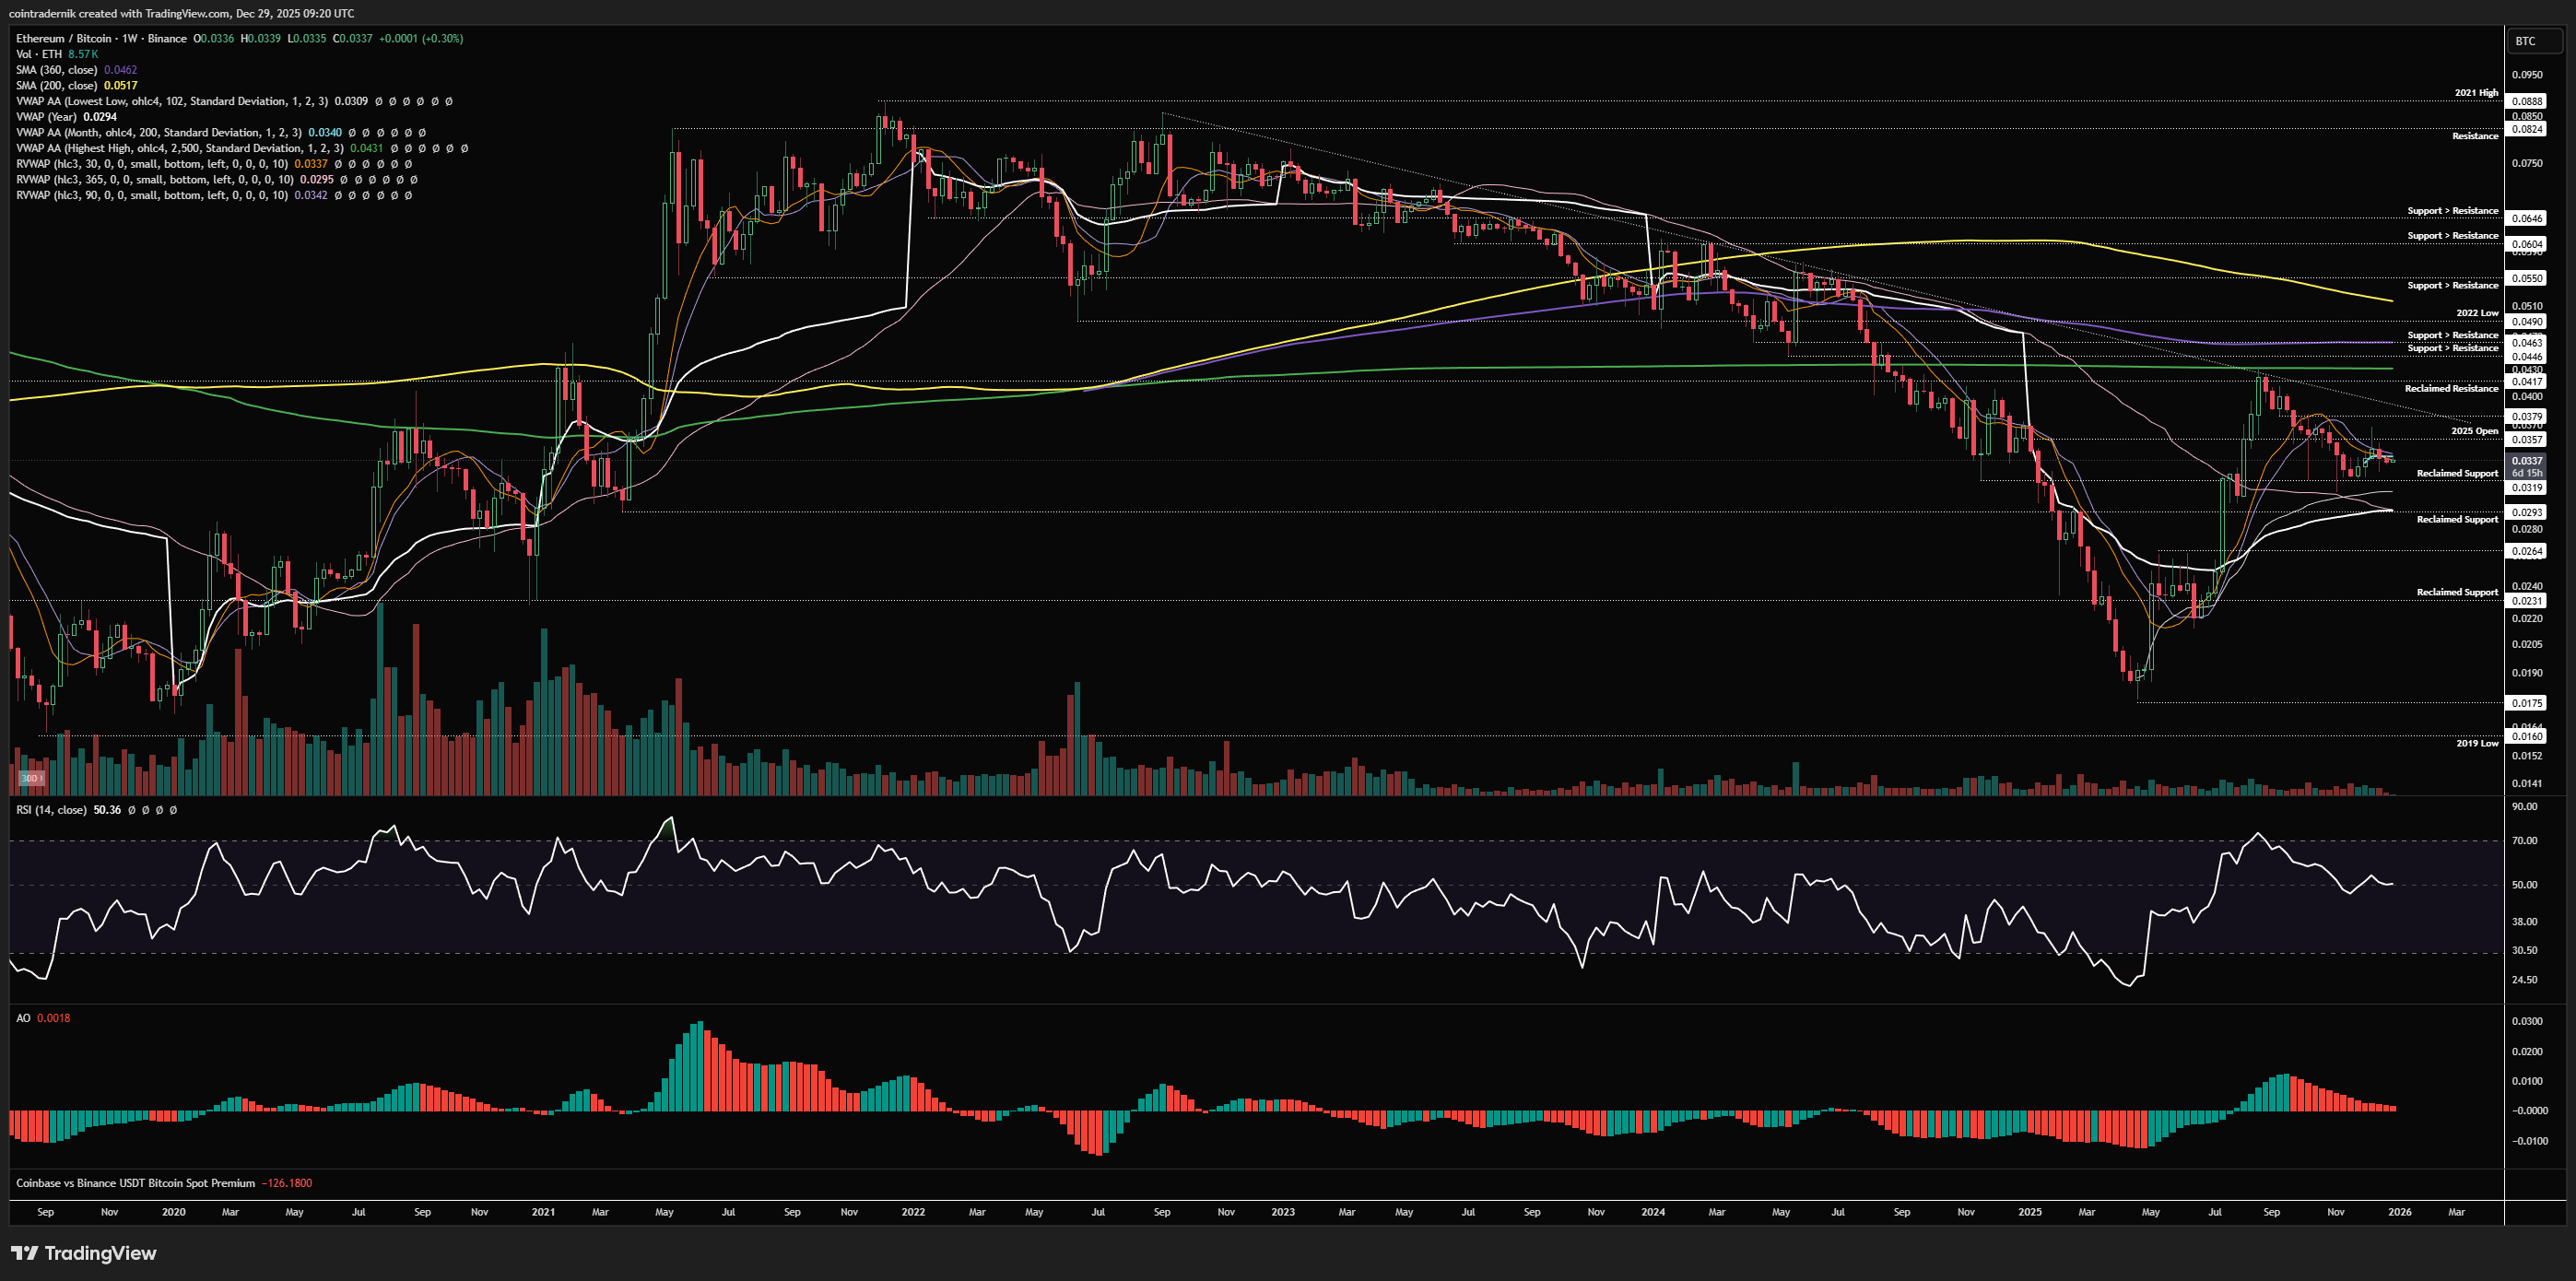
Looking at ETH/BTC, on the weekly we can see that price did break higher and attempt a 2025 open reclaim, but rejected and is now trading back at 0.0336. We are in a lower timeframe no man's land between major support below at 0.0319 and resistance at 0.0357. Structure and momentum here still look bullish but we do not now want to see a weekly close below 0.0319, as that then looks like a lower-high and lower-low, with only 0.0293 as support below that before a much larger unwind. To be honest, if we do close the week below 0.0319, I think it is unlikely 0.0293 holds and the more bearish scenario for ETH becomes more likely, although I would add that 0.0293 is the real line in the sand for me structurally. Bulls really want to see a higher-low form here above 0.0319 and then the weekly close back above 0.0357, subsequent to which I would expect a retest of 0.0417 in Q1 followed by a breakout and second leg higher later in H1 2026.
Daily:
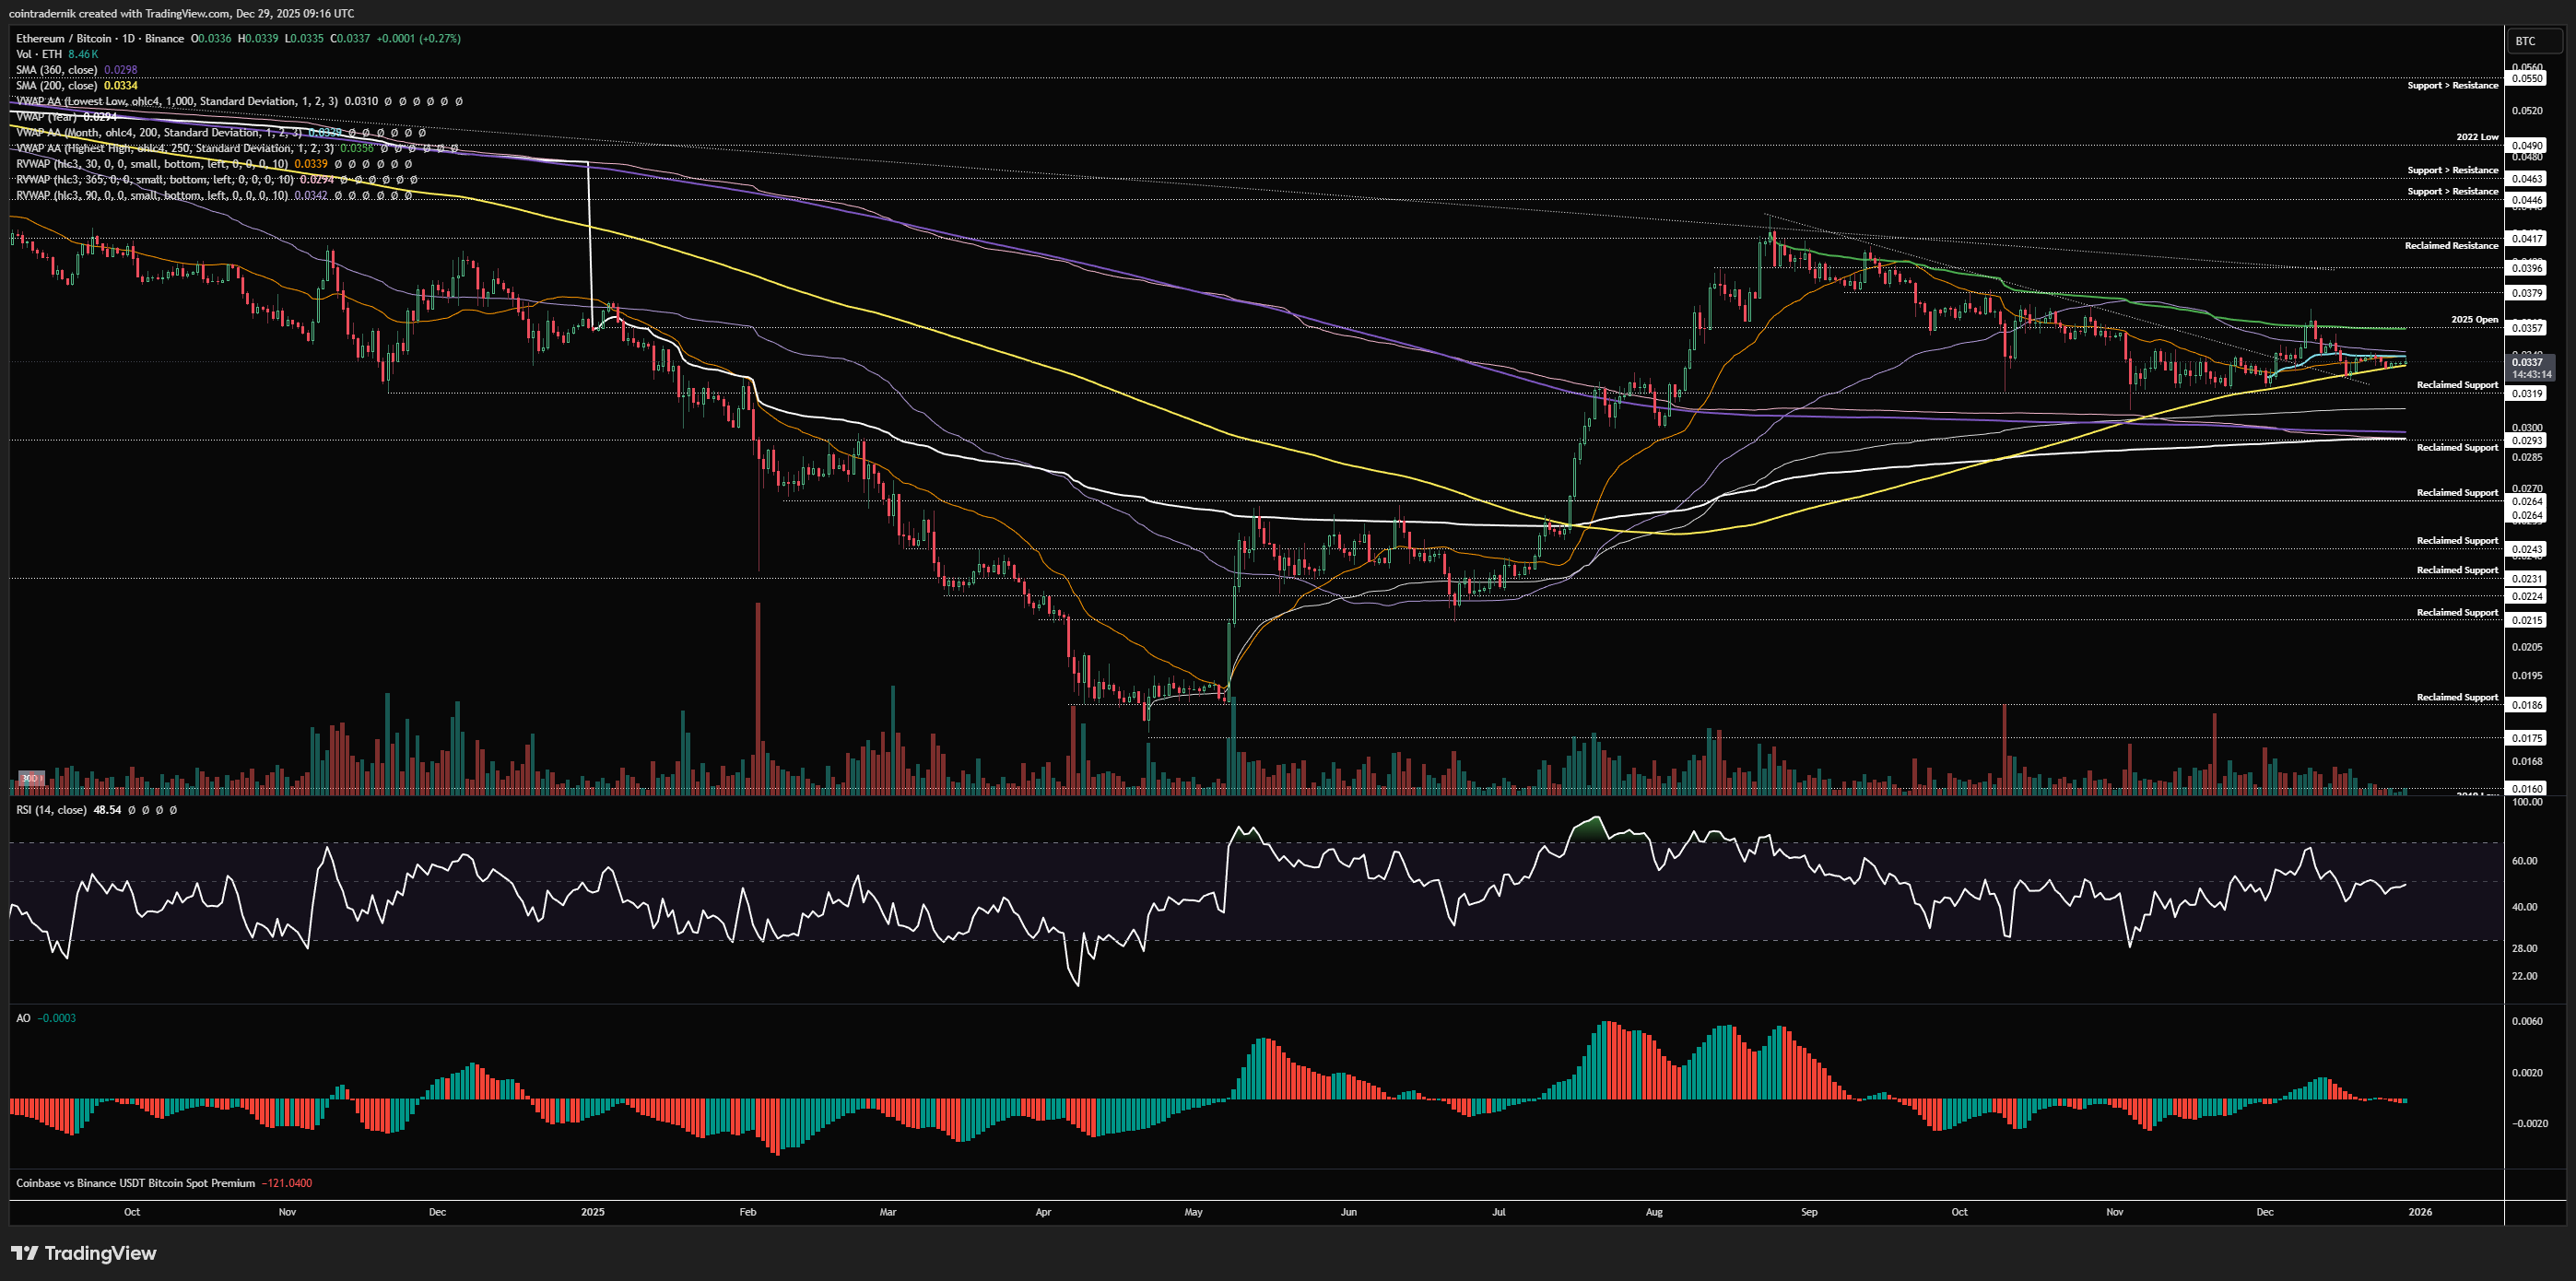
Dropping into the daily, we can see that the anchored VWAP from the yearly high continues to cap price, confluent with the yearly open at 0.0357. Acceptance above that level is the clearest risk-on signal I can see for ETH/BTC. Price is still very much range-bound but support is being found at higher-prices now, with the 200dMA holding firm. I do expect some volatility this week into next week and would not be surprised to see some sort of whipsaw price-action, but ultimately what we want to see for the bullish outlook on ETH/BTC to remain valid is a break and close above 0.0357 in January. I will reiterate that whilst we have bullish momentum and structure on both the weekly and daily timeframe, we should expect continuation of the trend. Let's see how this next couple of weeks plays out, but I will be very quick to bail on bullishness here if we lose key support levels.
Receive the latest updates directly to your inbox

Price: $97.63
Weekly:
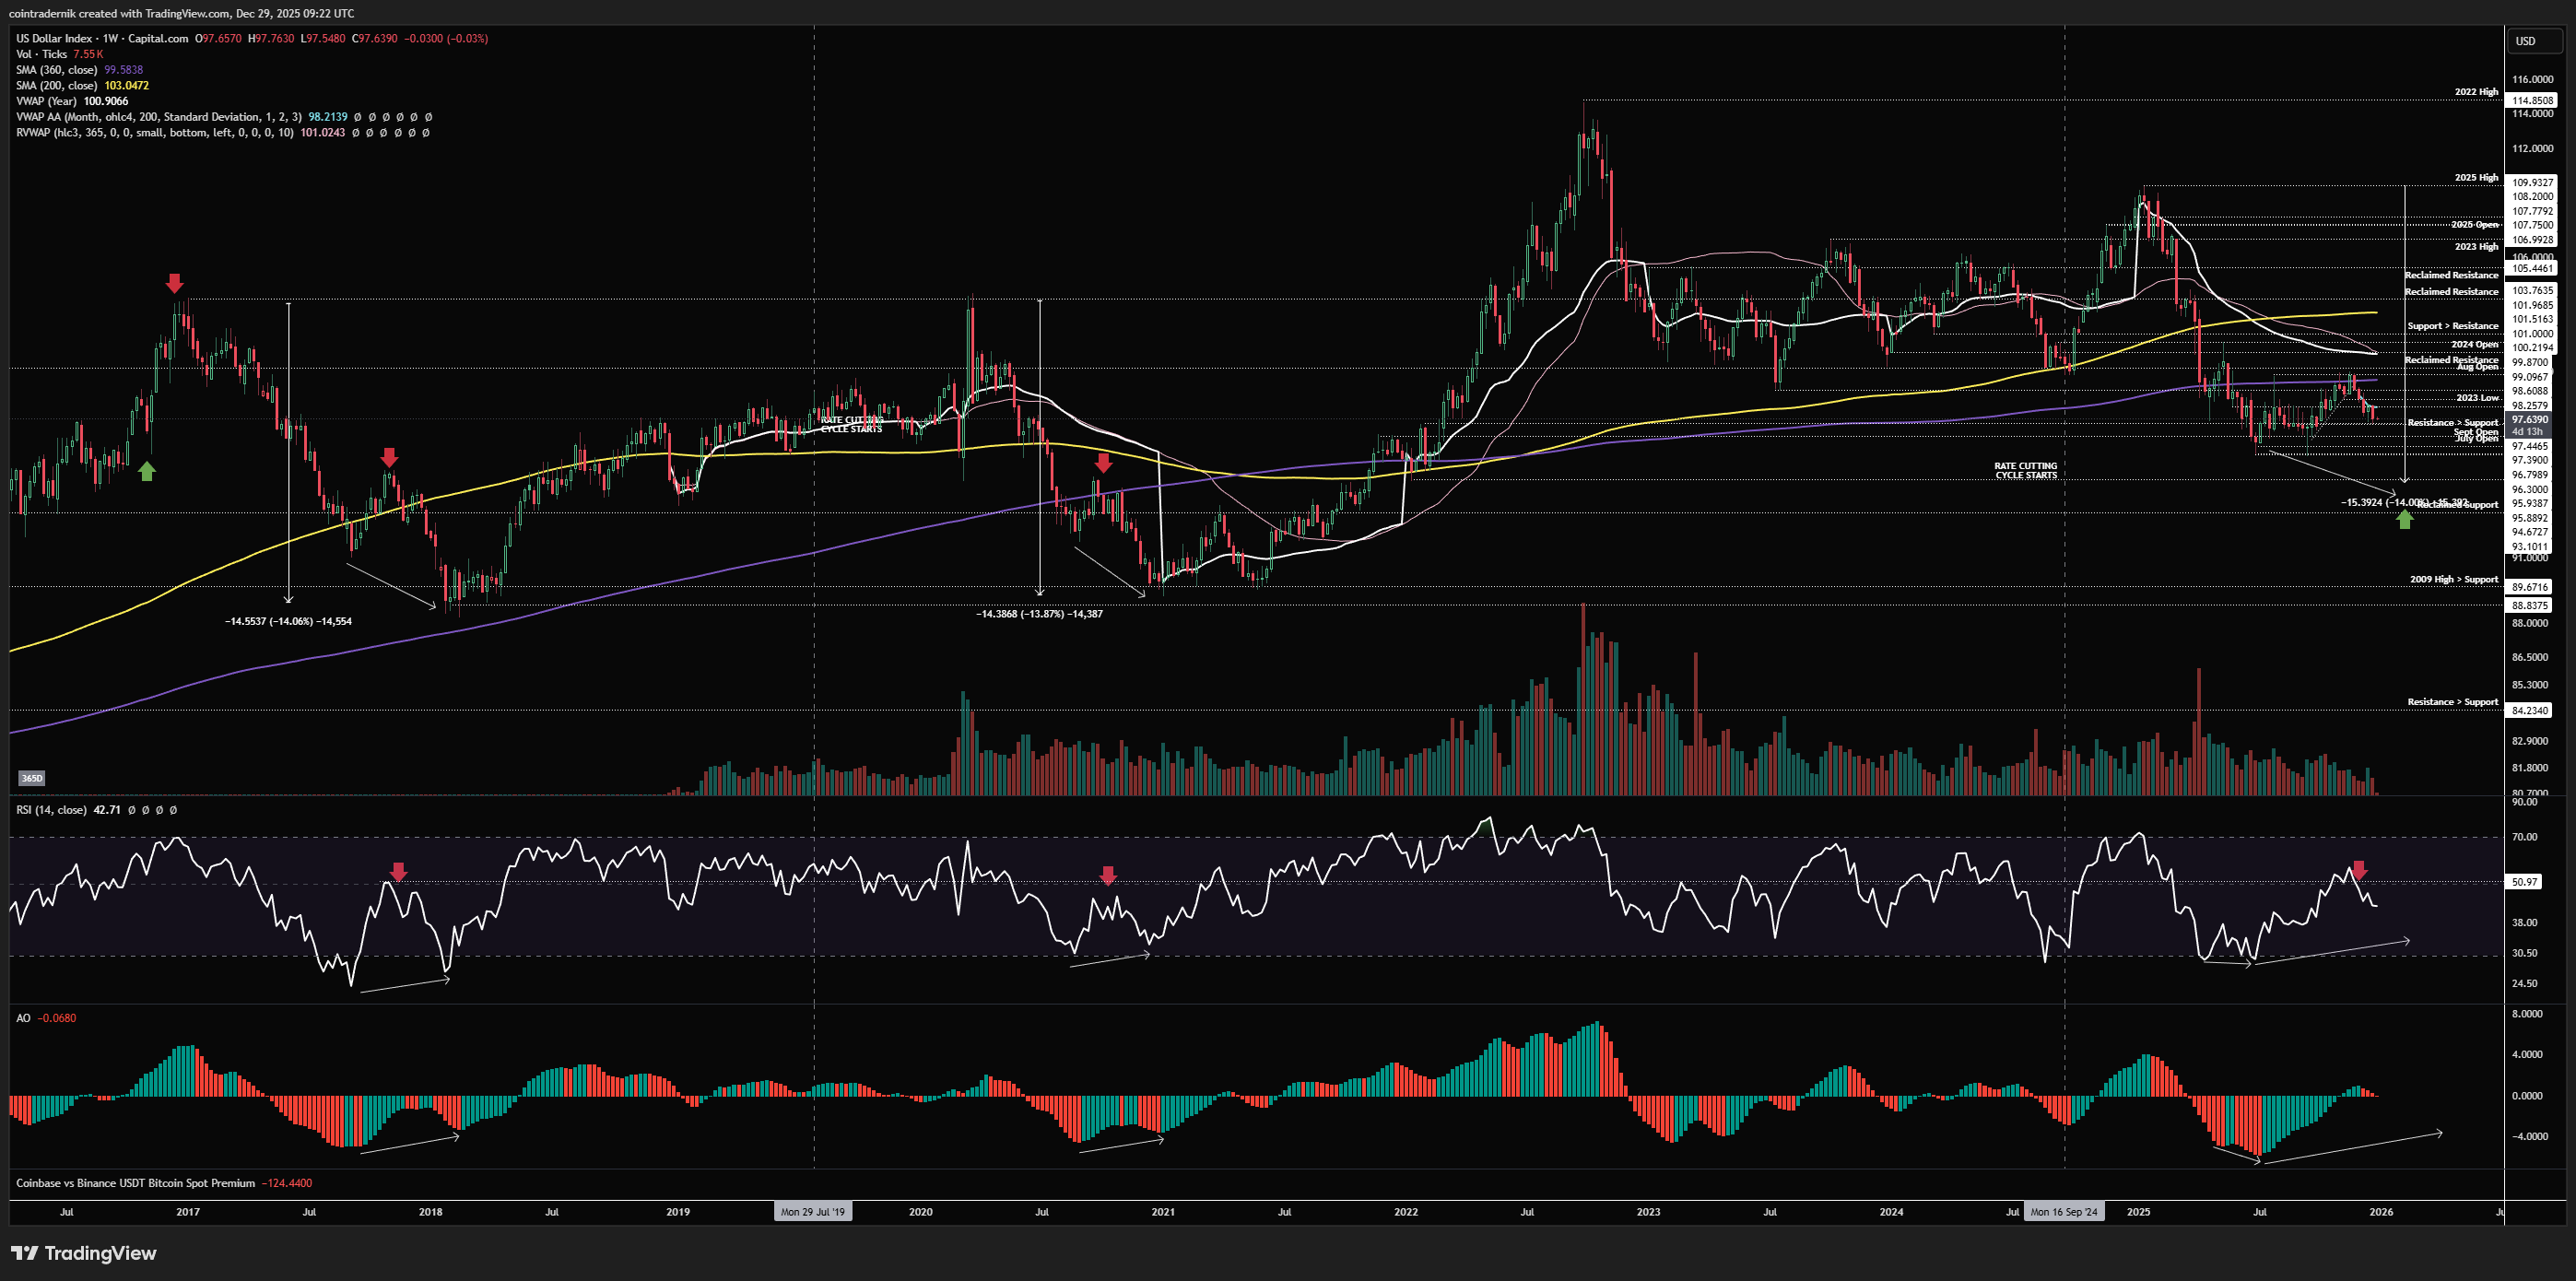
Beginning with the weekly view for DXY, we can see that price continues to break lower, closing last week at 97.6, right around support, having rejected several weeks ago at key resistance. This is all as expected so far for the Dollar, but I would not be surprised to see a bit of relief here now that we have come into support, though I would expect the formation of a lower-high to follow and DXY to continue its path towards range support at 96 in January. Ultimately, I continue to expect another leg lower to follow, and this Dollar cycle to find major support between 93 and 94.7. For all the talk of the death of the Dollar and this cycle being different, if anything this cycle has shown more Dollar strength, with us trading well above the prior two cyclical bottoms. Unless we lose that 2009 high that has acted as support around the 90 handle, there is no reason to see this Dollar cycle as different from recent ones in my view, and I expect the back end of 2026 into 2027 to be brighter for Dollar strength. Until then, I see continuation lower into range lows and a little below.
Daily:
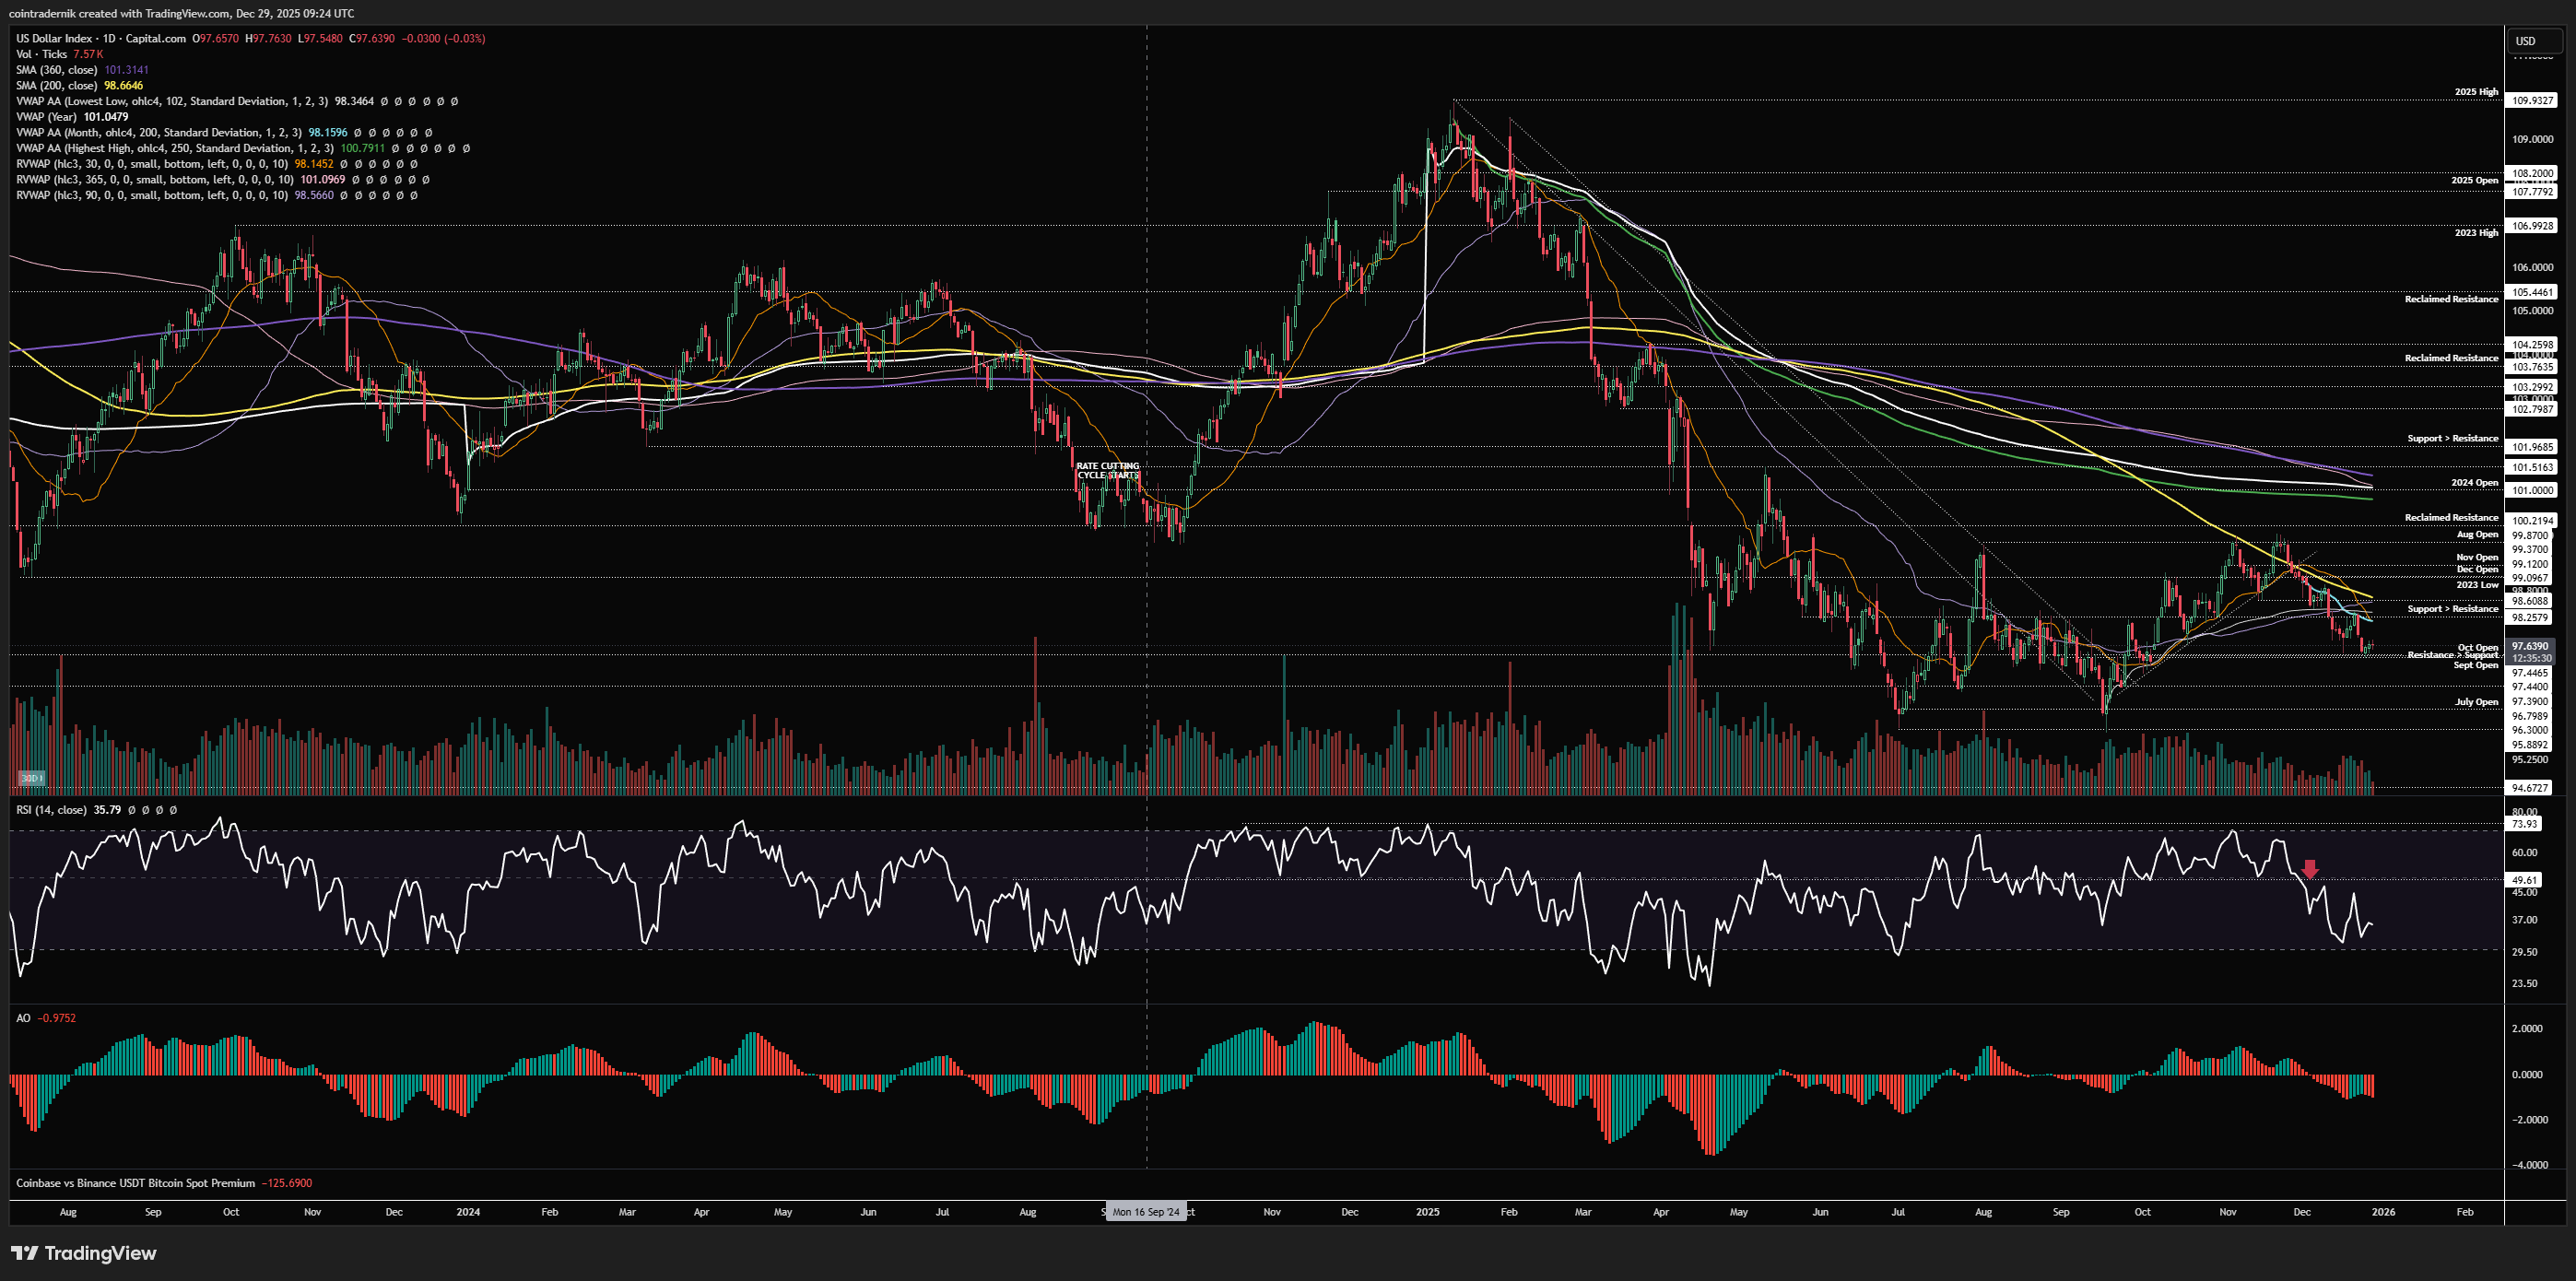
Looking at the daily, we can see that there is some bullish divergence forming here on momentum indicators as price has pushed into this recent support level, providing some confluence for a bounce. If we do see an early Jan bid, I would still expect 98.3 to hold as support turned resistance, with DXY breaking below 97.4 some time in Jan and moving towards the 2025 lows from there. The higher timeframe view remains intact until we either see a leg lower below range lows or we see 101 reclaimed as support. Nothing else to add here.
Price: $6924
Weekly:
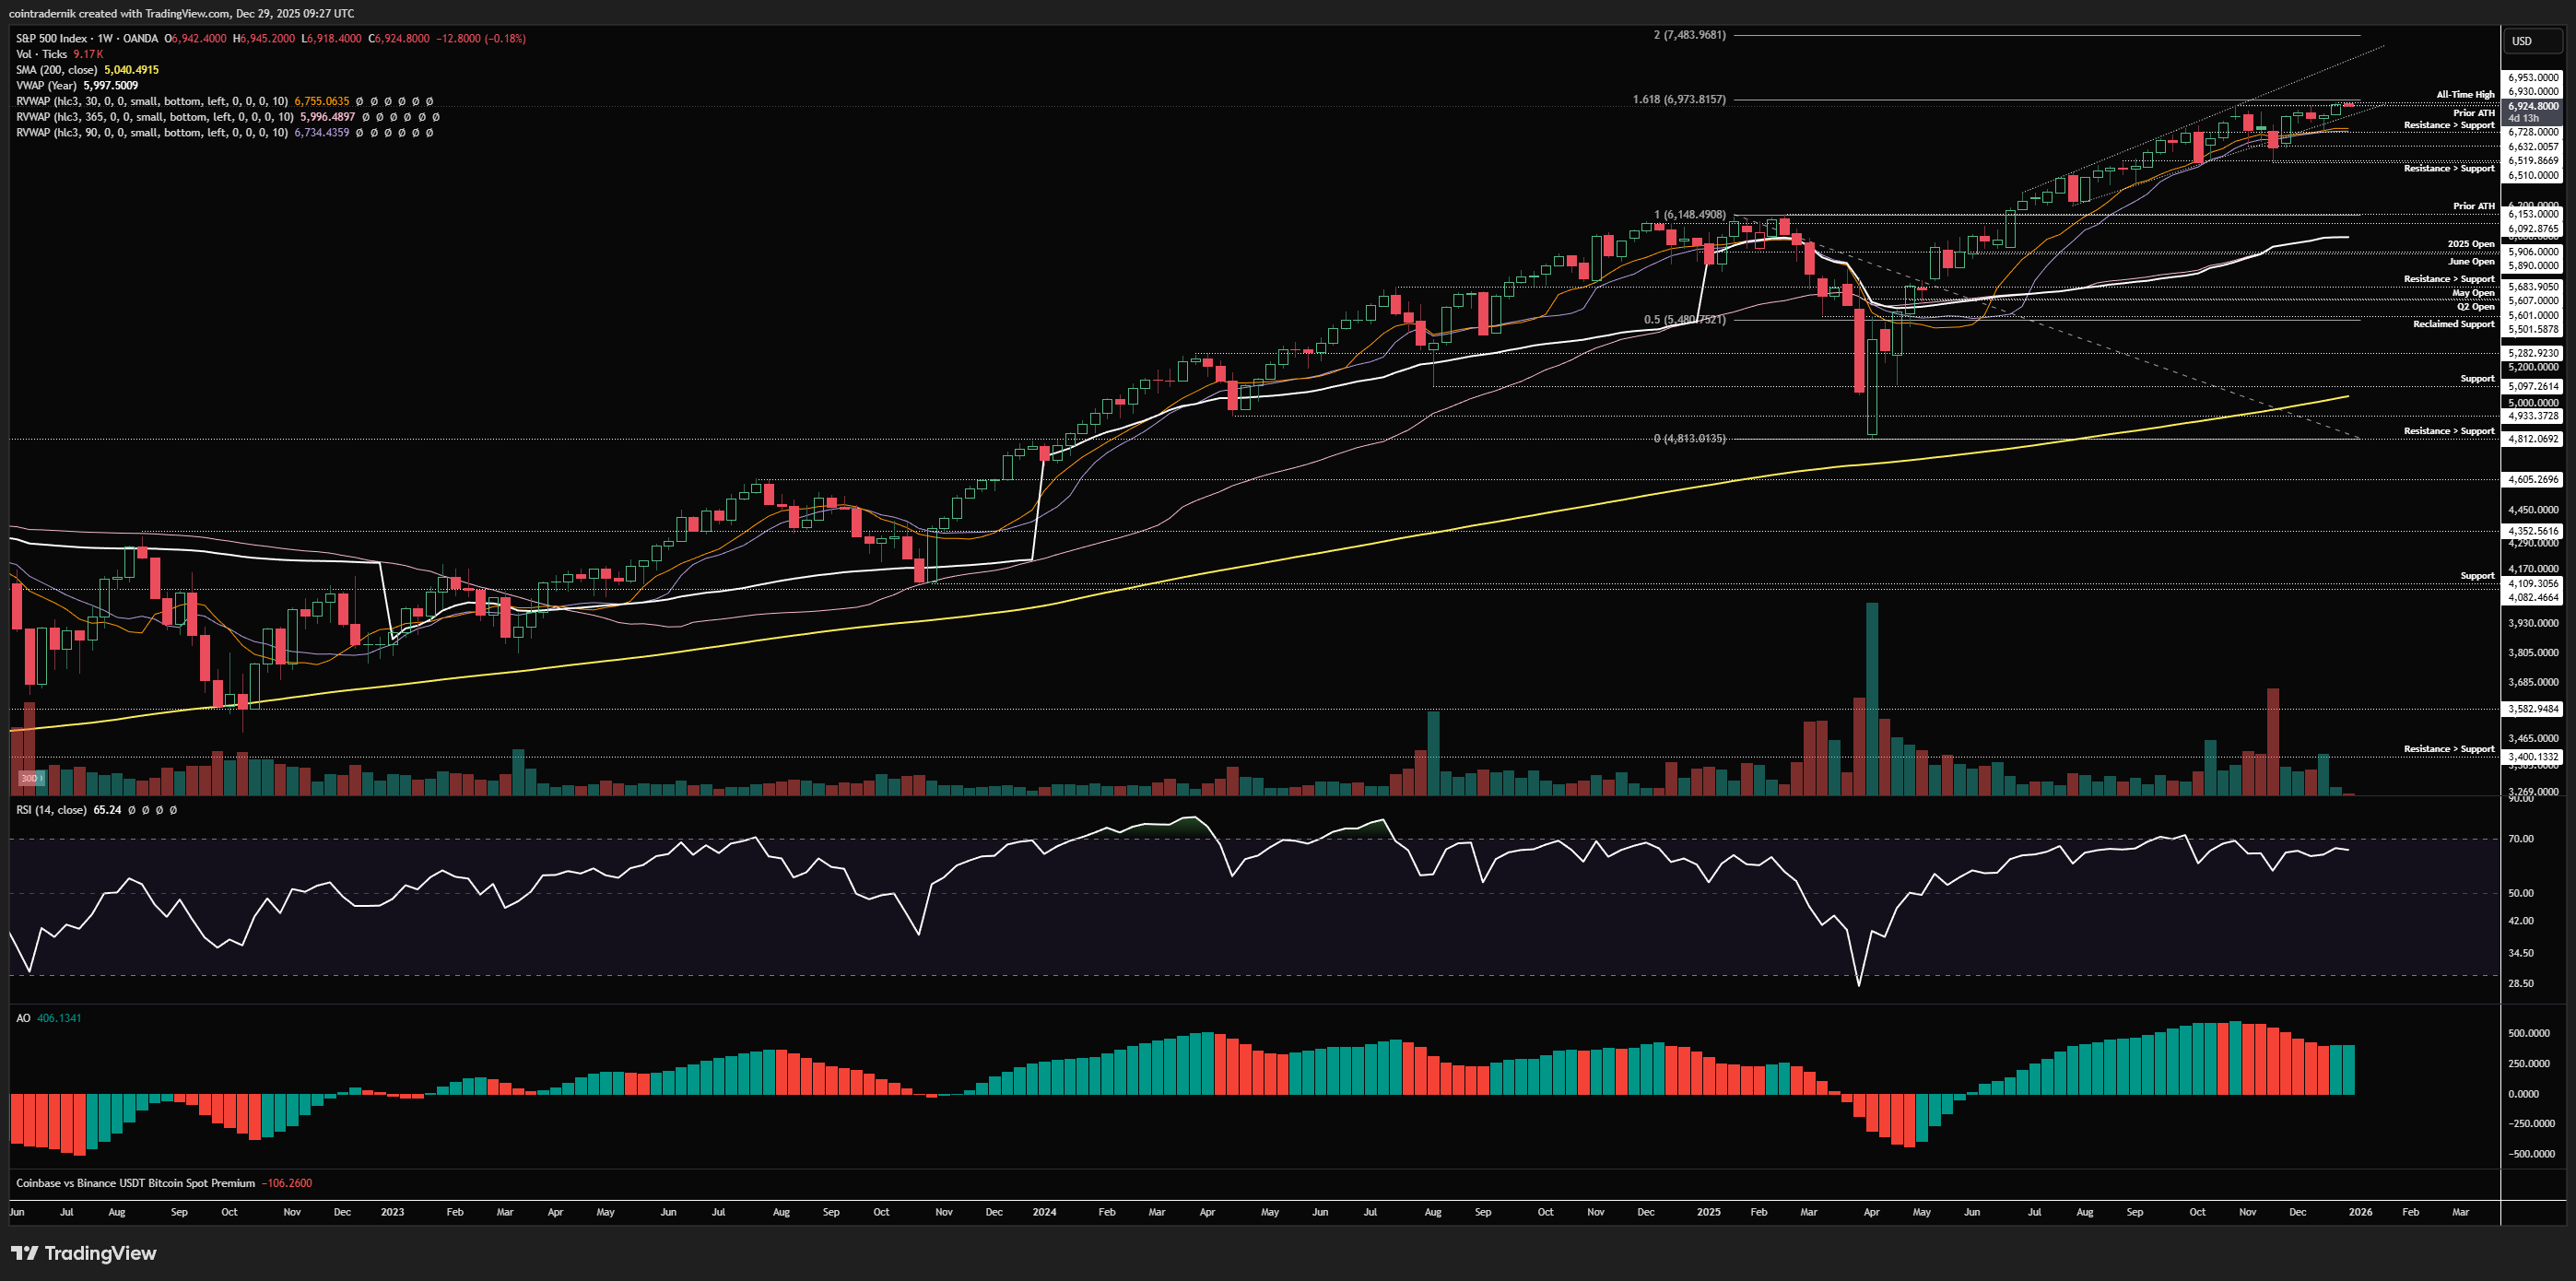
Beginning with the weekly for SPX, we can see that last week saw price make new all-time highs, despite all of the fear we had just two weeks prior about lower-highs. We remained firmly above key support levels with bullish structure going into a low liquidity environment where price was more likely to grind higher than break meaningfully lower and that is precisely what occurred. We are now in price discovery and equities should continue to move higher from here in January, as long as support holds at 6730. Until that breaks, it is higher-highs and higher-lows. As far away as it seems, 7500ish is the 200% extension of the April tariff crash and would be the next fib level of interest for major resistance. If we break convincingly above 7000, I think we enter melt-up mode in Q1 towards that level but likely fall short in H1 before the next 10% correction.
Daily:
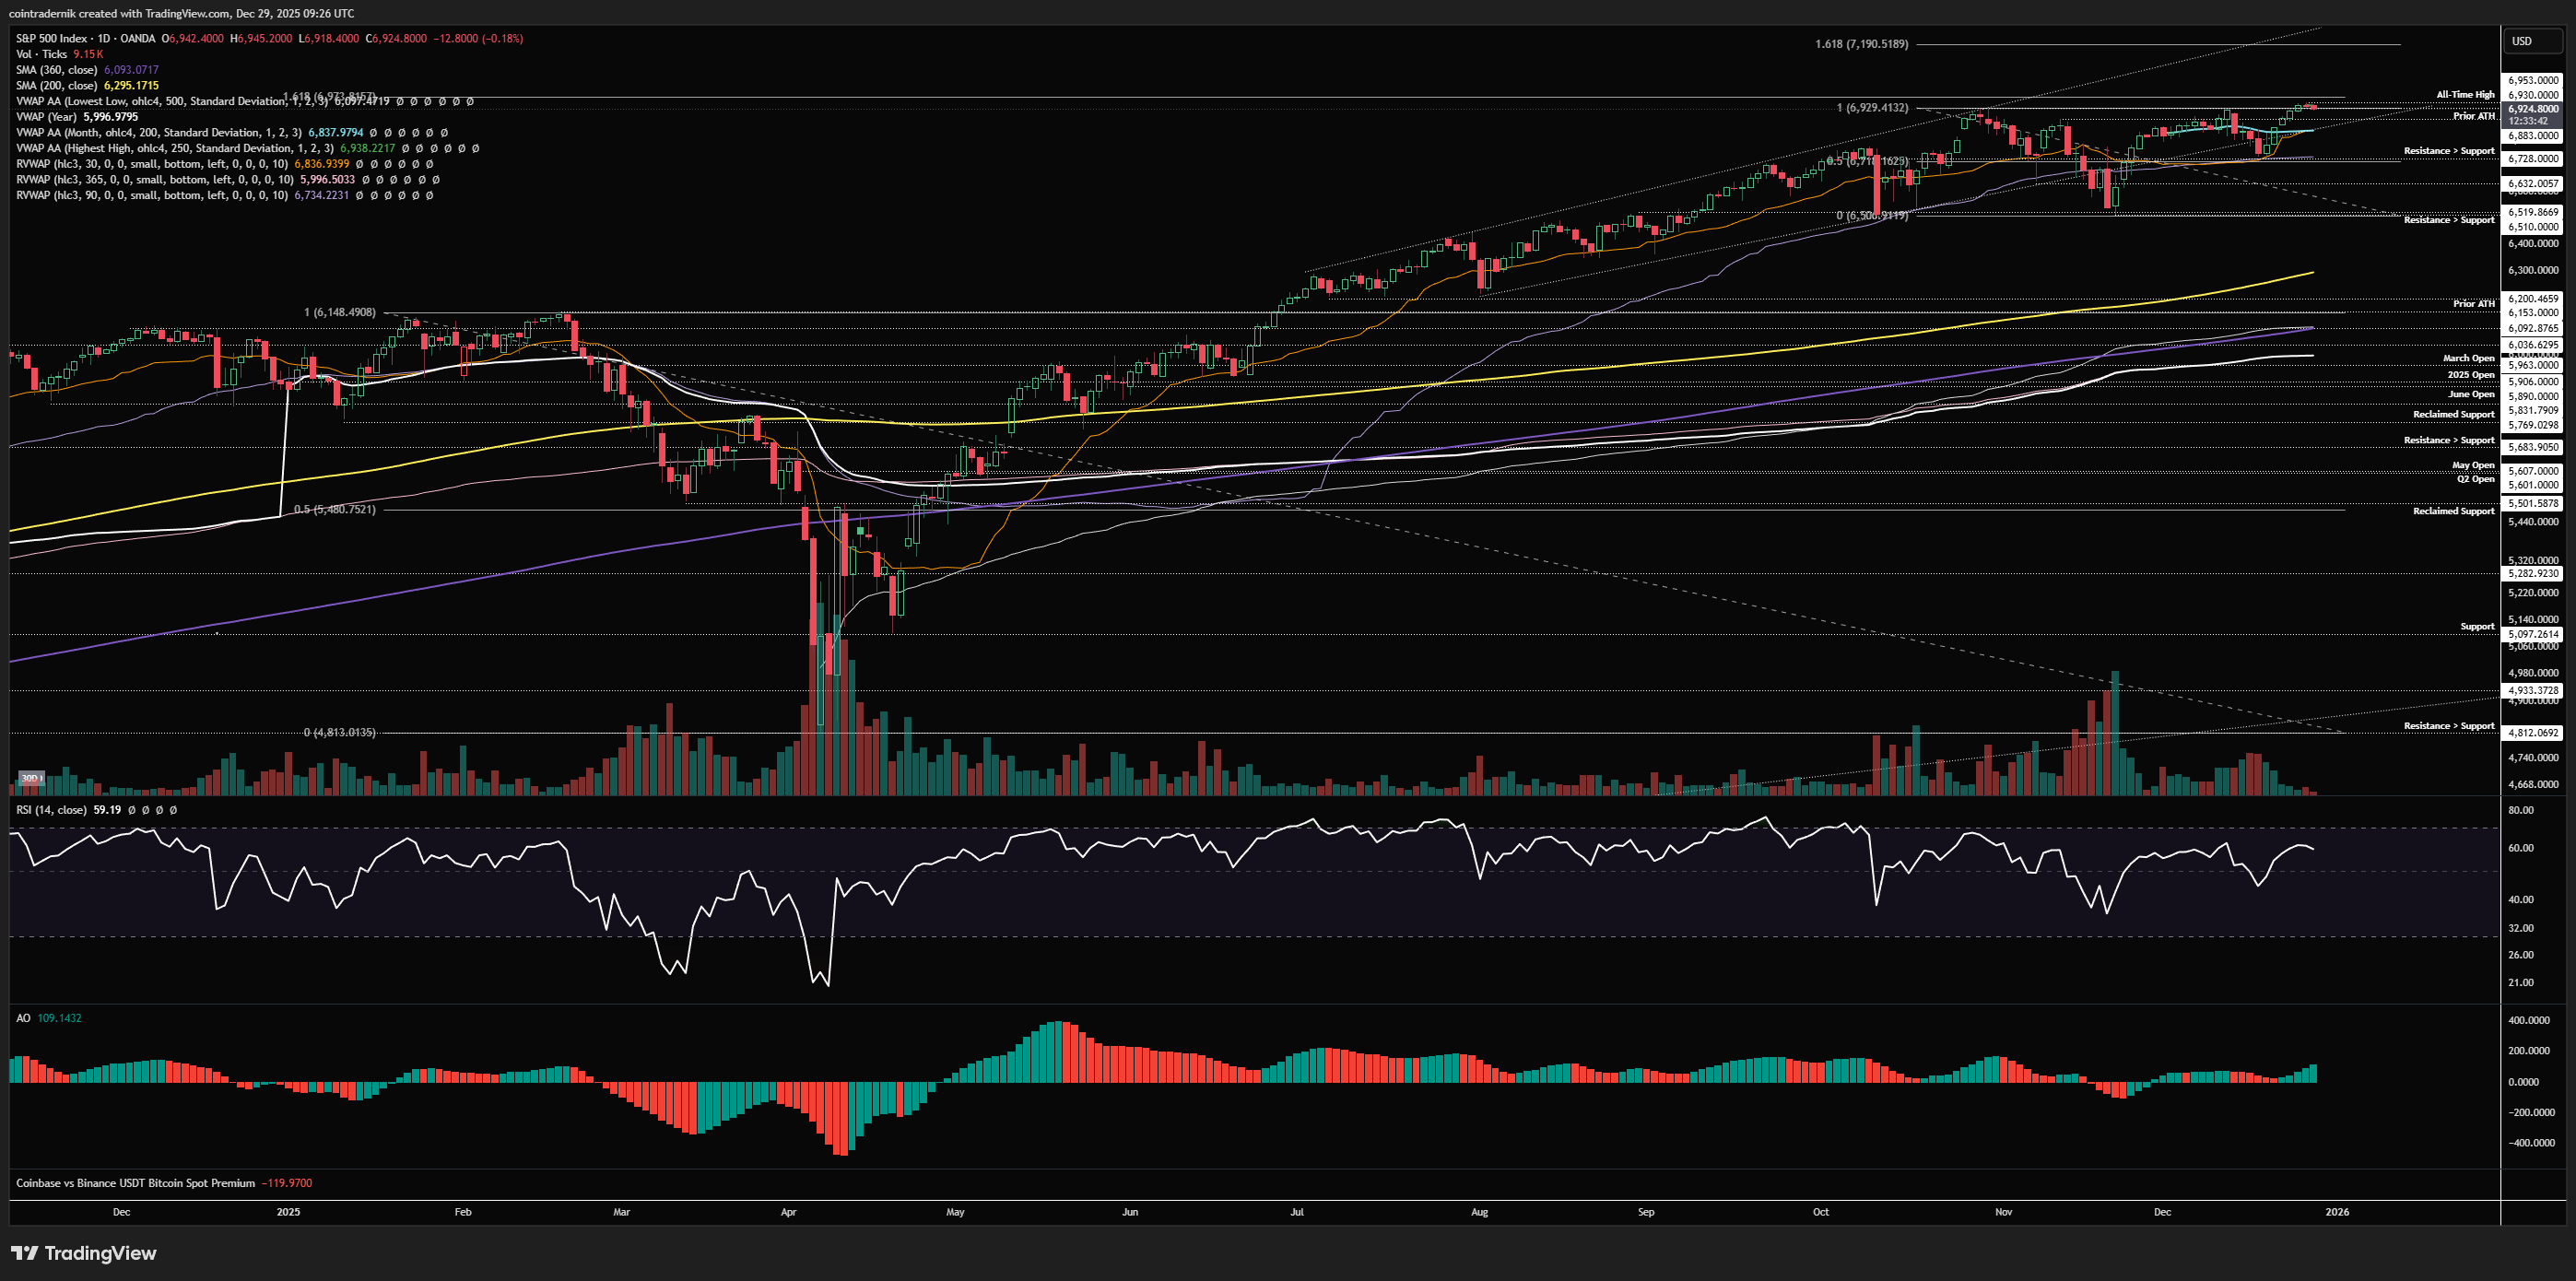
Turning to the daily, we can see that even into that more recent low that held 6730 as support, momentum and structure were both still bullish. We then rallied above the monthly VWAP, having held the 30d rolling VWAP as a higher-low, pushing into 6950 as expected, where we are finding some local resistance. I think the 7000 handle is key here, below which we still have some psychological anxieties despite price-action and above which I think the market finds a more real sense of greed. If we can flip 7000 in January, I think we see 7190 before any real resistance steps in. The bearish scenario here is a poke above 7000 that then leads to a close below 6730, acting as a bull trap into a major level with a momentum breakdown. That would look much more weak for Q1. Unless we see that, please stop trying to call intergalactic tops on SPX every week.
Price: $4462
Weekly:
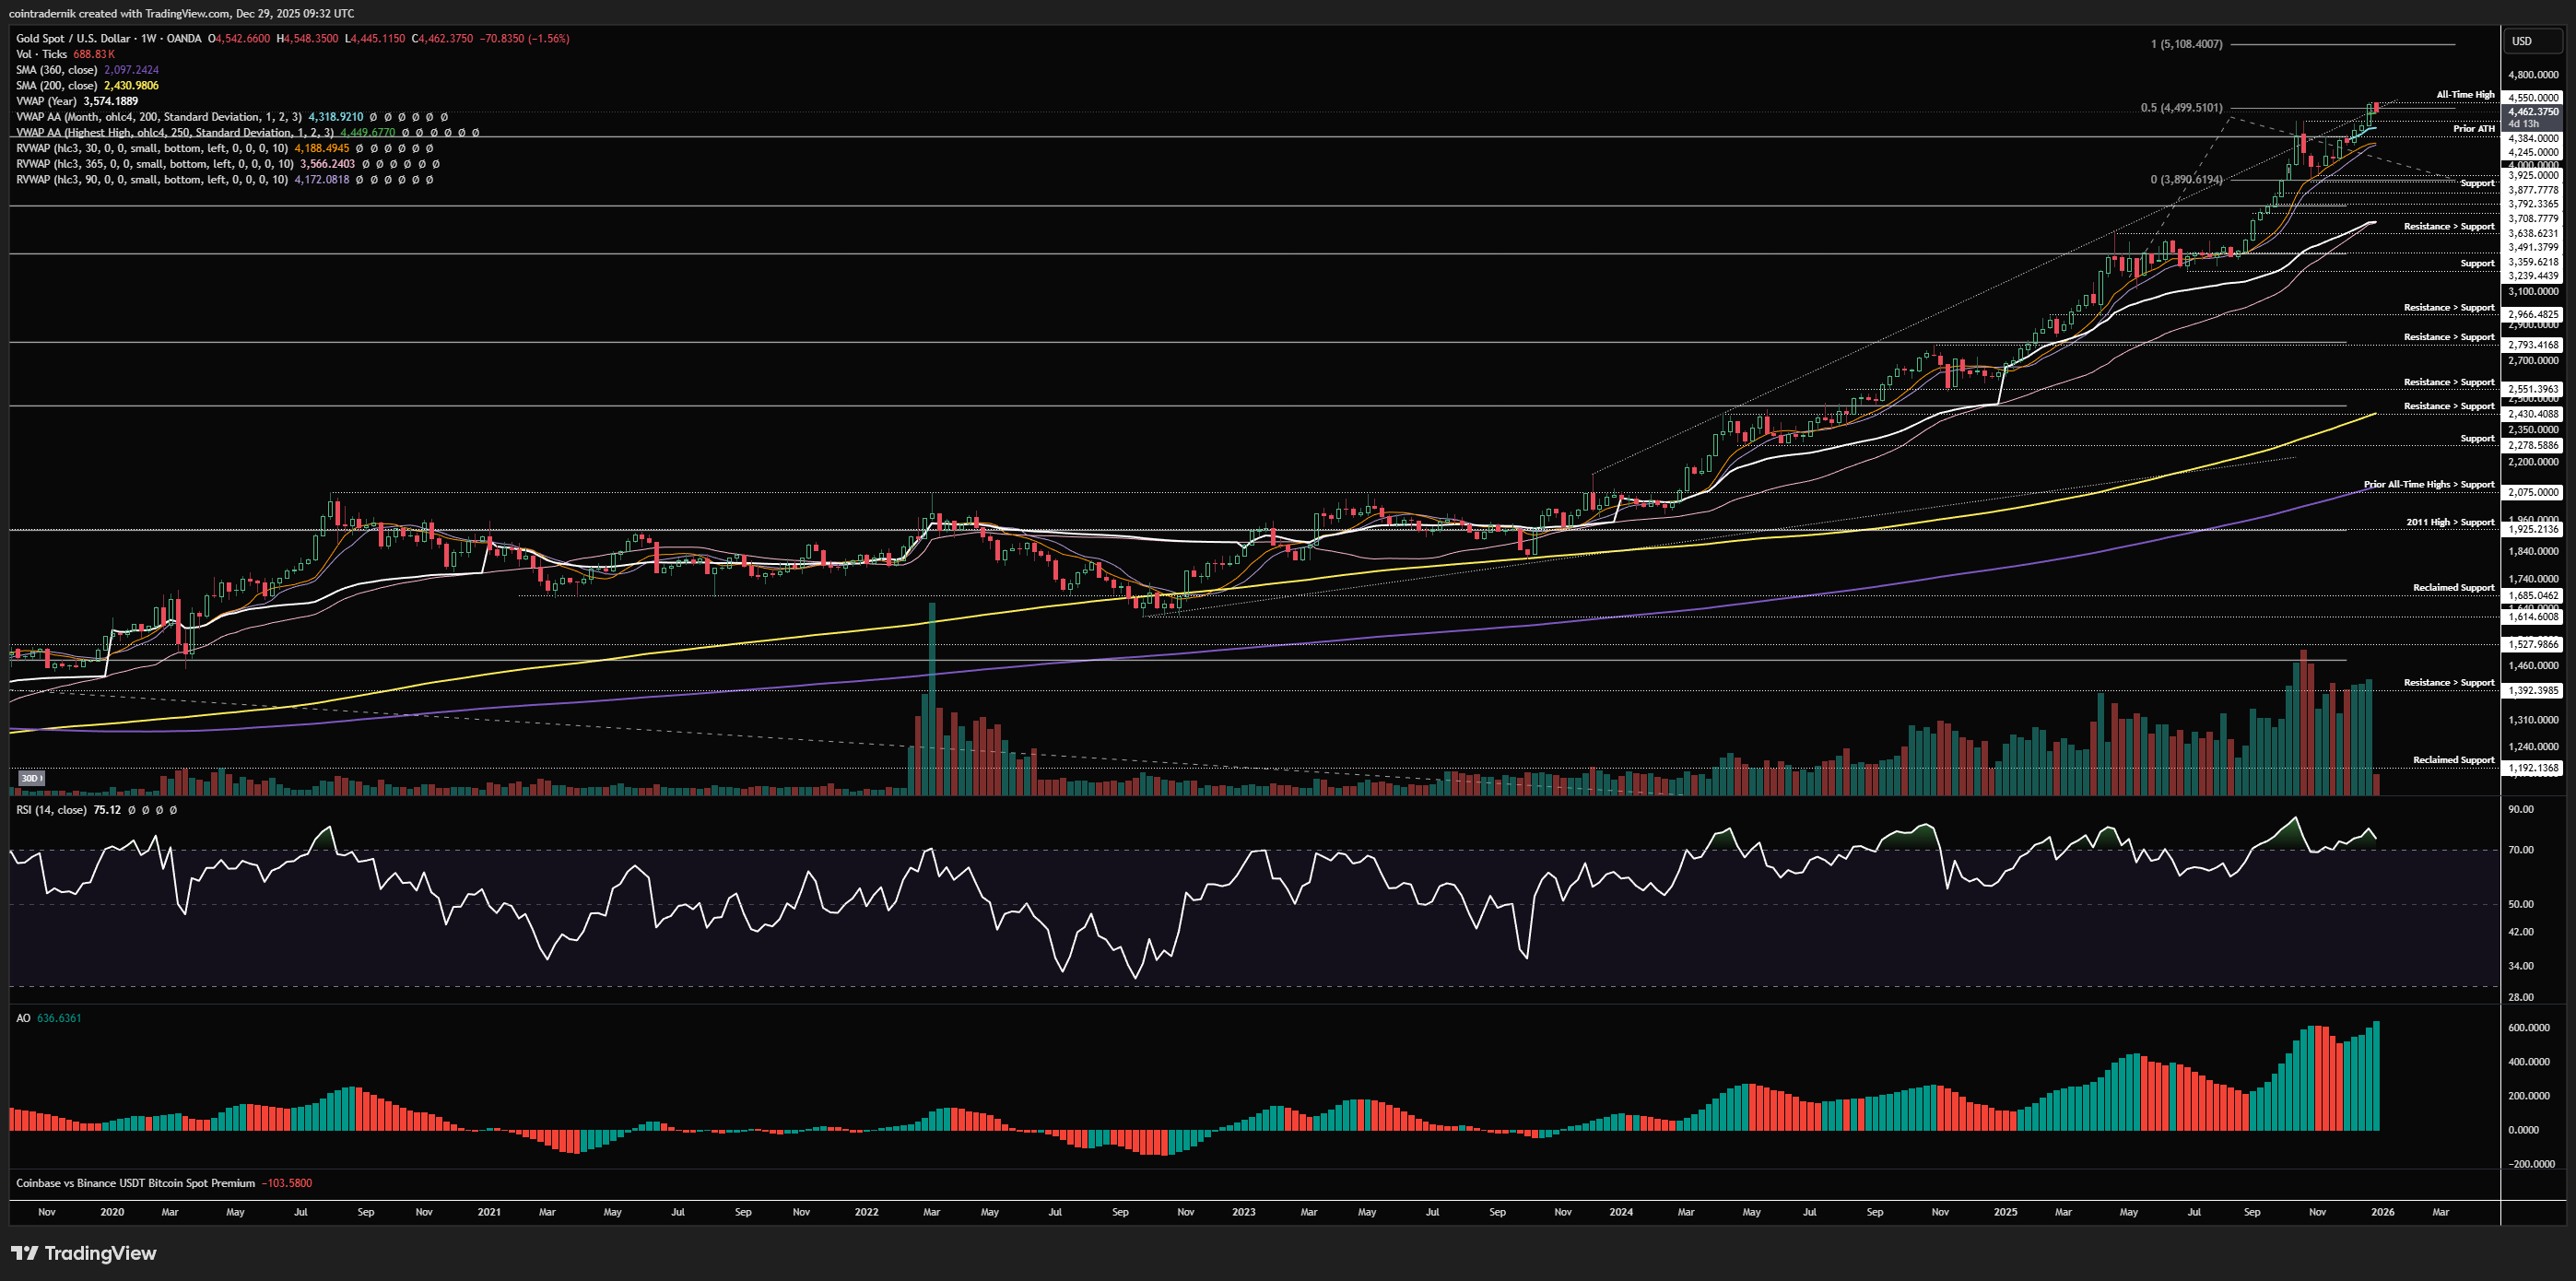
If we begin by looking at the weekly for Gold, we can see that price ripped through all-time highs after grinding right around that $4400 level for a couple of weeks, with last week's metal mania seeing Gold push firmly above $4500 into $4550, closing the week a little shy of that, Weekly momentum is still bullish for now, but weakness here in price-action after fresh highs could feasibly put in some major trend exhaustion into January, so that is something to be aware of. Whilst structure looks the way it does and whilst we have just closed at all-time highs, we should expect pullbacks to be bought, with prior highs at $4400 likely to find a bid in early Jan should we retest it. If we hold that level, I think Gold keeps ripping higher over the coming weeks towards the massive $5000 level, again likely to fall short and likely where a lot of profit-taking takes place depending on the speed of the move towards there. If, however, we fail to hold $4400 as support and break and close below it, then things look much worse for the mid-term picture on Gold, where you would have a failed breakout above a key high with weekly trend exhaustion, and that could be an early sign of a multi-month top. A lot to play for and to pay attention to in precious metals world in January.
Daily:
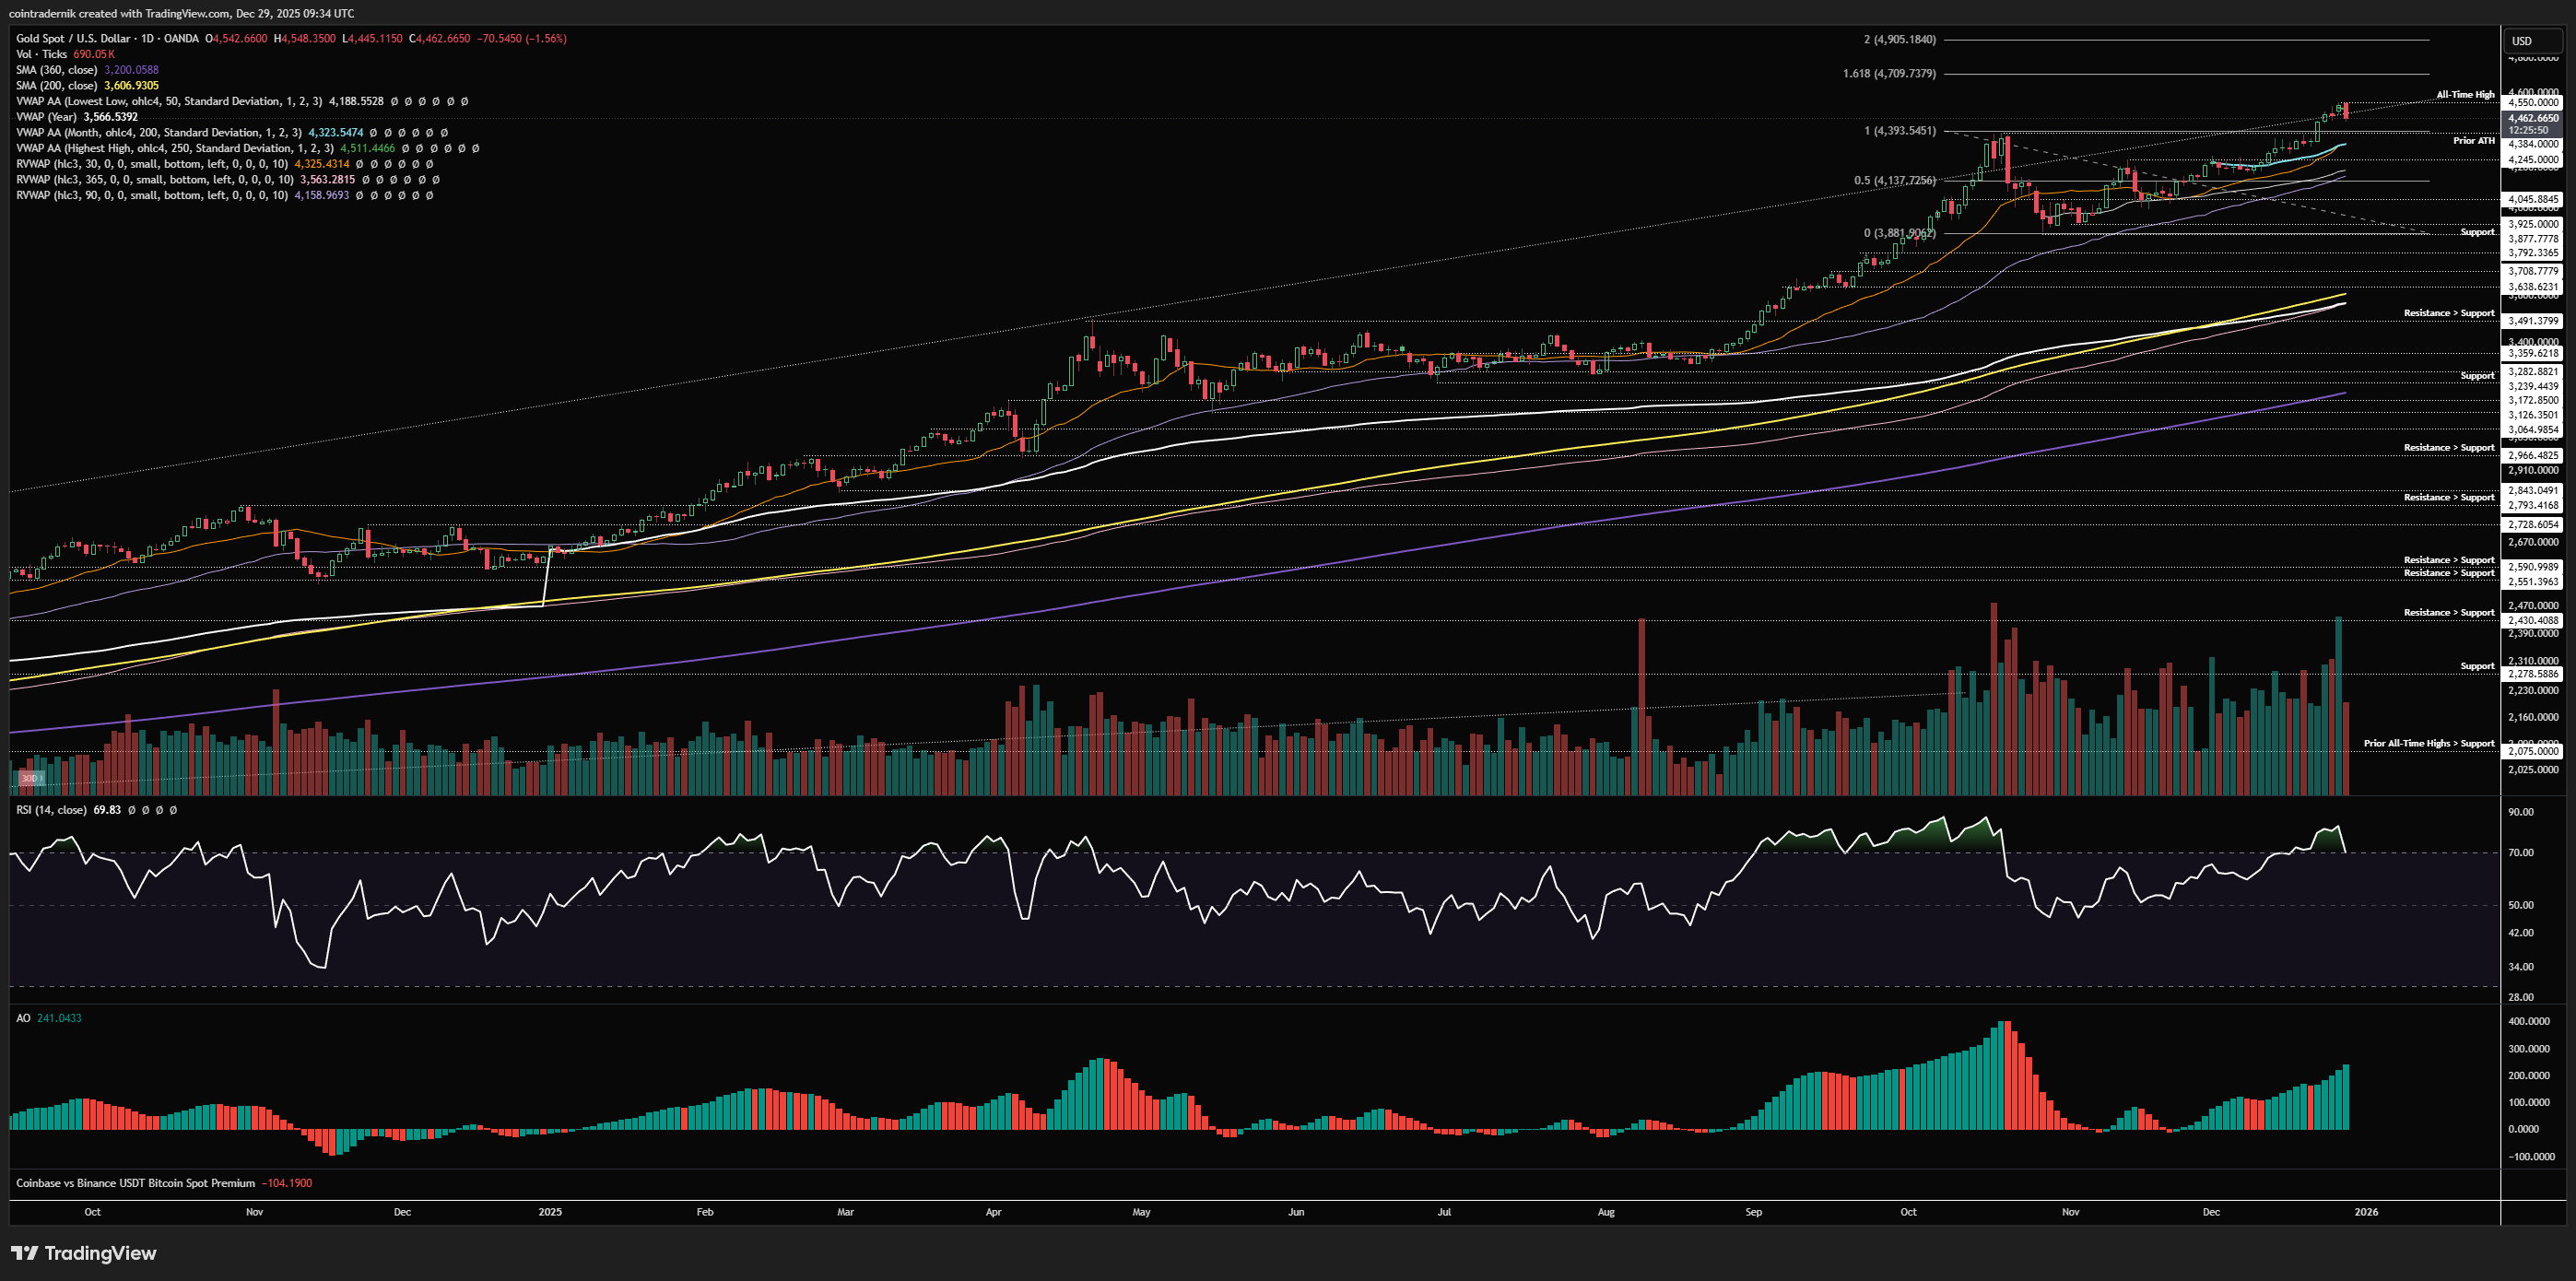
Finally, looking at the daily, we can see that price has rejected early this week, trapping some late longs into the madness last week, with Gold down to $4460 this morning. If we do flush lower this week, I think the confluence of the Dec VWAP, 30d rolling VWAP and prior highs between $4330-$4380 would be a nice place to ladder bids on the first test of that zone as support, where if we start to close below $4330 on the daily and form lower-highs below $4400 we have a pretty nice setup to bail and flip to a short bias with a clean invalidation at the all-time high. I'm sure this next couple of weeks is going to bring some fireworks for metals...
I hope you've found some value in the read this week!
And if you've not already signed up for Ostium, please do so and test out some of the recent updates, including:
Sign up here (you don't have to use my ref link, of course): https://ostium.app/trade?from=CL&to=USD&ref=CTNIK

.avif)