

Market Outlook #59
November 10, 2025
-
12
min read


This blog references an opinion and is for entertainment and informational purposes only. It is not intended to be investment advice. Seek a duly licensed professional for investment advice.
In this 59th Market Outlook here at Ostium Research, we'll be taking a look at the week ahead in markets, focusing specifically on price-action, positioning and event risk for Bitcoin, Ethereum, SPX and altcoins via OTHERS.
Firstly, let's take a look at the calendar, which is heavy on the speeches but with some key inflation and growth data into the end of the week:
MONDAY: VARIOUS FED SPEECHES
TUESDAY: ECB PRESIDENT LAGARDE SPEECH
TUESDAY: US ADP EMPLOYMENT CHANGE: (CONSENSUS N/A VS PREVIOUS 14.25K)
WEDNESDAY: VARIOUS FED SPEECHES
THURSDAY: US CONSUMER PRICE INDEX (MOM) (OCT): (CONSENSUS 0.2% VS PREVIOUS 0.3%)
THURSDAY: US CONSUMER PRICE INDEX EX FOOD & ENERGY (MOM) (OCT): (CONSENSUS 0.3% VS PREVIOUS 0.2%)
THURSDAY: US INITIAL JOBLESS CLAIMS: (CONSENSUS 227K VS PREVIOUS 218K)
THURSDAY: VARIOUS FED SPEECHES
FRIDAY: US PRODUCER PRICE INDEX EX FOOD & ENERGY (YOY) (OCT): (CONSENSUS N/A VS PREVIOUS 2.8%)
FRIDAY: US RETAIL SALES (MOM) (OCT): (CONSENSUS 0.4% VS PREVIOUS 0.6%)
Now, let's dig into asset-specific price-action for the week ahead, looking firstly at Bitcoin:
Price: $106,398
Weekly:
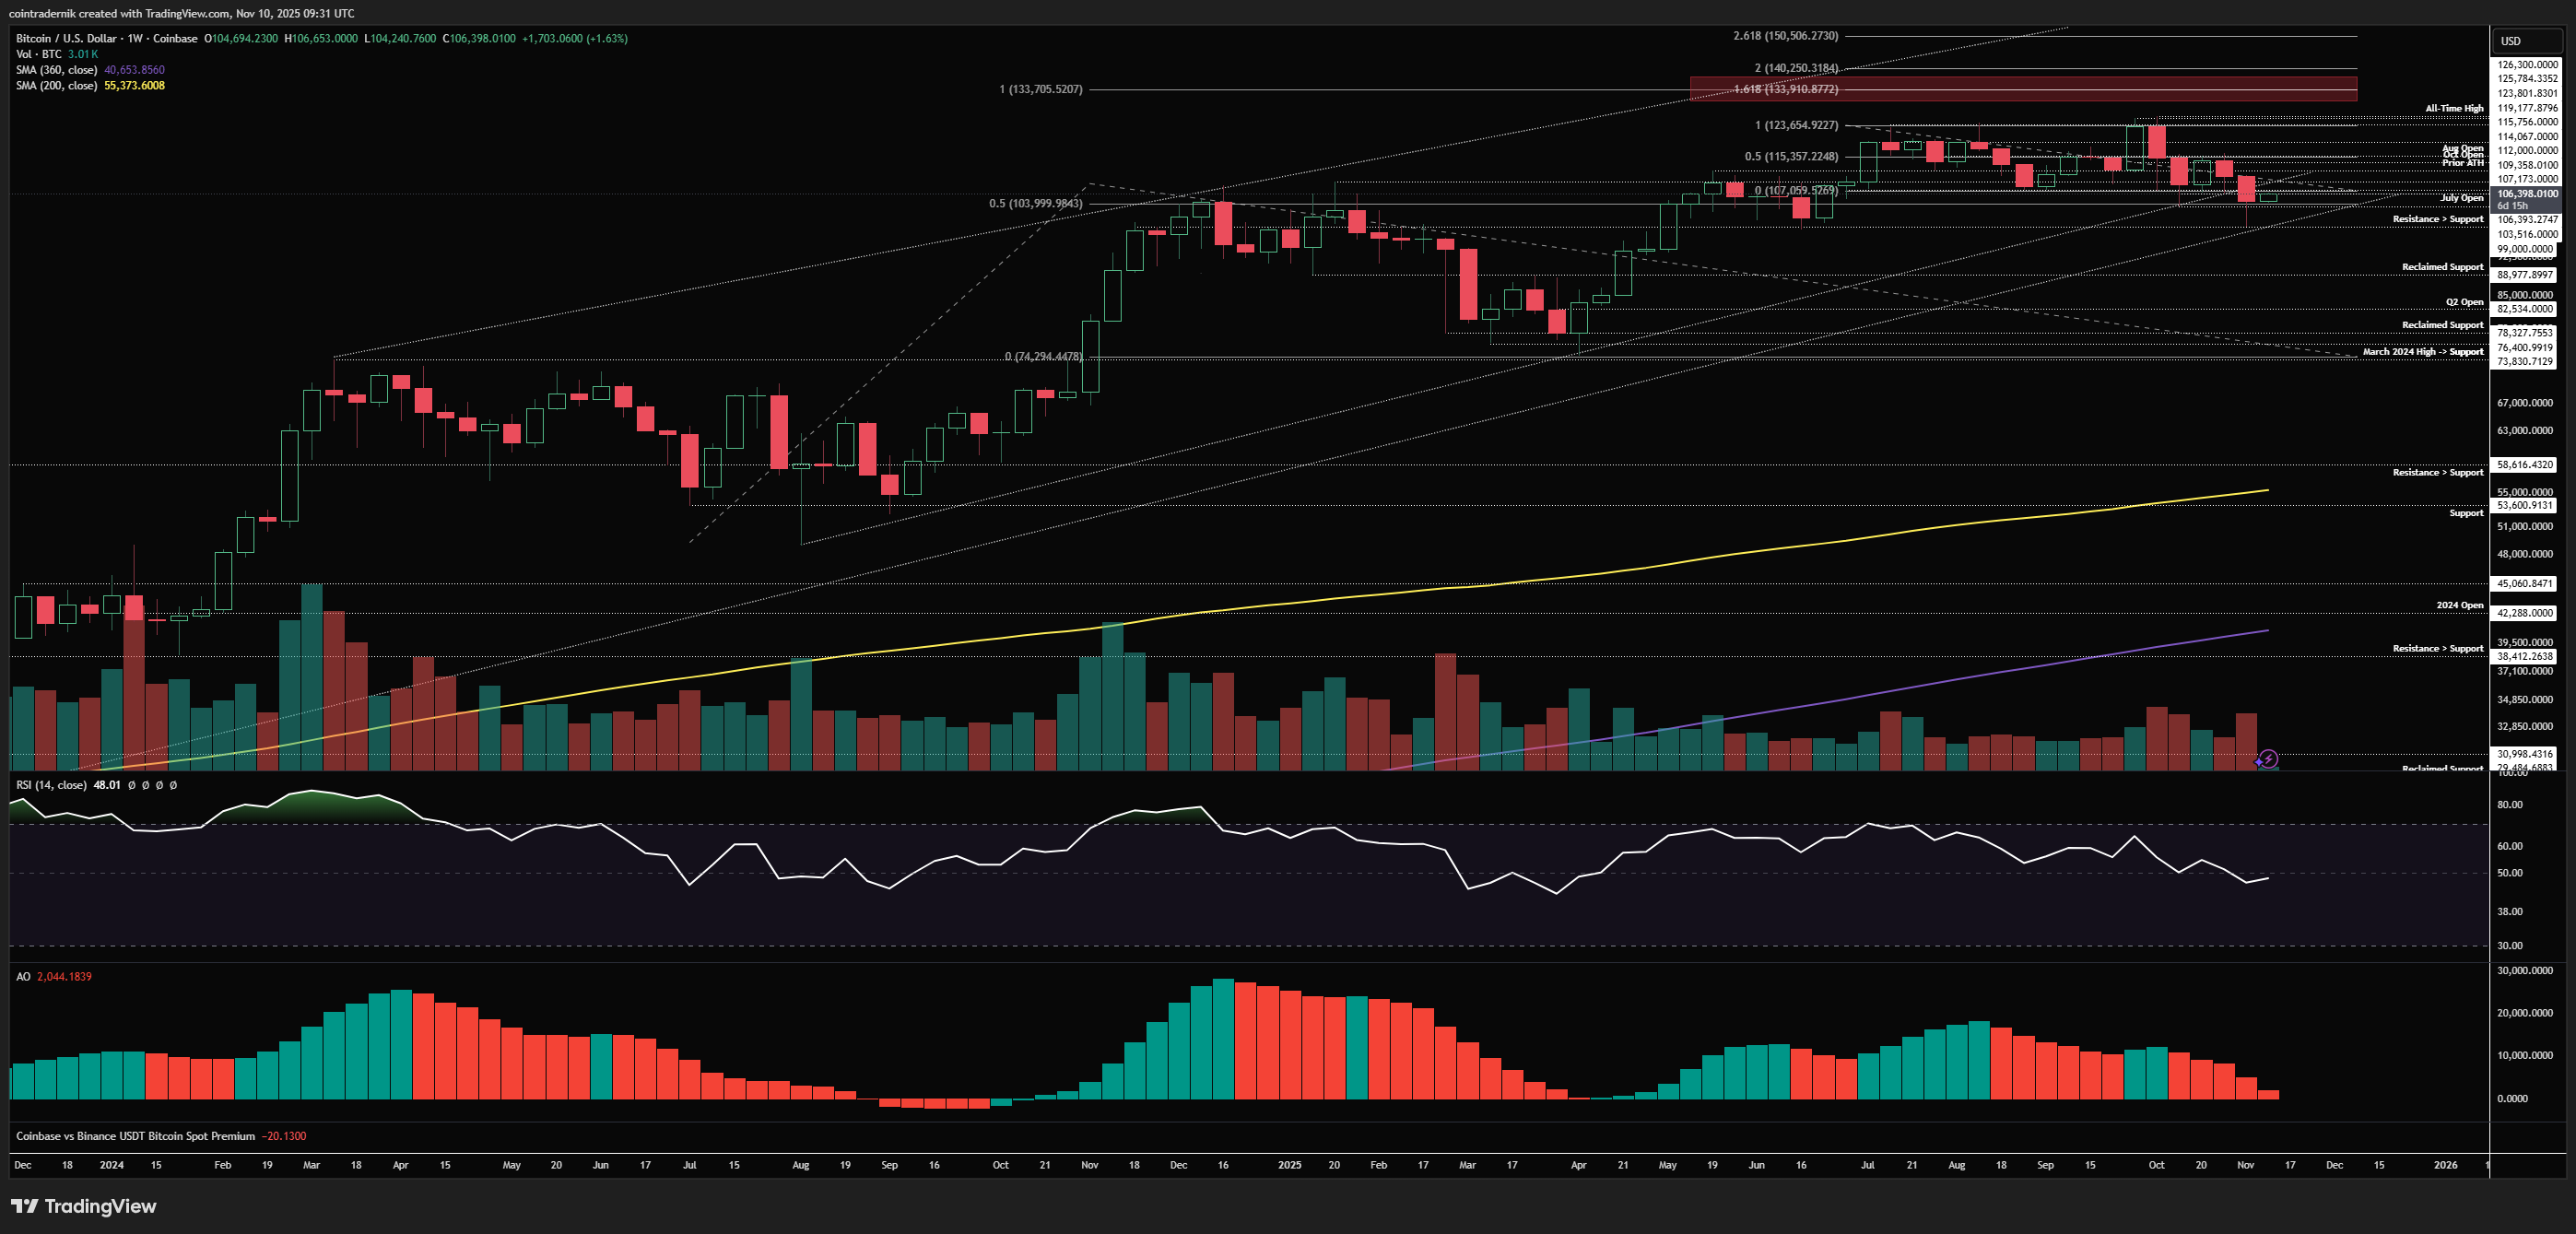
If we begin by looking at the weekly for BTC/USD, last week saw price reject right off that weekly open and sell off below the recent low at $103.5k into the major support cluster at $99k that I mentioned I really wanted to see hold if tested. Despite the shaky start to the week, price did find demand in that area and pushed higher to close the week at $104.7k, which is still below the recent range support at $107k. What I want to see now is that weekly low protected a proper bear trap below range lows should be, with price closing this week back above $107k as reclaimed support. Ideally, we want to see a low form early this week and price to actually push above last week's high into the weekly close, at which point I will be more confident that the Nov low has formed. If, instead, we reject below last week's high this week and close this week below $104k, I would be exiting my levered long from $111k at a partial loss rather than waiting for $94k to be tagged for the full loss. I would then be looking for a deviation below the yearly open at $93kish for the next area to look for longs, or re-entering higher as the structure improves. For now, we found demand at the most important zone and bounced, so I am currently viewing this as the formation of the spring below the range that sends BTC back to range highs later this month. I do not want to be levered long if $100k is flipped into resistance on the lower timeframe (and would not be awaiting a weekly close to make any decisions) as I think the trap door on a move back below that demand would be severe.
Daily:
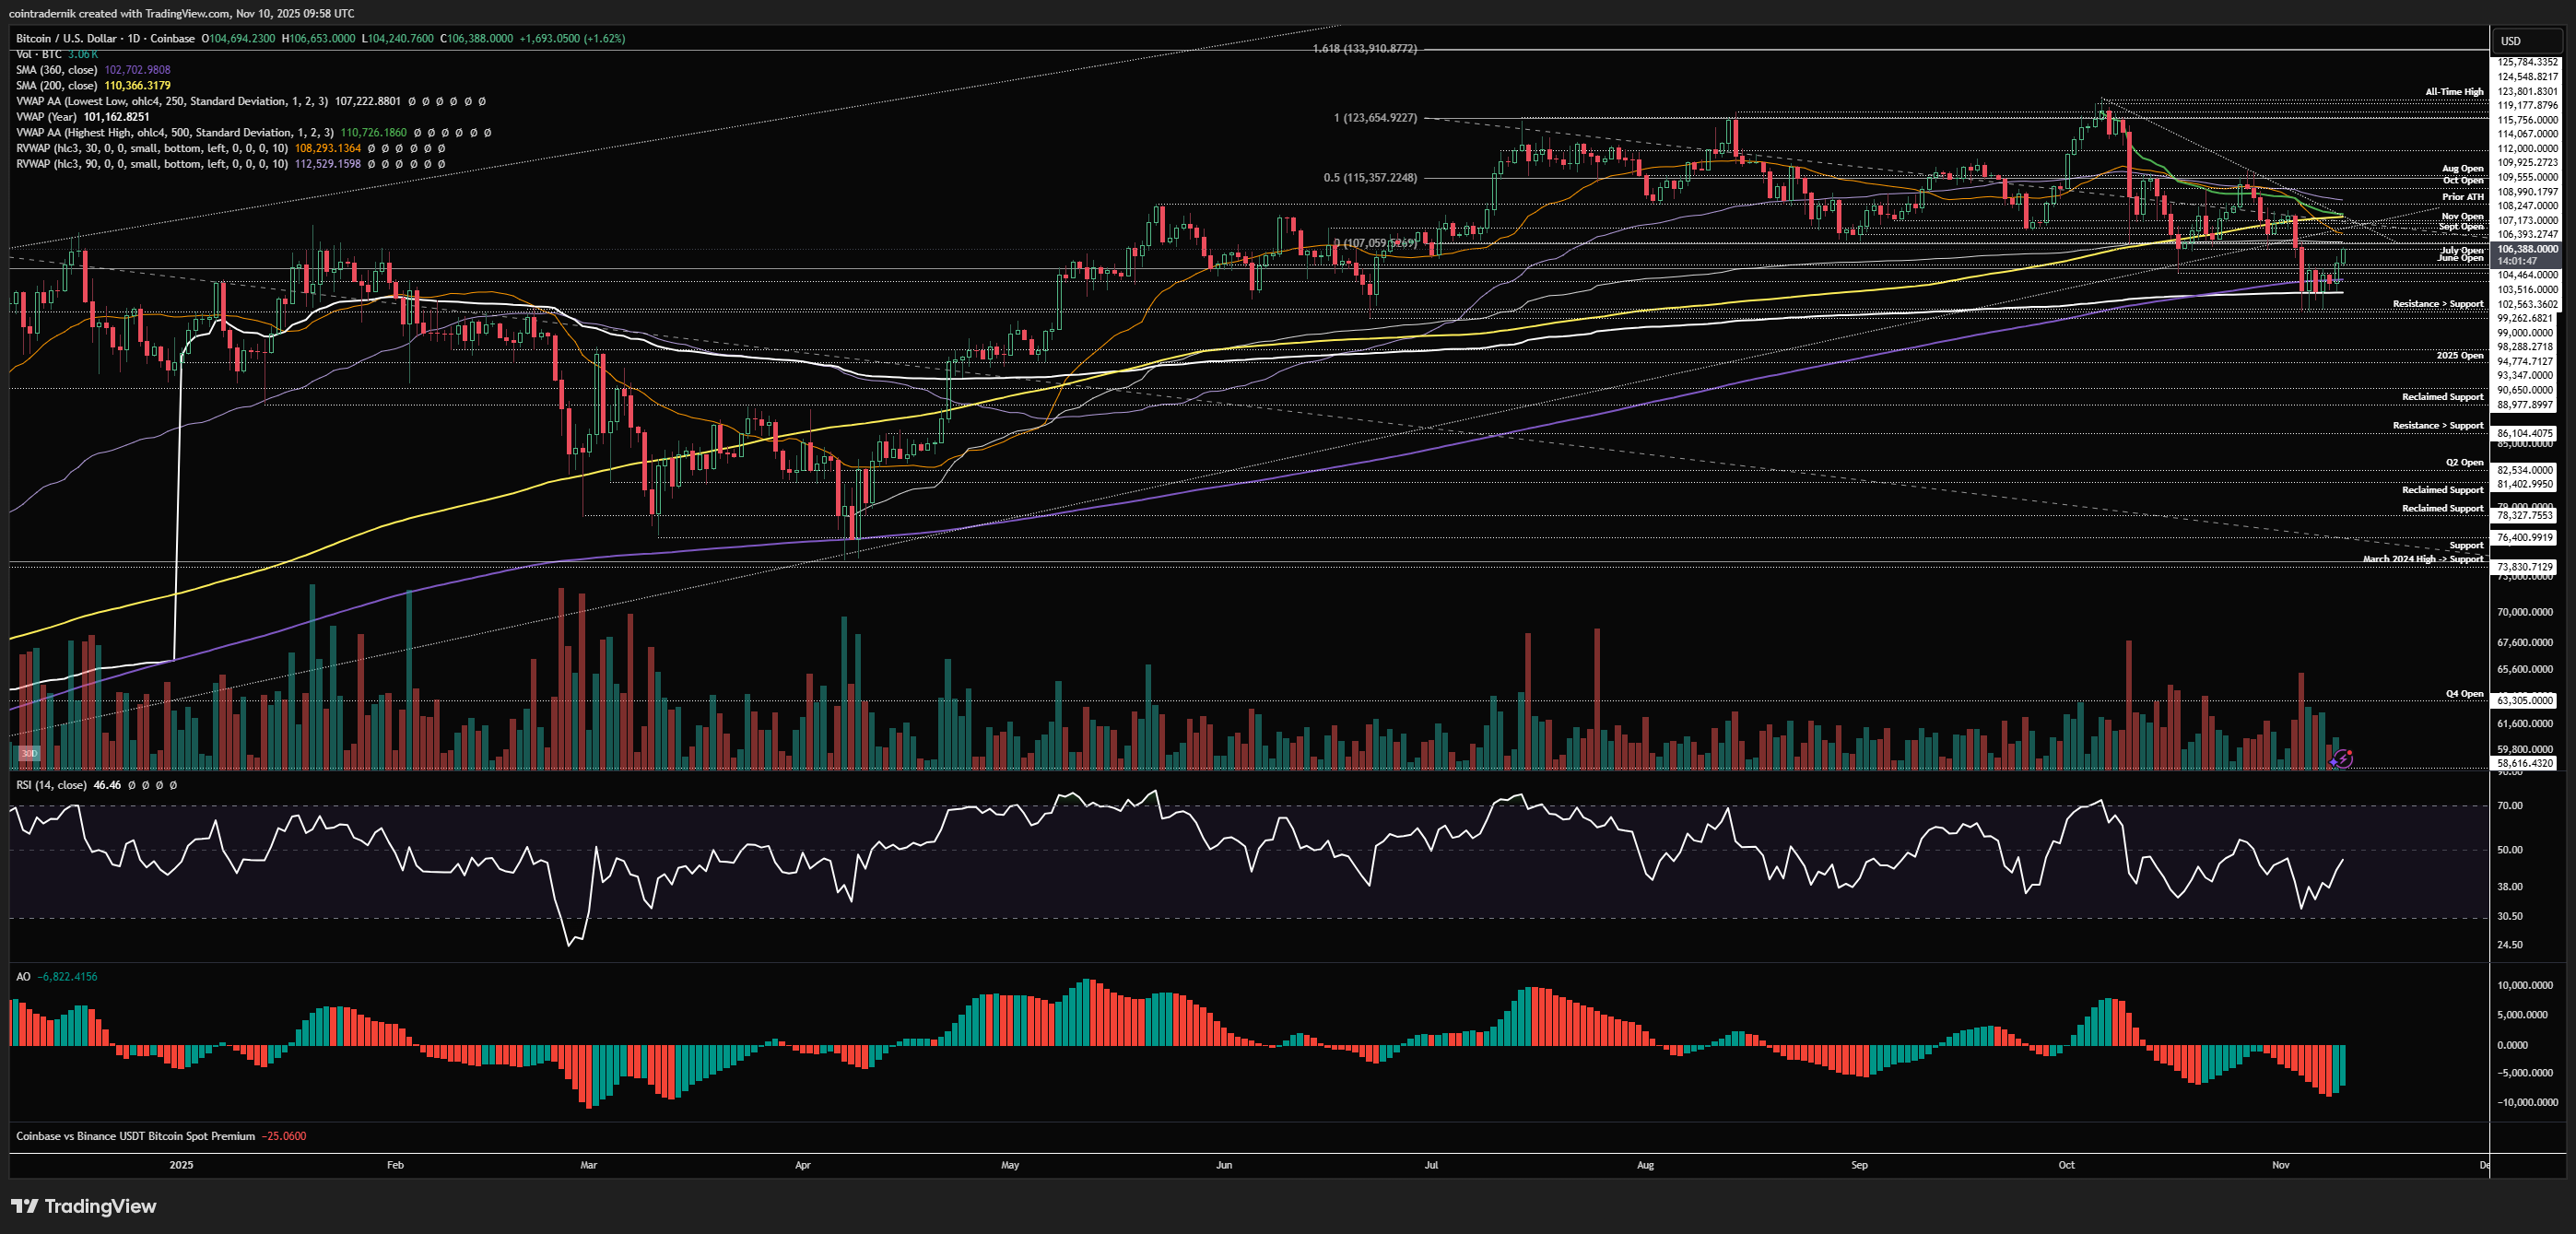
Looking at the daily, we can see that we have bearish structure following the daily close below ~$106.4k, though I did mention a couple of times that whilst $116k was capping price and we could not close the daily above it that structure was very grey and not particularly bullish. Now we have clear bearish structure and I would want to see that immediately reclaimed if this is a bear trap, which would see a daily close above anchored VWAP from all-time highs, currently at $110.7k. If we get that, we have a higher-high above the high that preceded the break below range support and we should be confident in a higher-low forming subsequent to that. If, instead, we push higher early this week, reject at that cluster of resistance around the Nov open and then close the daily back below the weekly open at $104.7k, that would be a pretty clear signal to bail on longs and reassess. If you want to play this short expecting a break below last week's low, that $110k area would be where you look for it.
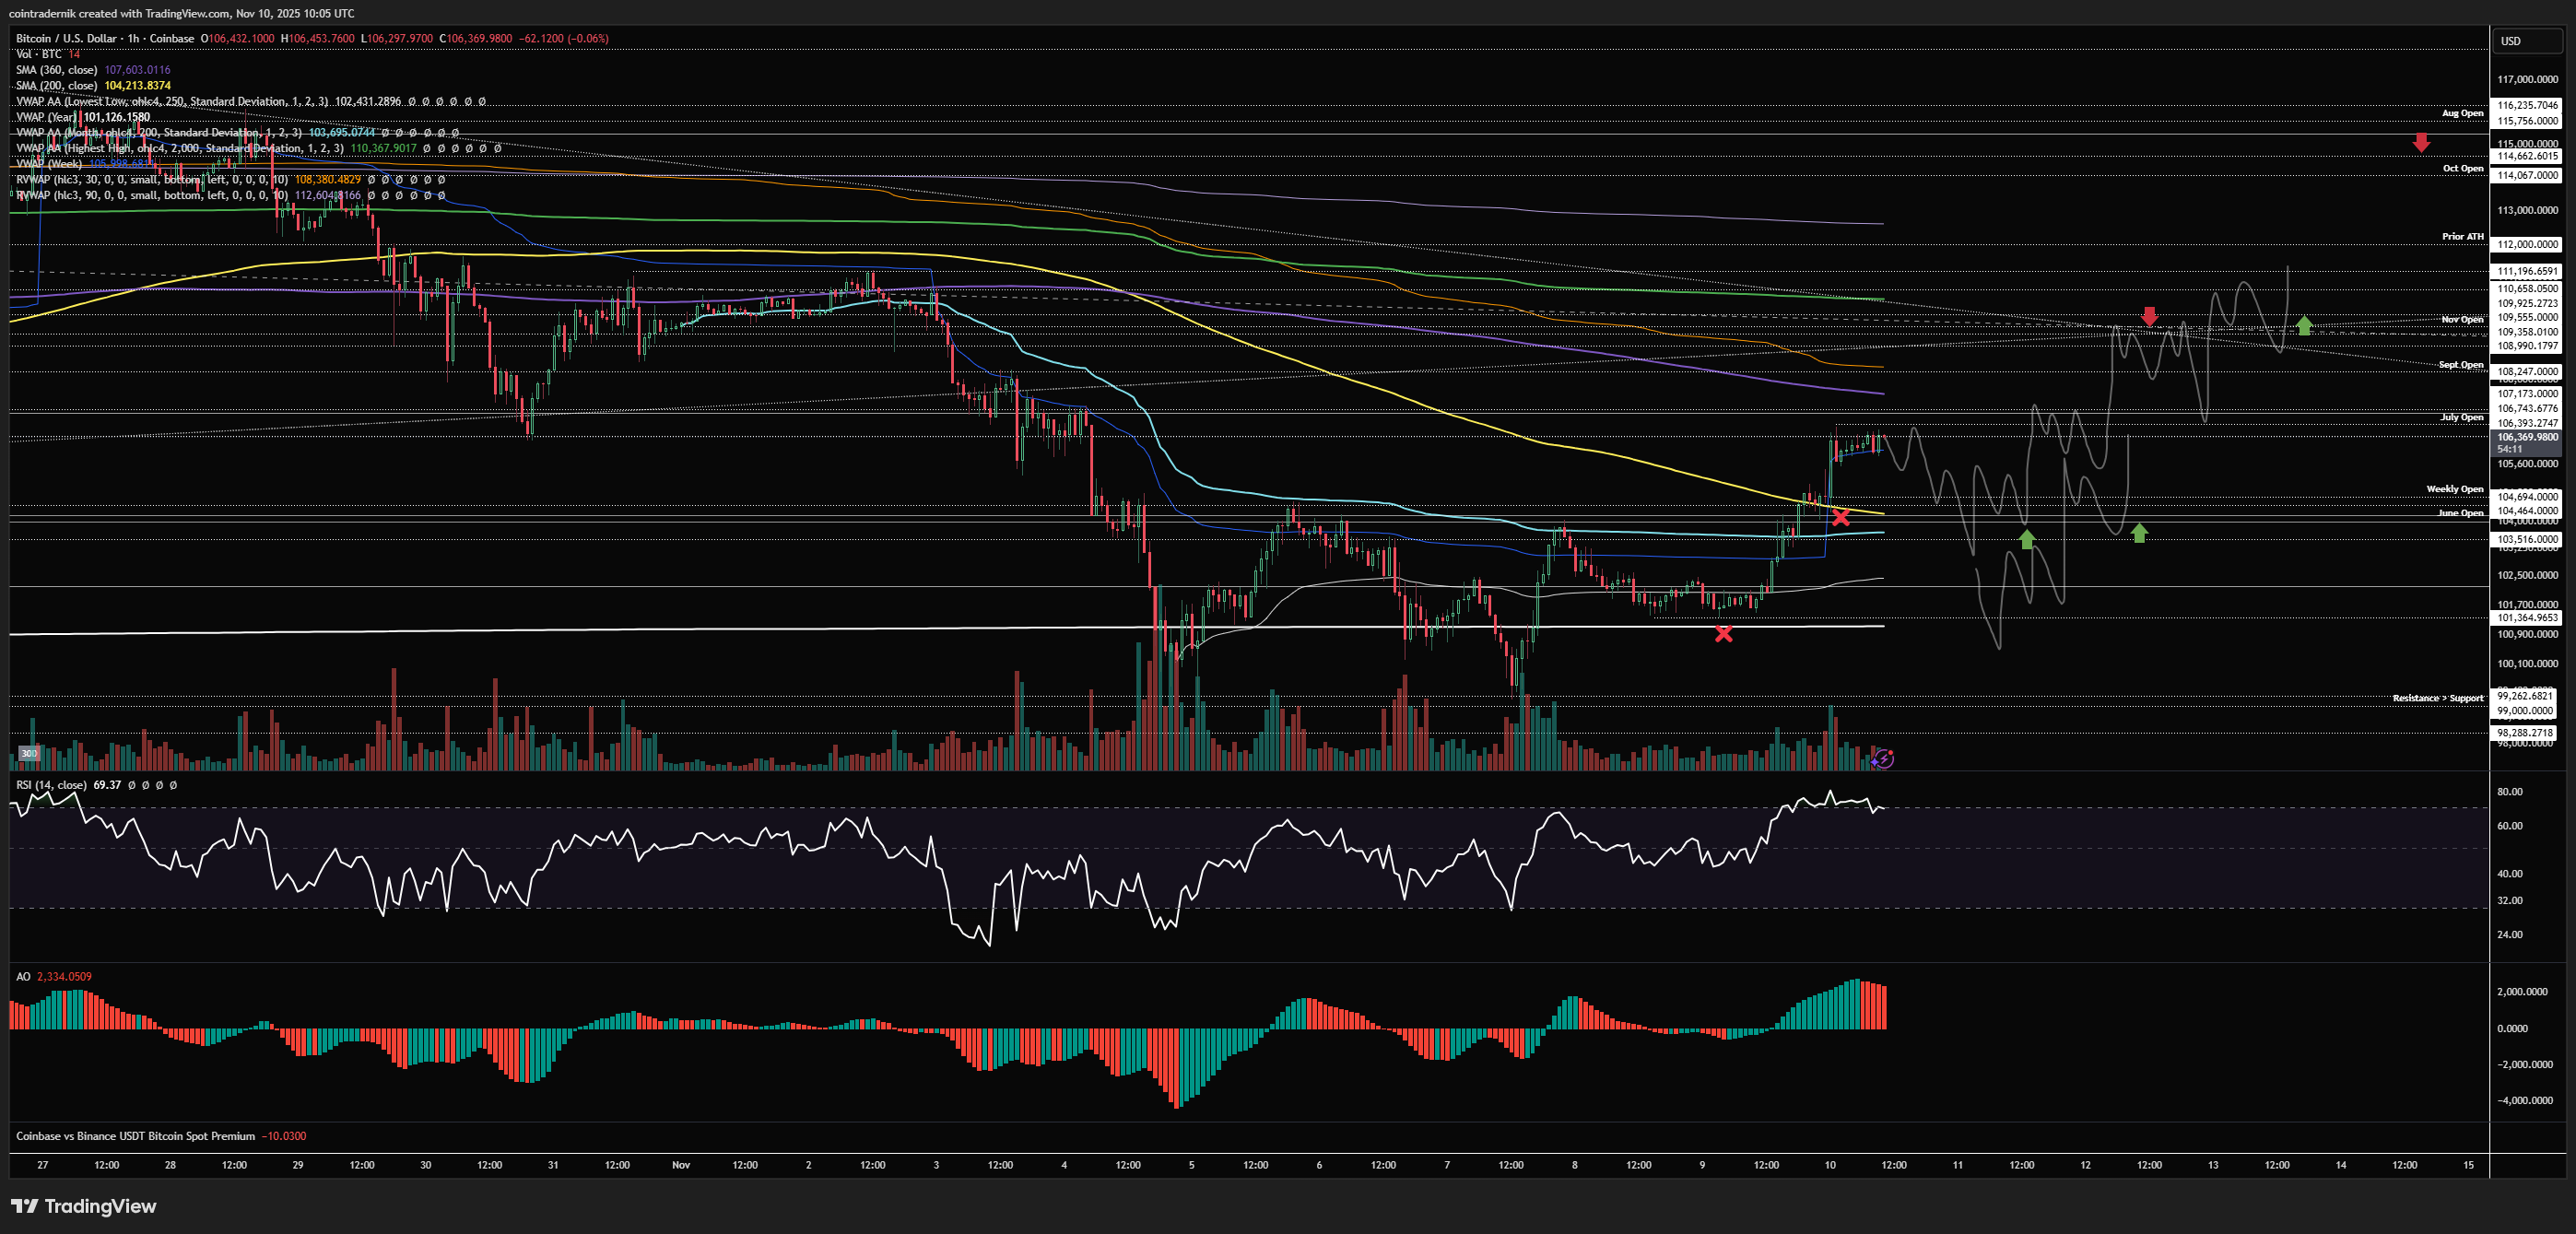
Now, looking at intraweek setups, on the long side you could look for a very early sweep of the weekly open, ideally today or tomorrow (I would not take this after tomorrow), and then bid with an expectation of a run of the Nov highs into trendline resistance and that anchored VWAP - all below $112k - with a view to hedge or derisk there and re-add on acceptance back above that resistance:
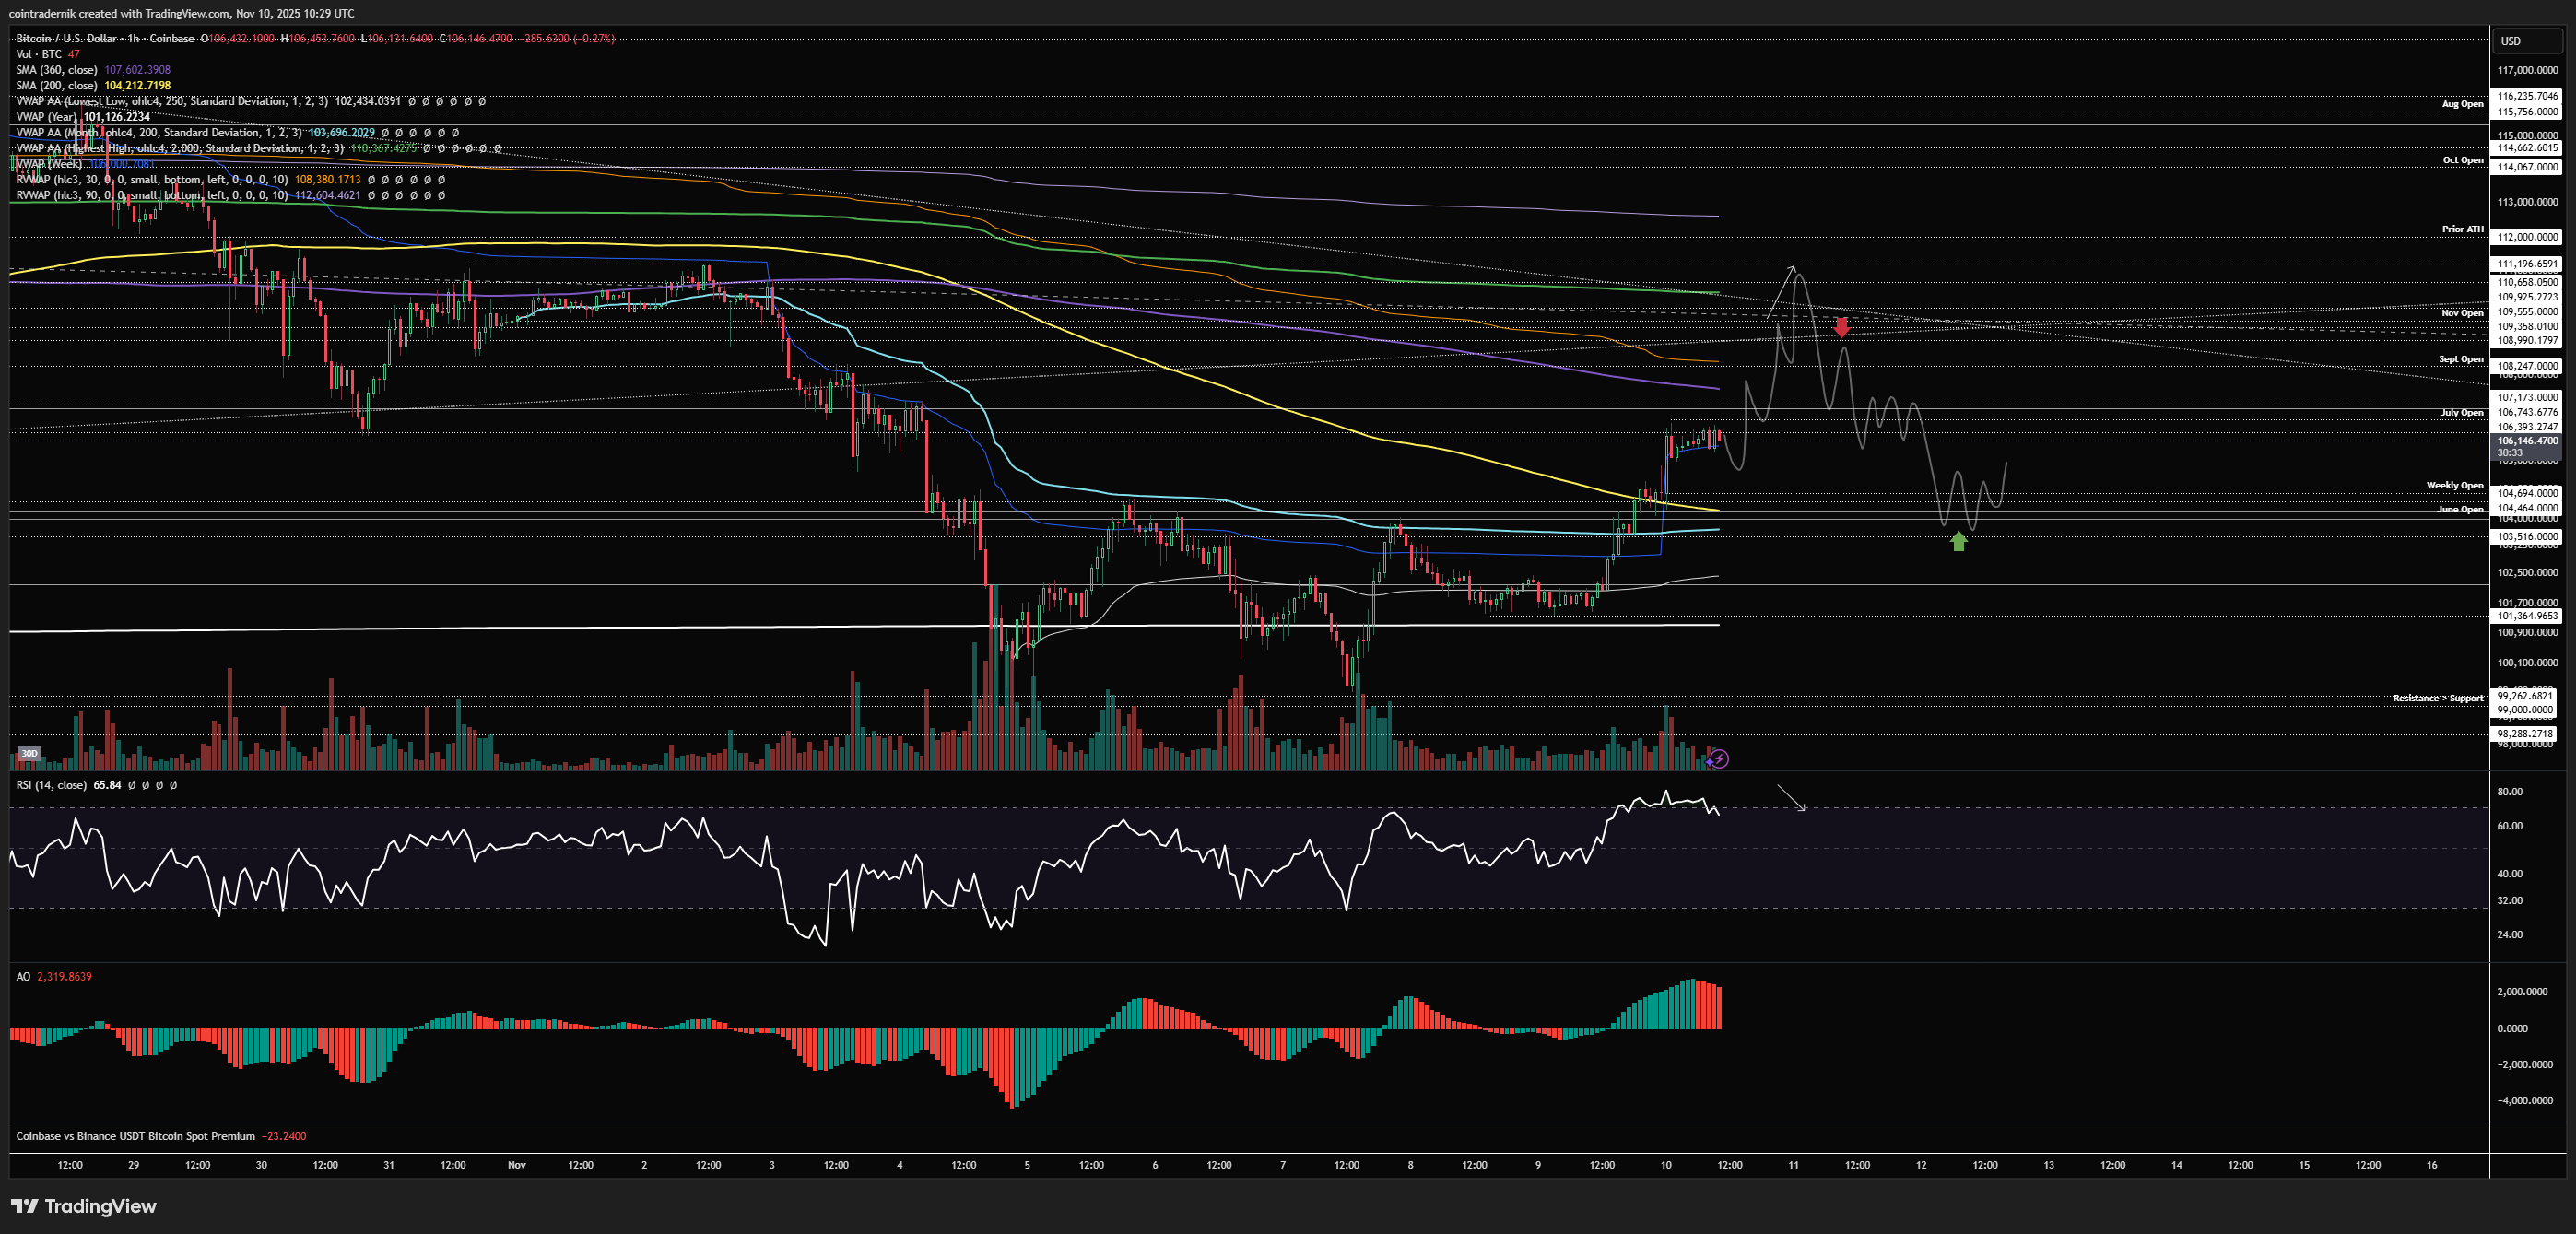
On the short side, you'd be looking for trend exhaustion into trendline resistance and that anchored VWAP and fade it back towards the WO:
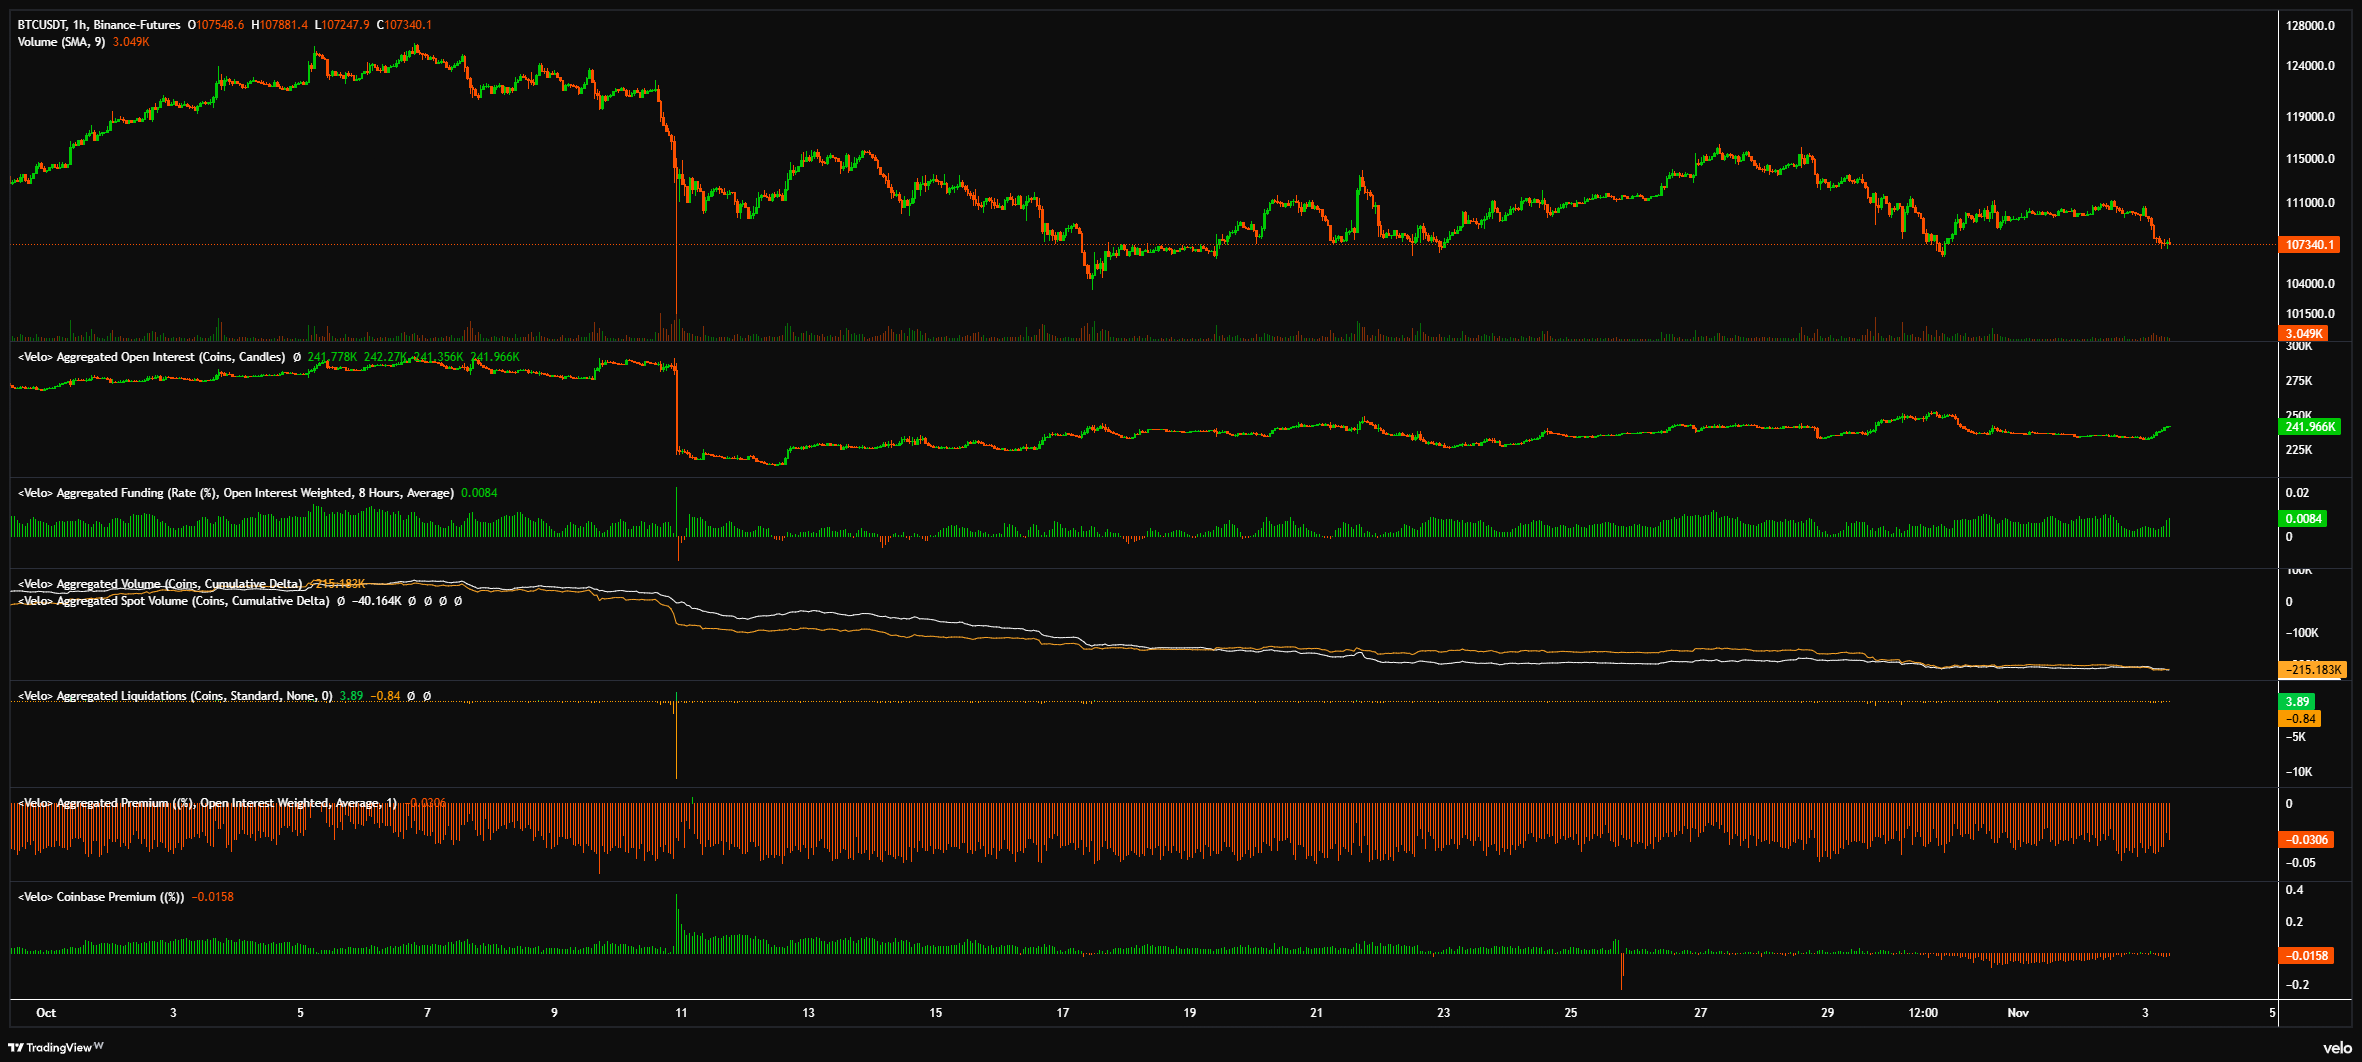
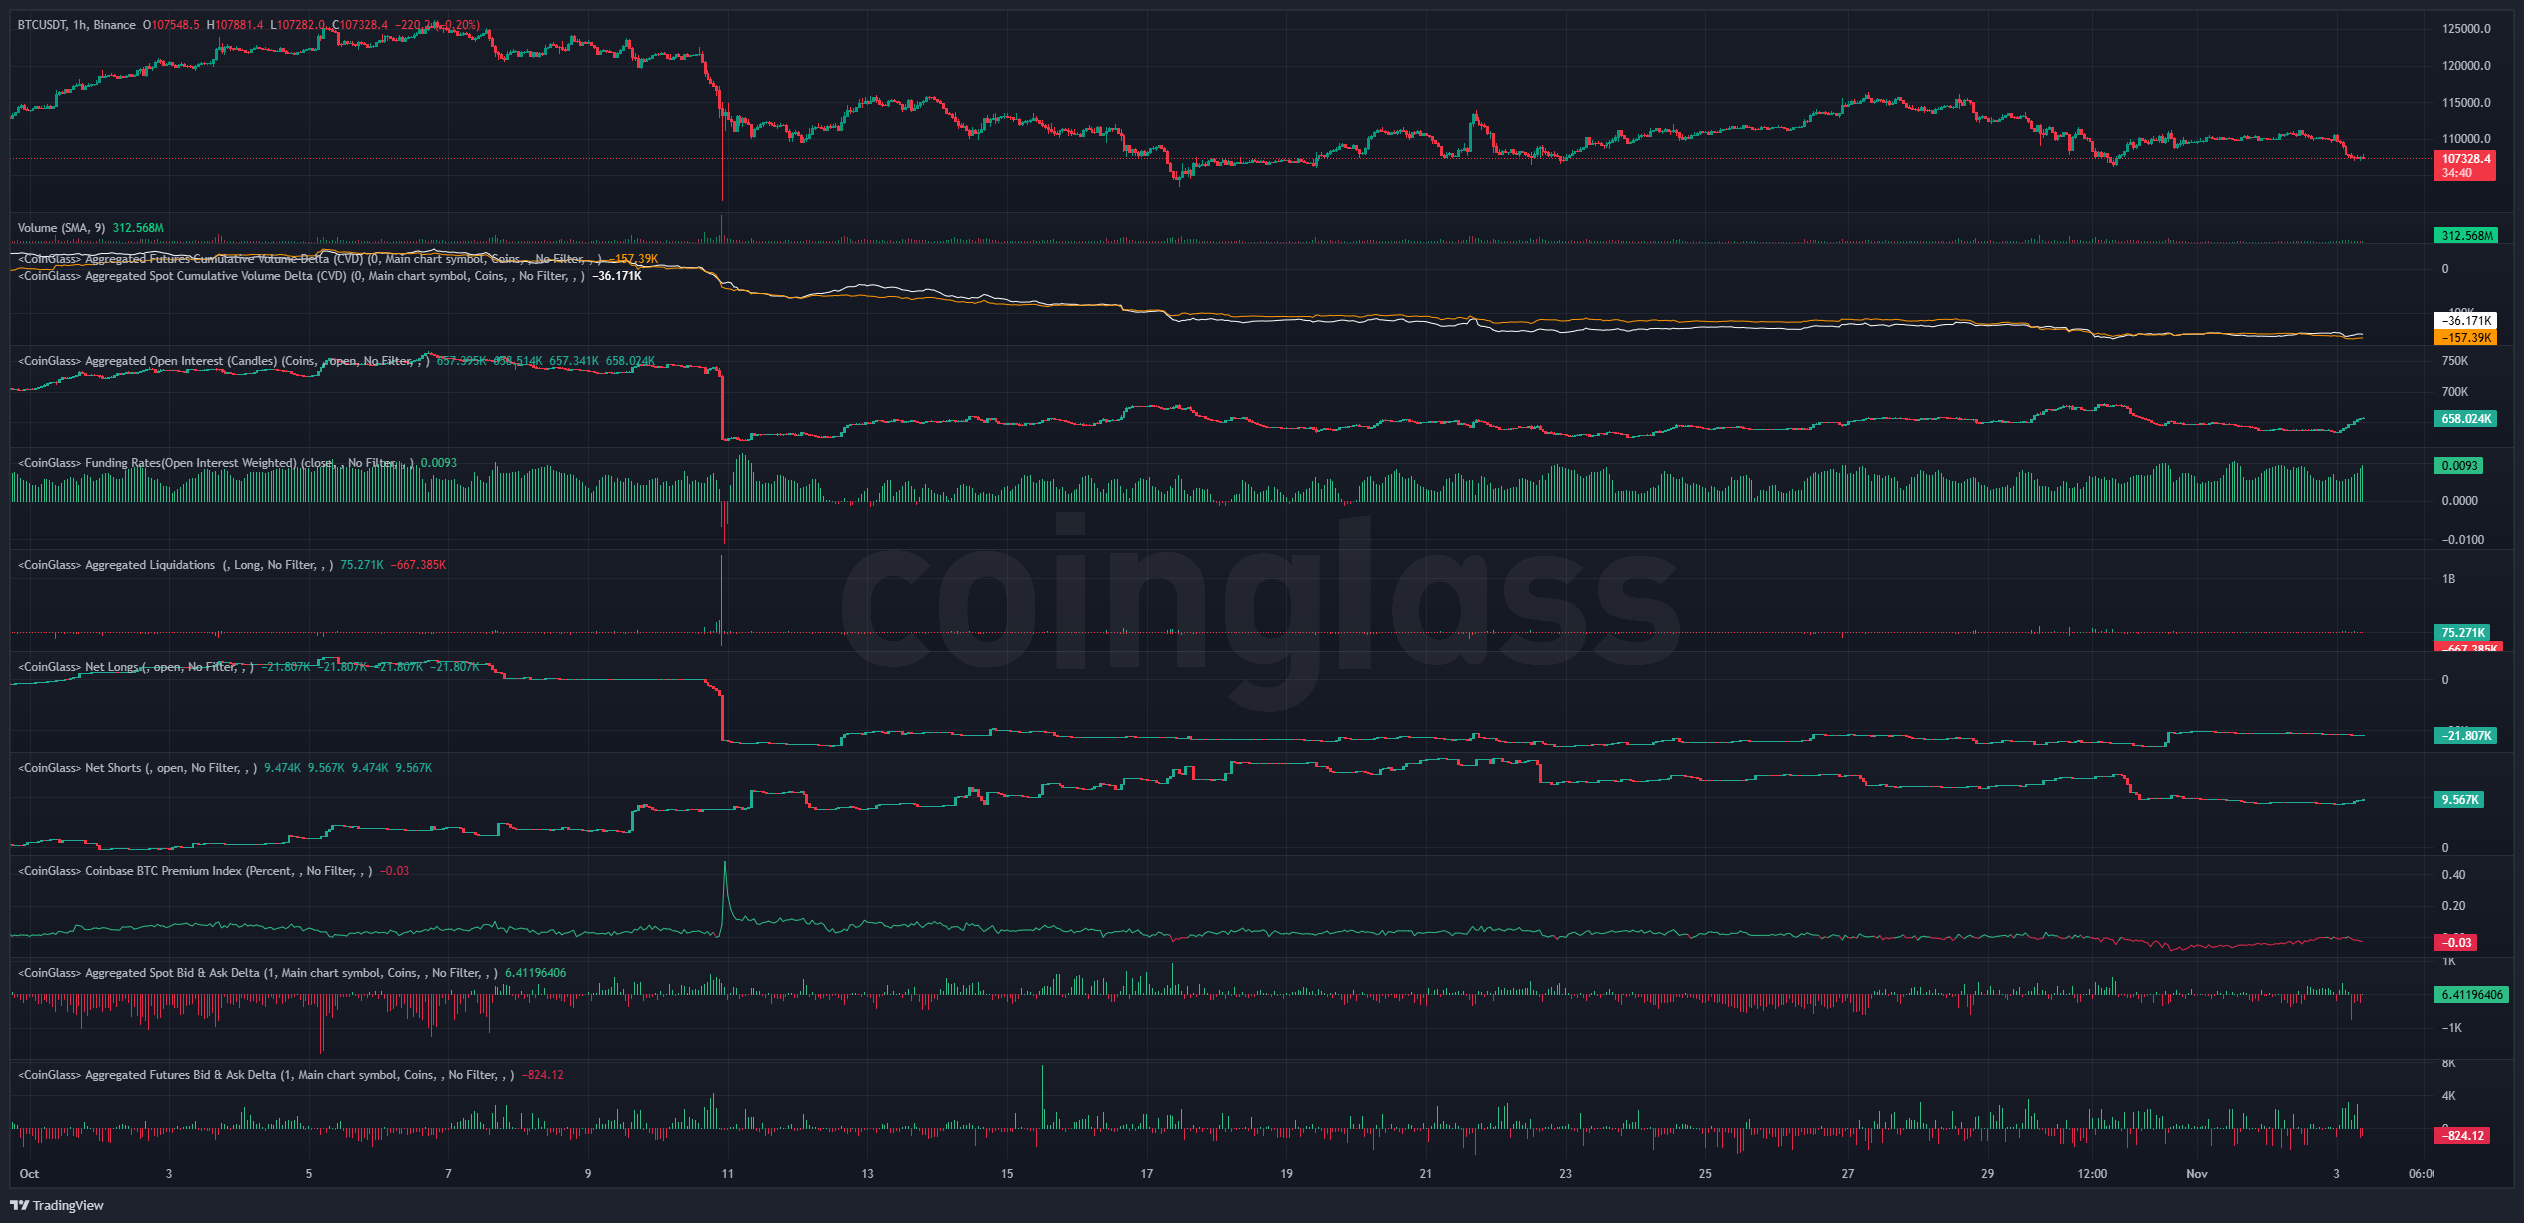
And here's a snapshot of positioning across Velo and CoinGlass:
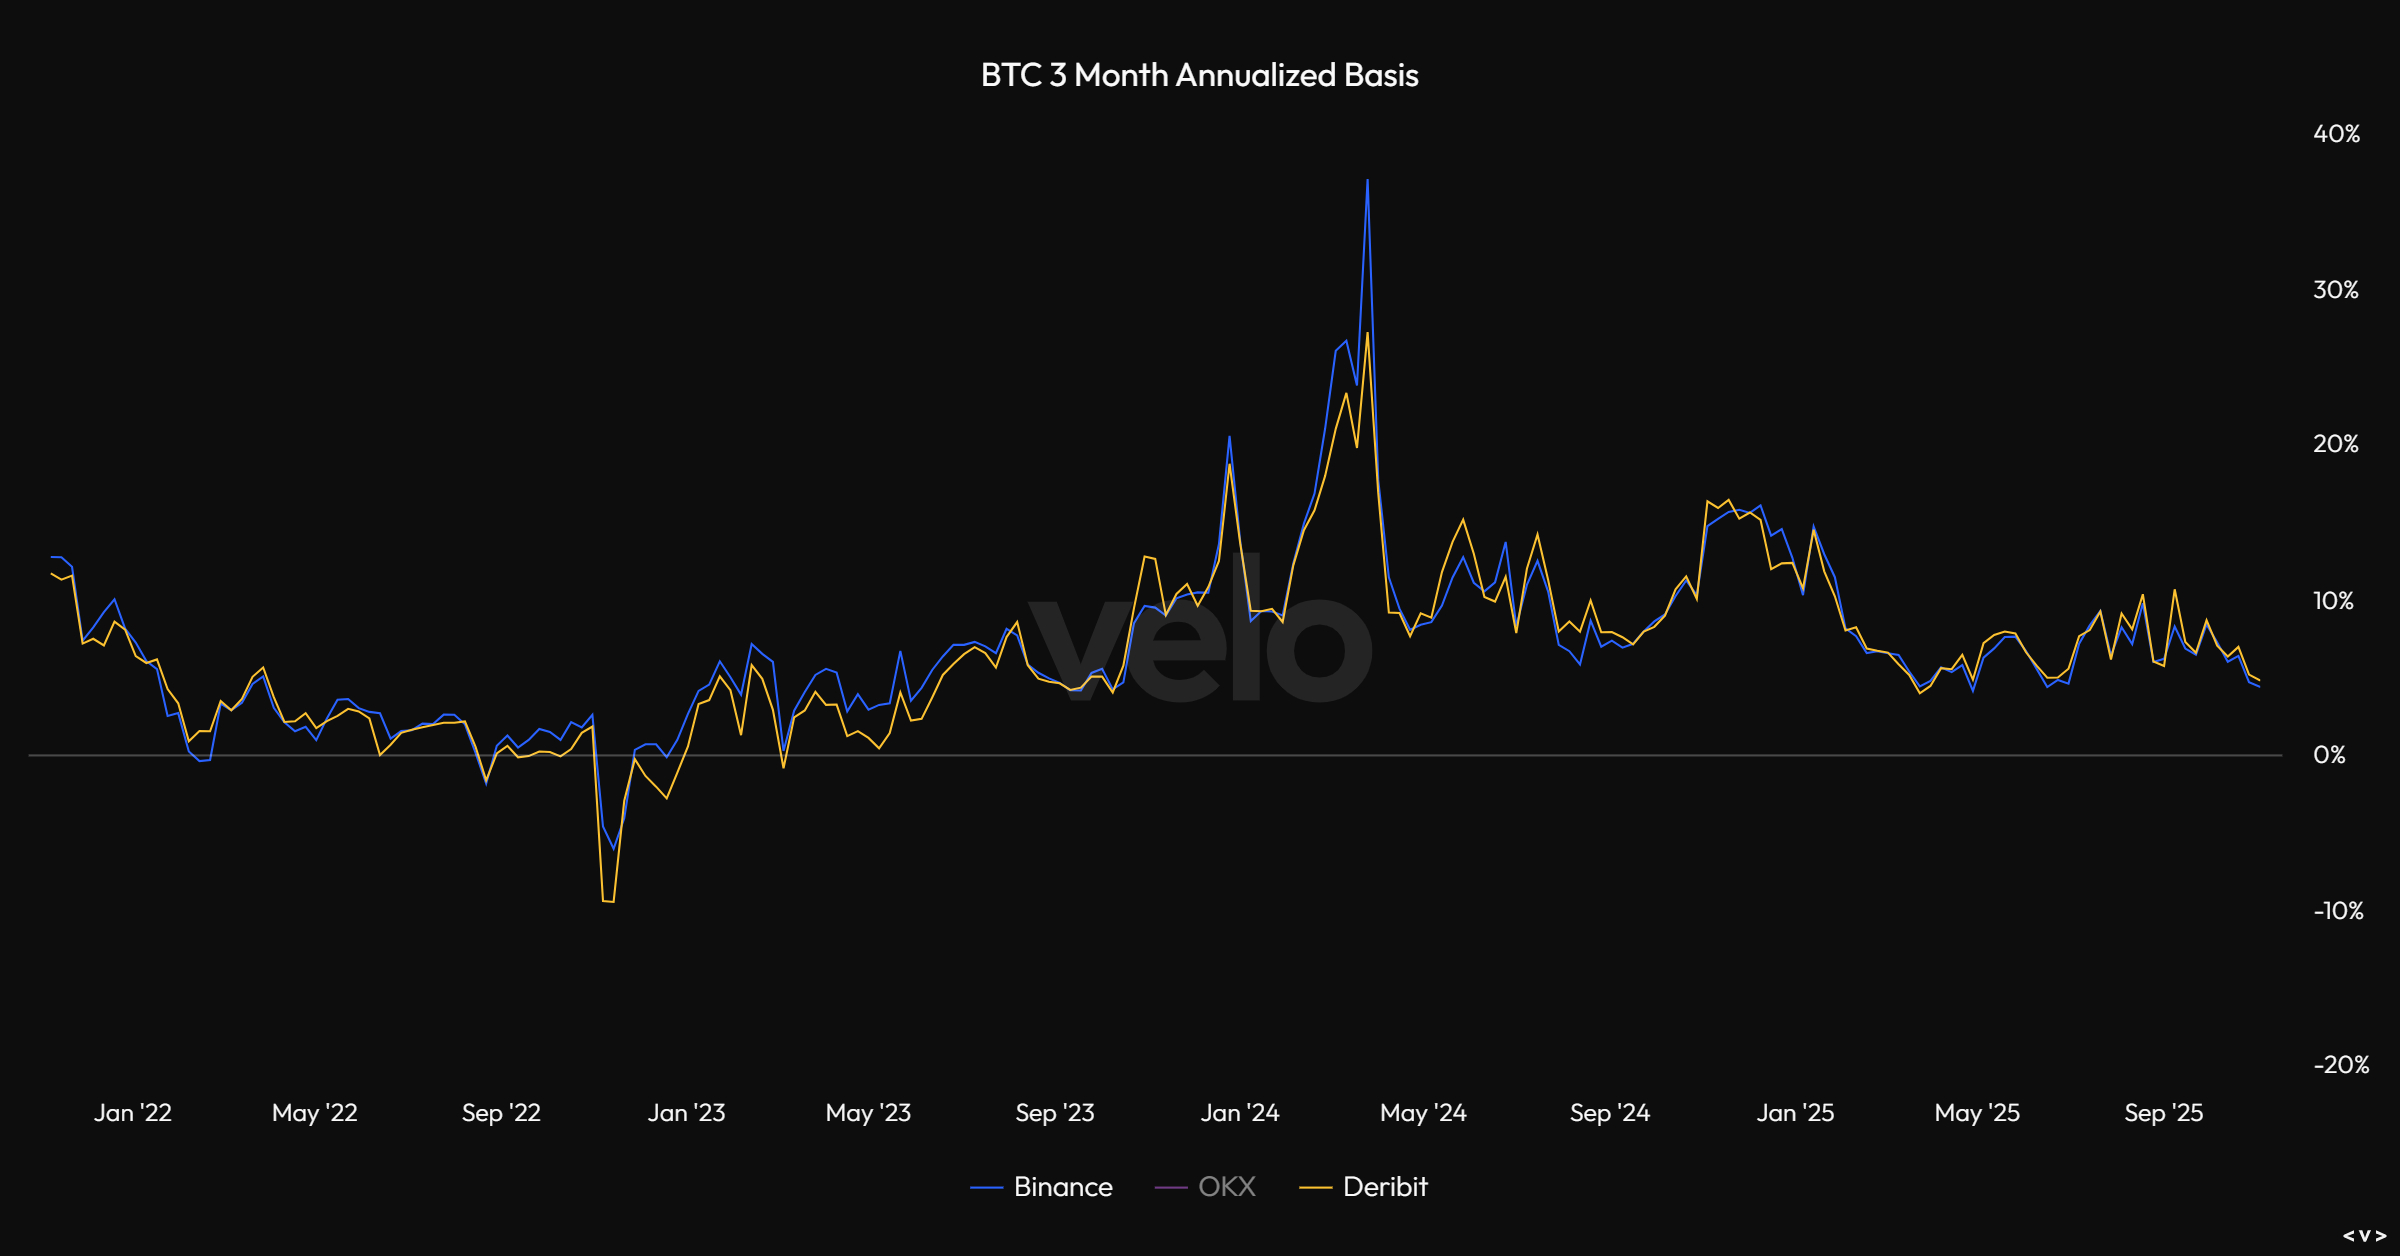
And here's 3-month annualized basis:
And Bitcoin OI vs Altcoin OI:

And finally some of the expected 1-week and 1-month liquidation levels:
-2025-11-03_08_45_04.png)
-2025-11-03_08_46_15.png)
Price: $3608
ETH/USD
Weekly:
Beginning with the weekly for ETH/USD, the rejection at the multi-year pivot around $4093 after weeks of consolidating right around that level led to the more bearish trajectory I had outlined for ETH playing out, with that yearly open finally being swept all the way into $3052 as reclaimed support, with price bouncing and holding above the anchored VWAP from the Liberation Day lows and closing the week nearer $3600. Despite this strong bounce, we have significant overhead resistance to now overcome: the $4093 level is now reclaimed resistance, and above that we have the 30d and 90d rolling VWAP and the anchored VWAP from all-time highs, all below $4400. Meanwhile, if we lose the Liberation Day anchored VWAP (which held as support on the previous range breakdown and acted as a spring in summer), I don't think $3050 holds on a second test and we'd be looking at $2850 as the next key level. If BTC loses $100k, I think it is very likely the yearly open on ETH and that VWAP become resistance and then we have a very very different dynamic into year-end. If, instead, the support holds as it did in summer and this is indeed a bear trap scenario, we should see a sharp bounce off this area and flip $4090 back into support within a couple of weeks. Let's see how things shape up into next week...
Daily:
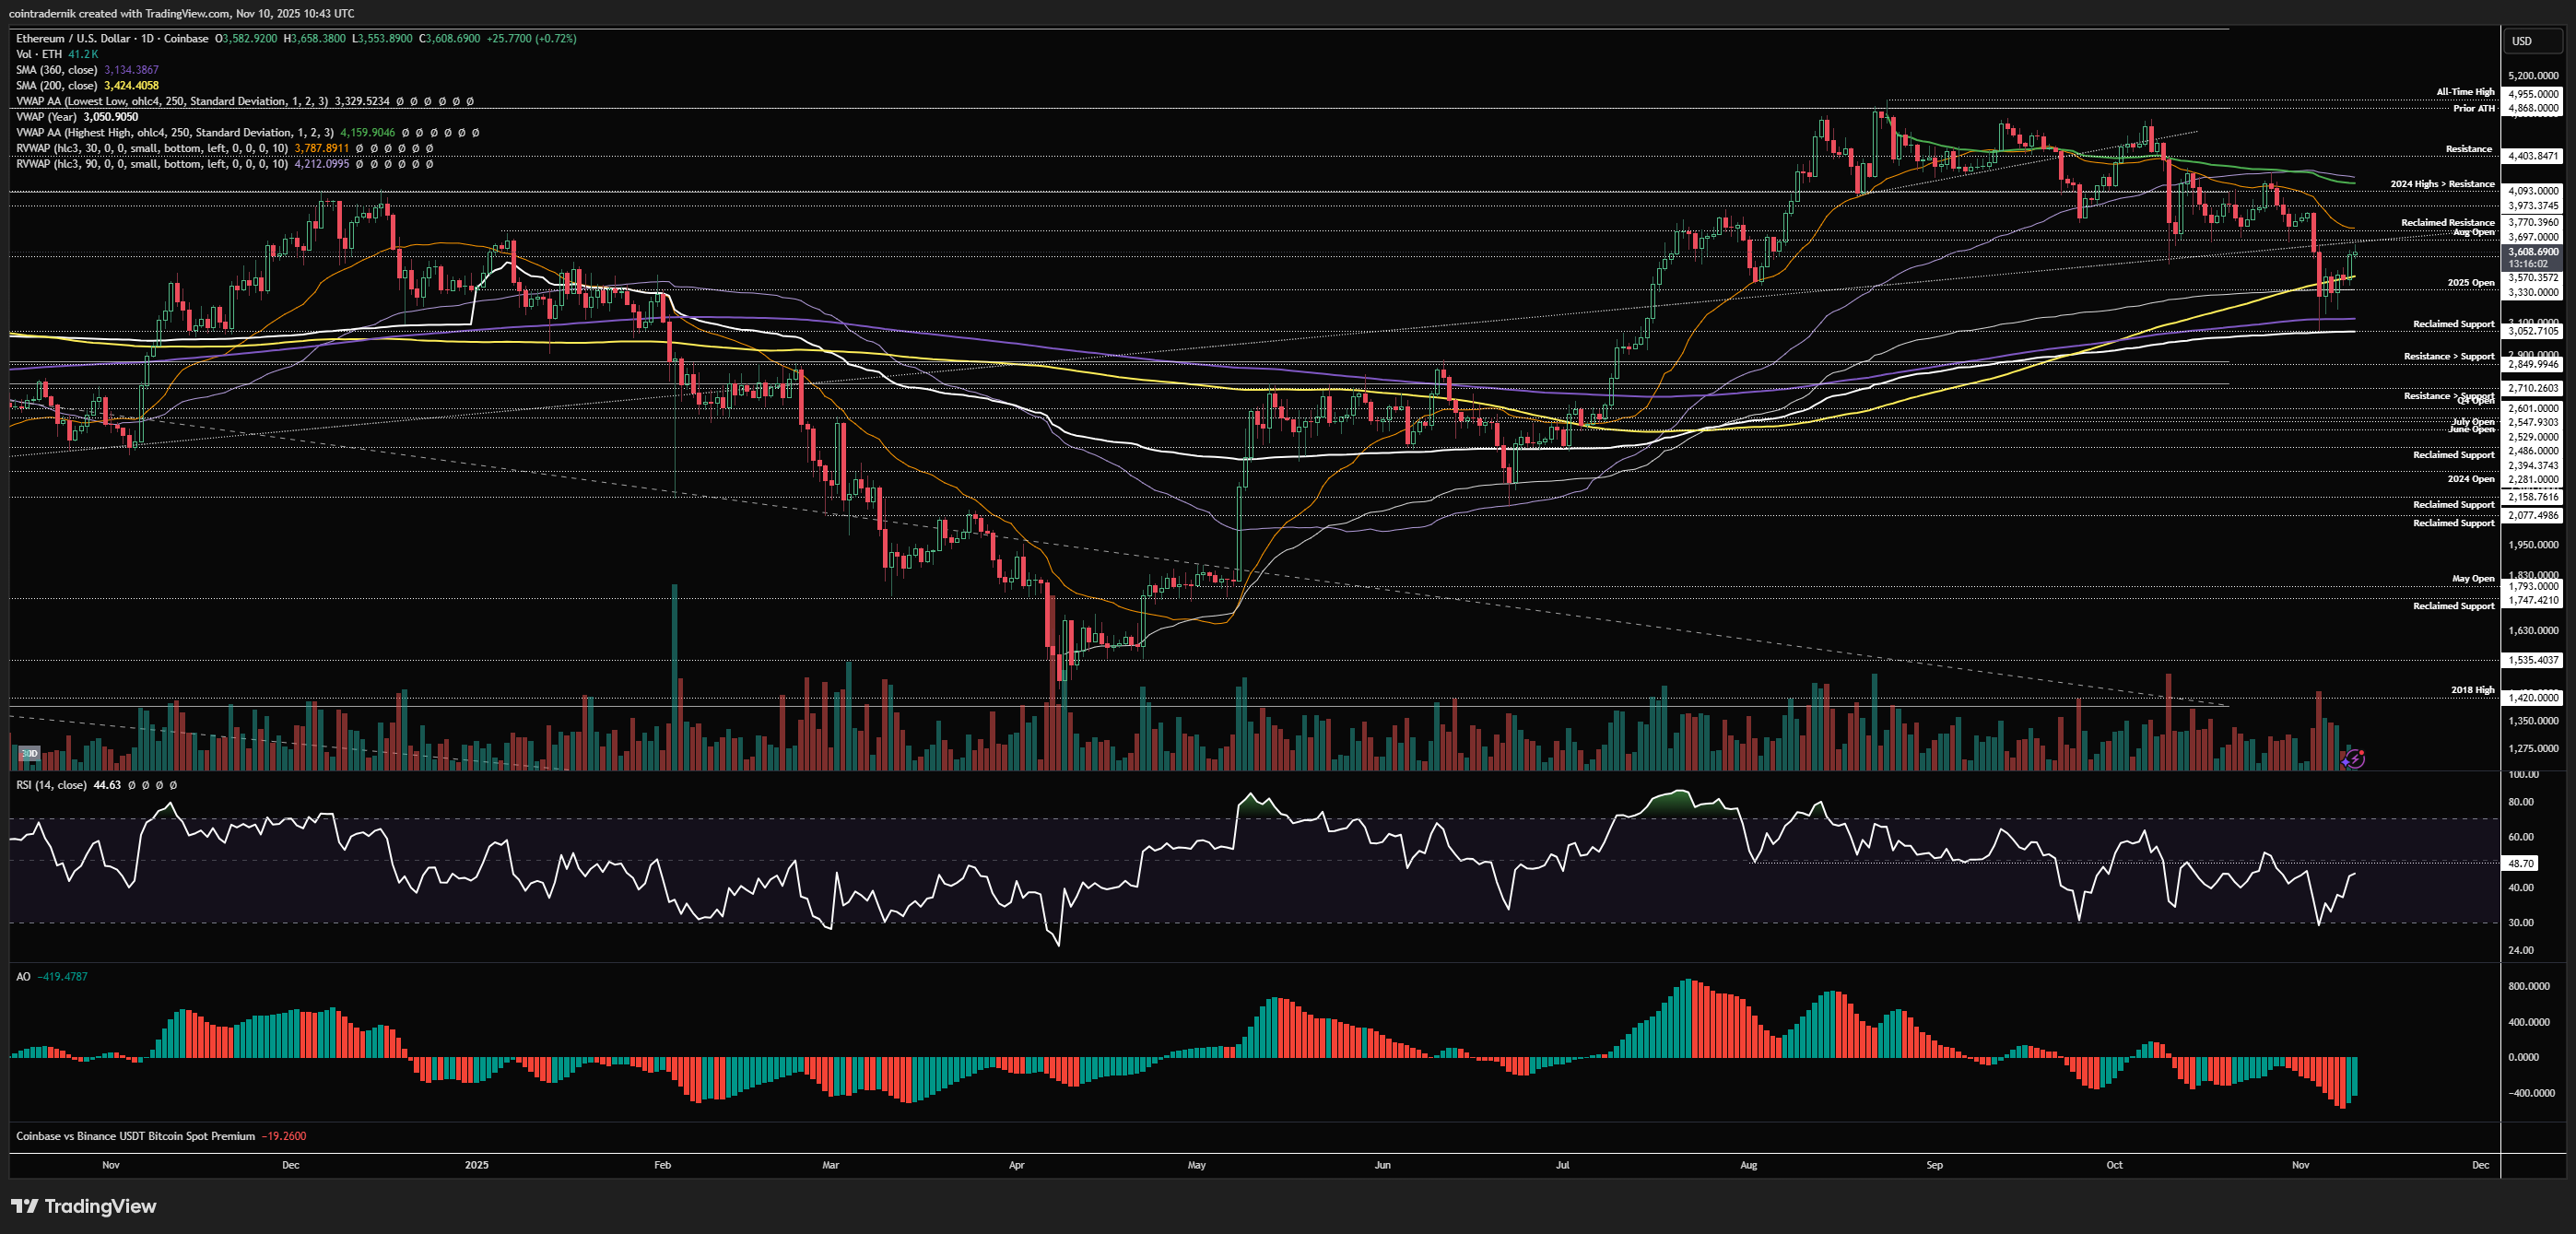
Looking at the daily, we can see that daily structure is bearish, as is momentum, but following that leg lower last week price tagged a huge confluence of levels, as well as sweeping the yearly open, with ETH hitting the yearly VWAP and 360dMA and bouncing. That now has to act as a major swing-low, as flipping that cluster intraweek into resistance would look super bearish and I would not be expecting much out of ETH for the rest of 2025 in that case; if we can hold those lows and flip $3770 into support here early this week, that would be a promising sign, and I would want to then see a higher-low form and that lead to the $4093 reclaim. In that scenario, we have a very strong springboard into Q1 next year. Above $4160ish we can talk about a return to the highs and beyond...
ETH/BTC
Weekly:
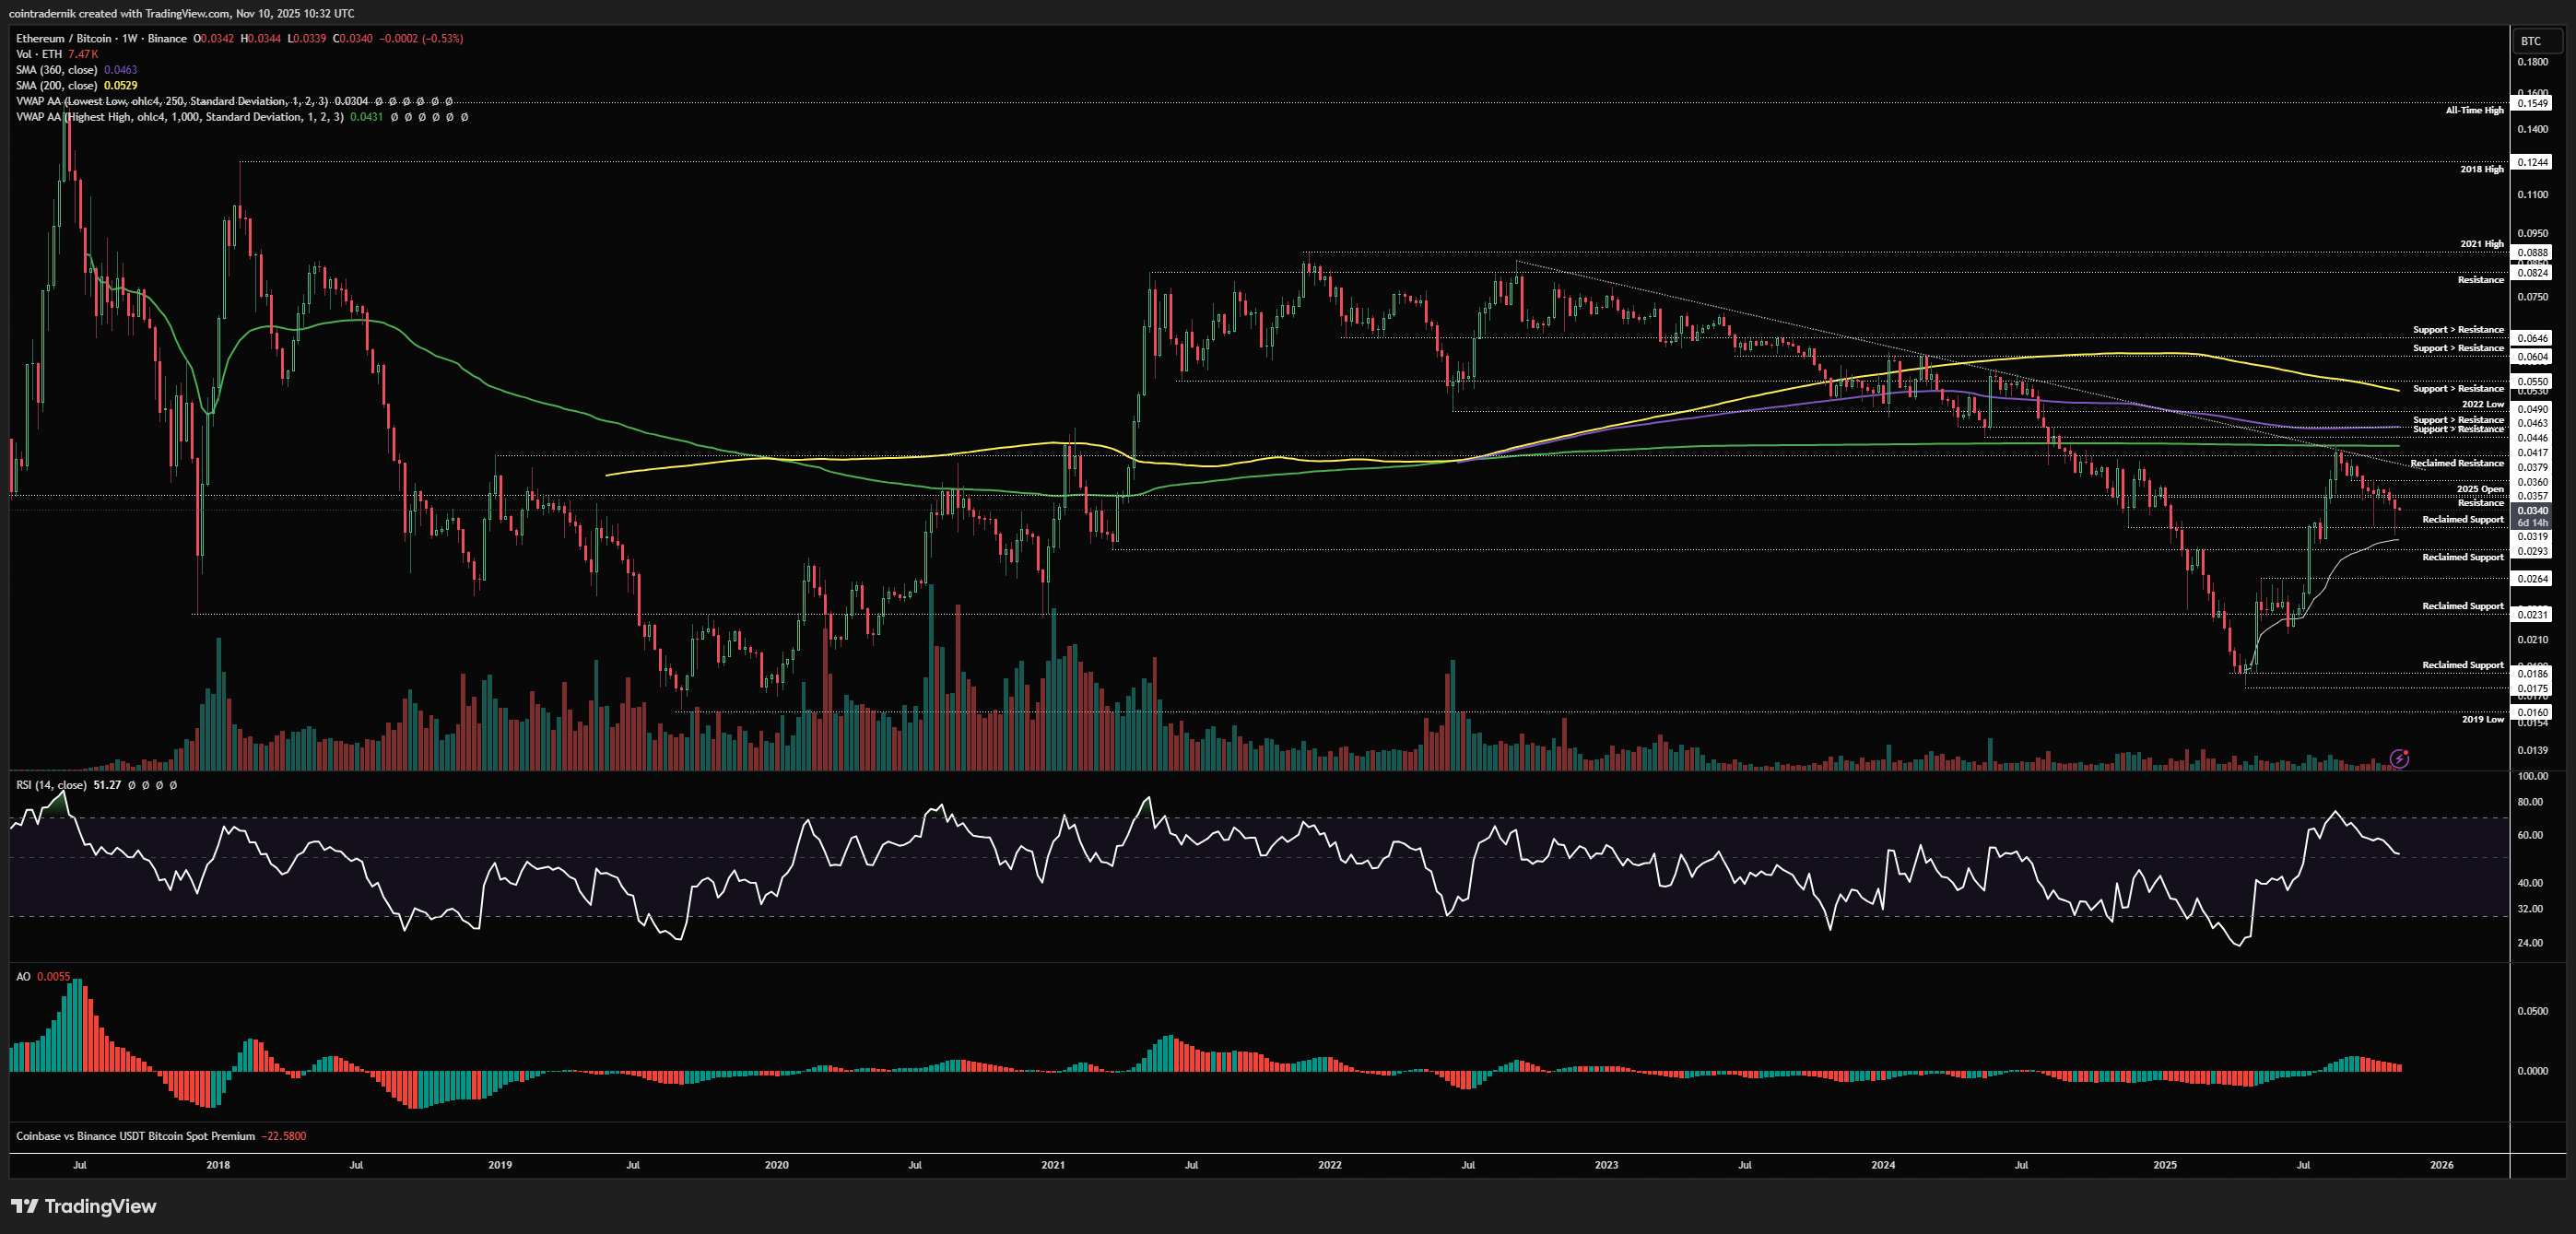
Looking at the weekly for ETH/BTC, we saw price wick below the prior low into the anchored VWAP from the 2025 bottom and demand at 0.0293. The pair bounced off this area as expected and closed back near the weekly open, still marginally below that 2025 open at 0.036. This is pretty much exactly what I wanted to see for a durable bottom to be in for ETH/BTC after we started flipping the YO into resistance, and we should now hold firm above 0.0319 as support if this is indeed still just a retracement and consolidation within a larger uptrend that is due for another leg higher. From here, if we are still bullish, we should see the yearly open flipped back into support this month and then price push higher from there into another trendline retest - and, with some luck, a breakout. Above 0.042 things can get silly again for ETH; below last week's low and we can pack it up until next year.
Daily:

Turning now to the daily, we can see that trendline resistance continues to cap the highs and so a break and close above this trendline would be an early sign of a shifting tide for the pair, particularly if it is confluent with flipping that yearly open into support at 0.036. Above that, we have the anchored VWAP from the yearly highs at 0.037, where a close above that would also turn daily structure bullish. If we see that occur over the next couple of weeks, that would be a very clear sign for the path ahead and I would expect a breakout above 0.042 to follow swiftly, with the leg higher beyond that into Q1. If the market is indeed bearish for months to come, as many believe, we should see 0.0293 flipped into resistance this month, at which point you would be looking at probably a near-full retrace of the rally off the lows back towards 0.024 at least.
Receive the latest updates directly to your inbox

Price: $6792
Weekly:
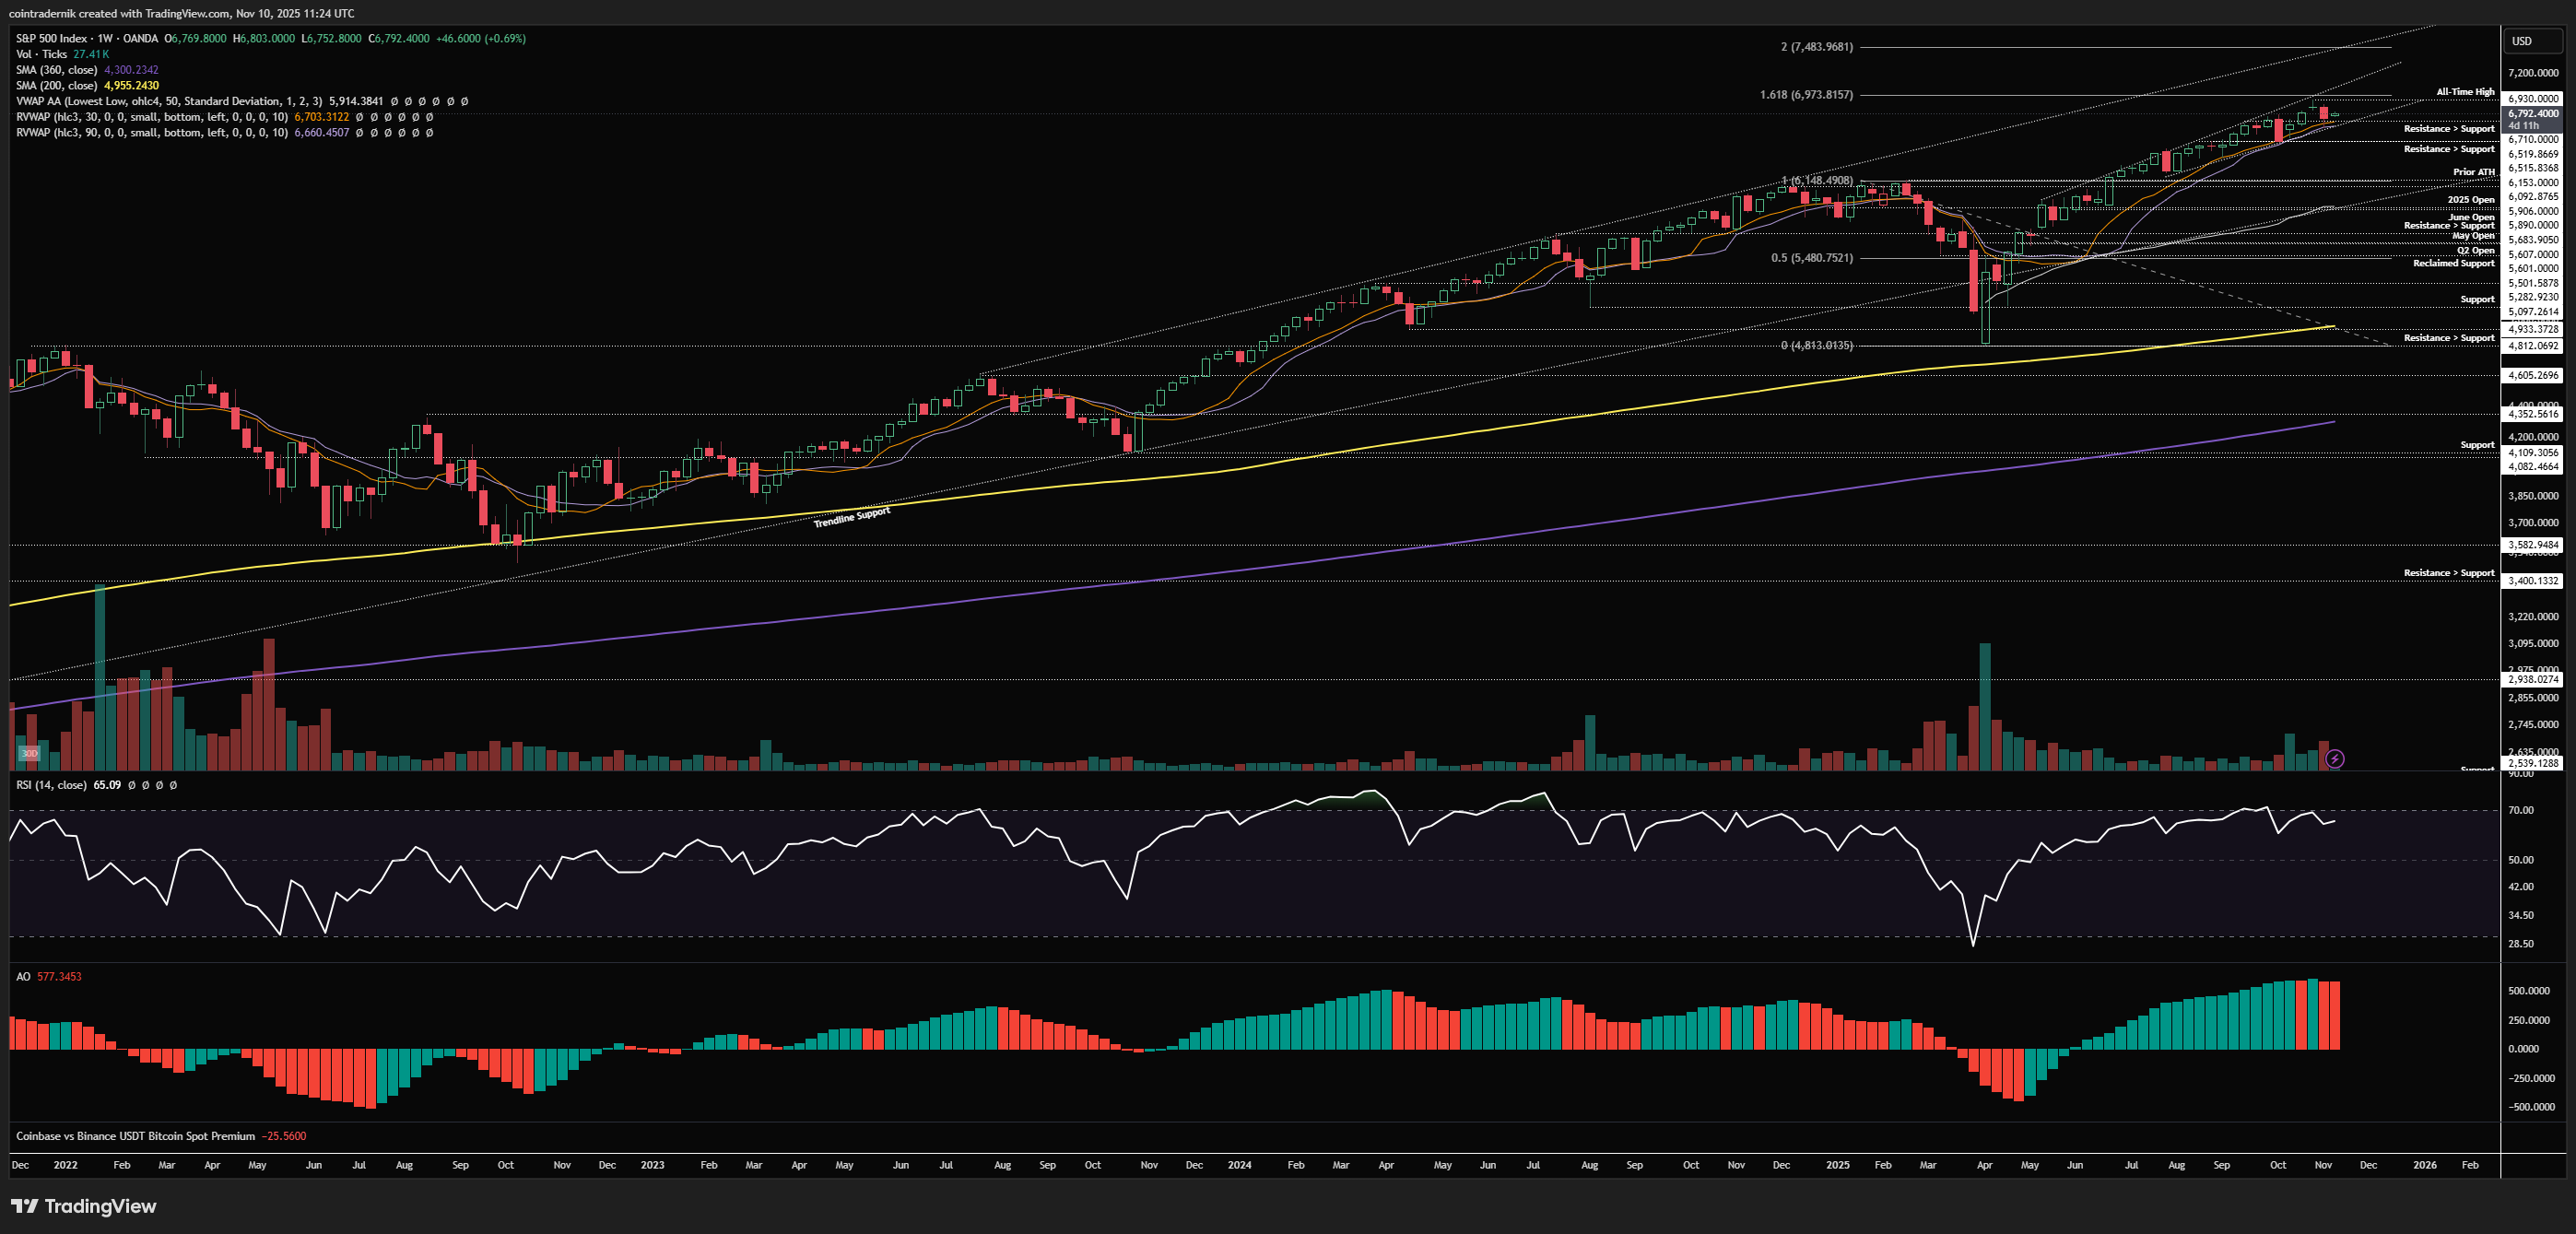
Looking firstly at the weekly, we can see that price sold off last week from the open right into support, providing that early November dip that I mentioned would be a gift if we got it. As has been common of the monthly opens, we saw spot VIX above 3-month forward and that marked a low, from which we bounce to close the week above resistance turned support at $6710, having filled the gap. We remain above trendline support with bullish structure and tailwinds into December for equities, so whilst we may get one more vol spike early this week I am not expecting last week's lows to be closed below and I would expect to see a return to the highs within a couple of weeks, to be honest. If we close the week below $6710, then we can get bearish: until then, it remains a buy the dip regime, in my view.
Daily:
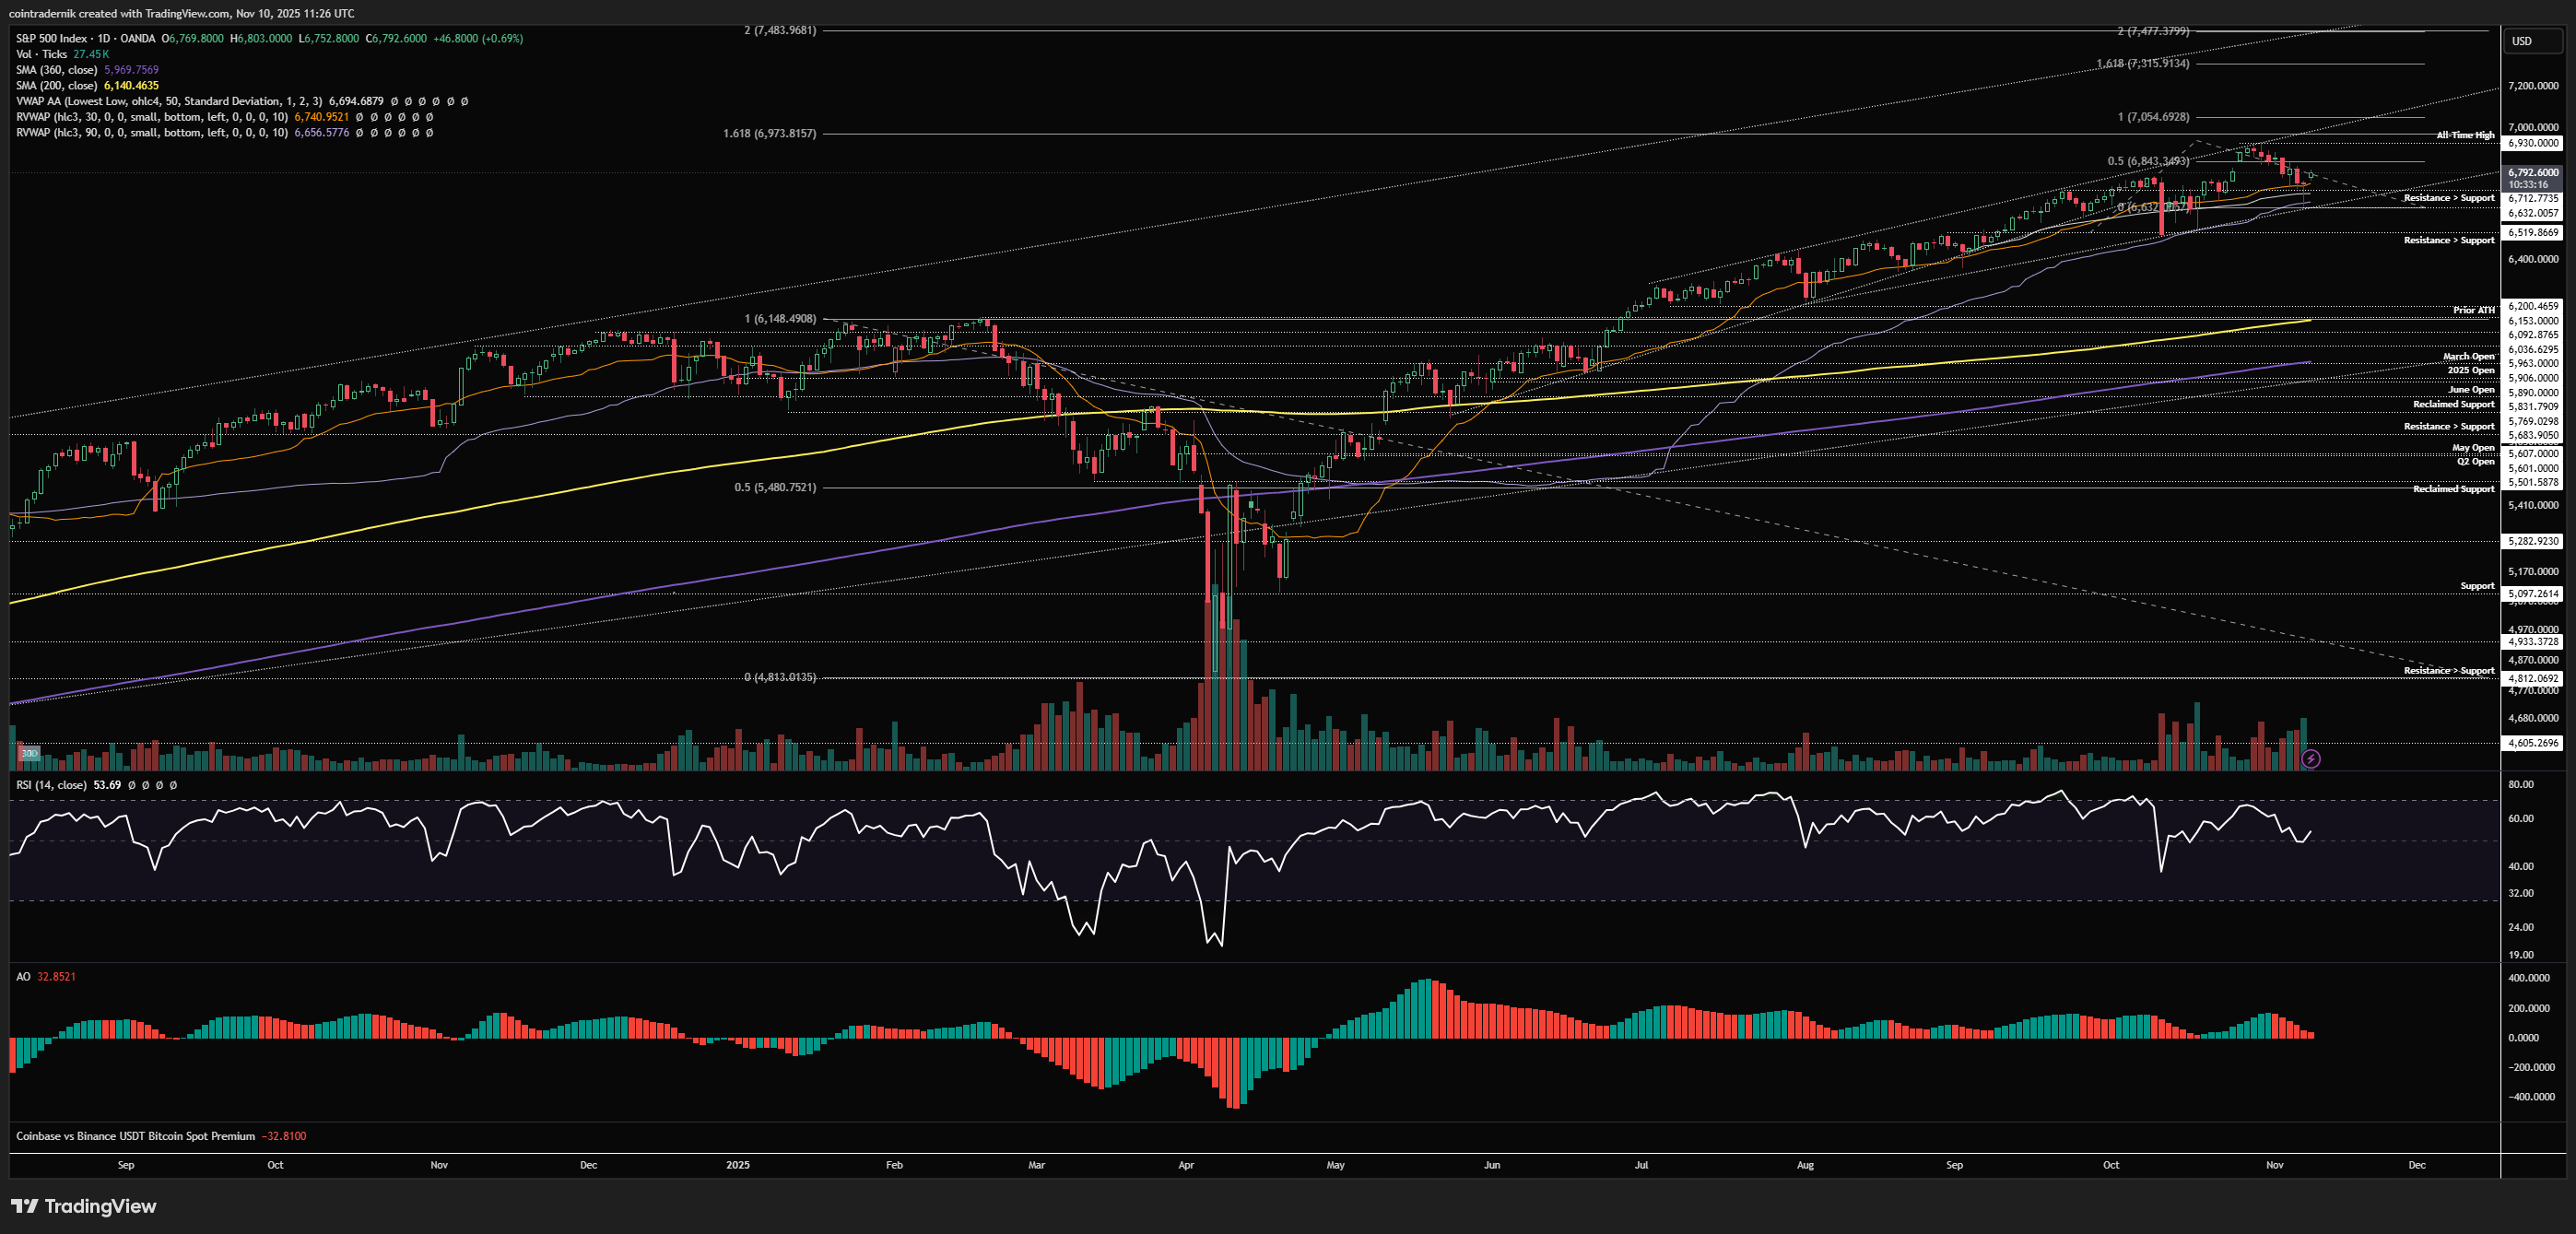
Dropping into the daily, we can see that price had been grinding lower after the all-time highs at $6930 and then we got that vol spike last week that saw SPX break lower and fill the gap on futures, then selling off further all the way into thee 90d rolling VWAP, which marked the lows in October. Price bounced off that VWAP at $6630ish and closed Friday strong, with price then gapping up over the weekend. Daily momentum and structure is bullish here, so we should expect the trend to continue whilst this is the case. If we break and close below the 90d rolling VWAP and last week's low, we can start looking for more bearish paths, but for now I am expecting the formation of a higher-low this week and then continuation back towards $6930 next week, with $7xxx as the major psychological line in the sand - above that this month and I think things get very silly for a short while and this will be reflected in sentiment and positioning before year-end.
Price: $258.9bn
OTHERS/USD
Weekly:
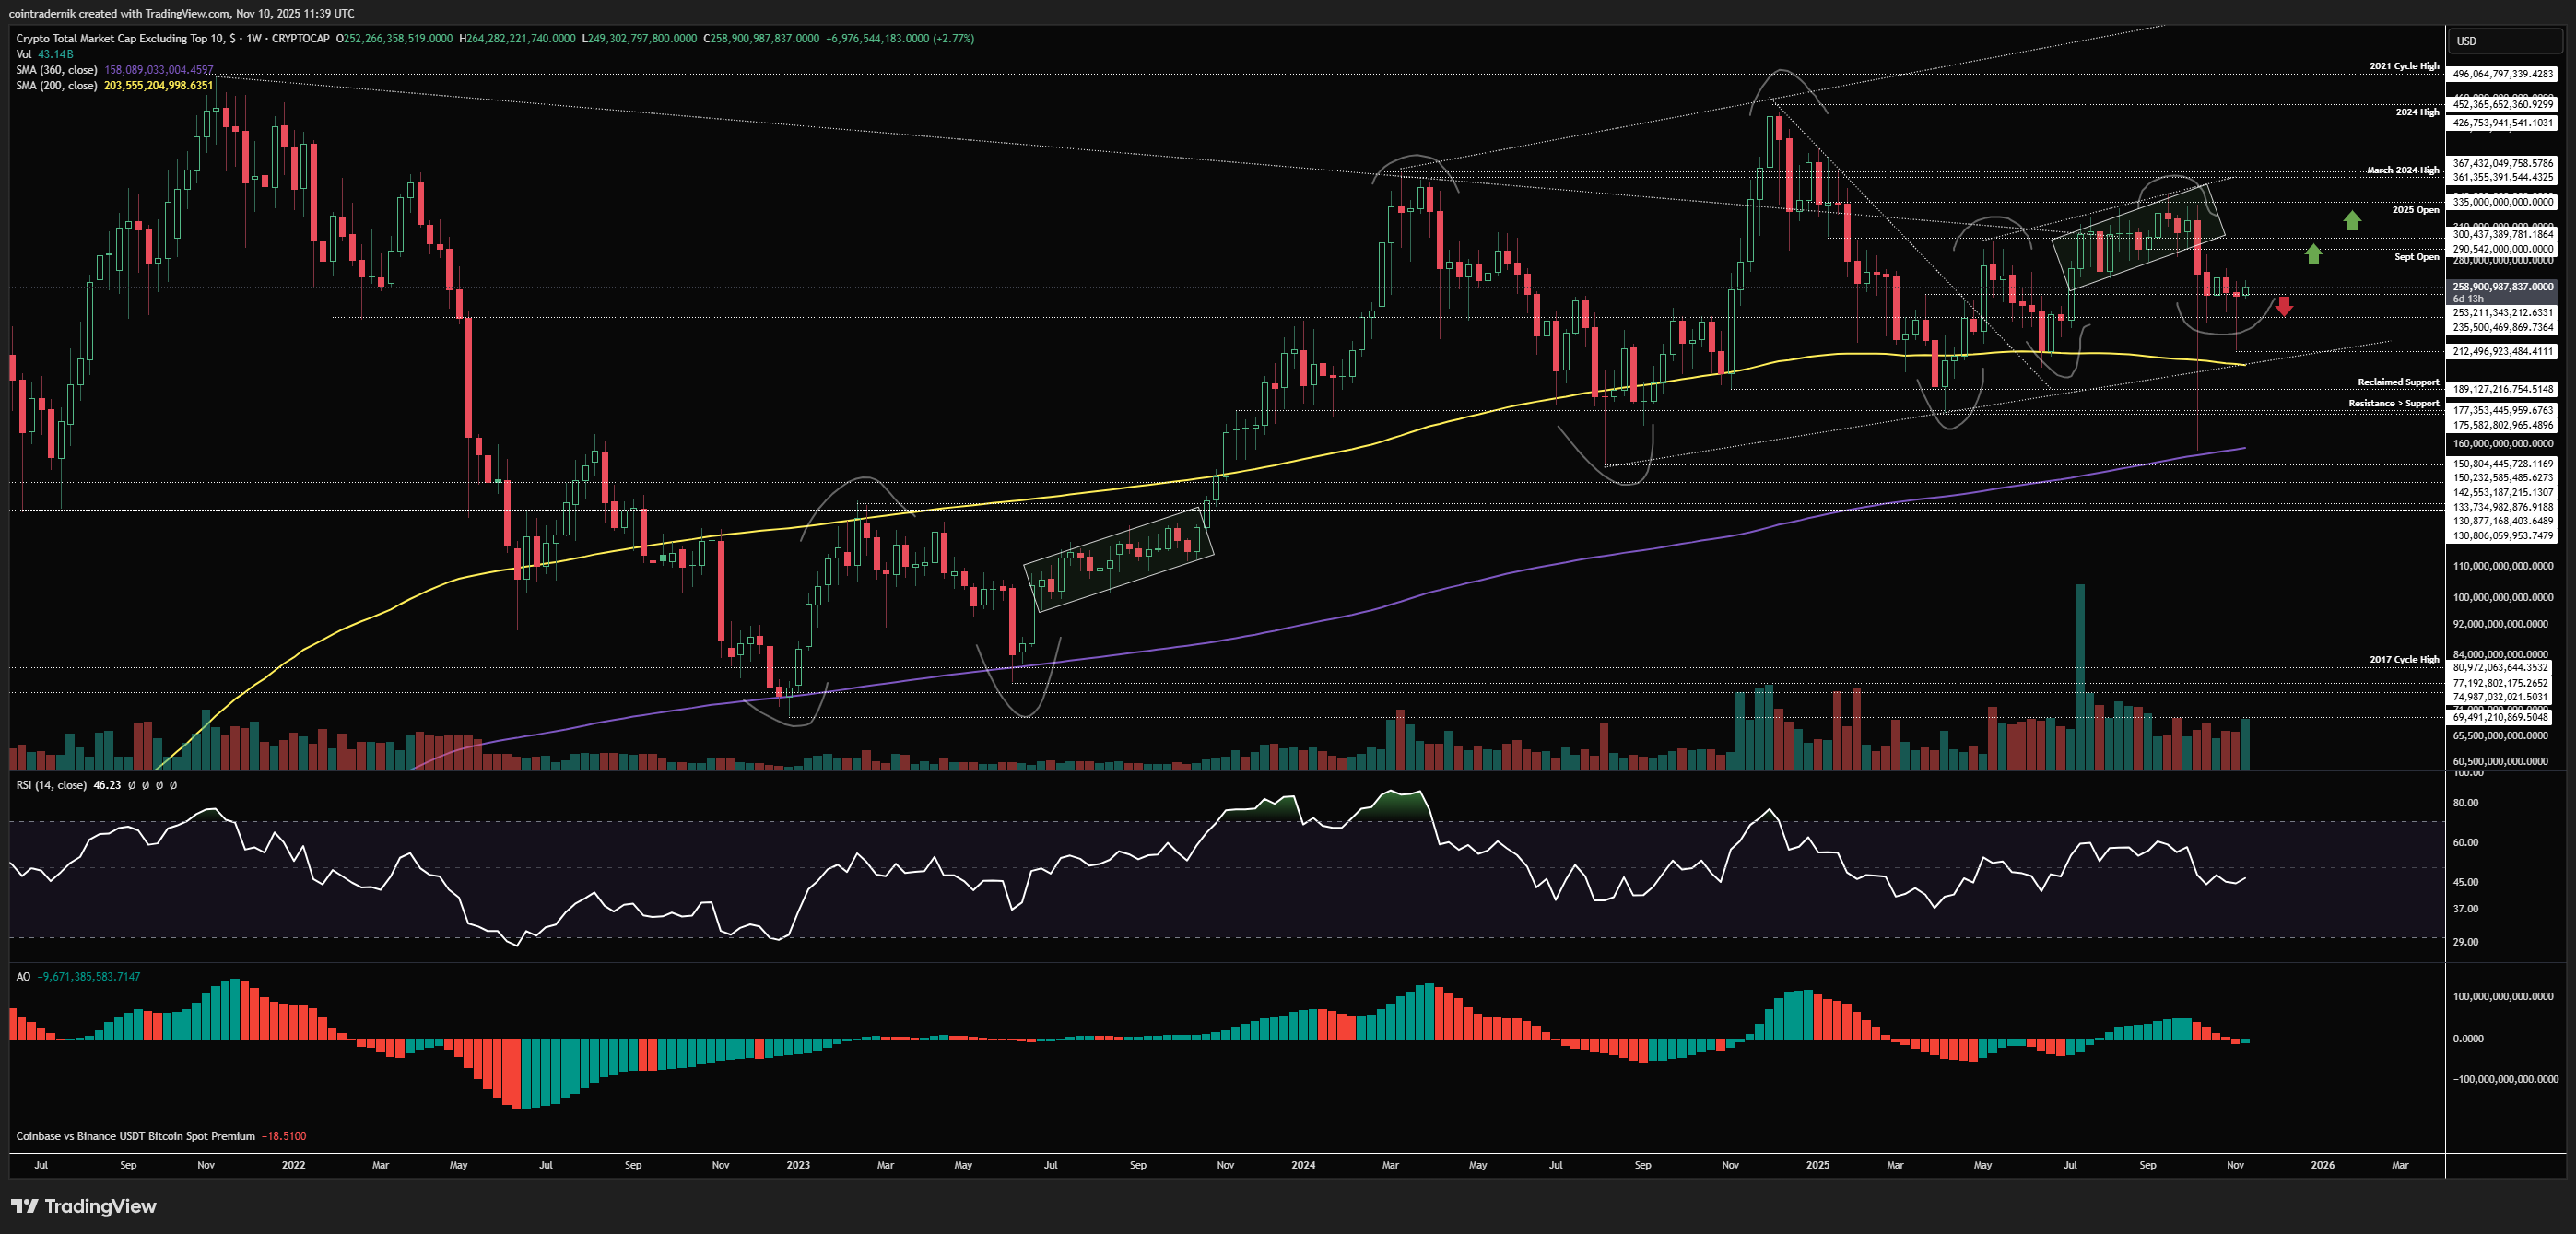
If we begin with the weekly view for alts, we can see from OTHERS that price-action was looking very similar to Q3 2023 before the events of 10/10 that saw OTHERS capitulation through local support and then every other support level all the way to the 2024 lows at $190bn (the 360wMA), albeit temporarily. From there, alts bounced hard as would be expected following that sort of liquidation event, and OTHERS has since been chopping around, though last week saw alts mark out a higher-low above the 200wMA at $212bn and bounce to close back near the weekly open. If we exclude the wick to goblin town on 10/10, we still have basically the same structure of higher-high and higher-lows here within a broader uptrend since late 2022 - only now we've utterly obliterated sentiment and washed out derivative positioning in alts. This is basically make or break for the idea that alts can outperform from here into Q1 2026,as a rejection below $290bn and a subsequent move below $212bn (the 200wMA) would mark out a lower-high and lower-low and then we really look like we're going to fill the wick back into $190bn (and likely lower). If, instead, as I am expecting, last week was really just another higher-low within this long-term uptrend, we should see momentum from here that begins with reclaiming those highs at $290bn as resistance turned support. My current expectation looking at crypto and equities is that above 7xxx on SPX = back above the 2025 open on OTHERS at $335bn, which has capped rallies all year and has not seen a single weekly close above since the year began. If we flip that yearly open into support going into December, that will give me a lot of confidence for my view on Q1 as a period of higher for longer than is currently expected.
Daily:

Looking at the daily, we can see trend exhaustion into the most recent lows on both RSI and AO but daily structure is still bearish. We want to see this higher-low lead to a higher-high to validate our view, which here would mean OTHERS closing the daily above the August open at $277bn (and the 360dMA). If we see that, I would expect alts to continue higher towards the Q4 open at $300bn, above which I think we're retesting the most important level on this index which is that 2025 open. If we reject at $277bn and can't shift that structure bullish, I would expect OTHERS to trade lower again and attempt to mark out another-higher-low above $212bn, failing which we have continuation of the bearish trend since September and potentially a major shift on the higher timeframes.
OTHERS/BTC
Weekly:
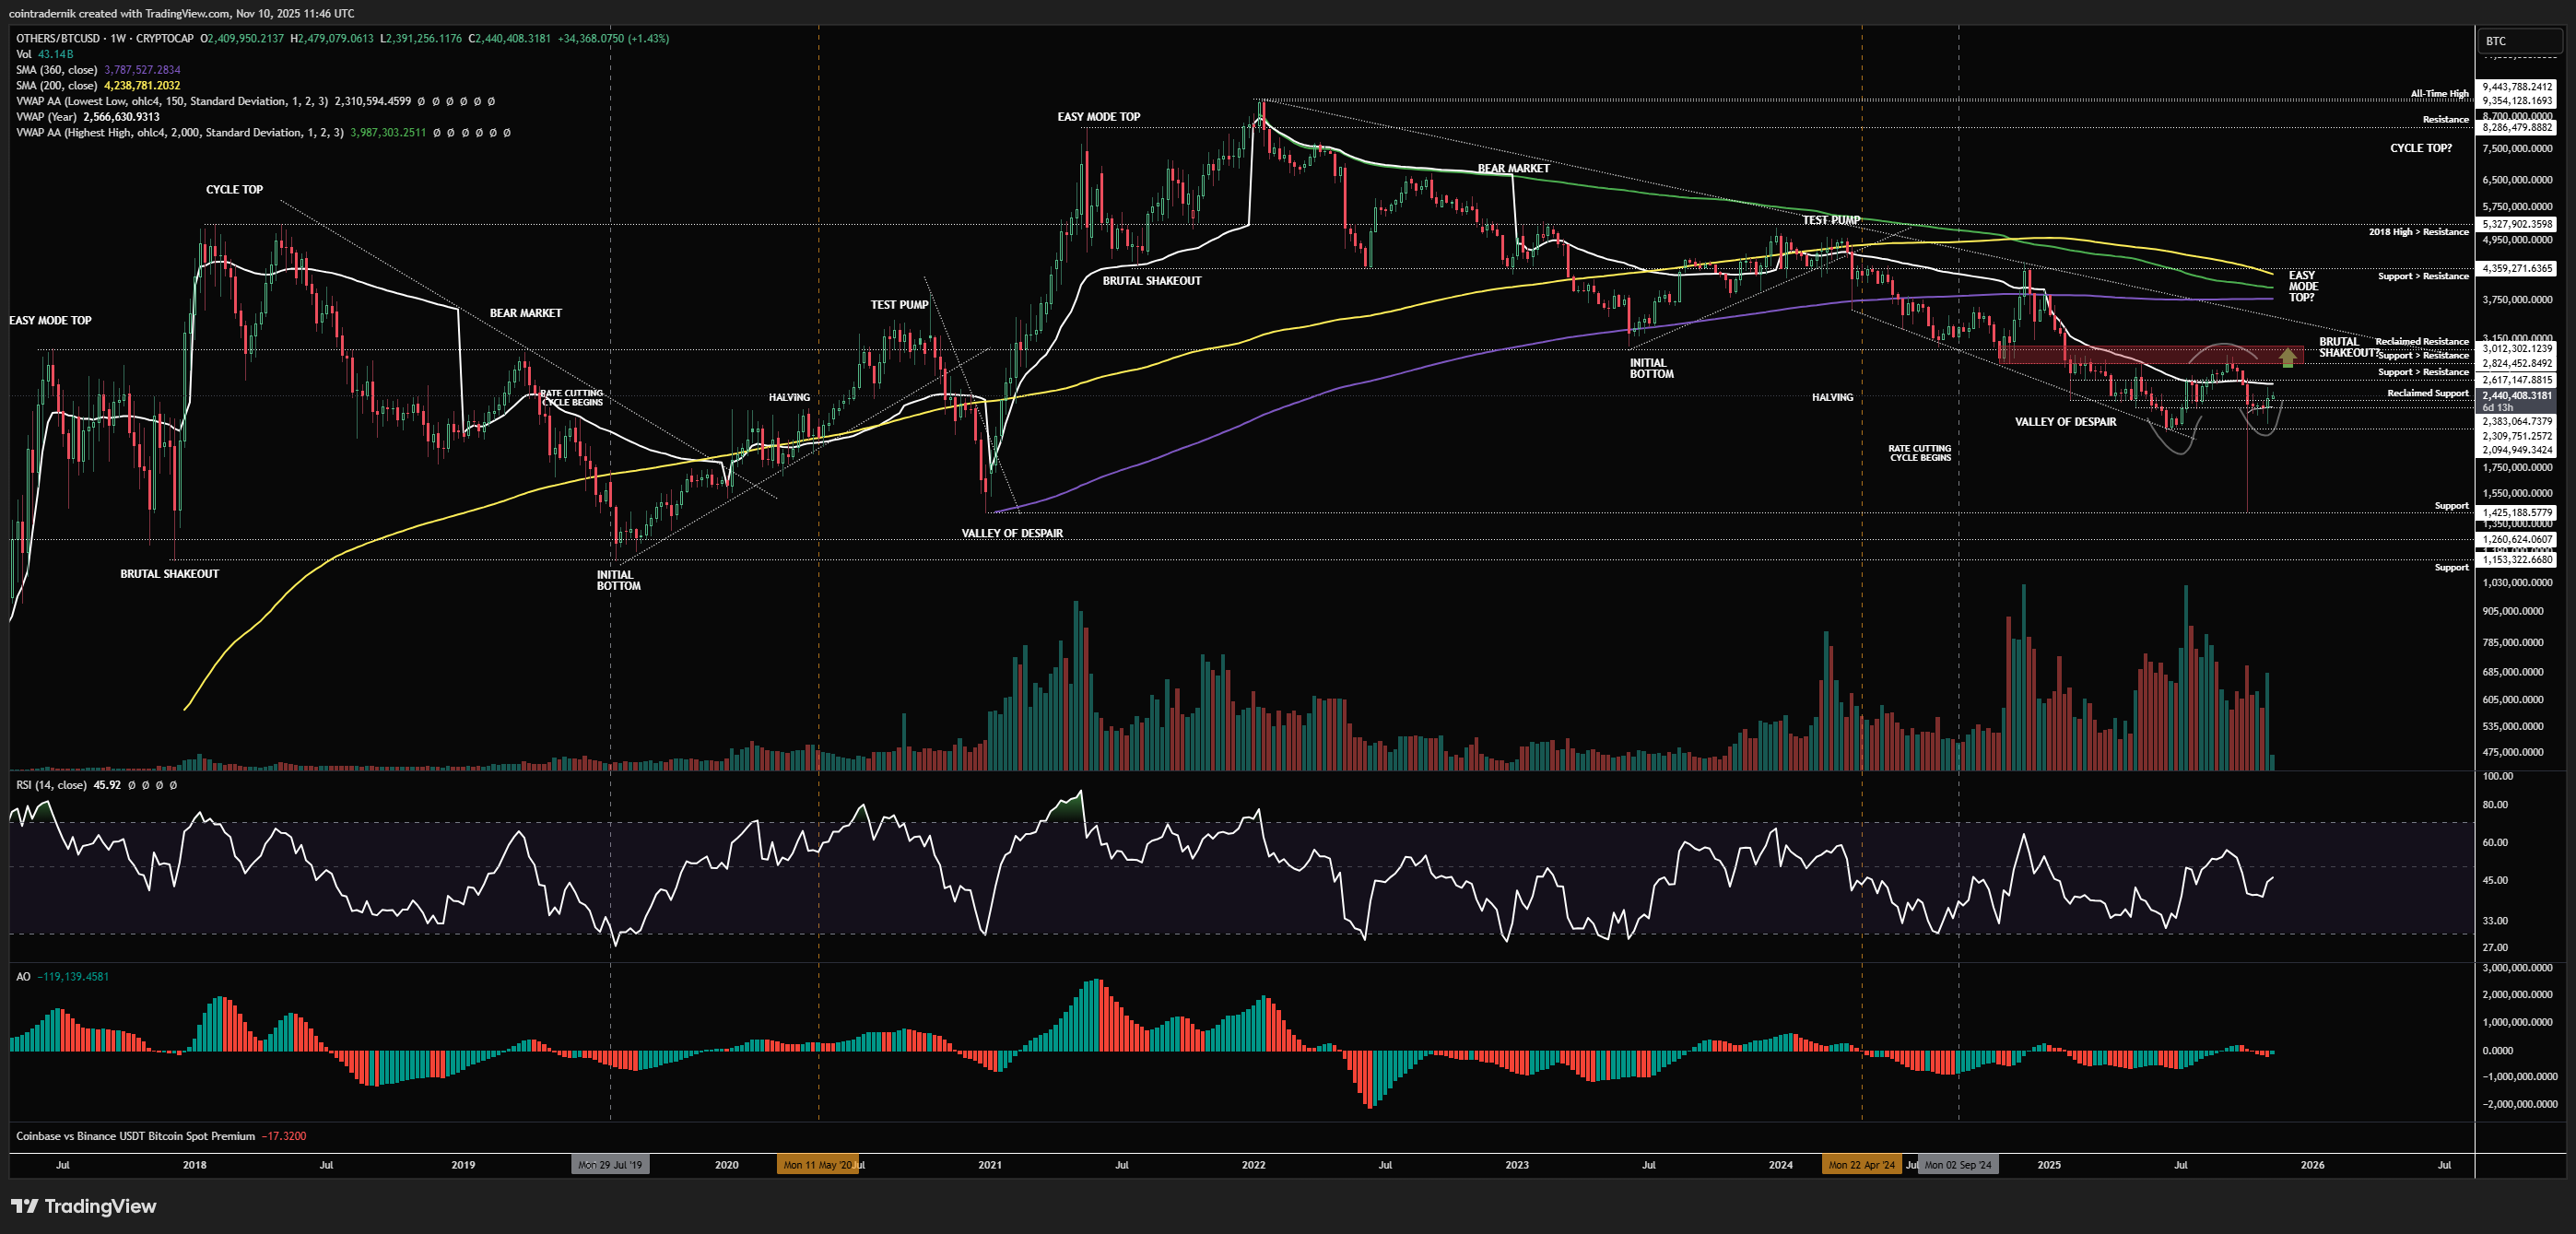
Looking at OTHERS/BTC on the weekly, as mentioned after 10/10, alts marked their low right where Dec 2020 marked its low and marginally above where Dec 2017 and August 2019 marked their lows. We have been in a 4-year downtrend since Jan 2022 for alts vs BTC, and it really would be absurd if after all of that we got an historic capitulation candle that marked a cyclical bottom for alts vs BTC right where it has historically done so. Something something 'the funniest outcome...' - but seriously, we now have a very clear view on alts vs BTC because we have a bullish engulfing last week that marked out a higher swing-low above the Liberation Day lows at 2.1mn BTC, and thus if we now close the weekly below last week's low it's a pretty clean invalidation for any bullishness here on alts. If we do see 2.1mn BTC closed below, that's a very long way down to potentially backfill the wick and that would be continuation of this 4-year bear trend for OTHERS/BTC; whereas, if OTHERS/BTC can find some momentum after last week's close and push above the yearly VWAP and then close above that swing-high at 3mn BTC, we have bullish weekly structure after the largest capitulation event in altcoin history. Kinda binary and kinda high R/R if the bears are not right and we are not going to continue trending lower for alts vs BTC.
Daily:
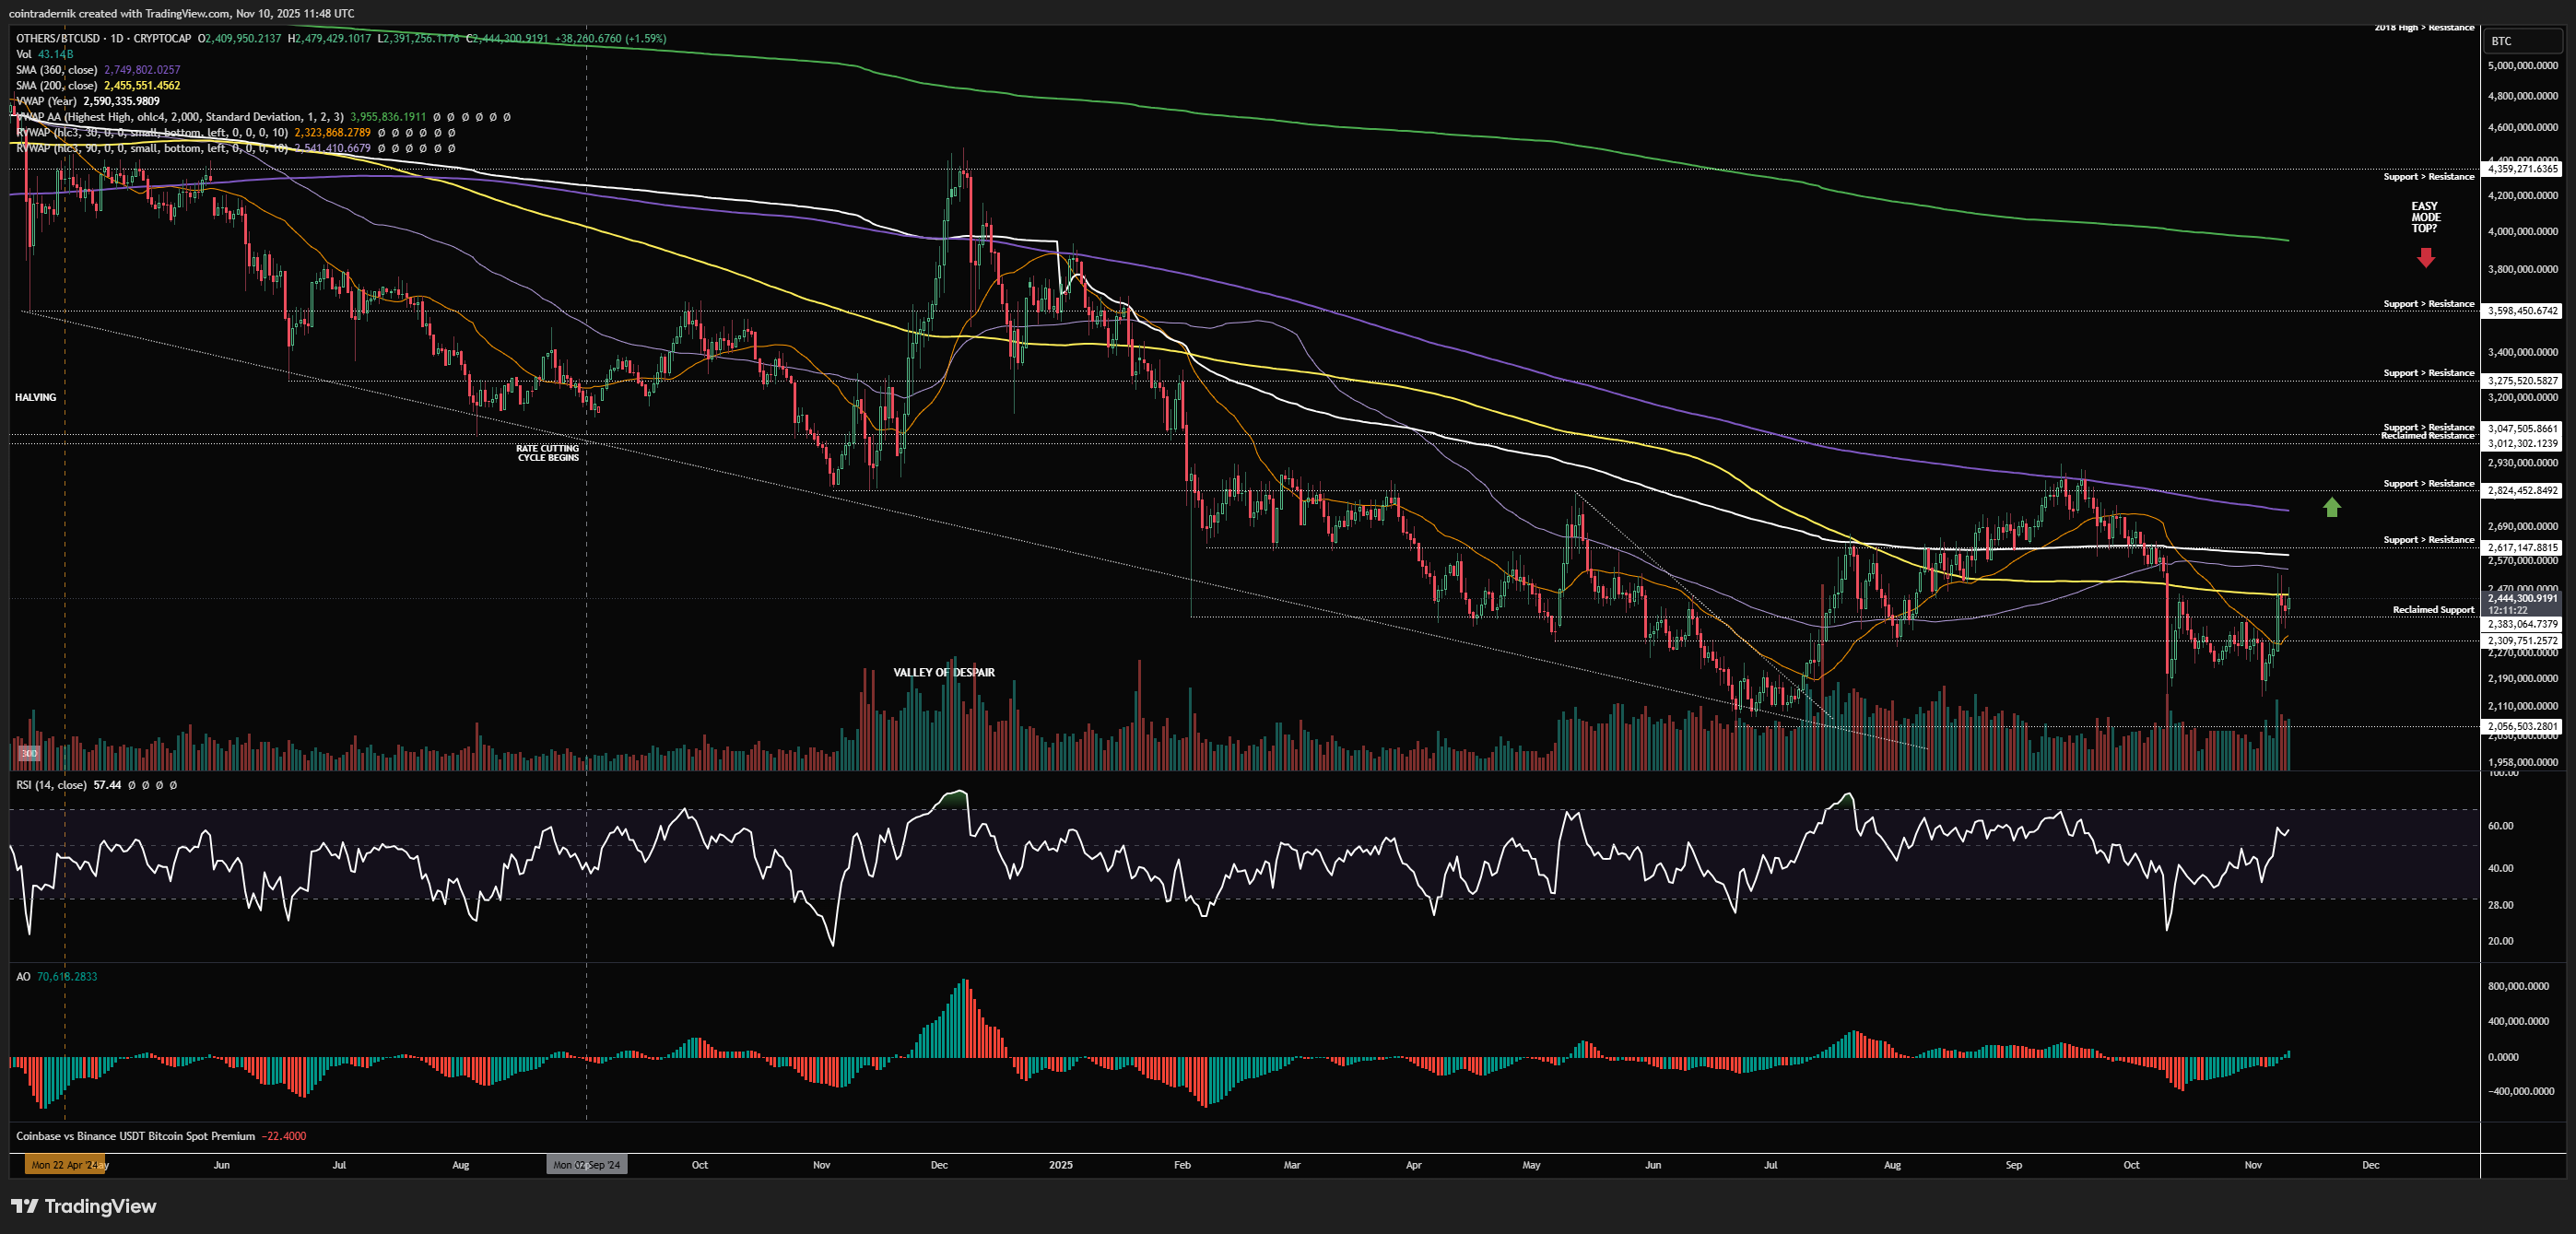
Finally, turning to the daily, we can see how that September swing-high is confluent with the 360dMA, above which we have not closed since December 2024. Daily structure is (marginally)bullish here after the close a couple of days ago but we do now have quite a lot of overhead resistance into 2.6mn BTC, with the yearly VWAP and 90d rolling VWAP, as well as the 200dMA right here. If we can mark out a higher-low above 2.3m BTC early this week (as it currently looks like we are doing) and then push through 2.6mn BTC and reclaim it as support, I think we retest that 3mn BTC area over the next week or two and then we can assess whether we're rejecting and returning to range lows or we actually have the momentum for a breakout now that everybody has been convinced an index of alts will never broadly outperform Bitcoin again (4 years into a downtrend).
I hope you've found some value in the read this week!
And if you've not already signed up for Ostium, please do so and test out some of the recent updates, including:
Sign up here (you don't have to use my ref link, of course): https://ostium.app/trade?from=CL&to=USD&ref=CTNIK

.avif)