

Market Outlook #57
October 28, 2025
-
12
min read


This blog references an opinion and is for entertainment and informational purposes only. It is not intended to be investment advice. Seek a duly licensed professional for investment advice.
In this 57th Market Outlook here at Ostium Research, we'll be taking a look at the week ahead in markets, focusing specifically on price-action, positioning and event risk for Bitcoin, Ethereum, Gold, SPX and Crude Oil.
Firstly, let's take a look at the calendar, with a very heavy second half of the week ahead, including four interest rate decisions:
WEDNESDAY: BOC INTEREST RATE DECISION: (CONSENSUS 2.25% VS PREVIOUS 2.5%)
WEDNESDAY: FED INTEREST RATE DECISION: (CONSENSUS 4% VS PREVIOUS 4.25%)
THURSDAY: TRUMP-XI MEETING
THURSDAY: BOJ INTEREST RATE DECISION: (CONSENSUS 0.5% VS PREVIOUS 0.5%)
THURSDAY: ECB INTEREST RATE DECISION: (CONSENSUS 2.15% VS PREVIOUS 2.15%)
FRIDAY: US CORE PCE (MOM) (SEP): (CONSENSUS 0.3% VS PREVIOUS 0.2%)
FRIDAY: US CHICAGO PMI (OCT): (CONSENSUS 42.3 VS PREVIOUS 40.6)
Now, let's dig into asset-specific price-action for the week ahead, looking firstly at Bitcoin:
Price: $114,339
Weekly:

If we begin by looking at BTC on the weekly timeframe, we can see that last week saw price find support back above that reclaimed range support at the July open ~$107k as expected, pushing off that level into the weekly close at $114.5k, marginally below the prior weekly open and the cluster of overhead resistance into $116k. What we want to see here to validate the bullish outlook is a weekly close above the mid-range at $115.6k; a strong close through that level this week would open up an all-time high retest next week, in my view, with the next test unlikely to hold as resistance and thus leading to price discovery through November into $133k as the first major level. What bears want to see this week is a wick above this cluster of resistance that baits longs and then a rejection, where a close below $114.5k subsequent to that bull trap opens up a retest of range support at $107k. Only if we close the weekly below this multi-month support and that longer-term trendline does this look bearish on a longer-term timeframe, with the support cluster at $100k as the last stand in my opinion - acceptance below that level = significantly higher probability of a move back towards the April lows and a longer consolidation. For now, price-action is following the bullish trajectory but we do need to see acceptance above $115.6k here going into November.
Daily:

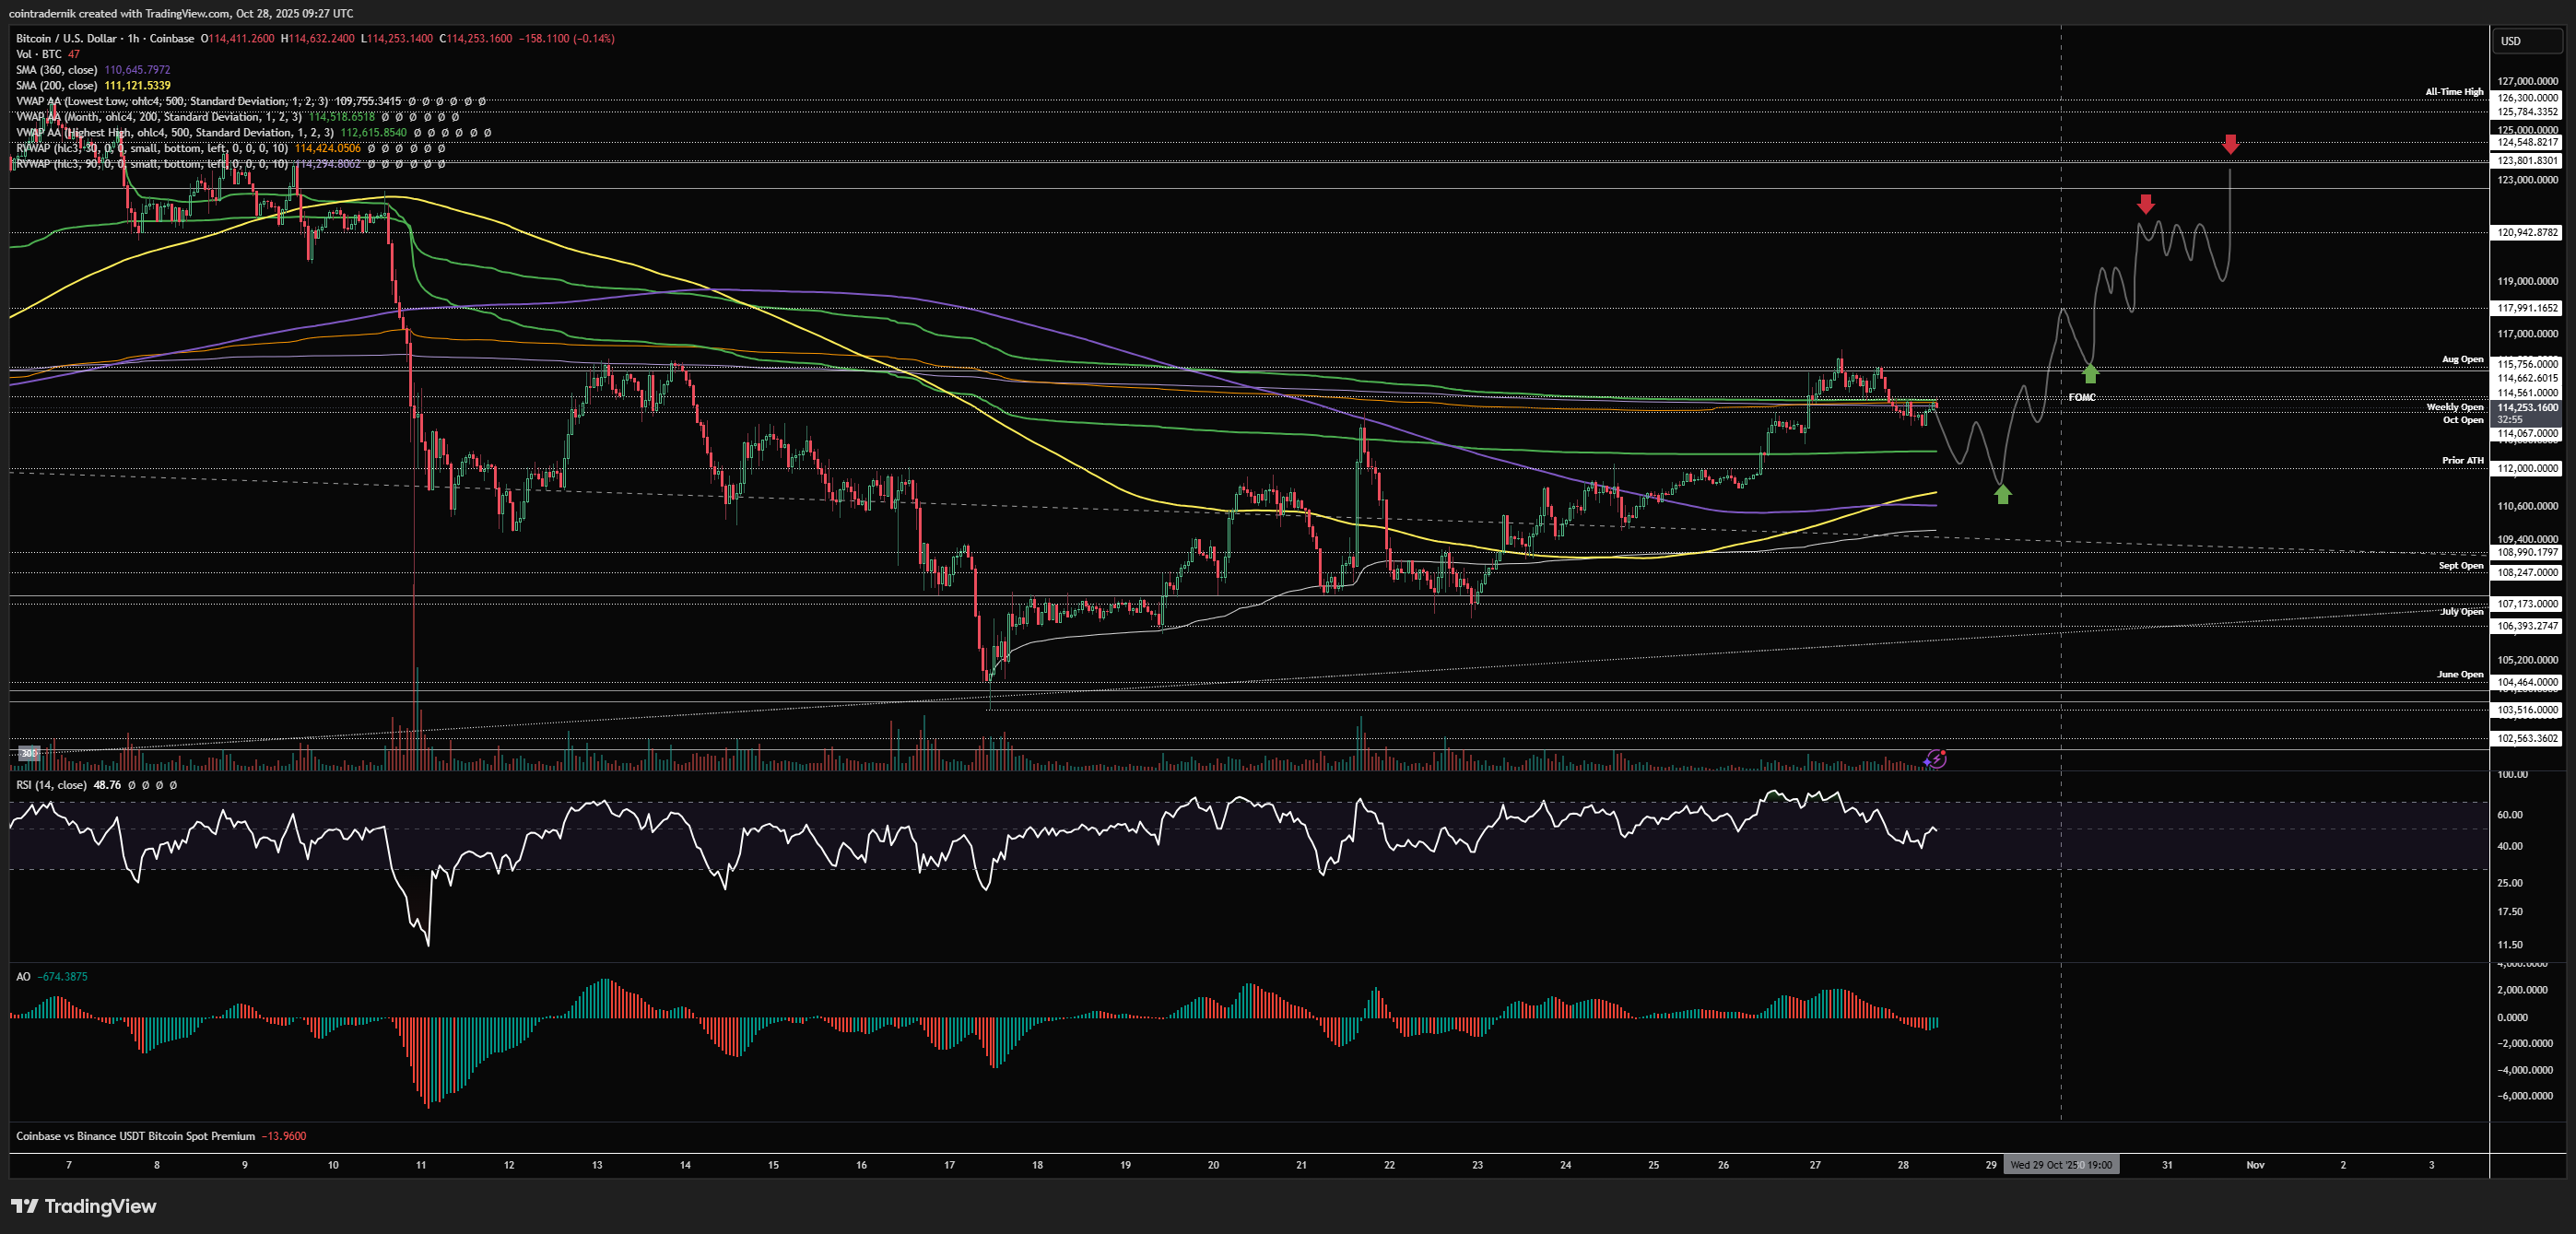
Looking at the daily, we can see the cluster of VWAPs right around this $114k-$116k range that are capping price, alongside the October and August open, hence flipping this entire range into support would be signal for a run of the highs at the very least. Daily structure is technically bullish after the higher-high and higher-low, but again the high that preceded the ultimate low remains resistance right at $116k, so closing above that swing-high would give me much more confidence in this structure. Obviously, it goes without saying you would not be jumping into levered longs here given how much resistance is above. Yesterday's price-action saw price wick above the August open and reject, and it remains to be seen whether this is the bull trap scenario outlined above, though looking at derivatives it doesn't seem so. If we pull back from here we would be looking for an intraweek higher-low formation above that 200dMA at $109.2k that then leads to a clear breakout above $116k, with that level then acting as support as price pushes into $124k. What would be a much more definitive bull trap scenario here is another run of yesterday's high into FOMC and then a daily close below $112k as we go into the end of the week, where breakout buyers would then very much be trapped into the monthly close and we would expect them to be squeezed at least back into range support.
Now, as for intraweek setups, to be honest the long scenario here is not particularly great (and as mentioned last week I'm already directionally long BTC from $111kish so unlikely to take this if it comes), but if we do hold below the weekly highs into Wednesday you could bid the first test of $112k and add if we get acceptance above $115.7k post-FOMC on the first pullback into that level, looking for at least $121k but in that case more likely new all-time highs. I don't know if this is particularly likely to play out however given the amount of volatility we could see and so there's a chance we just gap higher with no pullback into $116k once we accept above it:
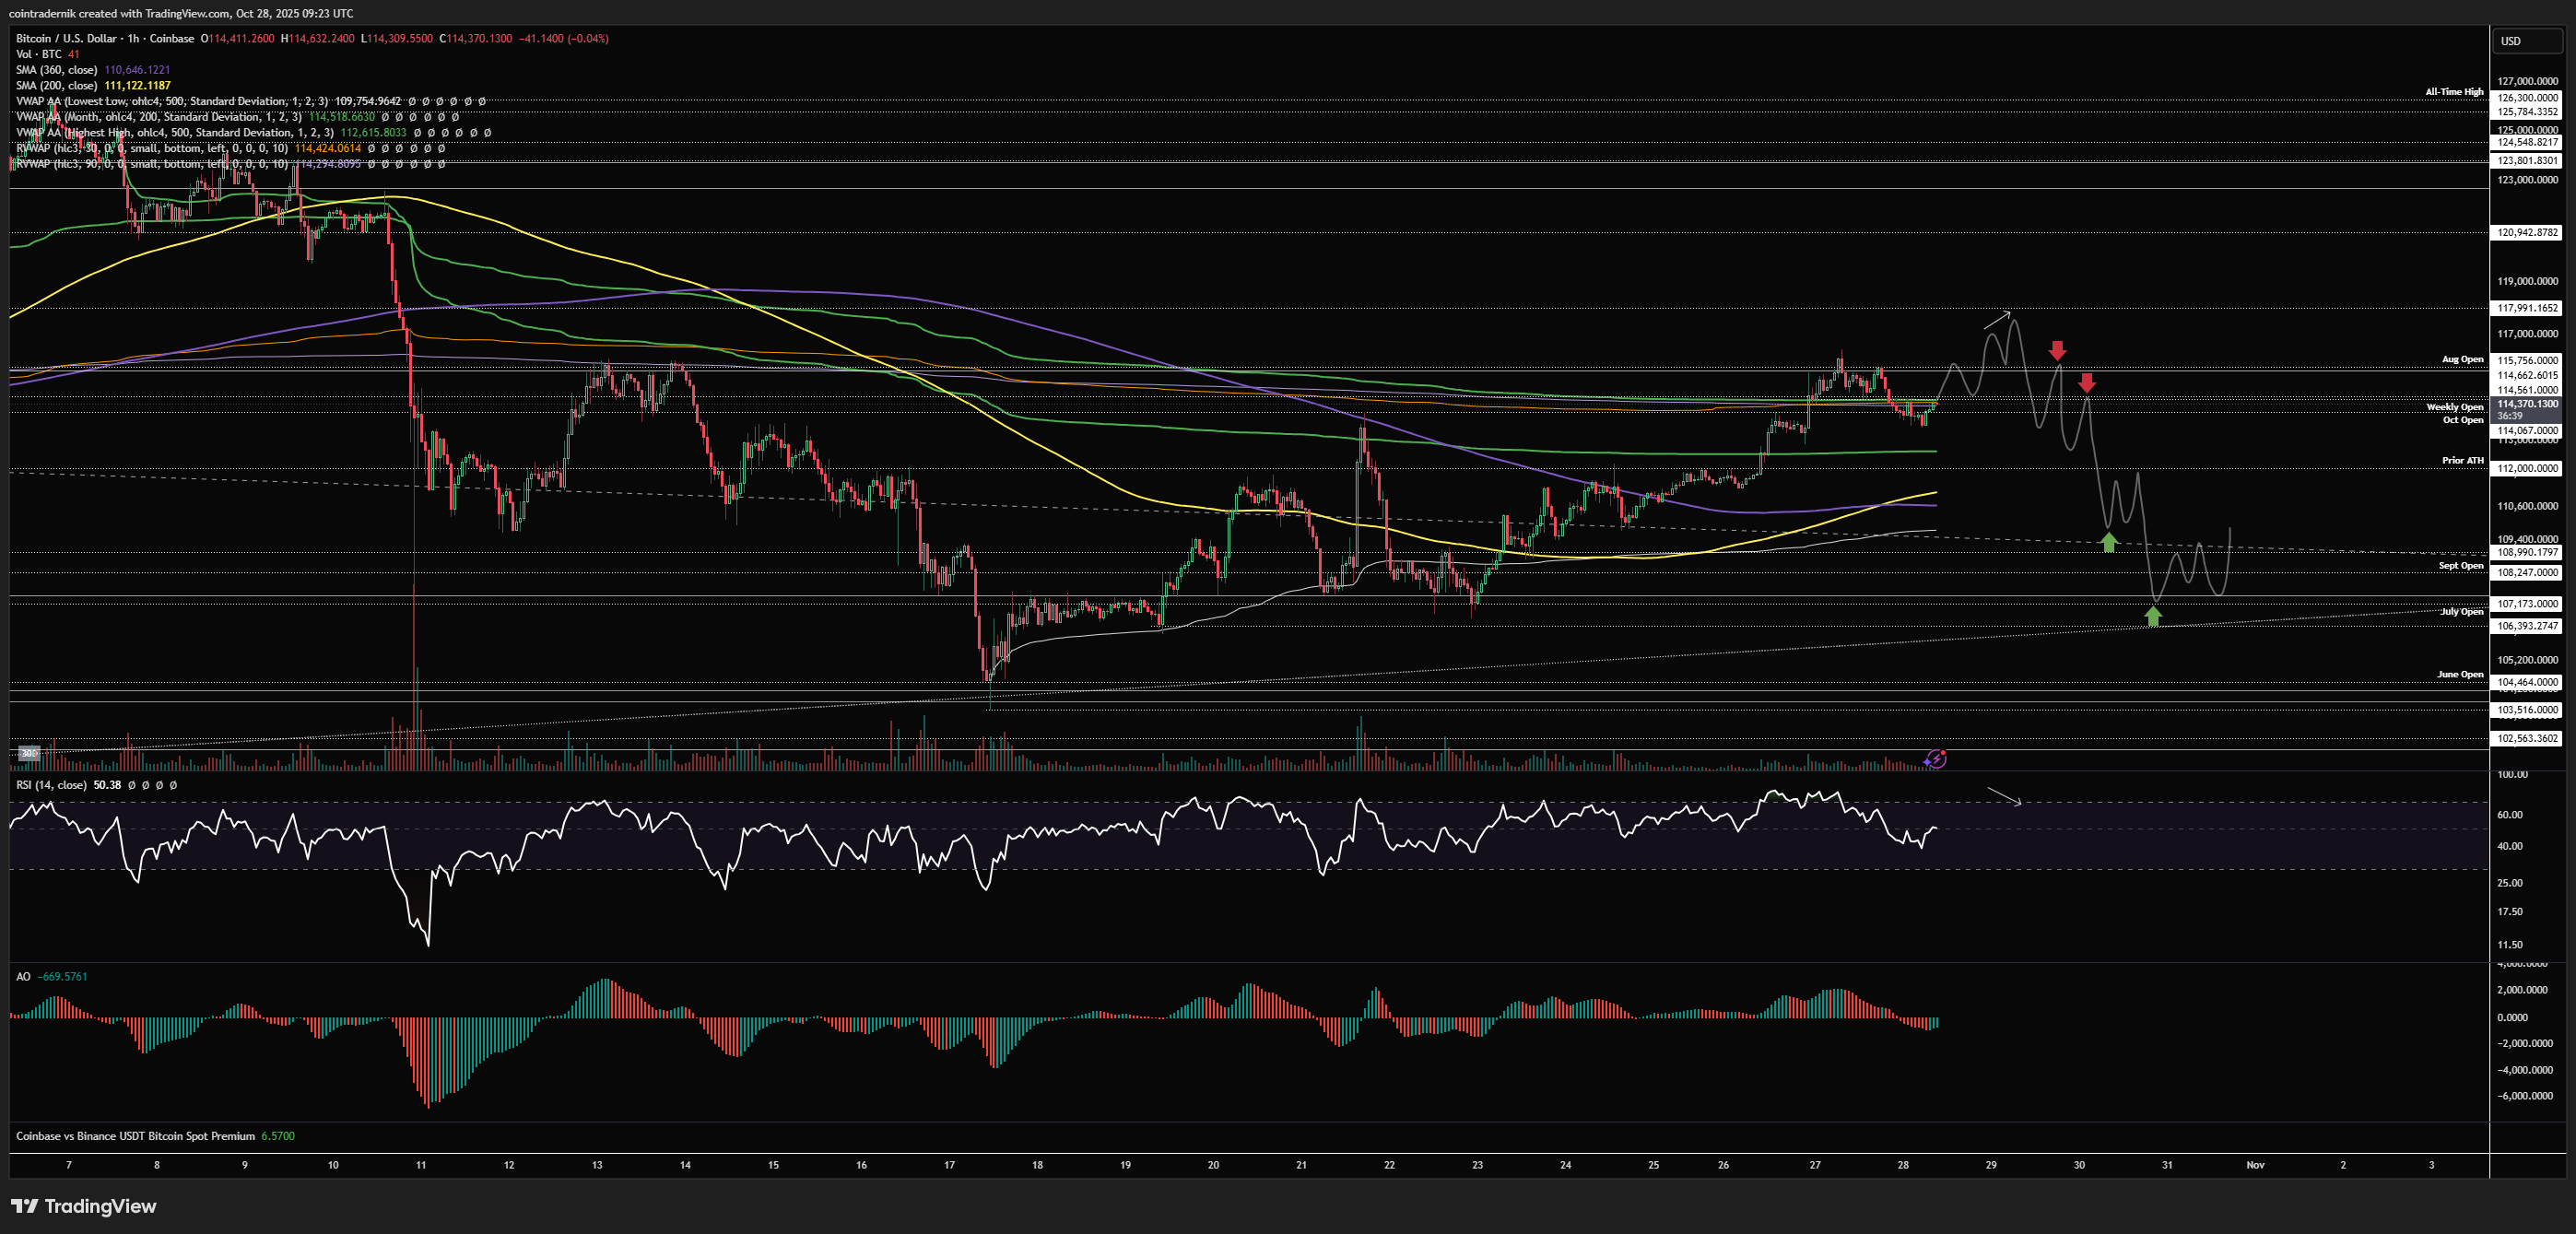
The short scenario is actually a much nicer setup for an intraweek trade, which would be as described above: a run of Monday's high into FOMC, with trend exhaustion above the August open and then a breakdown back below that level trapping breakout longs, with the opportunity to add on a move back below the weekly open and looking for that $107k-$109k region to be retested:
And here's a snapshot of positioning across Velo and CoinGlass:


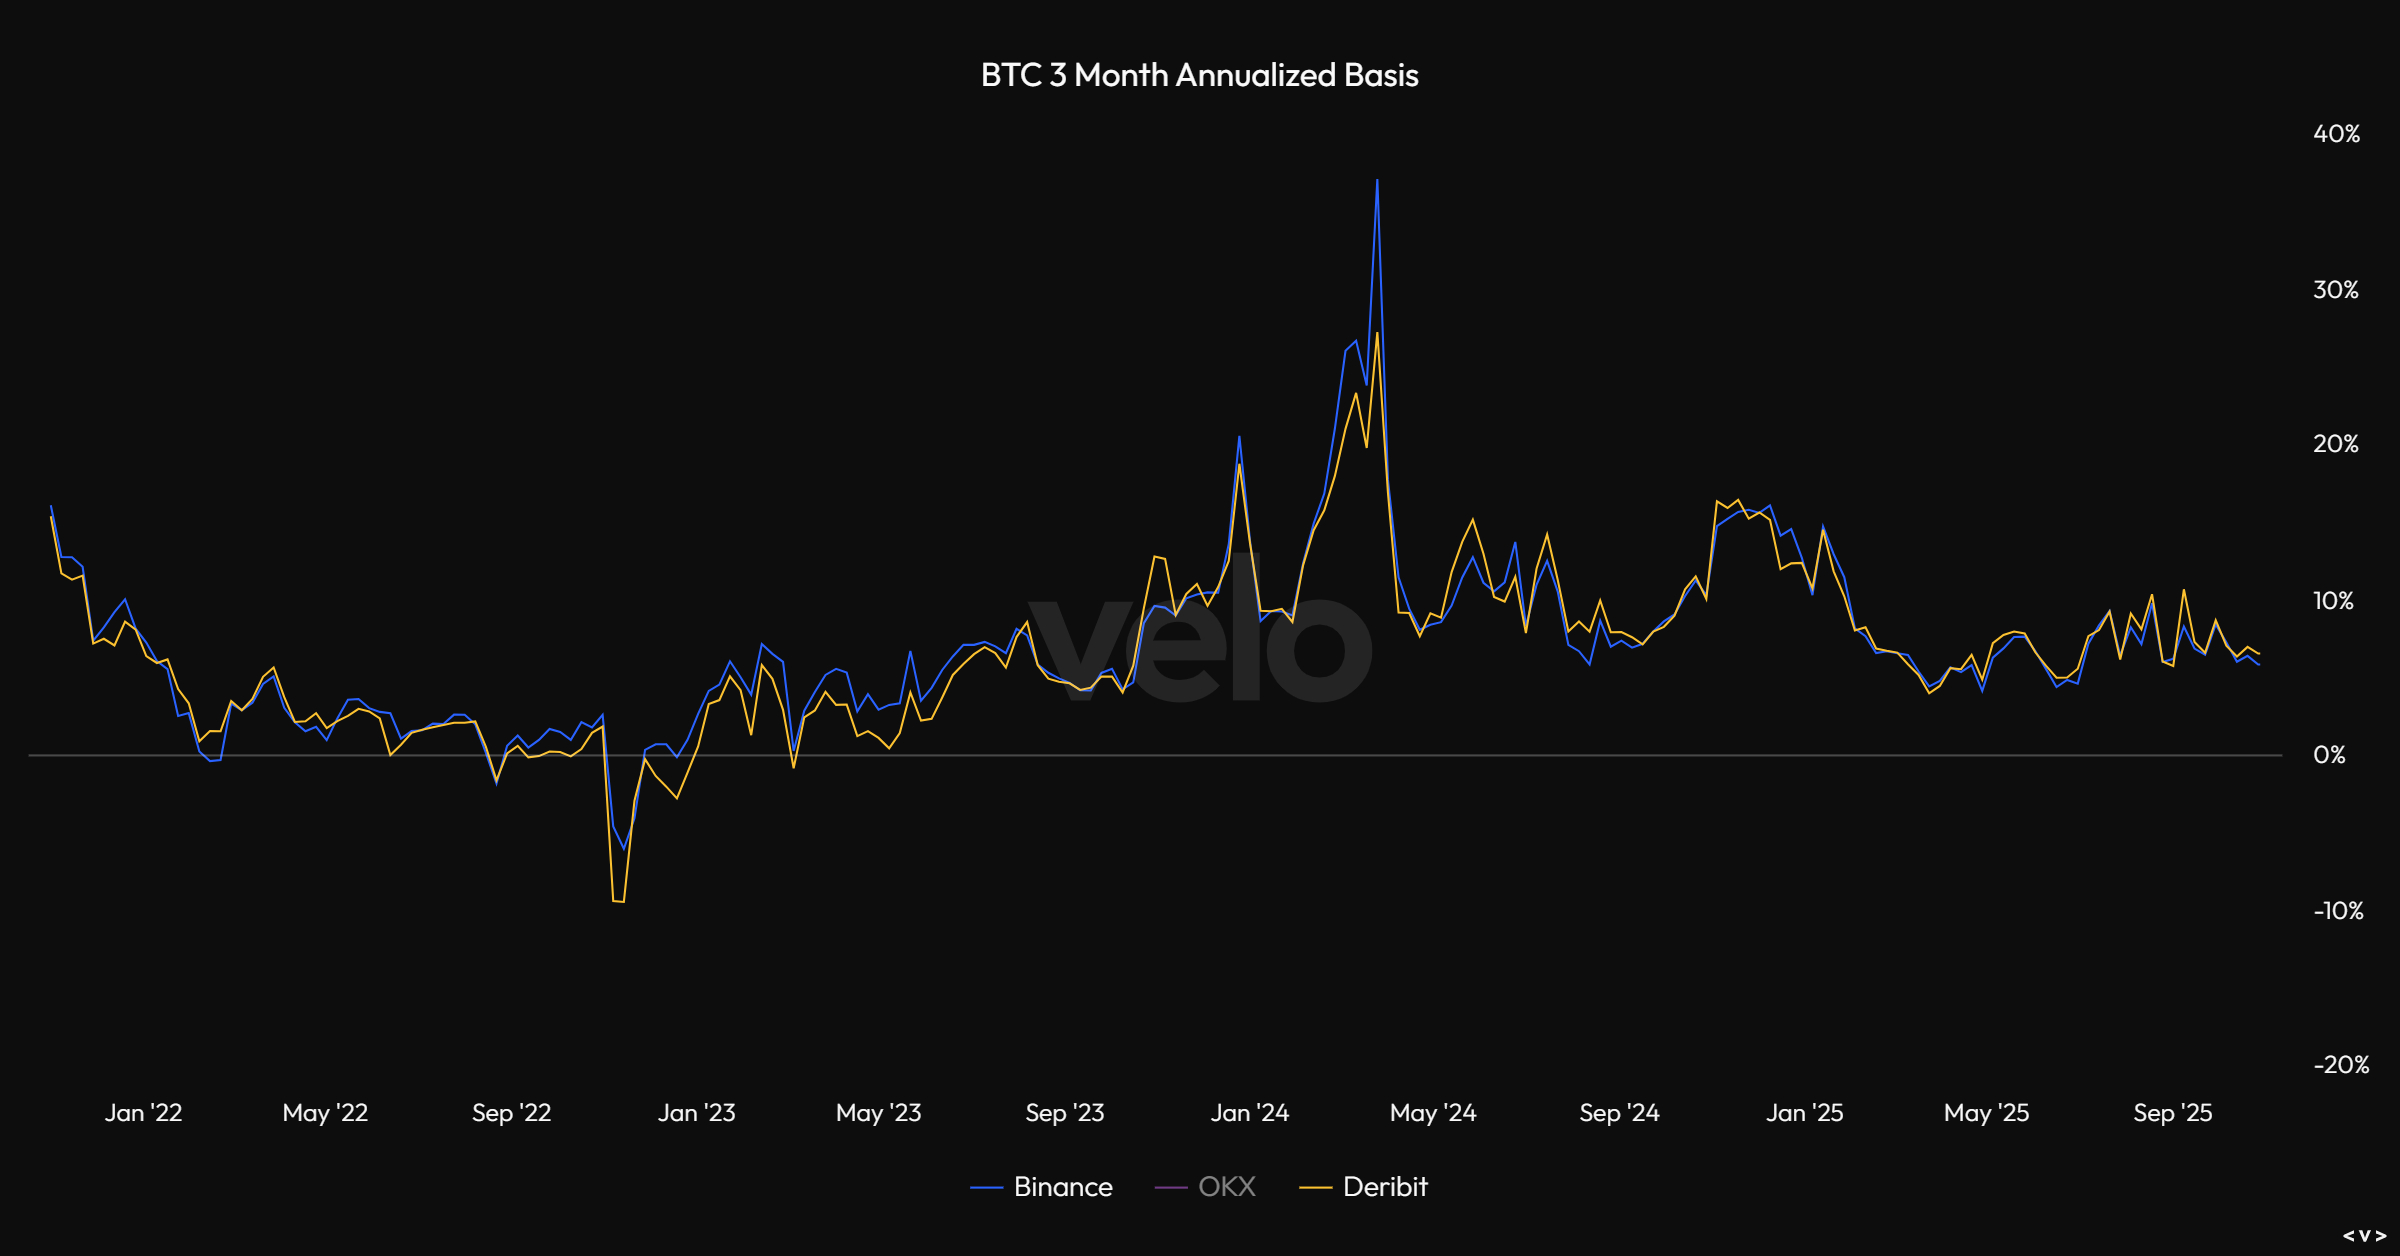
And here's 3-month annualized basis:
And Bitcoin OI vs Altcoin OI:
1.png)
And finally some of the expected 1-week and 1-month liquidation levels:
-2025-10-28_08_28_39.png)
-2025-10-28_08_29_14.png)
Price: $4106
ETH/USD
Weekly:
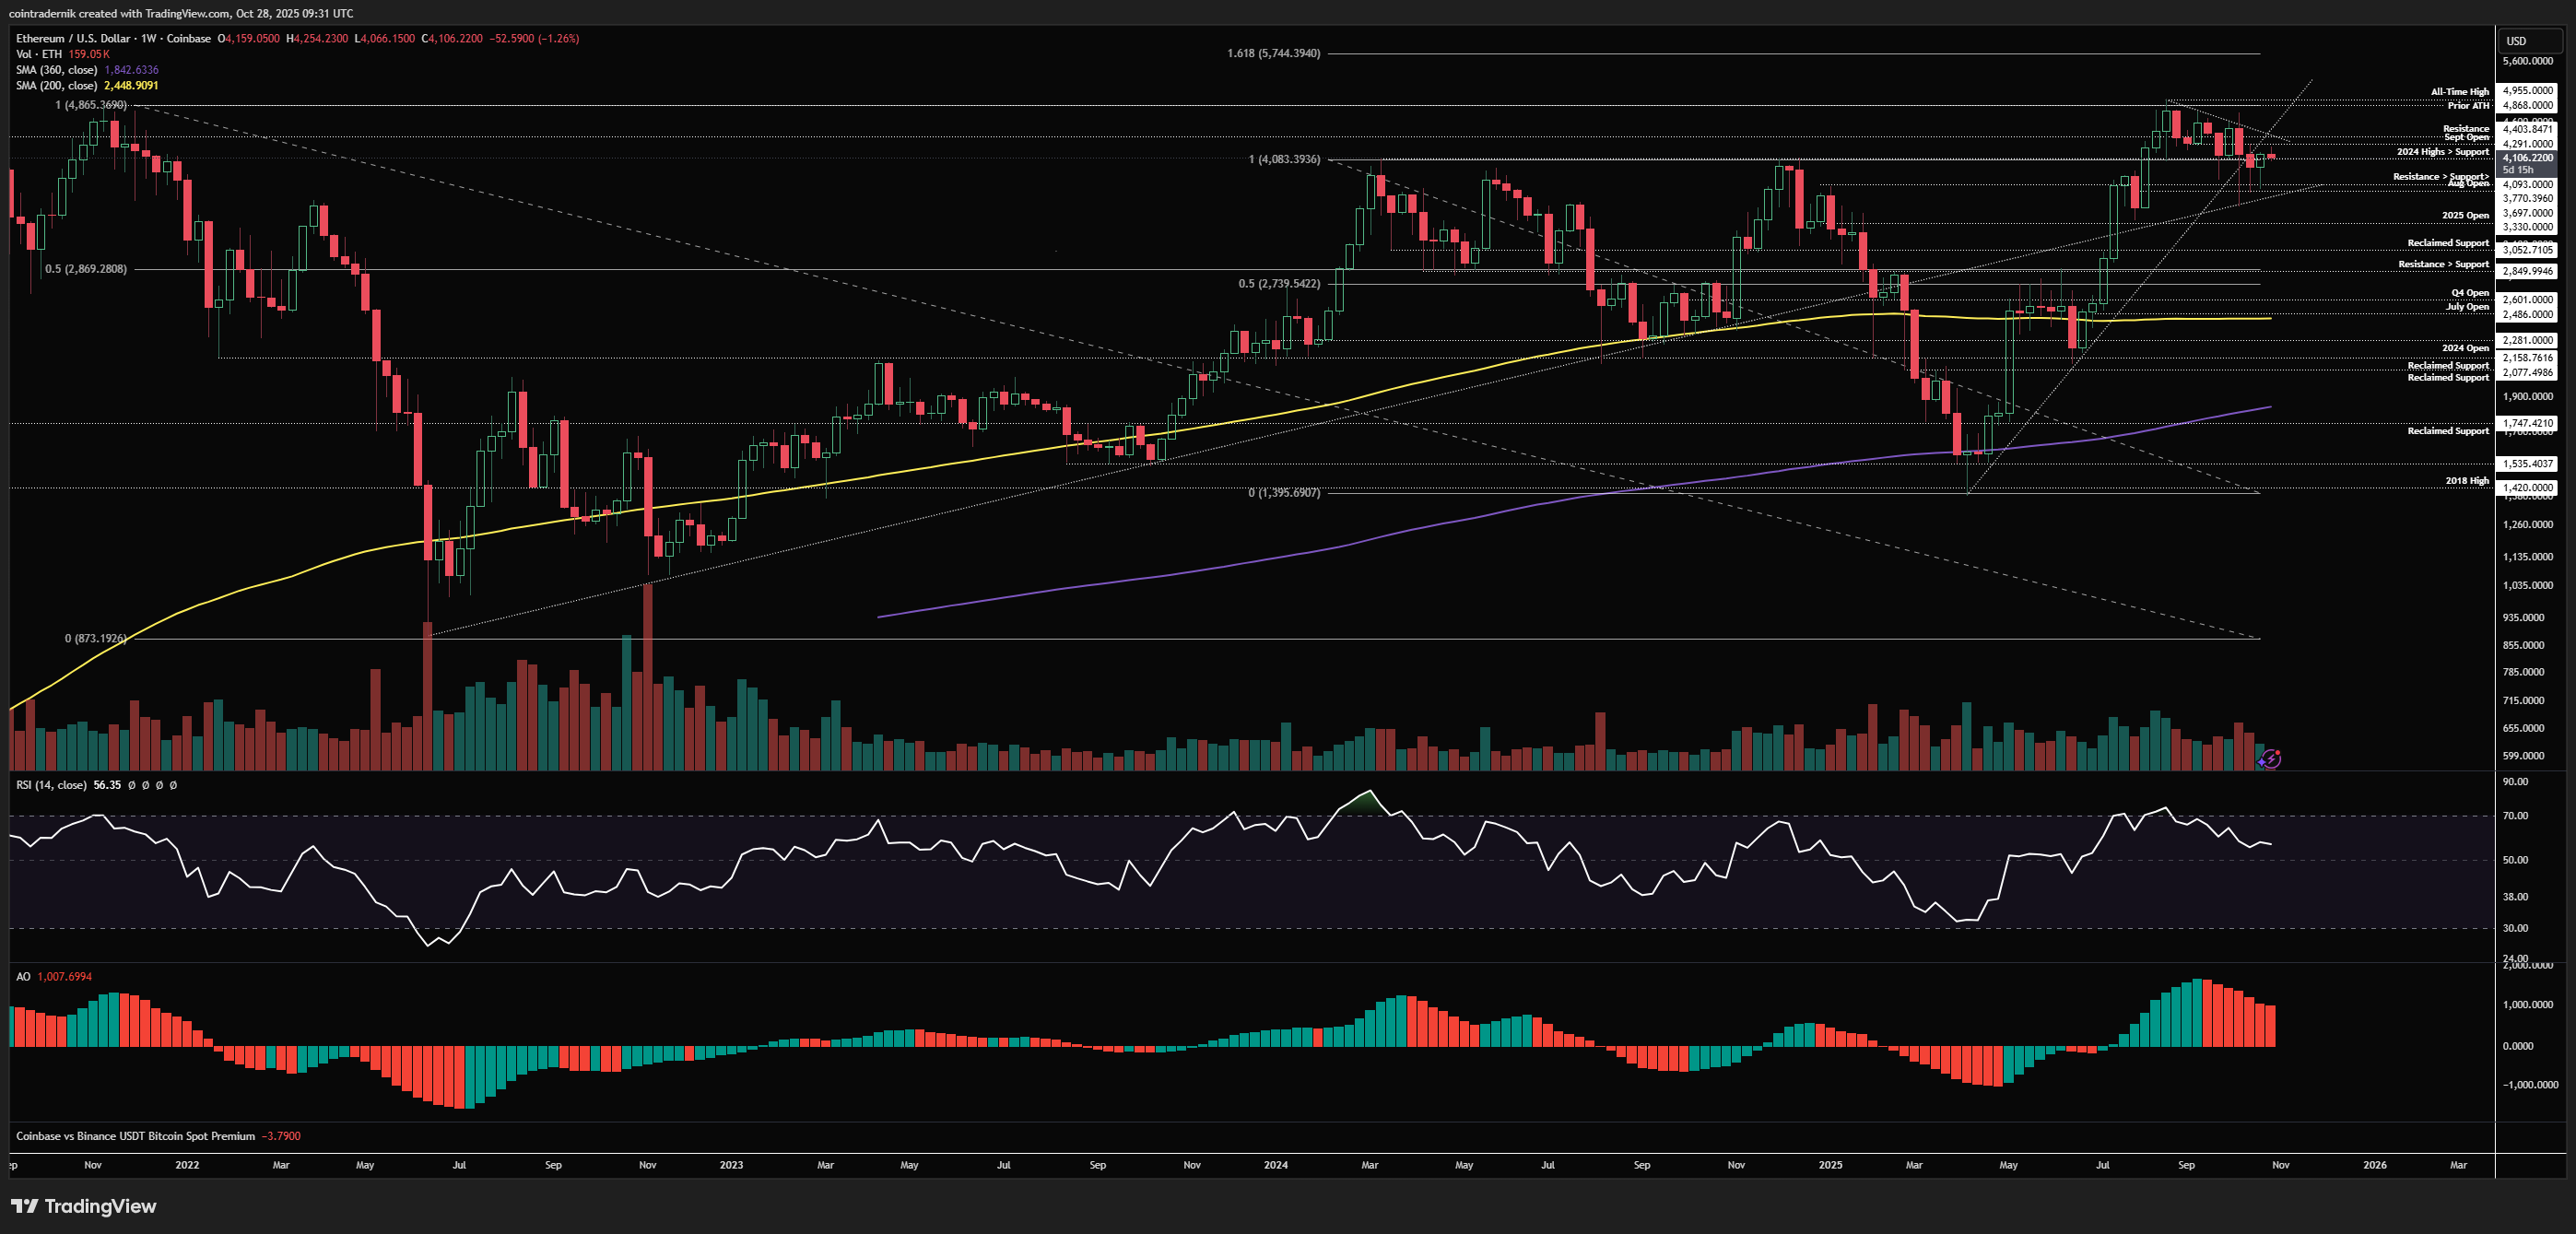
Beginning with the weekly, we can see that price found strong support above the August open last week and closed back above that multi-year resistance turned support at $4093. We absolutely now want to see this swing-low formation hold and price push higher off this reclaim of support, where a weekly close through trendline resistance and that $4400 level would lead to an all-time high retest and, in my view, a breakout in early November. Rejection below the trendline this week and then weekly close back below $4093 would look pretty awful to be honest and would open up all of those wicks getting taken out back towards the 2025 open at $3330...
Daily:

Turning now to the daily timeframe, we can see that daily structure has turned bullish with the series of higher-lows and higher-highs but price is now contesting multiple VWAPs overhead as it consolidates right on that $4093 level. Daily RSI has reclaimed 50 and we want to see the momentum shift stick, with a push off this higher-low this week into $4400, with a weekly close above that level being a very strong signal for the rest of Q4. As I mentioned in the Outlook after the Oct 10th candle, I think the Q4 lows for ETH are in and we should see strength from Nov into Q1 of next year. If we can hold $3973 intraweek and then close above the anchored VWAP from the all-time high ($4280ish), I think we're good to go for a trendline breakout and then that $5000 retest.
ETH/BTC
Weekly:
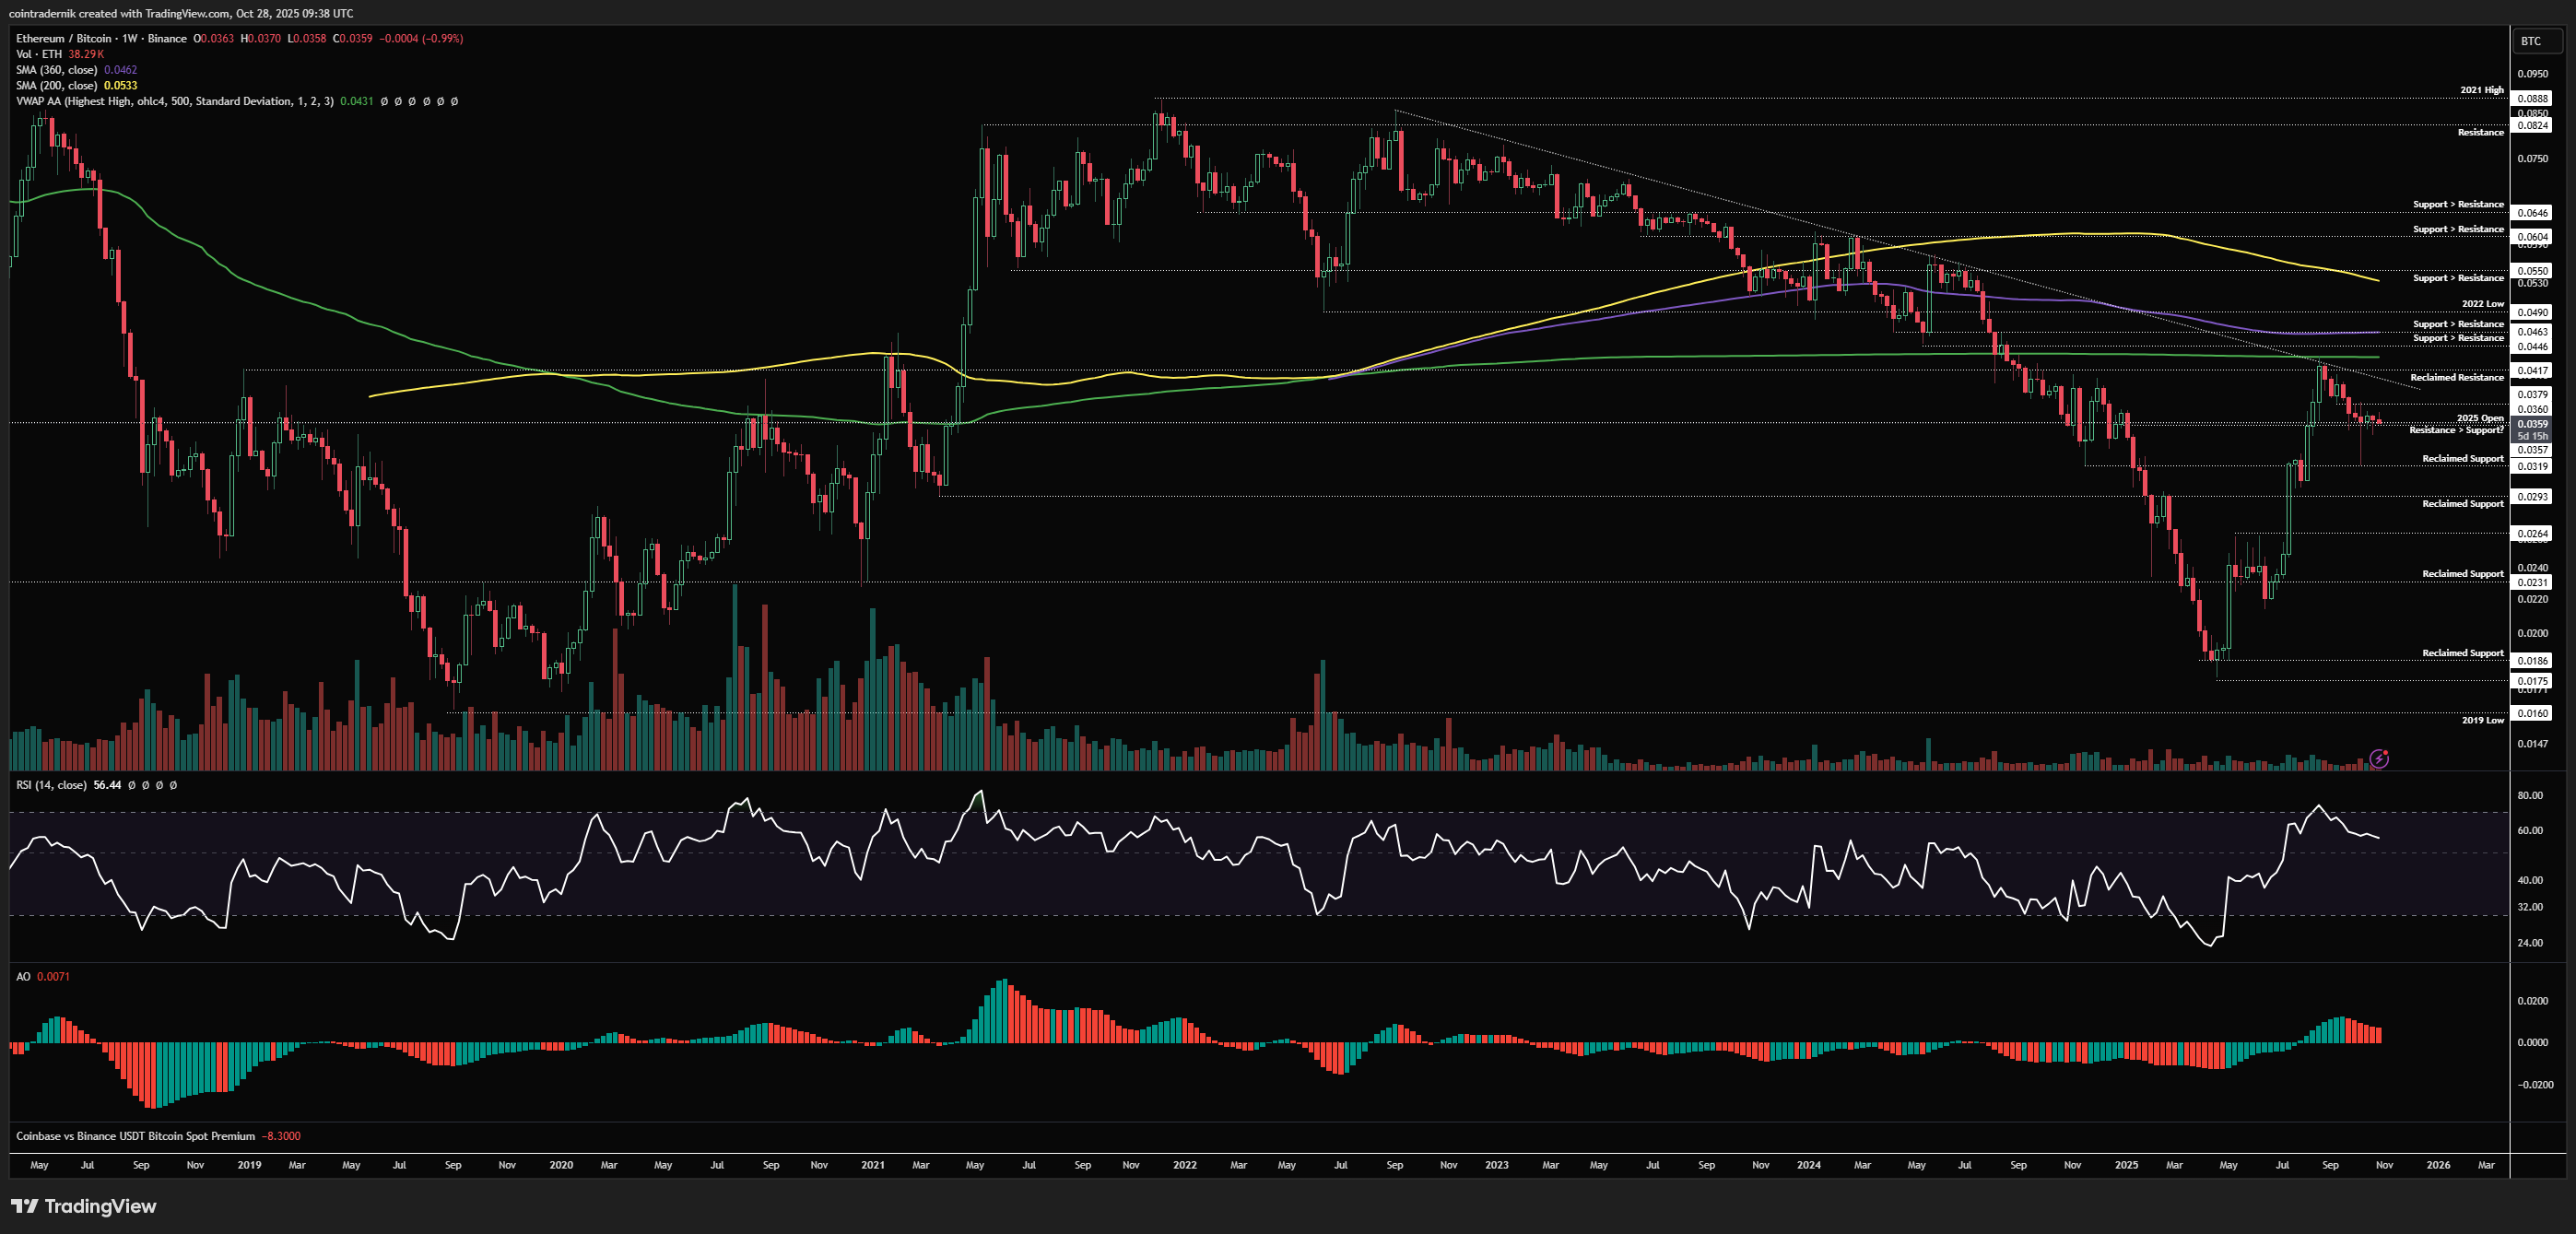
Looking at the weekly timeframe for ETH/BTC, again I will reiterate that I believe the Q4 low is in for the pair and that we are now just consolidating before continuation higher through long-term trendline resistance and the anchored VWAP from the all-time highs, above which I think ETH/BTC pushes towards 0.055. Whilst we continue to chop around within the weekly range of that capitulation candle there isn't much to discuss to be honest, and what we should be looking for here is a weekly close above the high of that weekly range, which is around 0.038; close above that and I think we retest 0.0417 swiftly, where a weekly close through trendline resistance leads to that next leg higher into year-end and beyond. There remains nothing bearish about ETH/BTC on this timeframe whilst we are above 0.0294.
Daily:
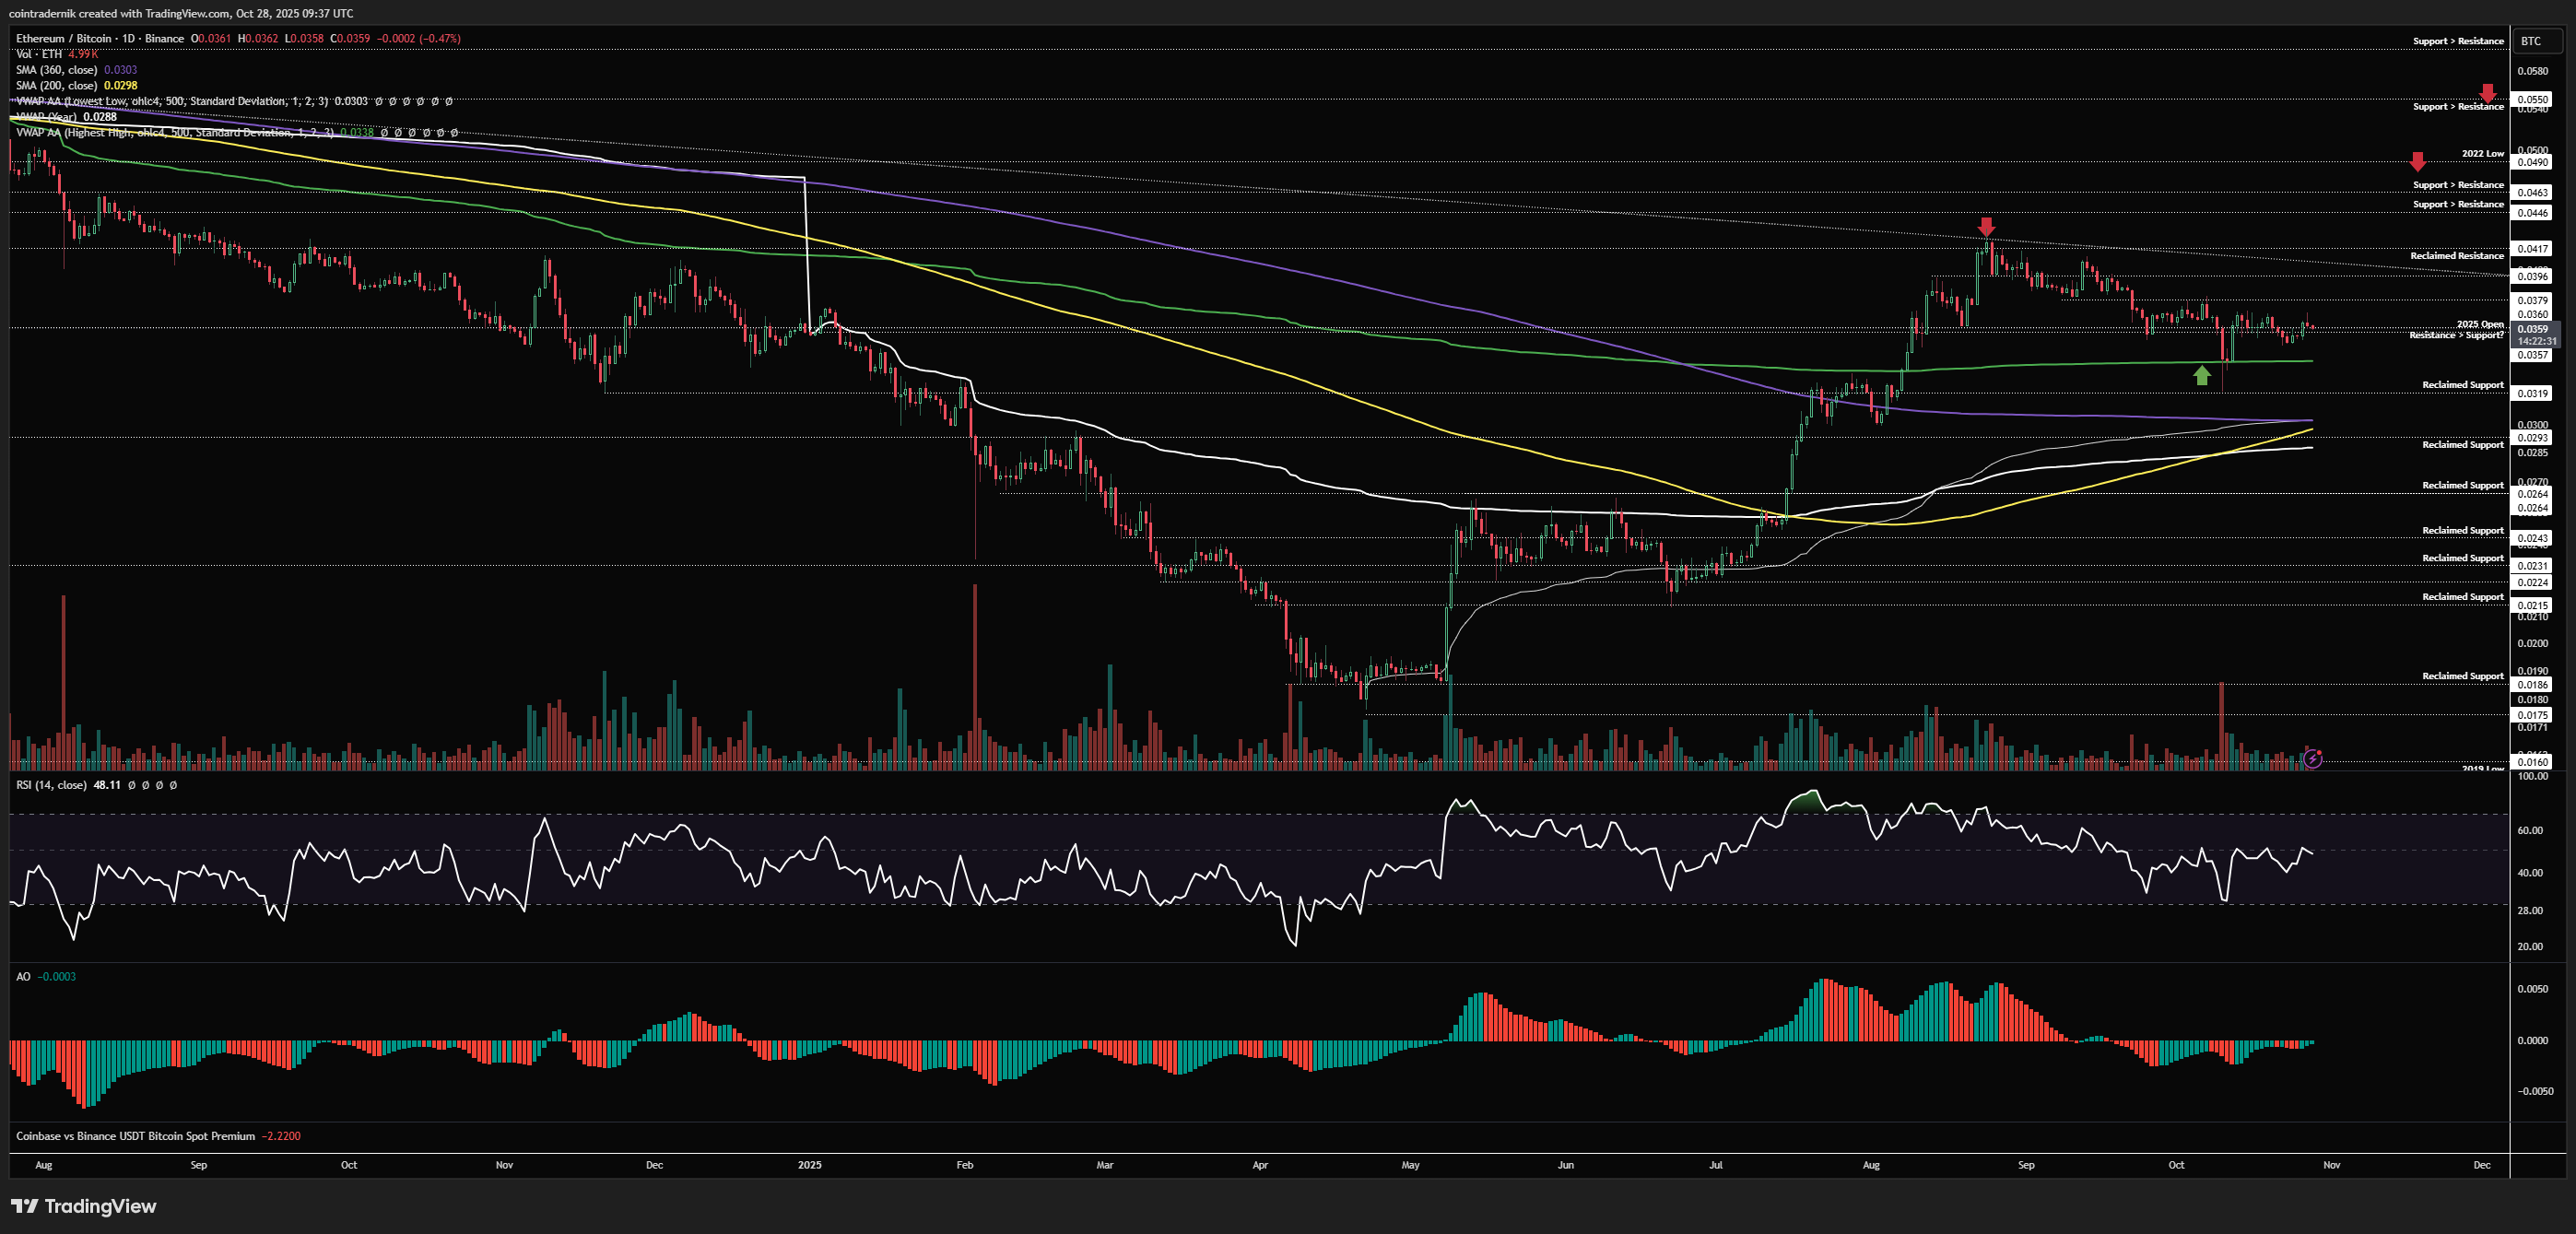
Turning to the daily, we can see that price is really just consolidating right on the yearly open after that capitulation lower, with no real momentum or structure present here. A close above 0.038 would turn daily structure bullish and if this is validated with higher-highs on momentum indicators then we have the beginnings of our move towards 0.055 in my opinion. Acceptance below 0.034 would be short-term bearish and lead to another sweep of 0.0319 into that major support cluster below, but, as I said above, whilst we are above 0.0294 this all looks like consolidation within a broader uptrend. We've had our price capitulation after the major run-up and now we're in the time capitulation phase, in my view, and flipping 0.038 into support is where that time capitulation ends.
Receive the latest updates directly to your inbox

Price: $3905
Weekly:
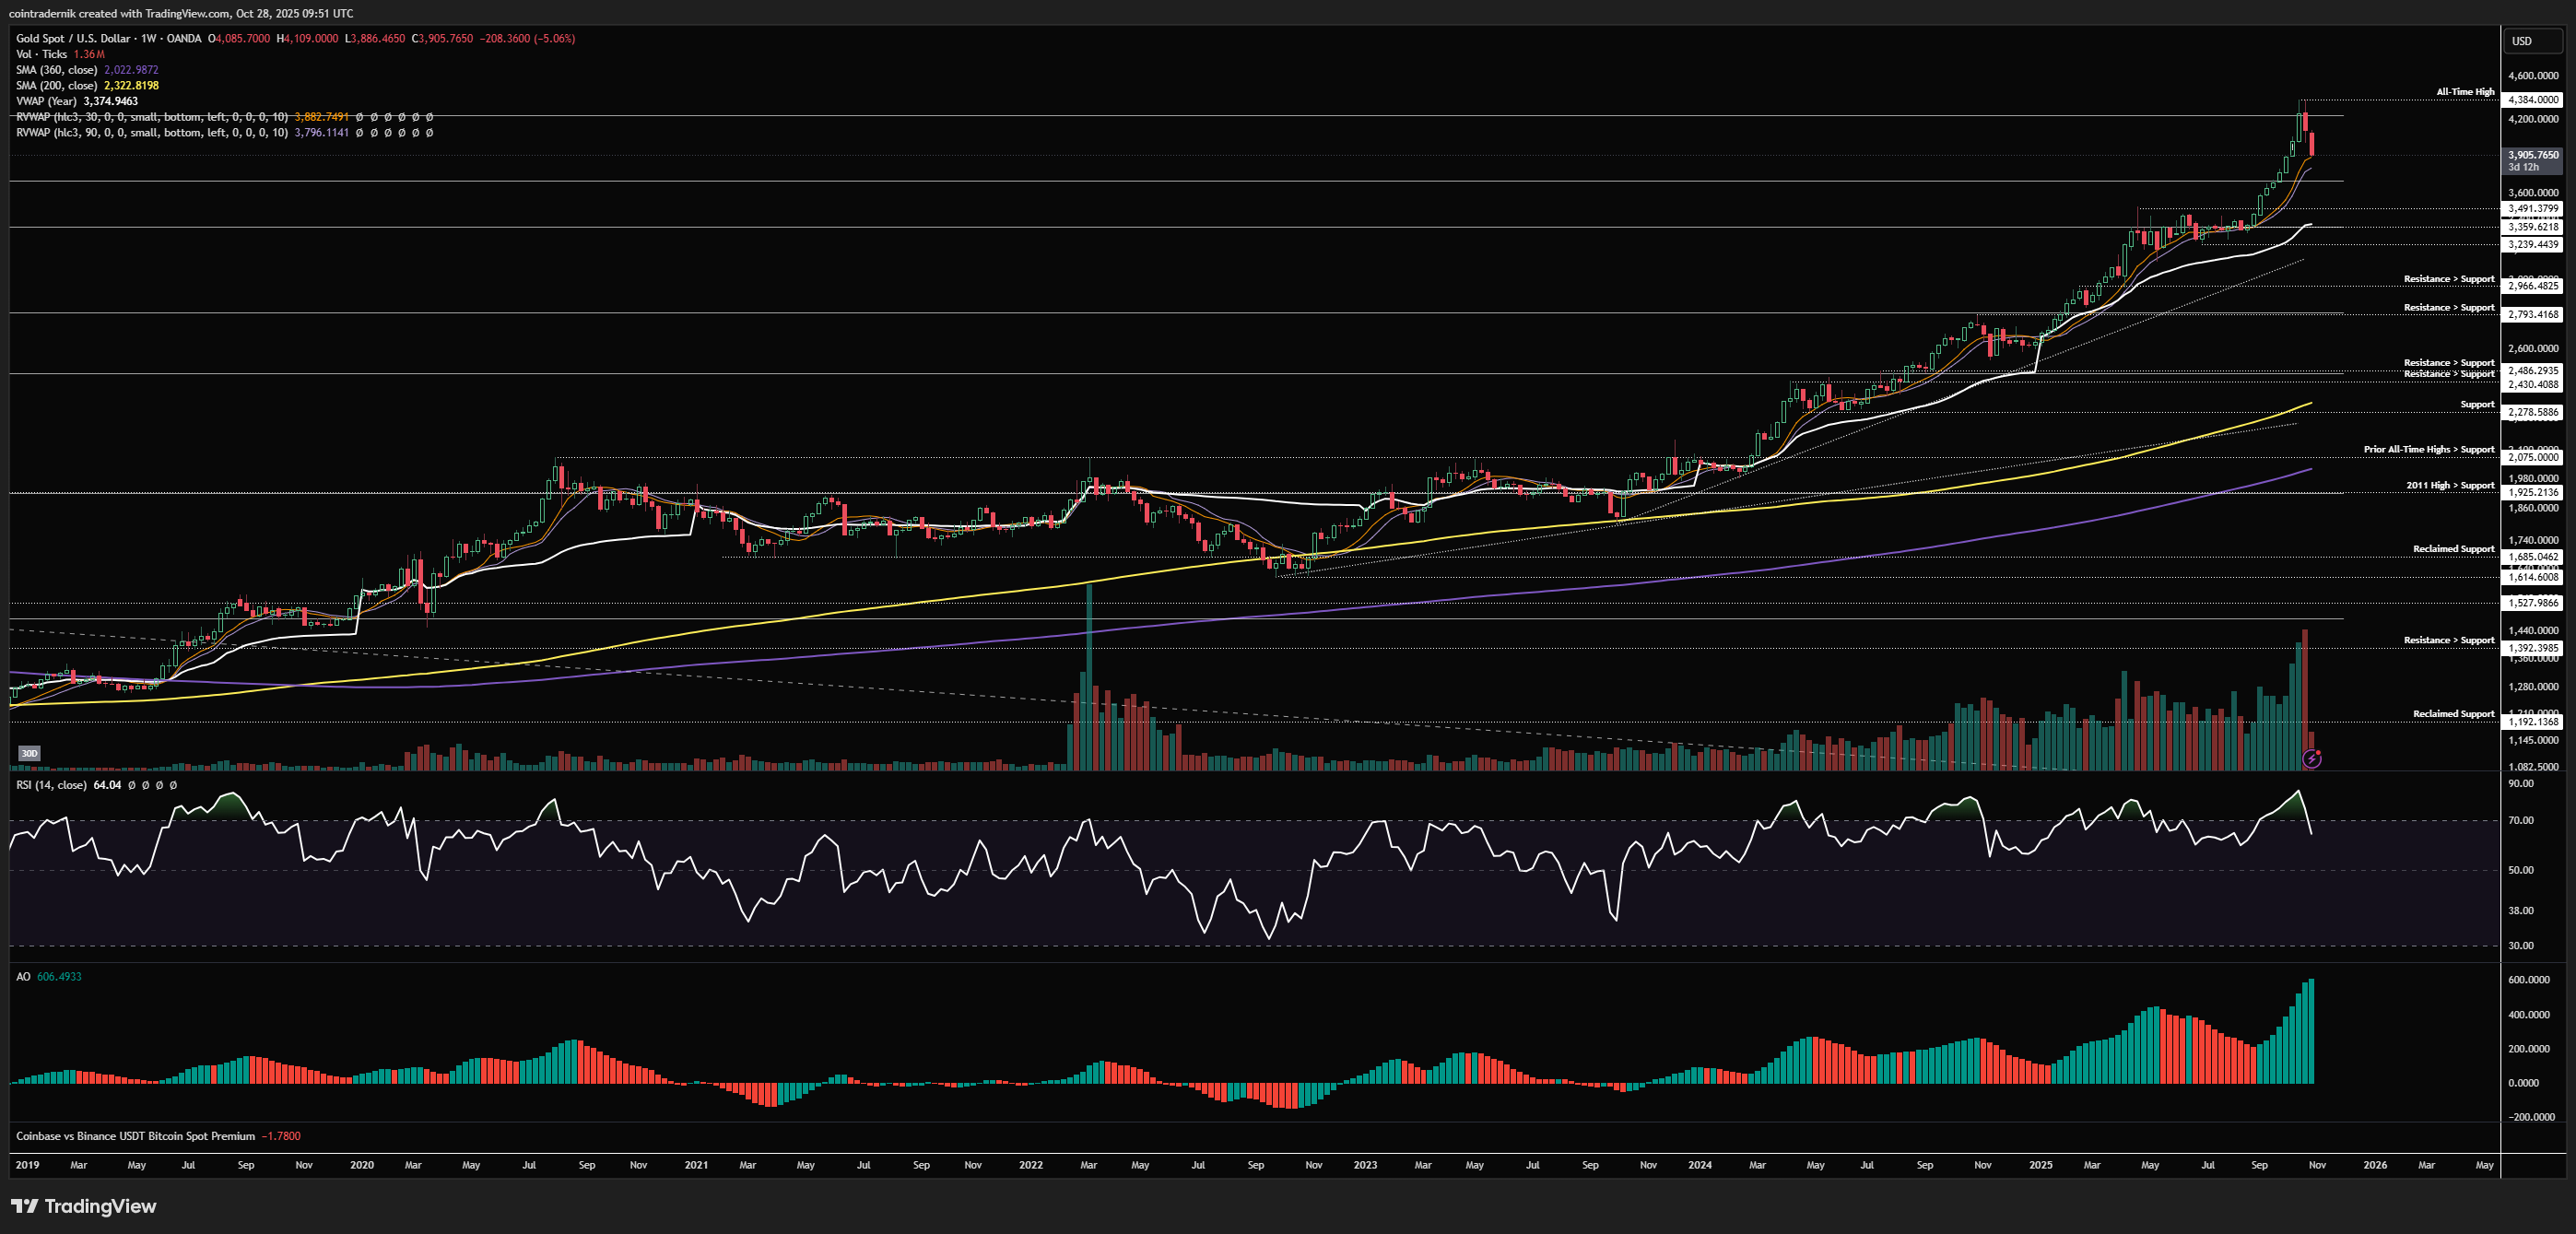
Beginning with the weekly on Gold, we can see that price rejected hard below $4400 a couple of weeks ago, marking a major top on historic volume with price now retracing into $3900 as of today. Weekly structure is obviously still bullish and I fully expect it to remain so and momentum is still in a series of higher-highs and lows, but there is no doubt that the masses lining up to buy at $4400 will be feeling the instant pain here, and more so those overweight miners into the highs. We are now trading back into the 30-day rolling VWAP with the 90-day just below at $3800ish, but we have no other major levels on this timeframe to look towards given the 9-week run higher with no pullbacks, thus $3500 as a prior all-time high turned range resistance is the only level to mark out. I do not expect we reach that level, to be honest, though obviously I'm not betting on that; instead, right now my view on Gold is that we are speed-running the downside and what will follow is a relatively long period of consolidation before continuation higher. Where this range forms is anybody's guess at present but I am expecting $3600ish to be an absolute floor given the strength of the bid. On the more tactical side, perhaps there will be a nice first-touch long at the $3800 level when we trade into it...
Daily:

Looking at the daily, we can see just how brutal the sell-off has been, with price already 11% below the $4384 swing-high in less than 7 days. If we look at the April top, we traded 9.8% off that high into the low at the 90-day rolling VWAP within a few weeks of the high and then consolidated; given how overextended we were this time, we have pushed lower much faster and are within a few percent of that same VWAP but having already drawn down more than April into May. We have overhead resistance at $4100 which I expect to hold on any bounce - at least on the first attempt - and what we could look for here is to play $3800 long into $4050 if we get the setup on the lower timeframe. My general expectation from here is that we form a local low over the next few days and then get a deadcat bounce into that confluence of resistance in November, from which we begin that period of range-bound price-action into year-end, allowing breath room for the rest of the risk curve to play ball.
Price: $6879
Weekly:
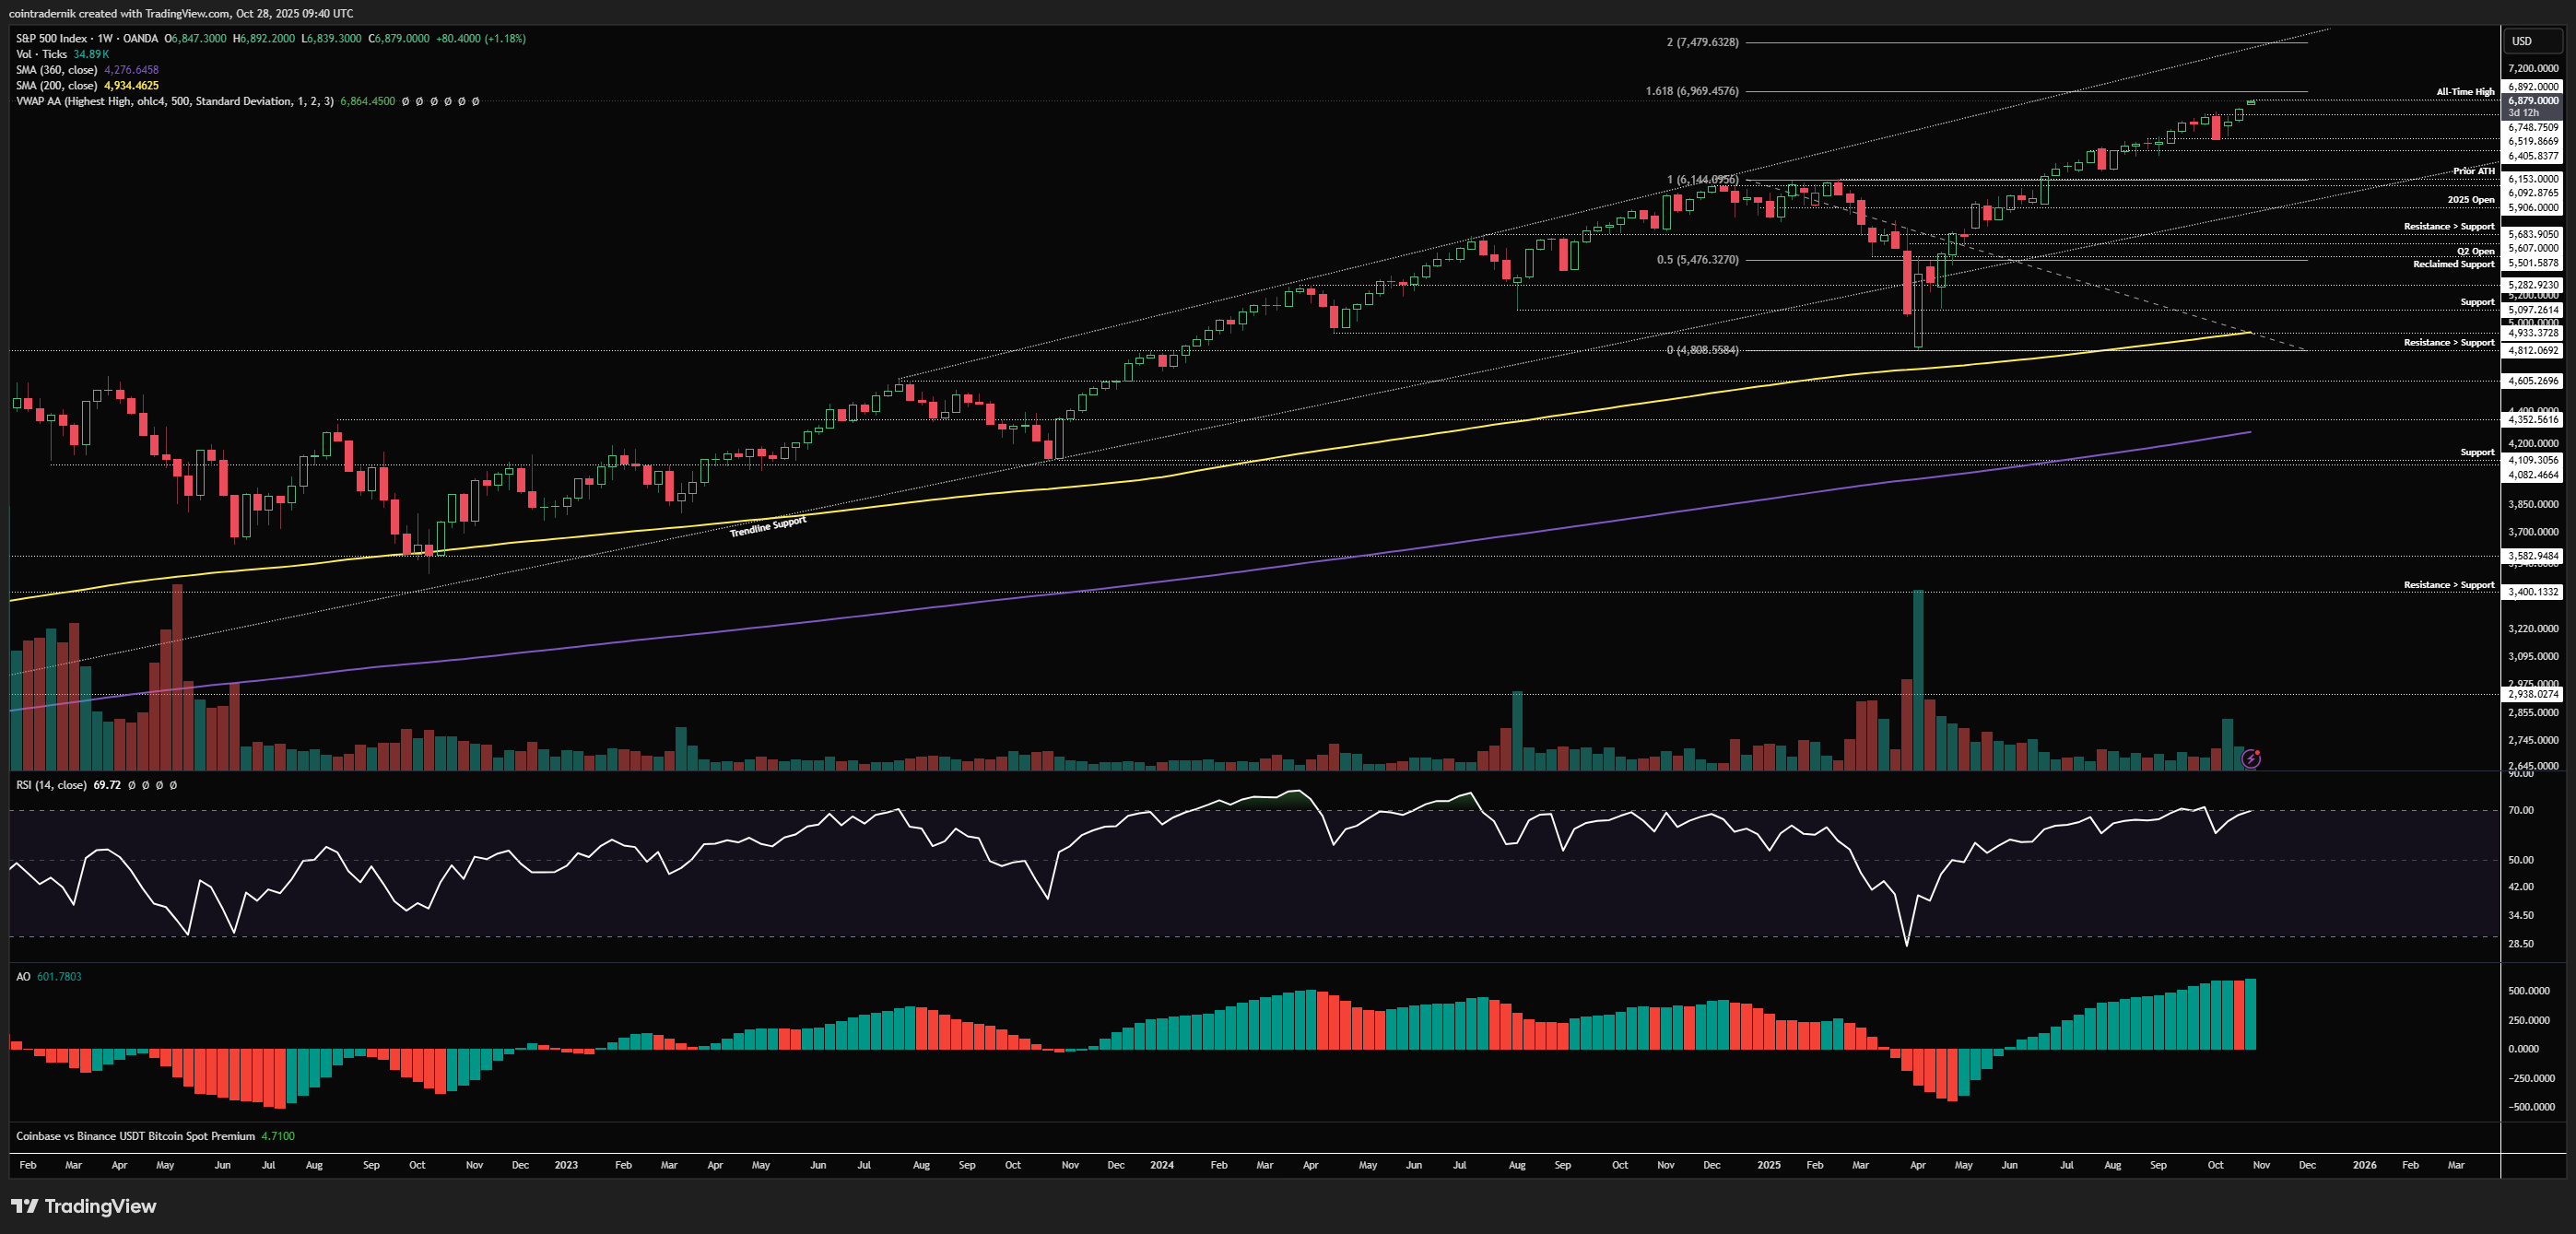
Beginning with the weekly for SPX, we can see that price did exactly what we expected and then some after the bottom formation at $6520, v-reversing off that low as vol indices diverged to close last week firmly above the prior high at $6847. We then gapped up early this week into $6892 as the current high, only a couple of percent off my year-end target of $6970. Given that I have been levered long equities since April, I will be taking some off the table here this week but leaving plenty on the table for continuation higher into Q1, given we have no signs of momentum exhaustion nor extreme froth in sentiment and positioning. If we get some month-end profit-taking and dip into the first -week of Nov, a retest of $6770ish could make for a nice long. It is worth keeping in mind that we are emerging from the buyback blackout with the strongest period of seasonal flows ahead: given we continue to see sentiment and positioning cautious into all-time highs, I think we run beyond $7000, though I will be keeping a close eye on all of those measures as we cross that level as I expect the wall of worry to dissipate somewhat and true animal spirits to emerge as the post-7xxx confidence becomes clear. Maybe I'm wrong and we run this up another 5% with everyone still trying to fade it, but I do think the year-end spirit will take hold soon and I think it happens above 7000. (This does not mean you should be shorting this market for more than a couple of days, in case it needed to be said - at least not yet.)
Daily:

Looking at the daily, again there is no sign of momentum exhaustion yet and we could see price push into $6950 this week before any local resistance is found. I do think after several gap ups on cash SPX and month-end in view, if we do trade into $6950 today or tomorrow that would absolutely be a nice place to take some profits short-term. Depending on how ballsy you are and whether the setup presents itself, you could even look to play $6950 short for a few days into early Nov to potentially fill some of the gap towards $6770 or so. Above $7000, as I mentioned, I think that's where you get momentum really kicking in and late buyers stepping in to chase the rally. Not much else to add here for the time being...
Price: $60.38
Weekly:
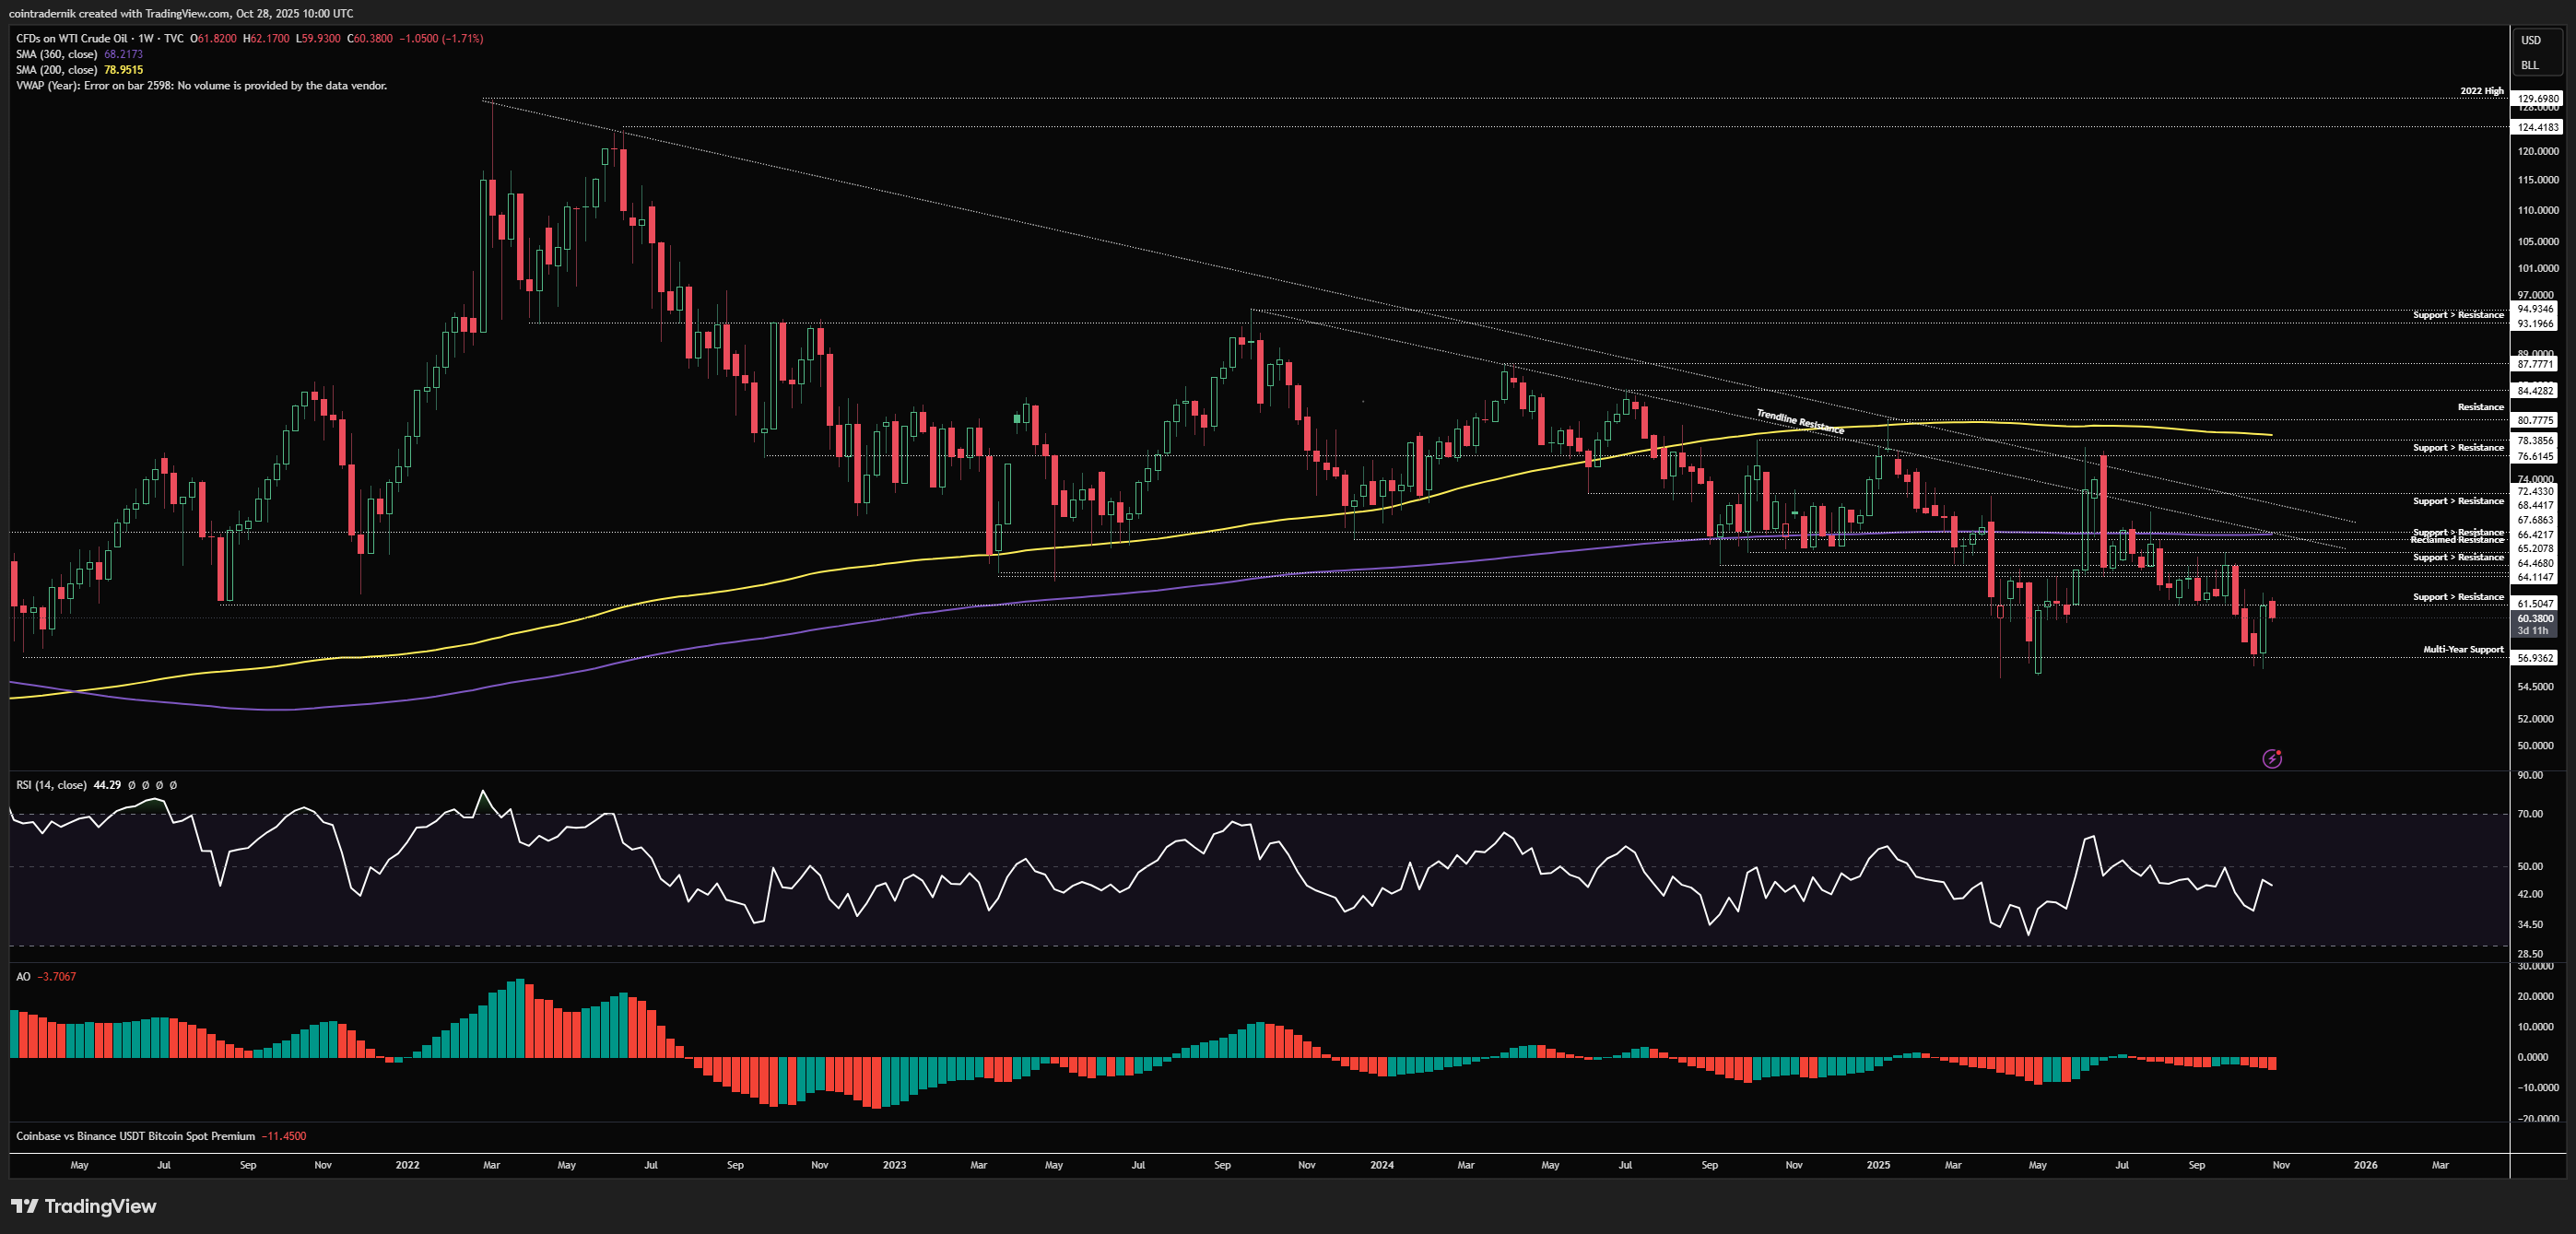
Beginning with the weekly view for Oil, we can see that price traded into multi-year support as expected and bounced hard, engulfing the prior weekly candle to close last week at $61.82, right around prior support turned resistance. I would now expect to see some consolidation here, but if we see a flush of last week's low that squeezes late longs into this local resistance whilst also trapping breakdown shorts below $56.90, I would be a buyer of that, as I'll outlined on the daily. Ultimately, I do expect we see more sideways chop but price to eventually retest the upper trendlines over the coming weeks. Only acceptance below $56 would look like we need to find some new support levels...
Daily:
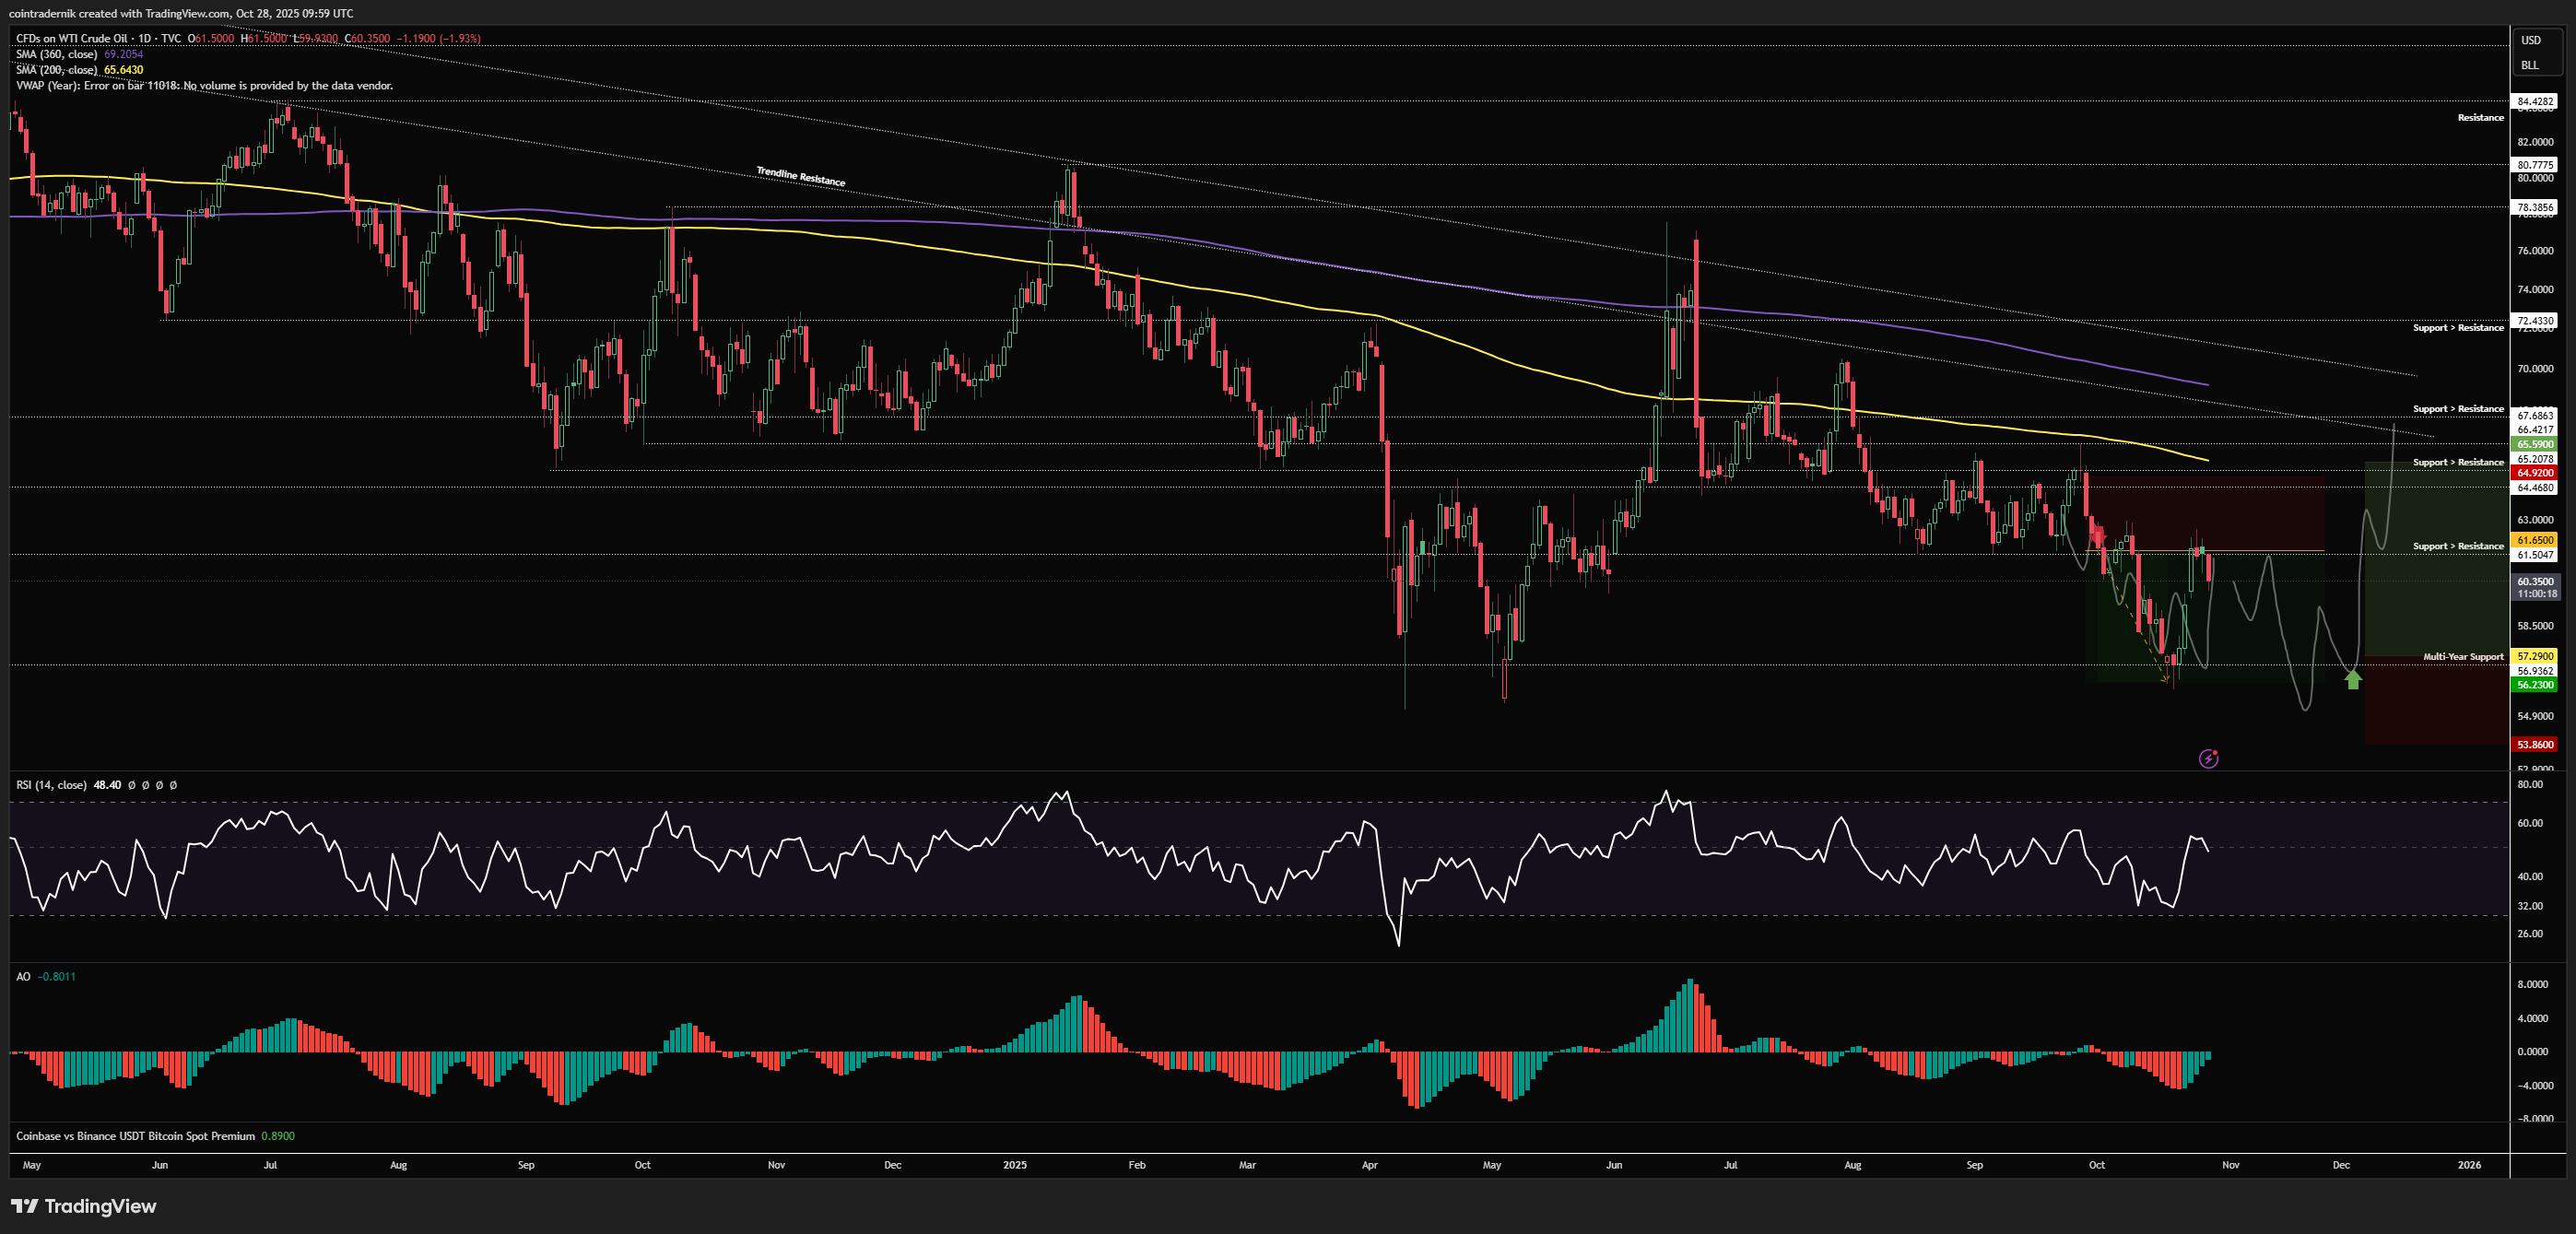
As you can see on the daily, the move below $61.50 played out almost identically to what I had marked out a few weeks ago after the fakeout into the 200dMA. What I am now looking for is last week's low to be run, thus squeezing anyone who bought into the highs last week, with shorts likely to get excited below $57. As such, I want to buy a sweep and reclaim of last week's low if we get it, holding that for a run into $66ish. That would be a high probability setup, in my opinion - and if not, and we instead accept back above $62 here, we can maybe look to fade the run from higher in a few weeks time...
I hope you've found some value in the read this week!
And if you've not already signed up for Ostium, please do so and test out some of the recent updates, including:
Sign up here (you don't have to use my ref link, of course): https://ostium.app/trade?from=CL&to=USD&ref=CTNIK

.avif)