

Market Outlook #56
October 20, 2025
-
12
min read


This blog references an opinion and is for entertainment and informational purposes only. It is not intended to be investment advice. Seek a duly licensed professional for investment advice.
In this 56th Market Outlook here at Ostium Research, we'll be taking a look at the week ahead in markets, focusing specifically on price-action, positioning and event risk for Bitcoin, Ethereum, DXY, Gold and Copper.
Firstly, let's take a look at the calendar, with more speeches than anything else during this US Government shutdown period, but potentially some key data on Friday:
TUESDAY: FED'S WALLER SPEECH
TUESDAY: ECB PRESIDENT LAGARDE SPEECH
WEDNESDAY: FED'S BARR SPEECH
THURSDAY: VARIOUS FED SPEECHES
THURSDAY: ECB PRESIDENT LAGARDE SPEECH
FRIDAY: US CONSUMER PRICE INDEX (MOM) (SEP): (CONSENSUS 0.4% VS PREVIOUS 0.4%)
FRIDAY: US S&P GLOBAL MANUFACTURING PMI (OCT): (CONSENSUS N/A VS PREVIOUS 52)
FRIDAY: US S&P GLOBAL SERVICES PMI (OCT): (CONSENSUS N/A VS PREVIOUS 54.2)
Now, let's dig into asset-specific price-action for the week ahead, looking firstly at Bitcoin:
Price: $111,027
Weekly:
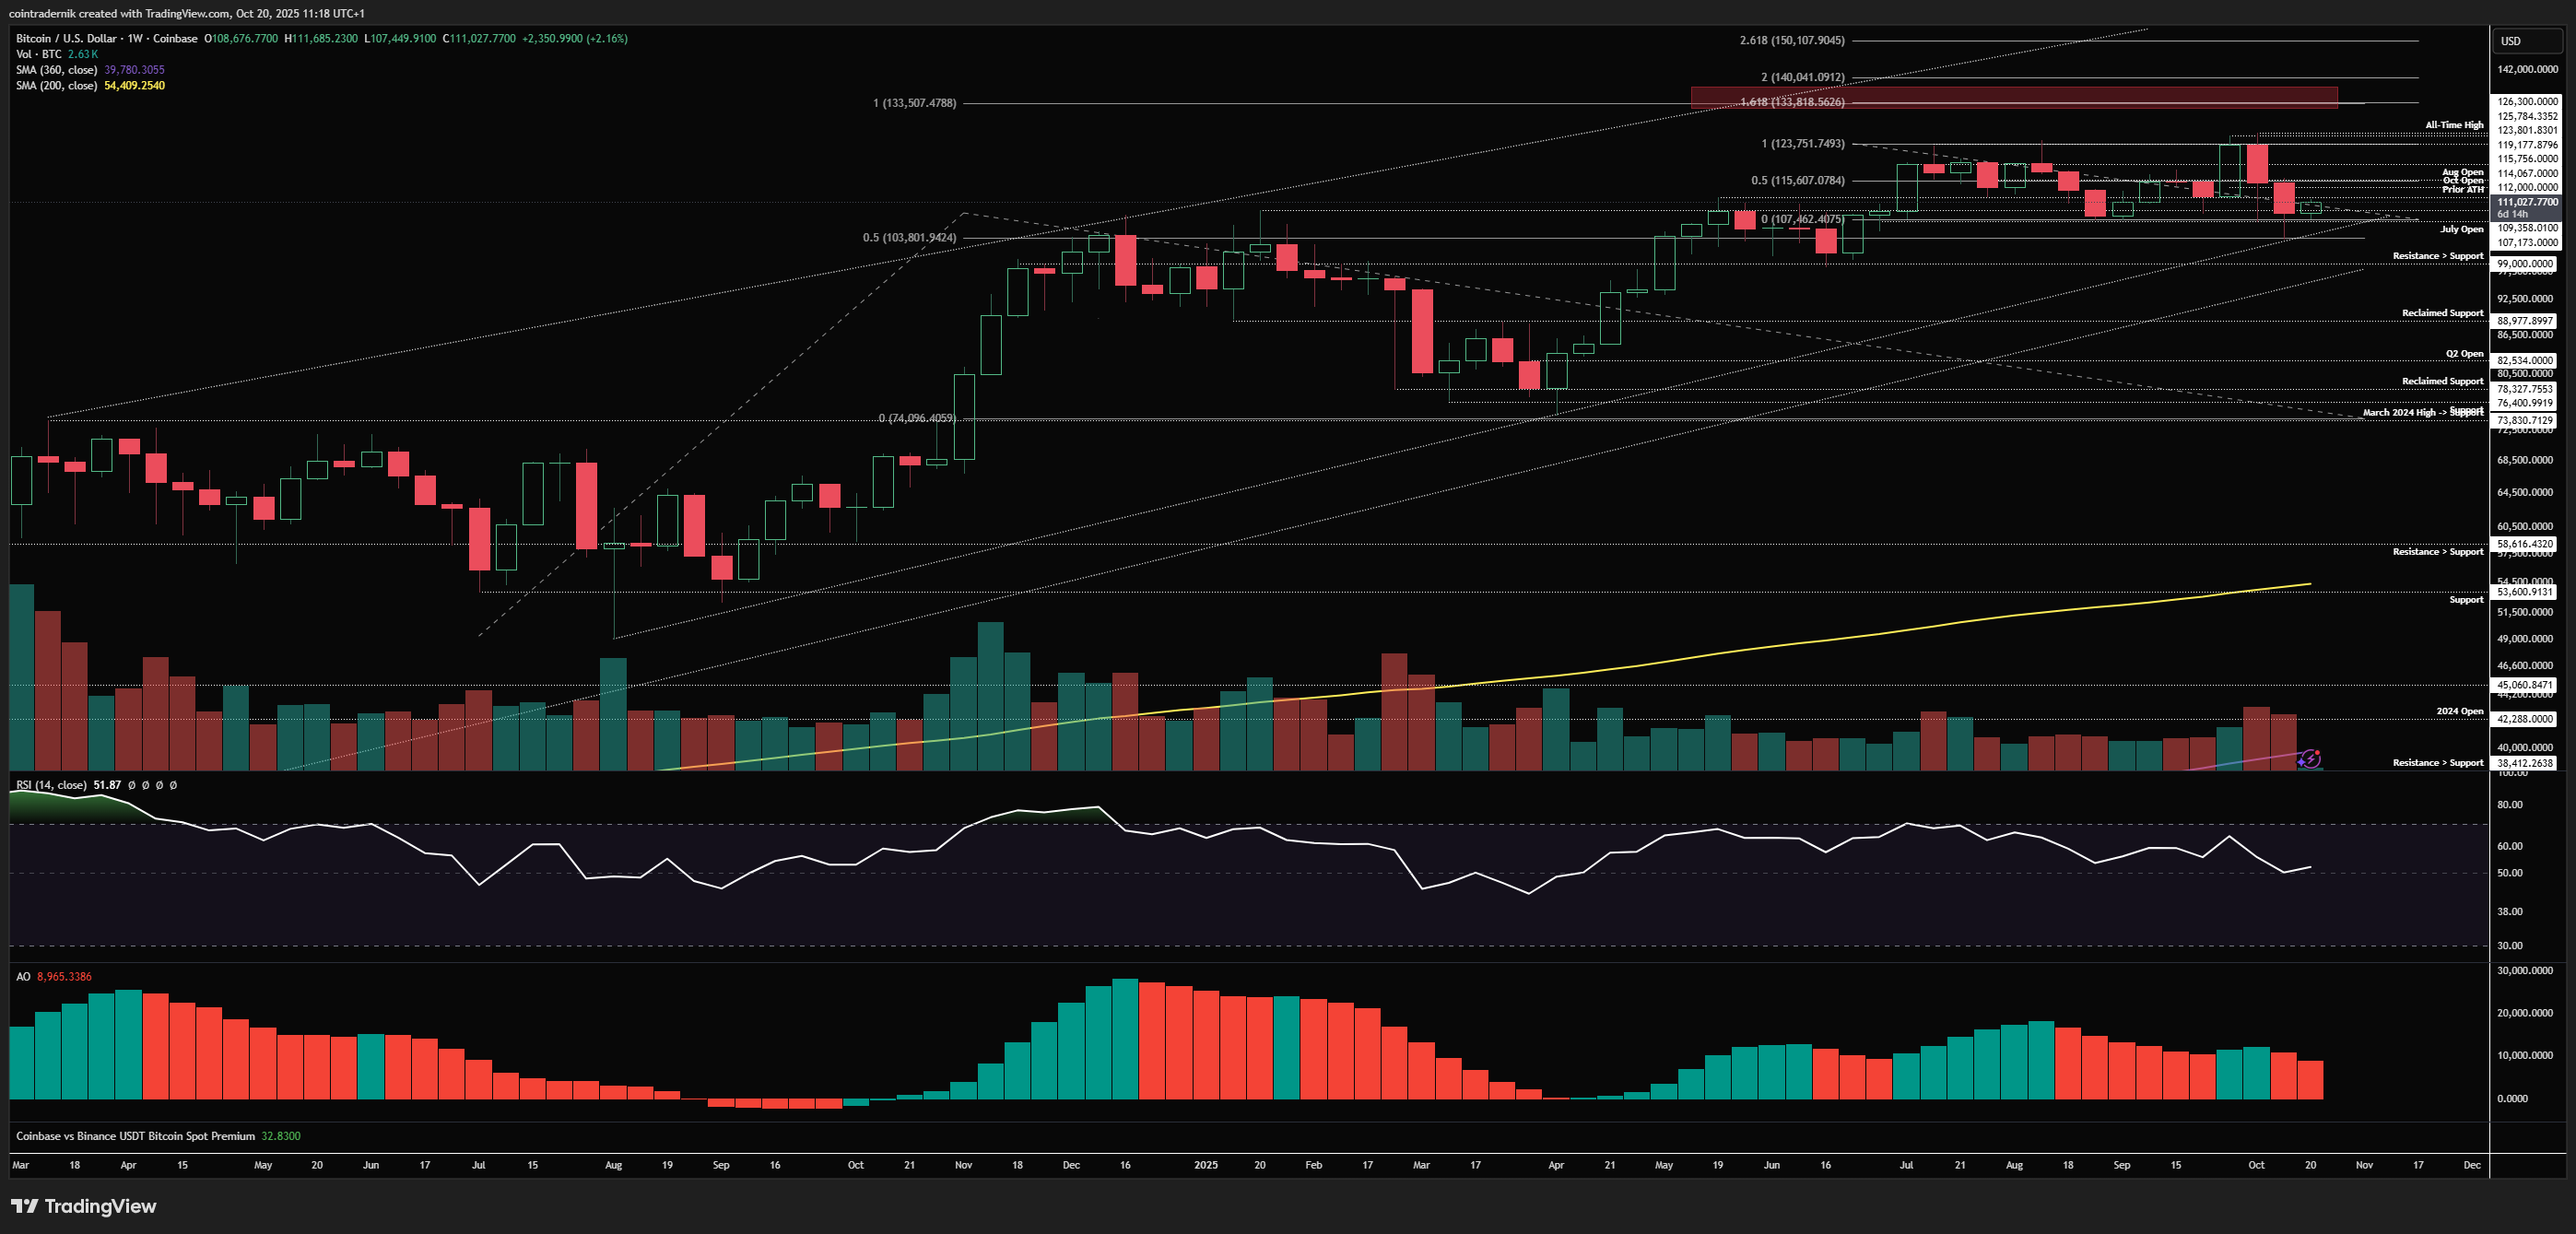
Beginning with the weekly view for Bitcoin, we can see that price wicked below the prior weekly low into $103.8k, clearing up the bottom of the range and the clean lows around $107.5k before bouncing to close back above that support, which was a promising start. In some sense, Bitcoin effectively has just taken out the top of the multi-month range into a fresh all-time high and then taken out the bottom of the range only to trade back inside, with that range being $107k as support and $124k as resistance. What I am expecting to see here is that confluence of support below hold firm this week and price to push higher, with any weekly close above last week's high and the mid-range at $115.6k confirming the bottom is in, in my view, where I still am of the belief that we trade higher again into all-time highs by end of October (going into early Nov). There is plenty of confluence with Oct FOMC and the Nov 1st China tariff deadline around that monthly close for a major pivot, and I continue to be of the view that November will be a very strong month with tailwinds into early December. Invalidation of this view would be acceptance below the swing-low at $99k (which is confluent with a number of key VWAPs and MAs across timeframes) - a wick below that level would be fine, but flipping it into resistance would open up much more downside. If we can close this week above $116k, I think we trade into that $133k fib area in early Nov; if we chop around again this week below $116k but hold above support from last week, then I'd push that expectation out a week or so into mid-Nov.
Daily:
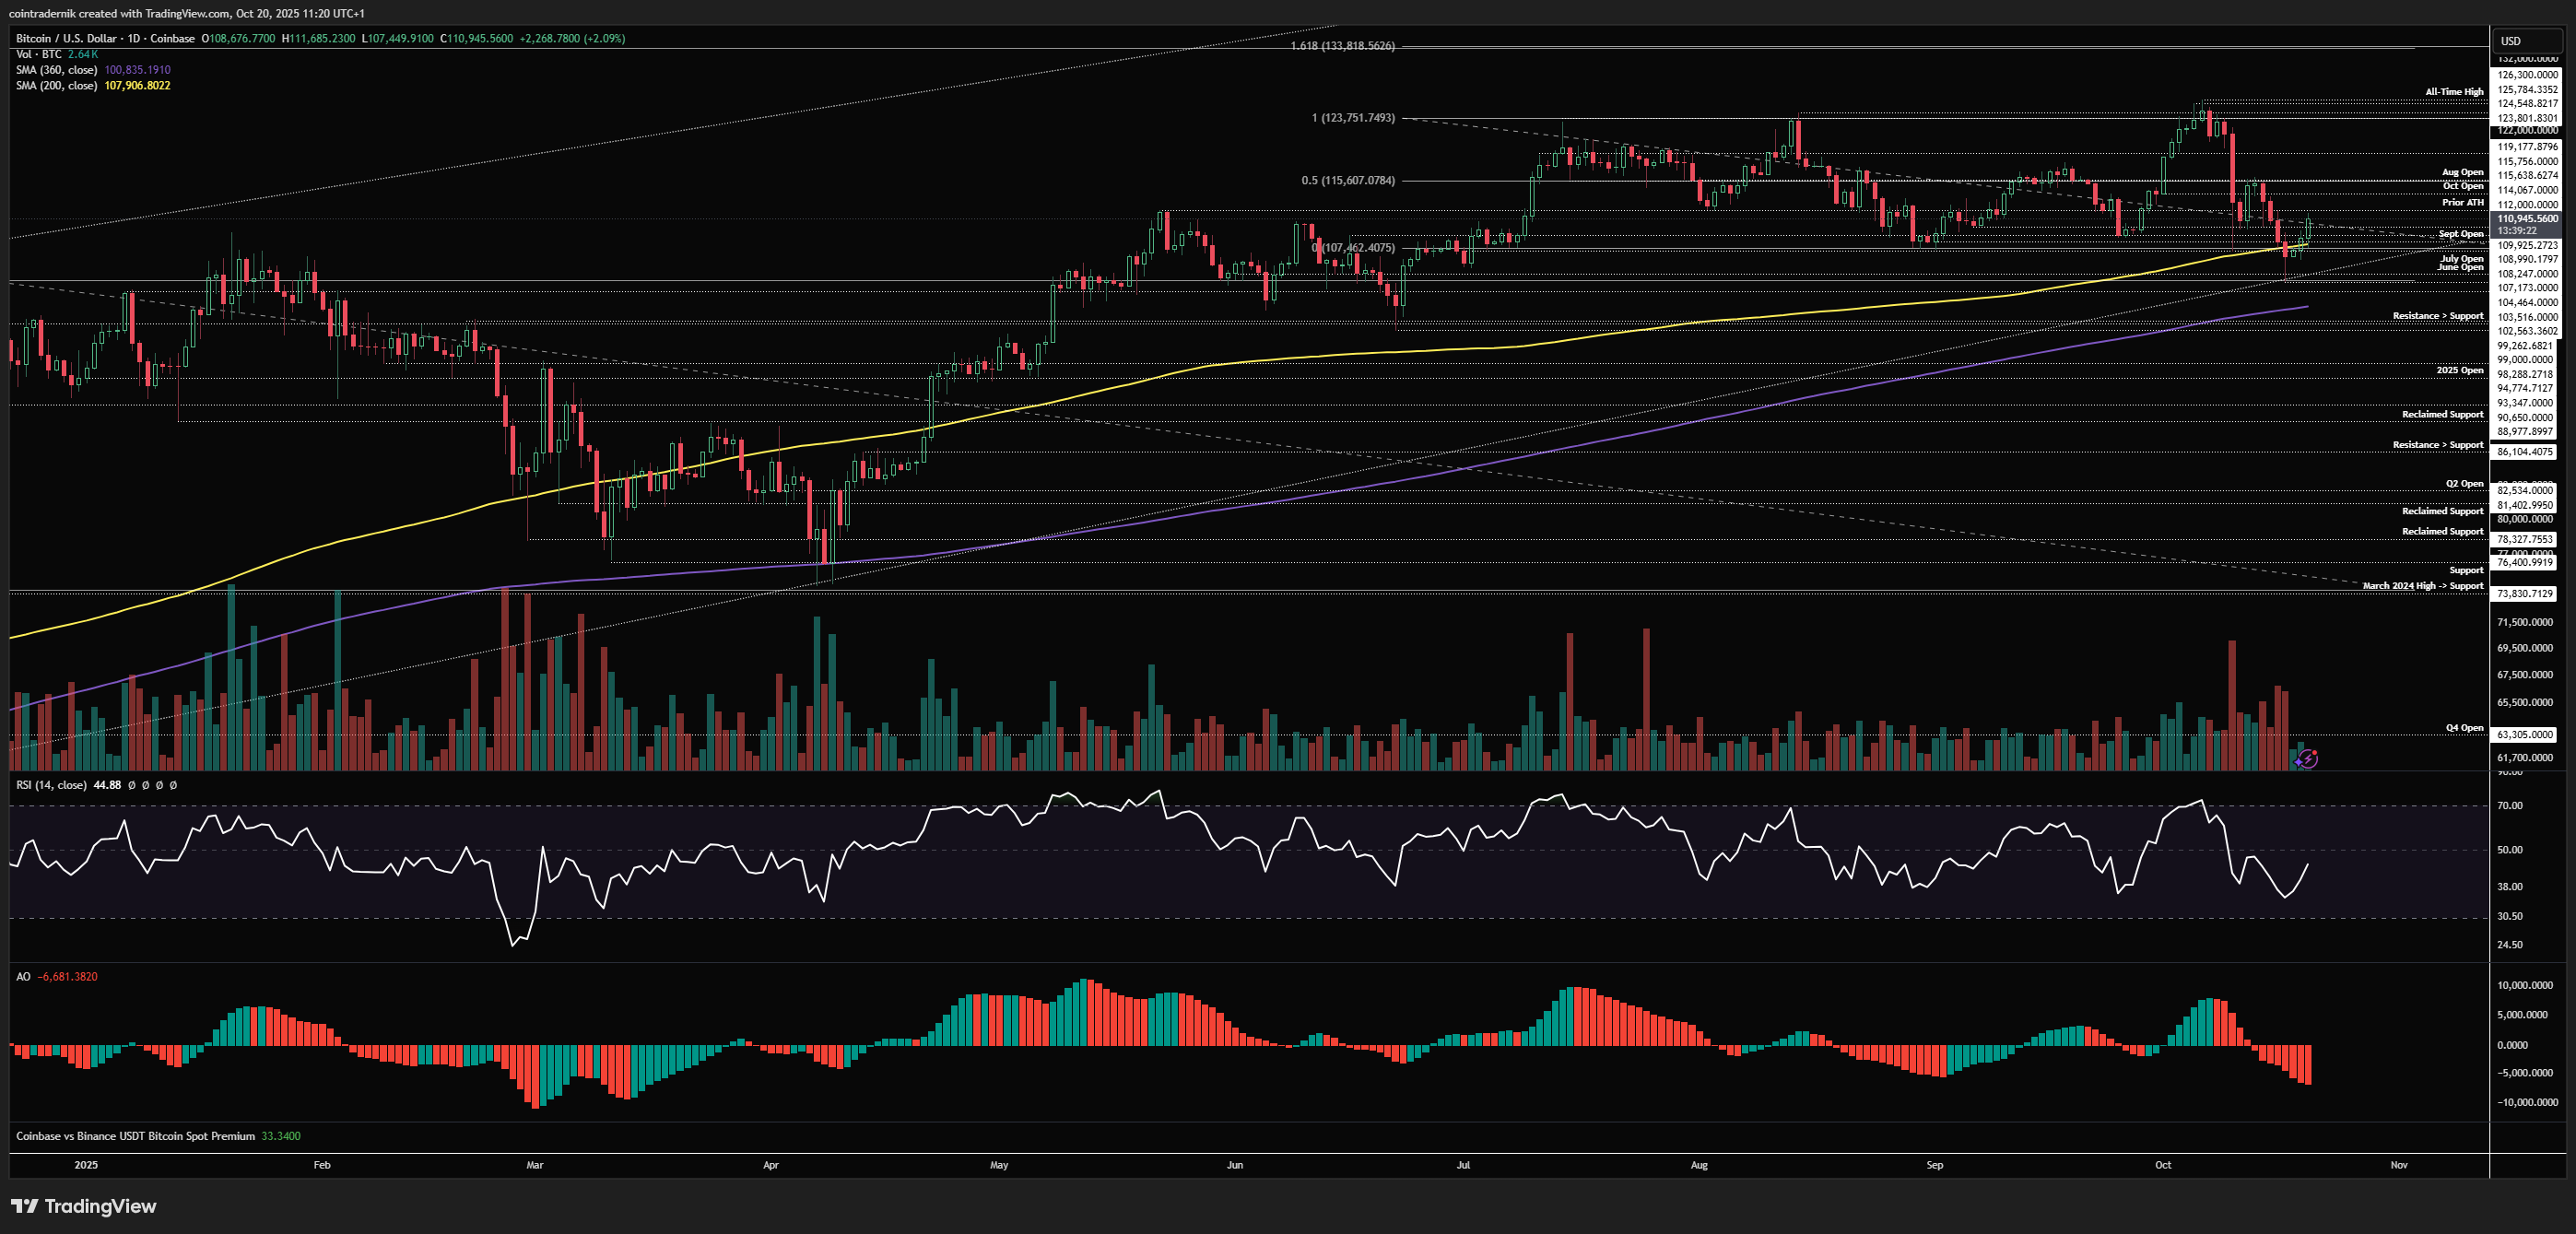
Looking at the daily, we can see that daily structure is bearish following the close below $107k and the September open, but price only briefly pushed below that cluster of support, wicking into trendline support and then pushing back above the 200dMA and reclaiming the range. What we want to see here to be more confident in the bullish bias is for any dip this week to hold that 200dMA and range support around $107k-$108k as a higher low and then price to push higher off that area back above the confluence of resistance at $115.6k: this is the mid-range and August open, as well as the swing-high that preceded this push lower into $103.8k. Acceptance back above that level, turning it back into support, would be very bullish in my view and I think we'd trade into $124k quicker than many imagine from there. The bearish scenario would be a wick above that level and then rejection, acting as a bull trap which leads to another leg lower through $103.8k into the 360dMA at $100.8k, where there is a lot of confluence for support.
Looking for potential intraweek setups here, I'd like to preface this with the fact I am currently in a swing long from $111kish with a hard stop at $94k (but would exit on weakness below $98k), so I probably won't be taking the long setup here as I would have too much directional exposure. Now that's said, if you're looking for a long entry this week with a much tighter invalidation than mine, you could ladder bids around the weekend lows at $106,4k and add above the weekly open with a stop below $103.5k, looking for at least $115.7k, where you could choose to hedge and reopen higher or just hold depending on ltf reactions in that area. We can see that the VWAP from all-time highs is also sat right around that October open at $114k, so $114k-$116k is crucial here. (This doesn't mean we will get a weekend low sweep - we could just mark out a low above the weekly open at $108.7k today and rip higher from there, but $106k would be the highest R/R long):
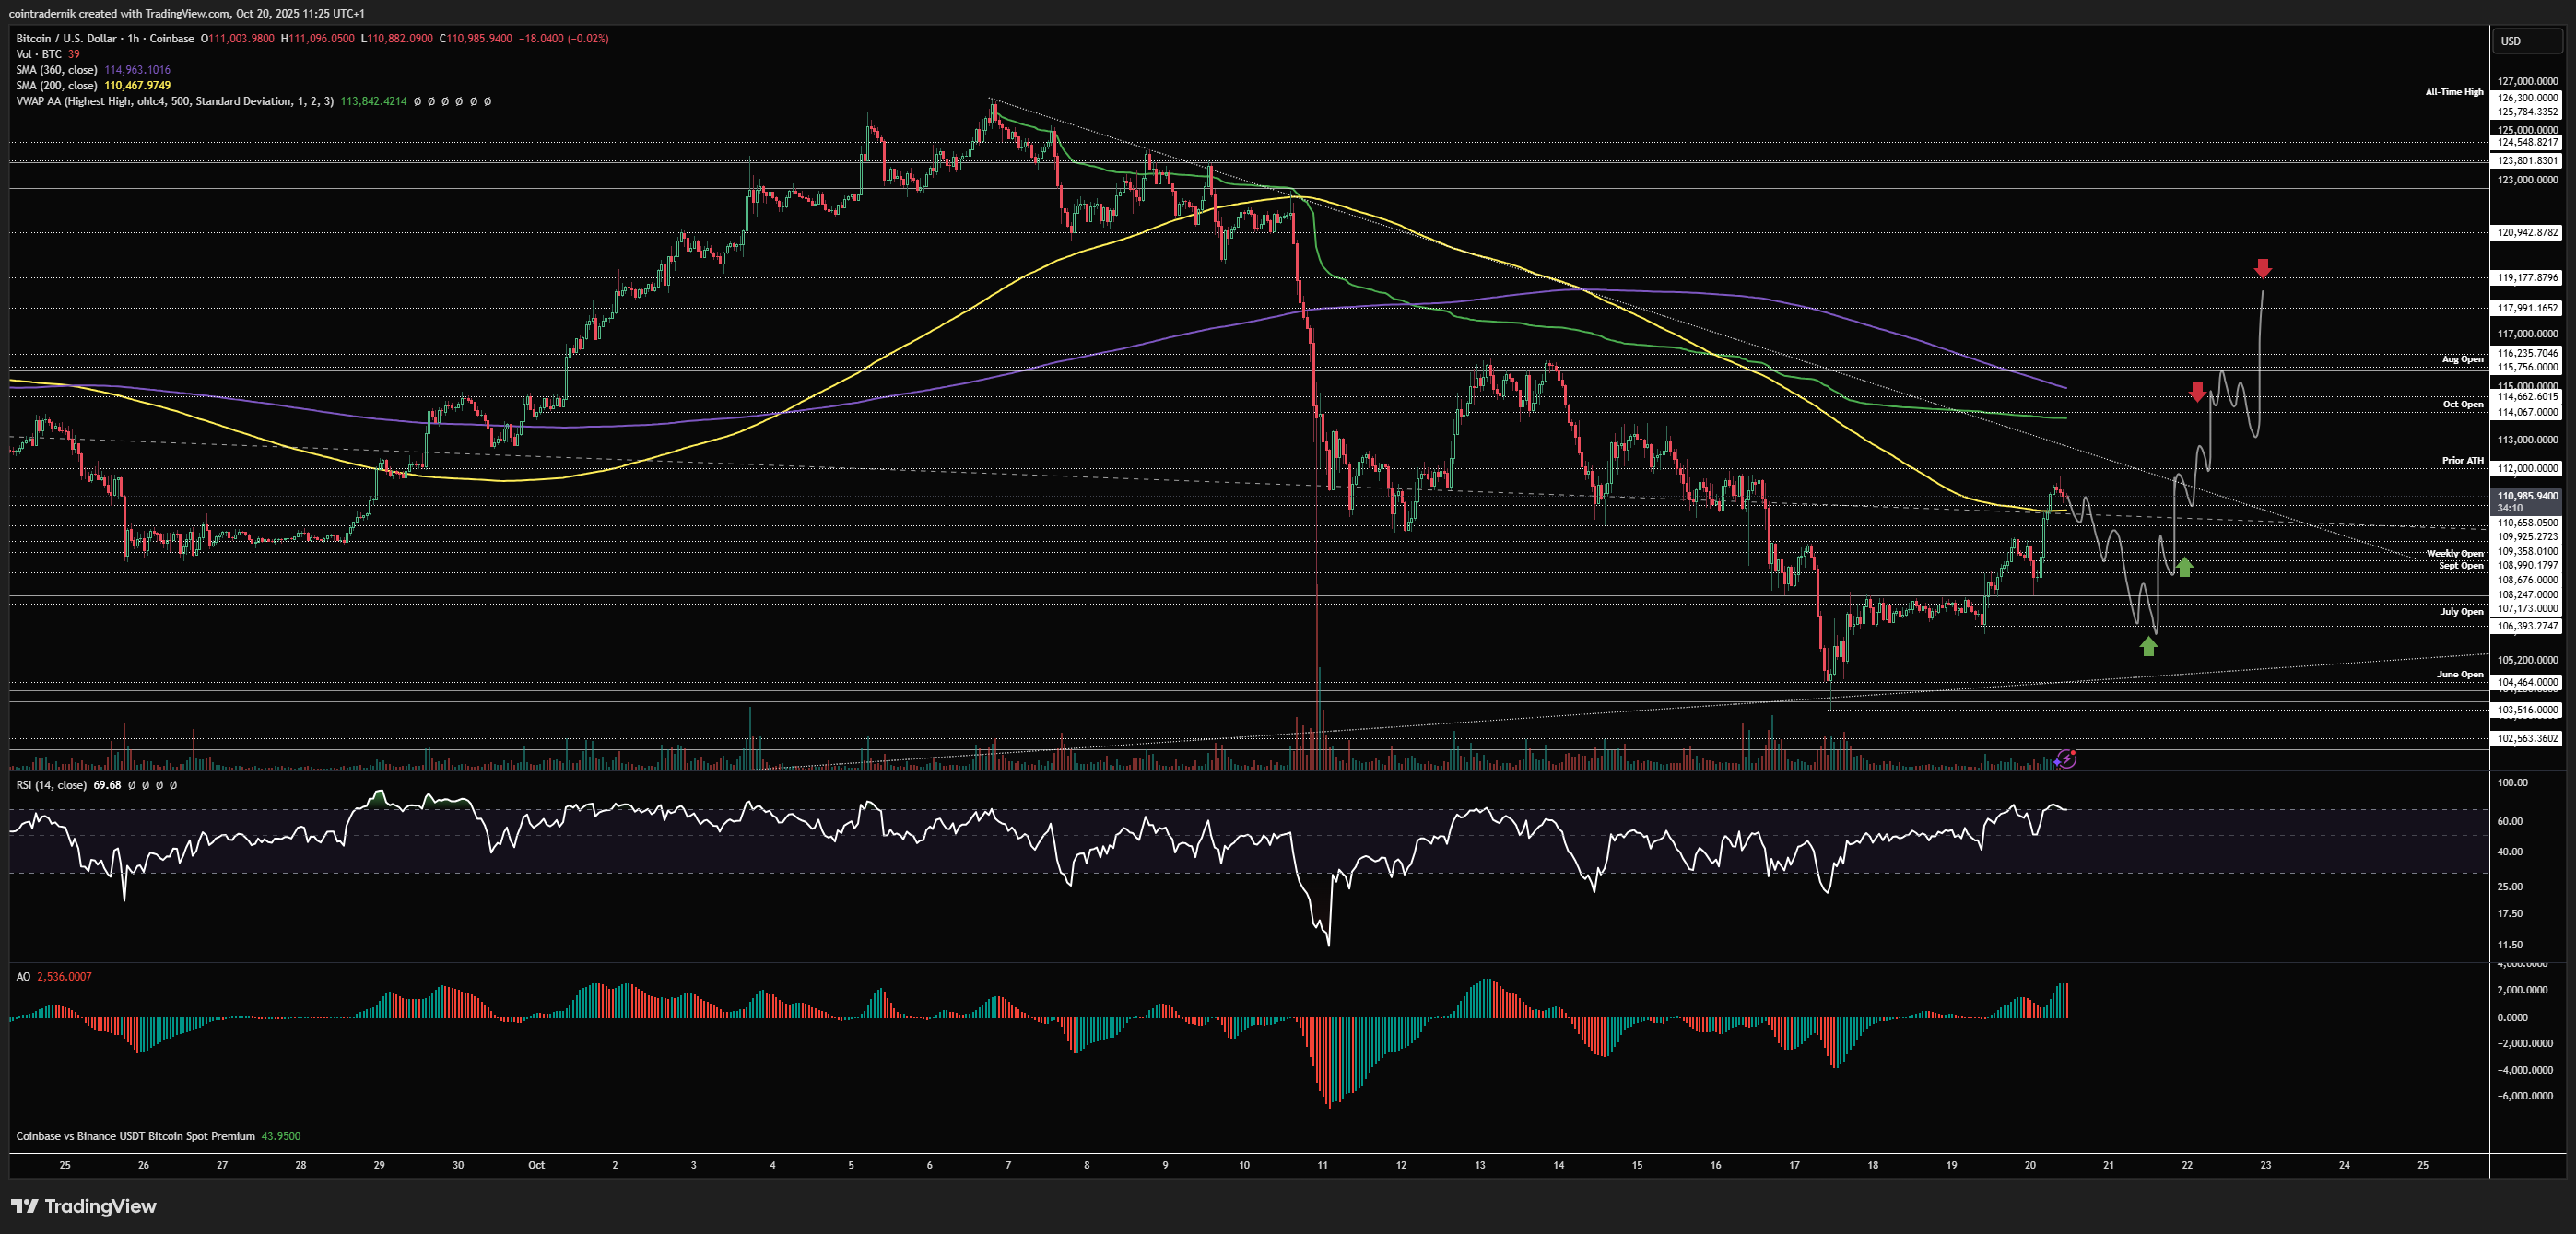
The short side is actually a cleaner setup and a more probable fade in my view, but my higher timeframe bias means I don't think this is what we see. Nonetheless, if we ramp higher into mid-week but then form momentum exhaustion right into that $114k-$116k range after sweeping that double top at $116.2k, then we break down and close back below the October open, that would be a fade with a view to add below trendline support for a move back into and below $103.8k:
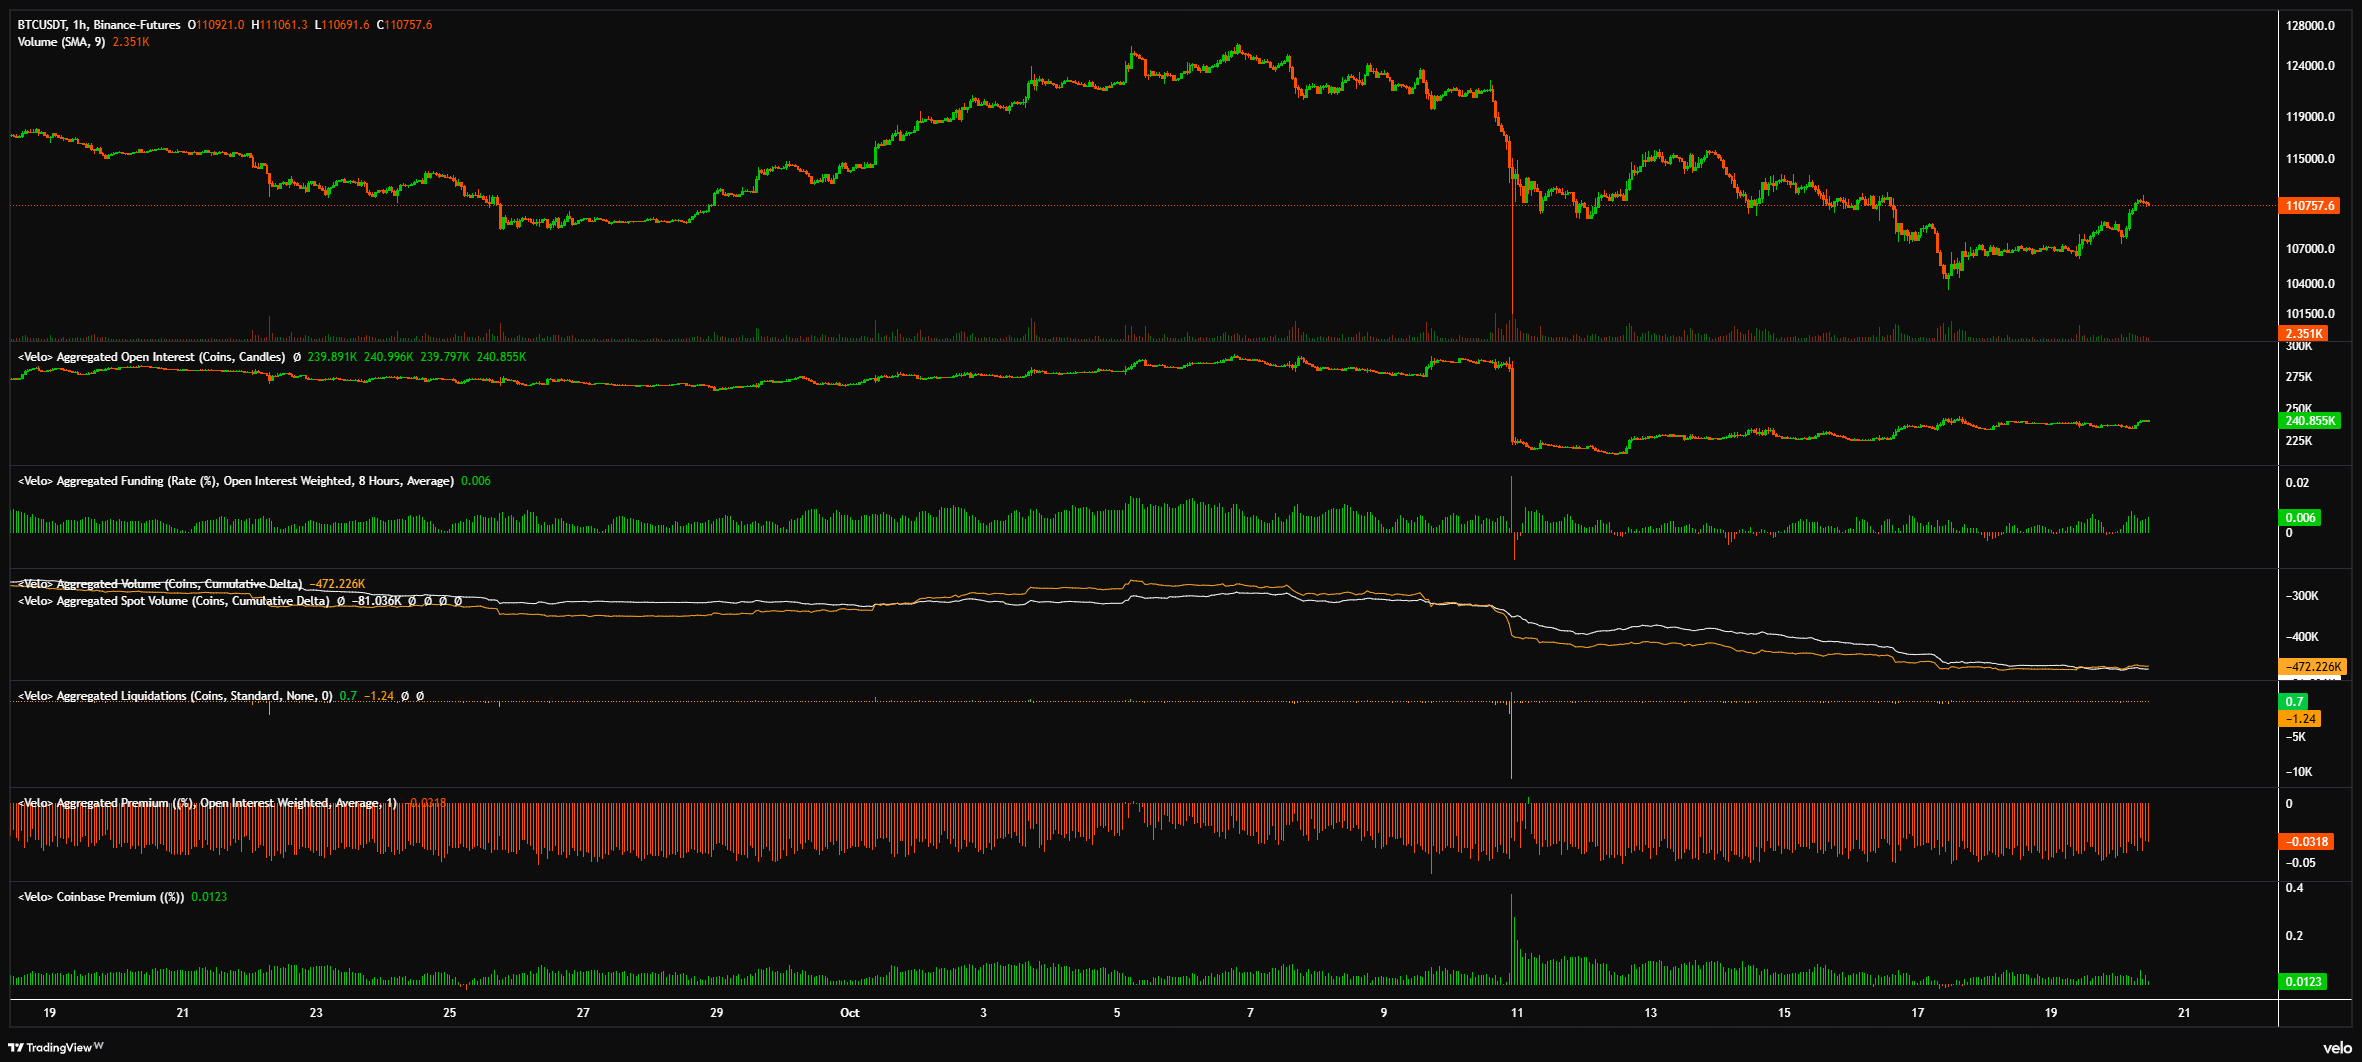
And here's a snapshot of positioning across Velo and CoinGlass:

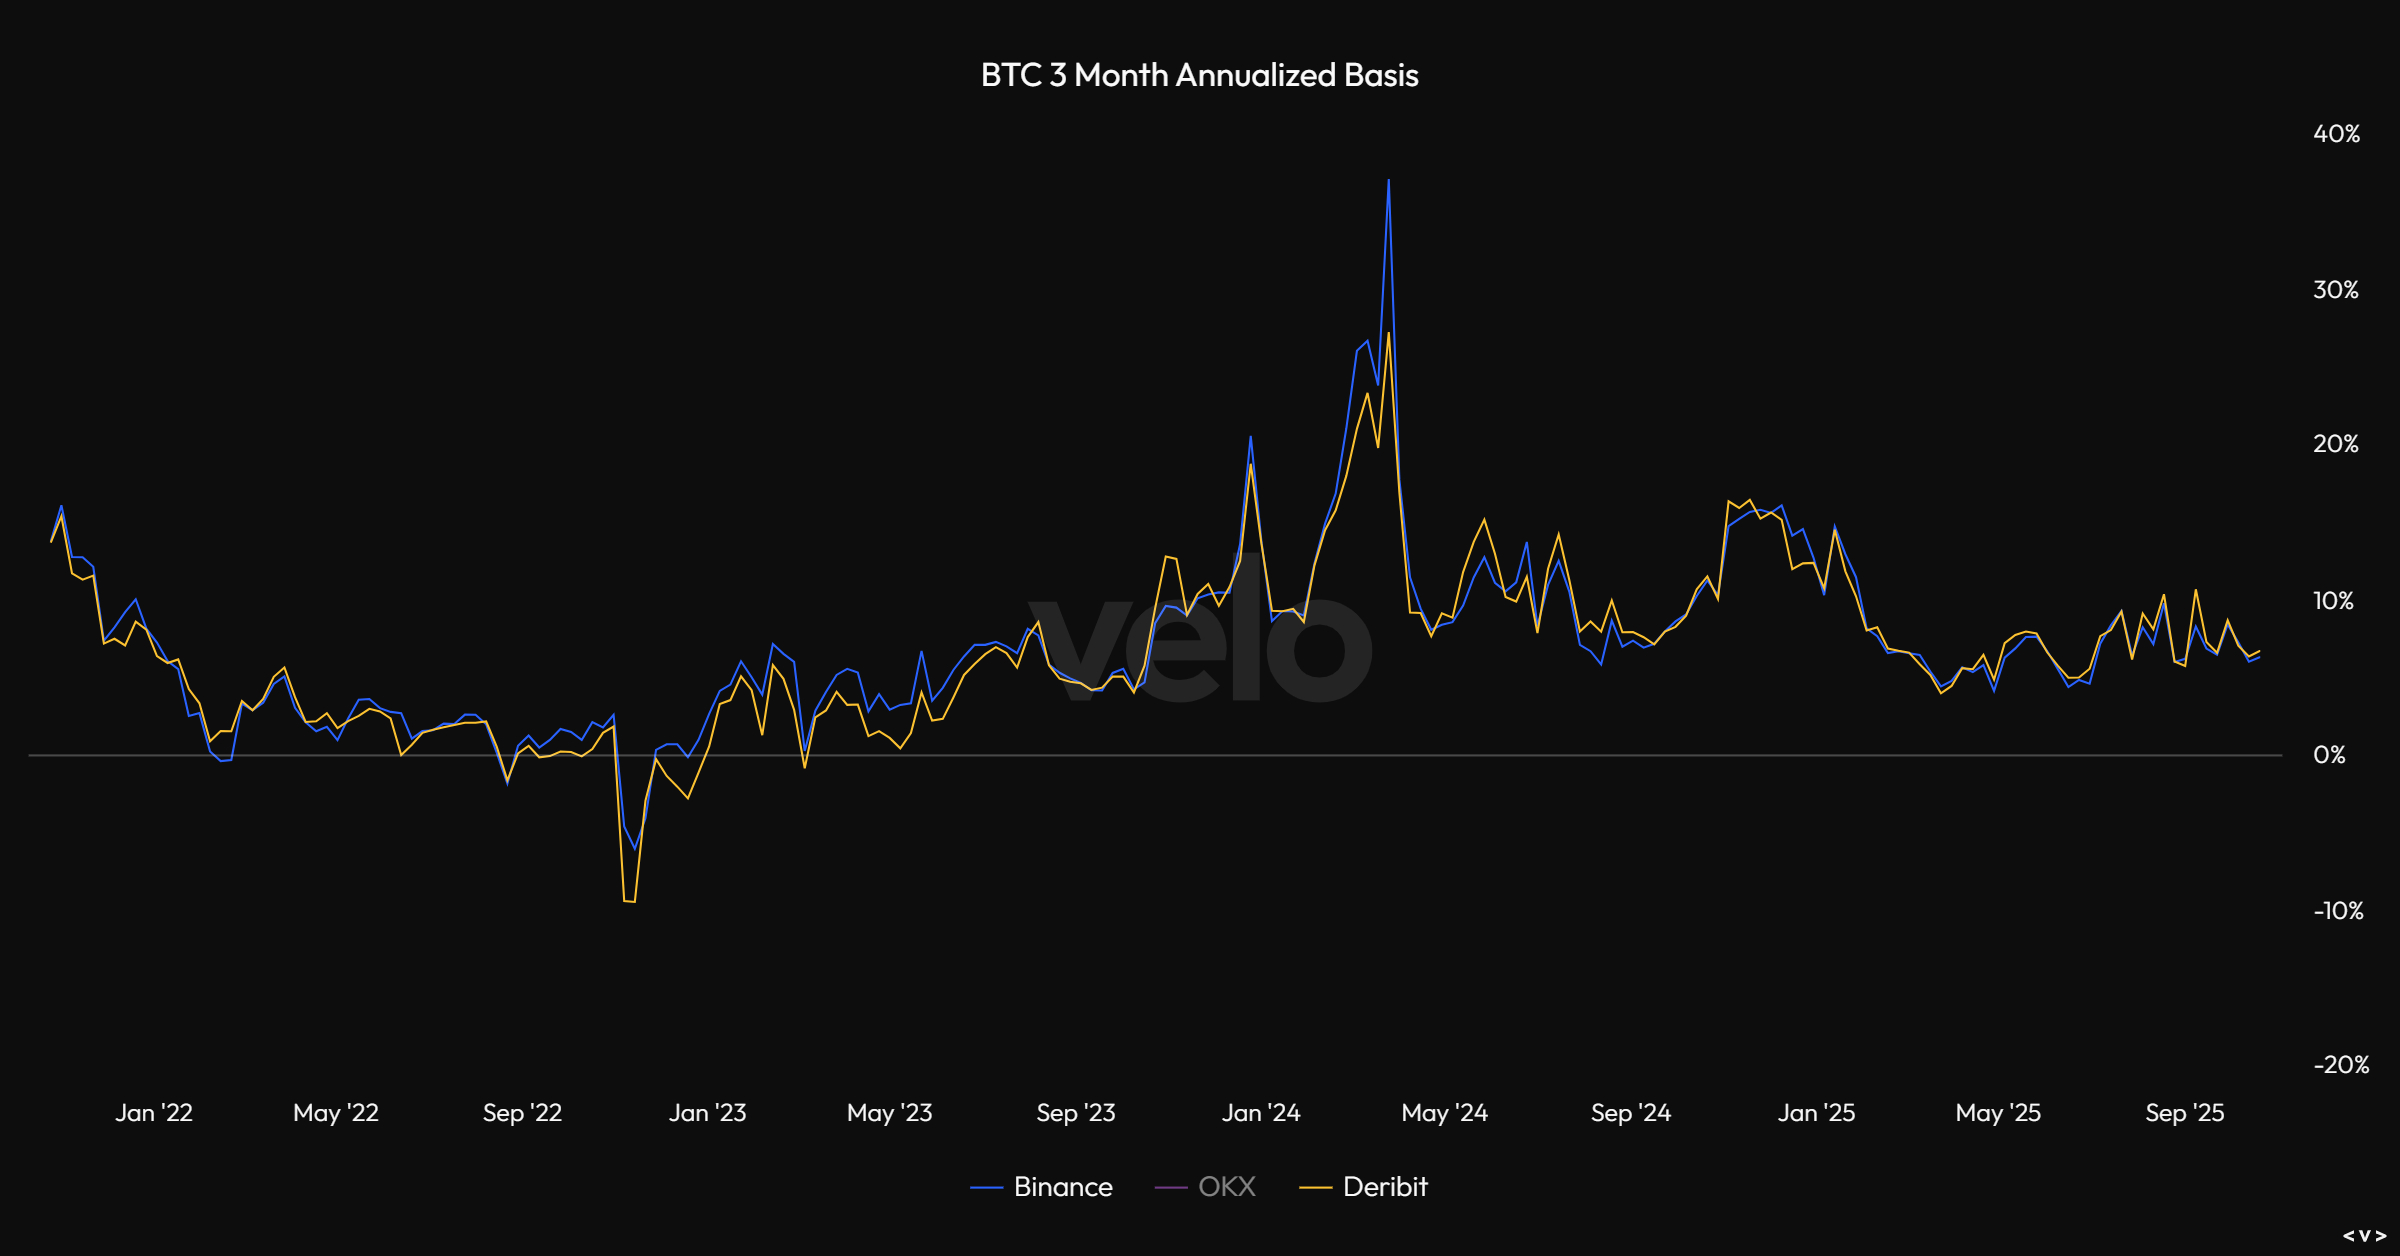
And here's 3-month annualized basis:
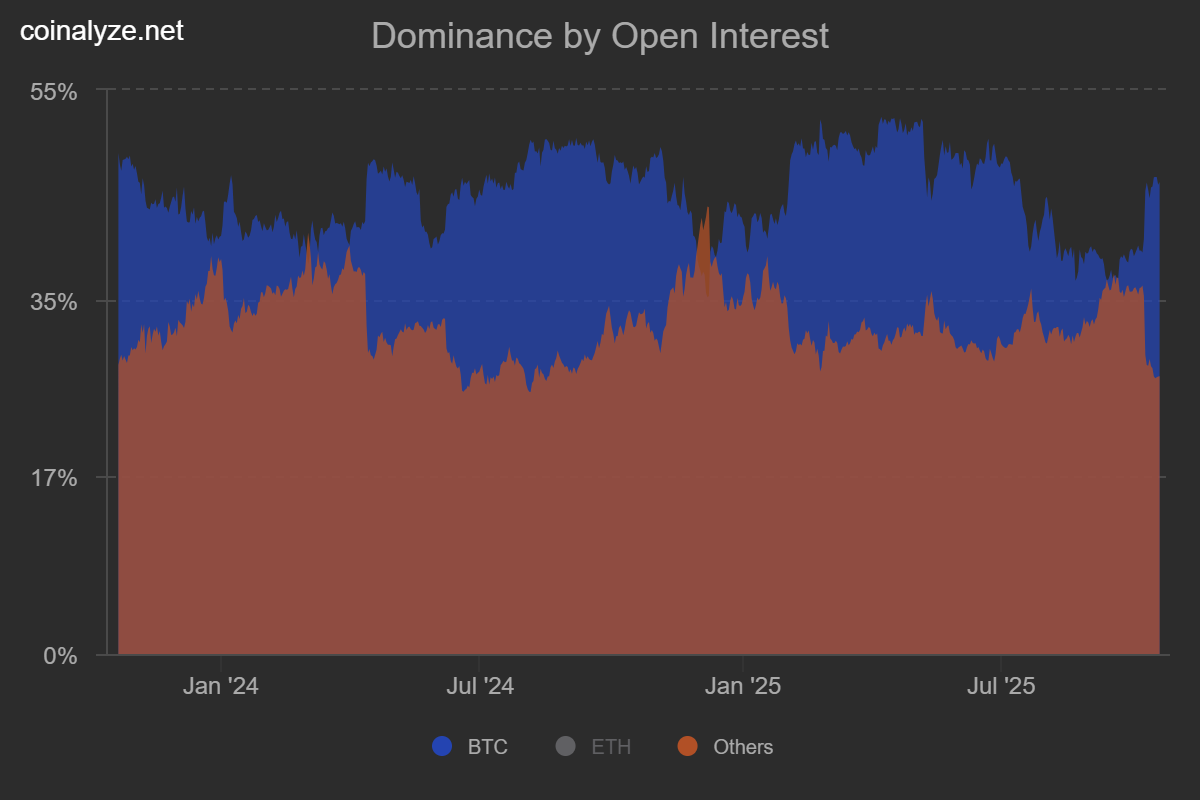
And Bitcoin OI vs Altcoin OI:
And finally some of the expected 1-week and 1-month liquidation levels:
-2025-10-20_11_46_45.png)
-2025-10-20_11_47_15.png)
Price: $4049
ETH/USD
Weekly:
Beginning with the weekly timeframe for ETH/USD, we can see that price wicked lower into the August open last week but held above the previous weekly low and trendline support, forming an inside week with price closing marginally below that major pivot. We want to see this pivot at $4093 reclaimed immediately and not flipped into resistance here on the lower timeframes, or else we could expect another flush of the lows towards that 2025 open. If we do reclaim $4093 here, which is what I expect, we should have our quarterly low now in and I would want to see $4400 flipped into support for the move higher into all-time highs and beyond. If we close the weekly below $3700, that looks much more bearish and the 2025 open would be the last stand support for this bullish structure in order to not see a much bigger unwind back into $2850. My base case here is acceptance back above $4093 into next week and then a close above $4400 for October, leading to new highs through $5000 in early November and a very strong month for ETH.
Daily:

Looking at the daily, we can see how we got momentum exhaustion into the lows and then formed a higher-low last week, so we absolutely want to see this structure now protected and price to form a higher-high above the mid-range at $4352 and then another higher-low above $4093 before a breakout higher and a push towards fresh highs. If we get a trendline breakout and price flips that ATH VWAP into support with daily RSI above 50, I'd expect a move into $4950 very swiftly, followed by price discovery in November. As mentioned above, invalidation of this broader bullish view on ETH would be $4093 acting as resistance this week leading to a push below $3700, where a close below that level would mean we're absolutely retesting the yearly open, in my opinion.
ETH/BTC
Weekly:
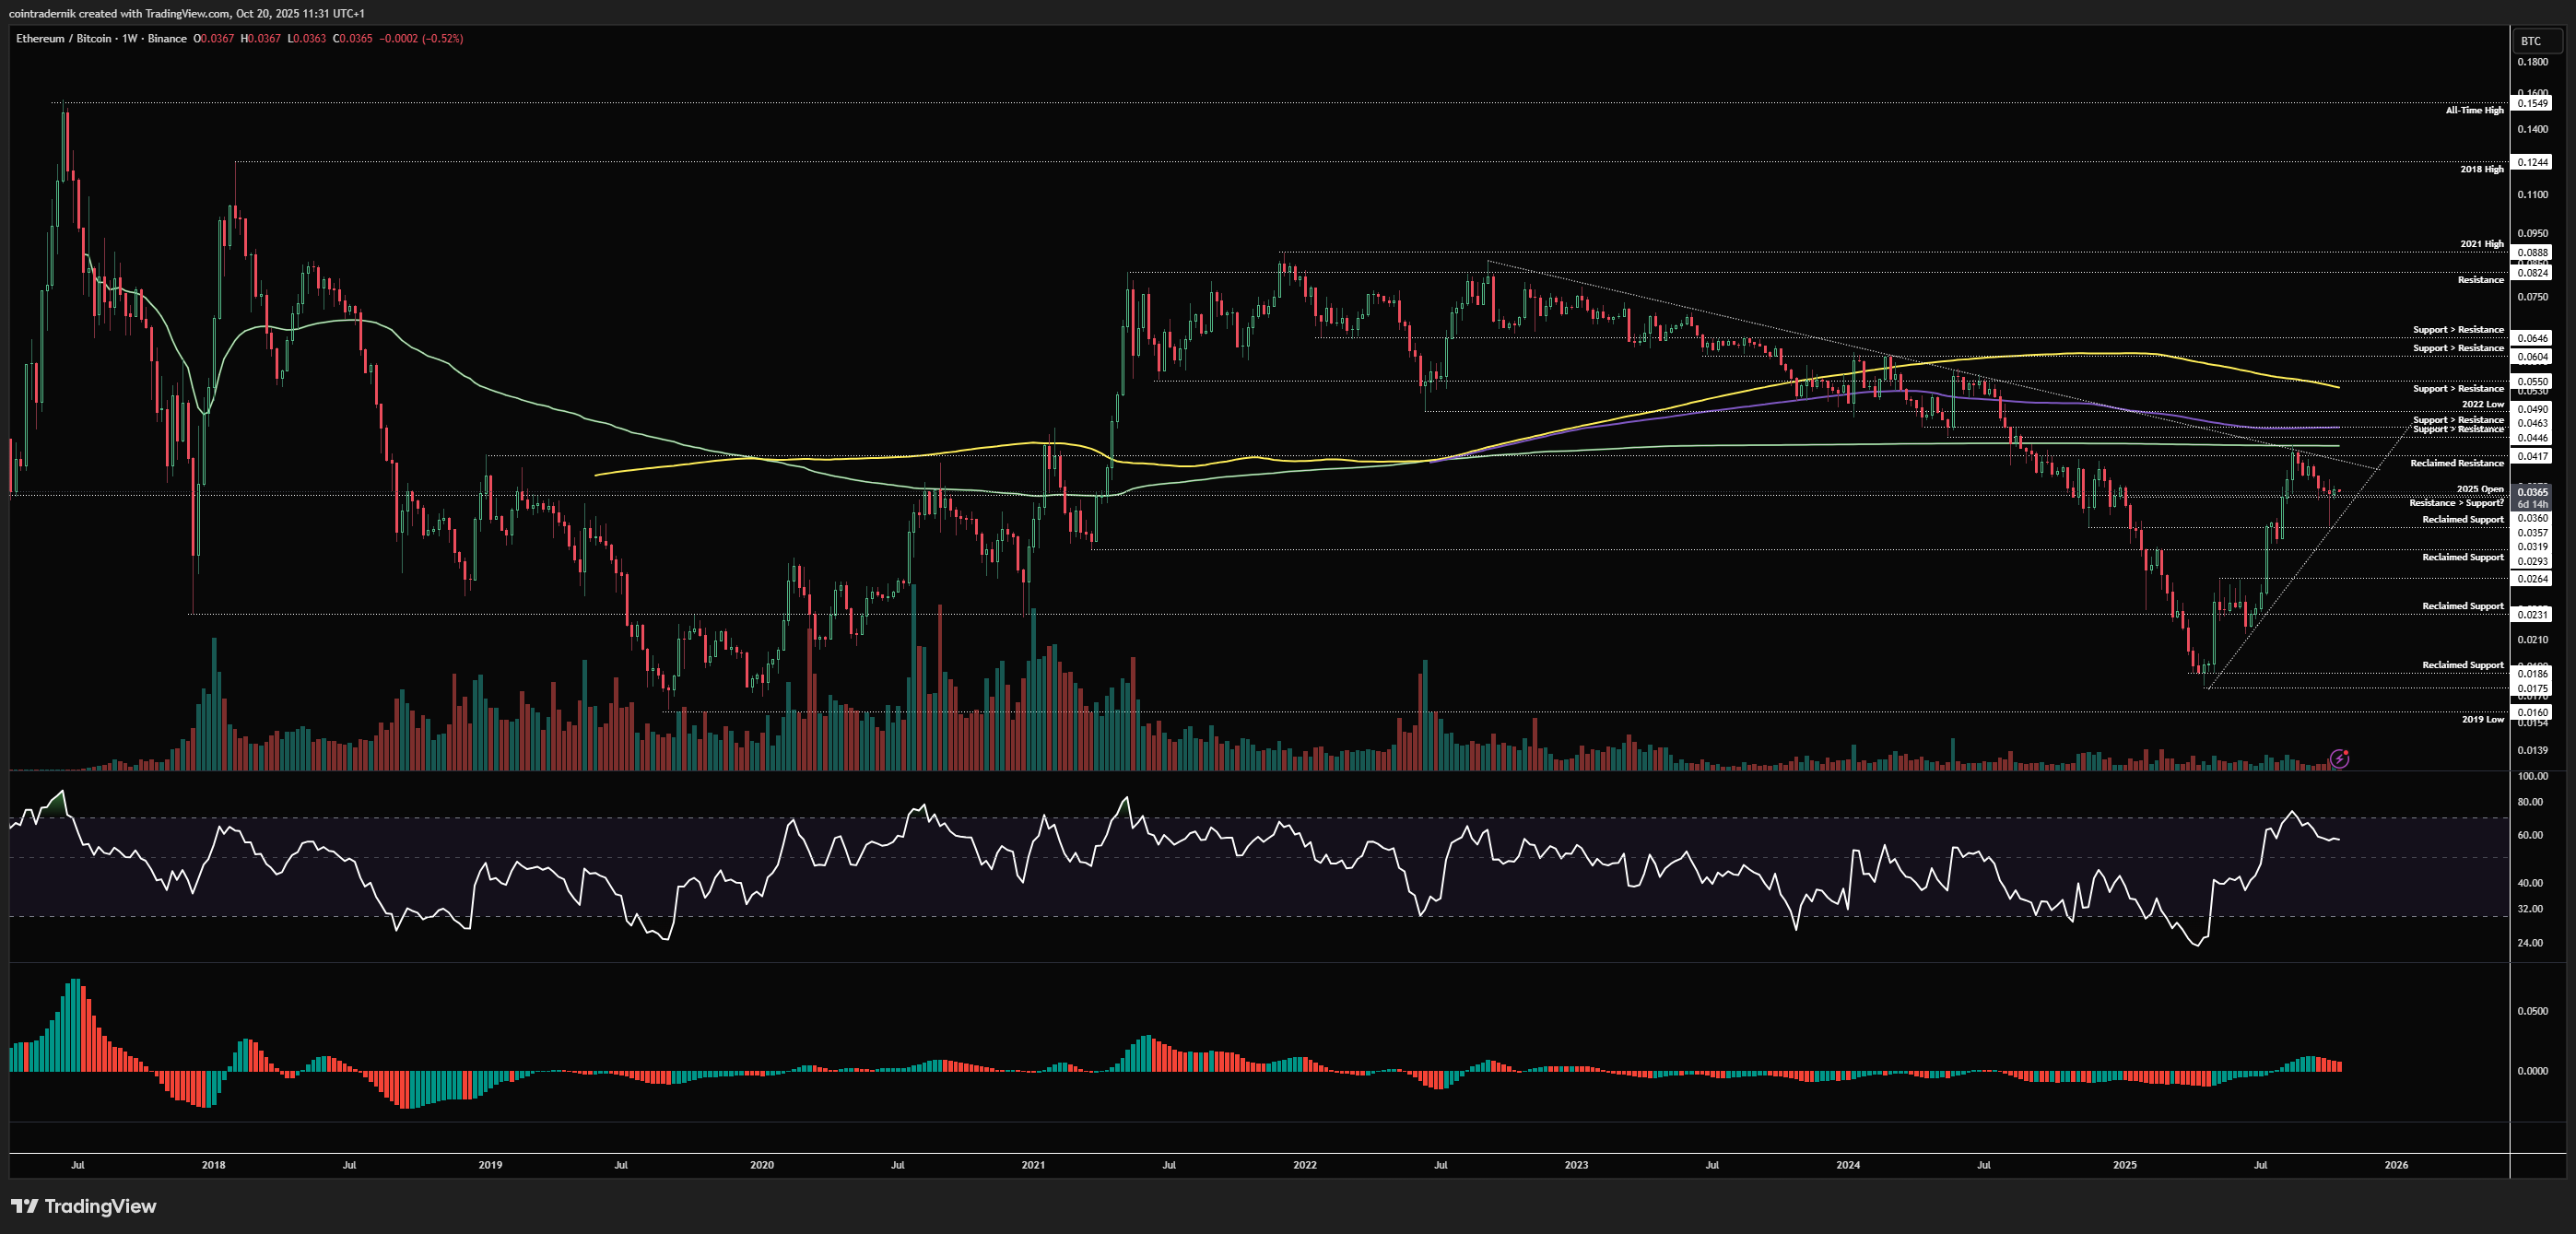
On the weekly timeframe for ETH/BTC, we can see that price is behaving pretty much precisely as anticipated after the rejected at trendline resistance, with last week closing marginally green after holding the yearly open as support, with trendline support below from the 2025 lows. It is my view that the Q4 low for the pair has formed here, and we should now see price retest and break above trendline resistance going into early November, where acceptance above 0.0417 opens up the next leg higher into 0.055, as I've mentioned many times. A weekly close below 0.0319 would invalidate this.
Daily:
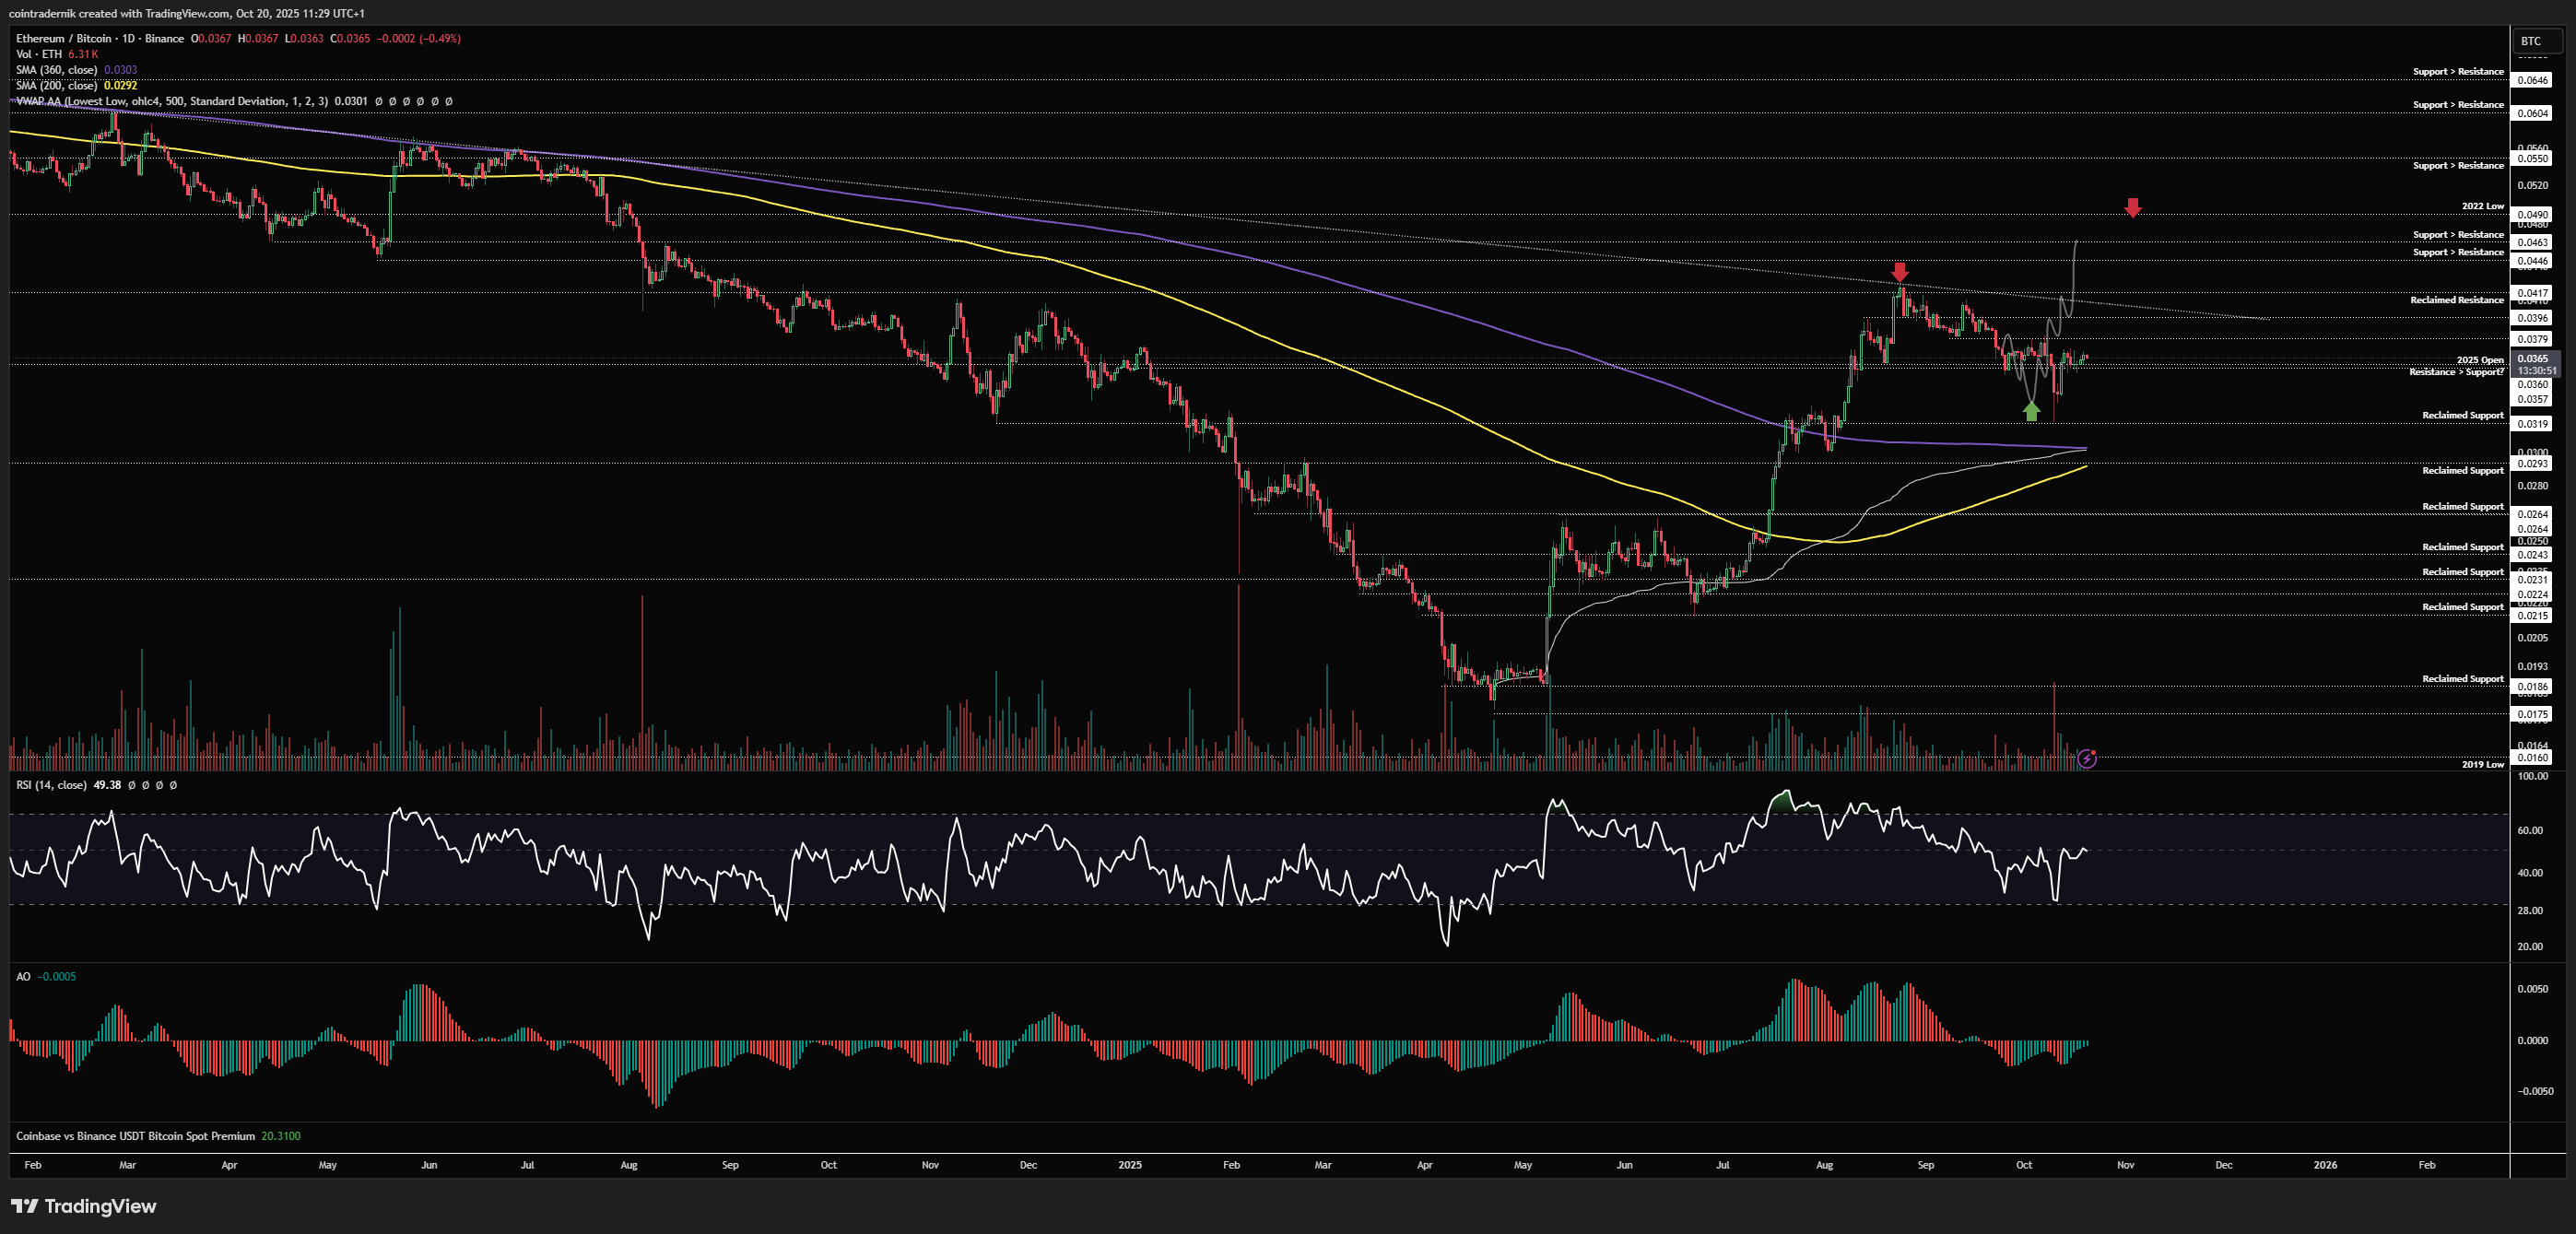
Dropping into the daily, we can see how price marked out that low between 0.0319 and the yearly open before bouncing hard a reclaiming 0.036 as support. We should see this level now act as support, but if not at the worst we should see a higher-low form above the 0.0319 level before continuation higher. If we can flip 0.0379 as reclaimed support here, that would be promising for the view that a trendline breakout is imminent, following which I would expect 0.0417 to be taken out and price to head higher, with minor resistance above that at 0.049 before 0.055. We have a confluence of support below between 0.0293 and 0.0319, so flipping that range into resistance would be very bearish ETH/BTC.
Receive the latest updates directly to your inbox

Price: $98.2
Weekly:
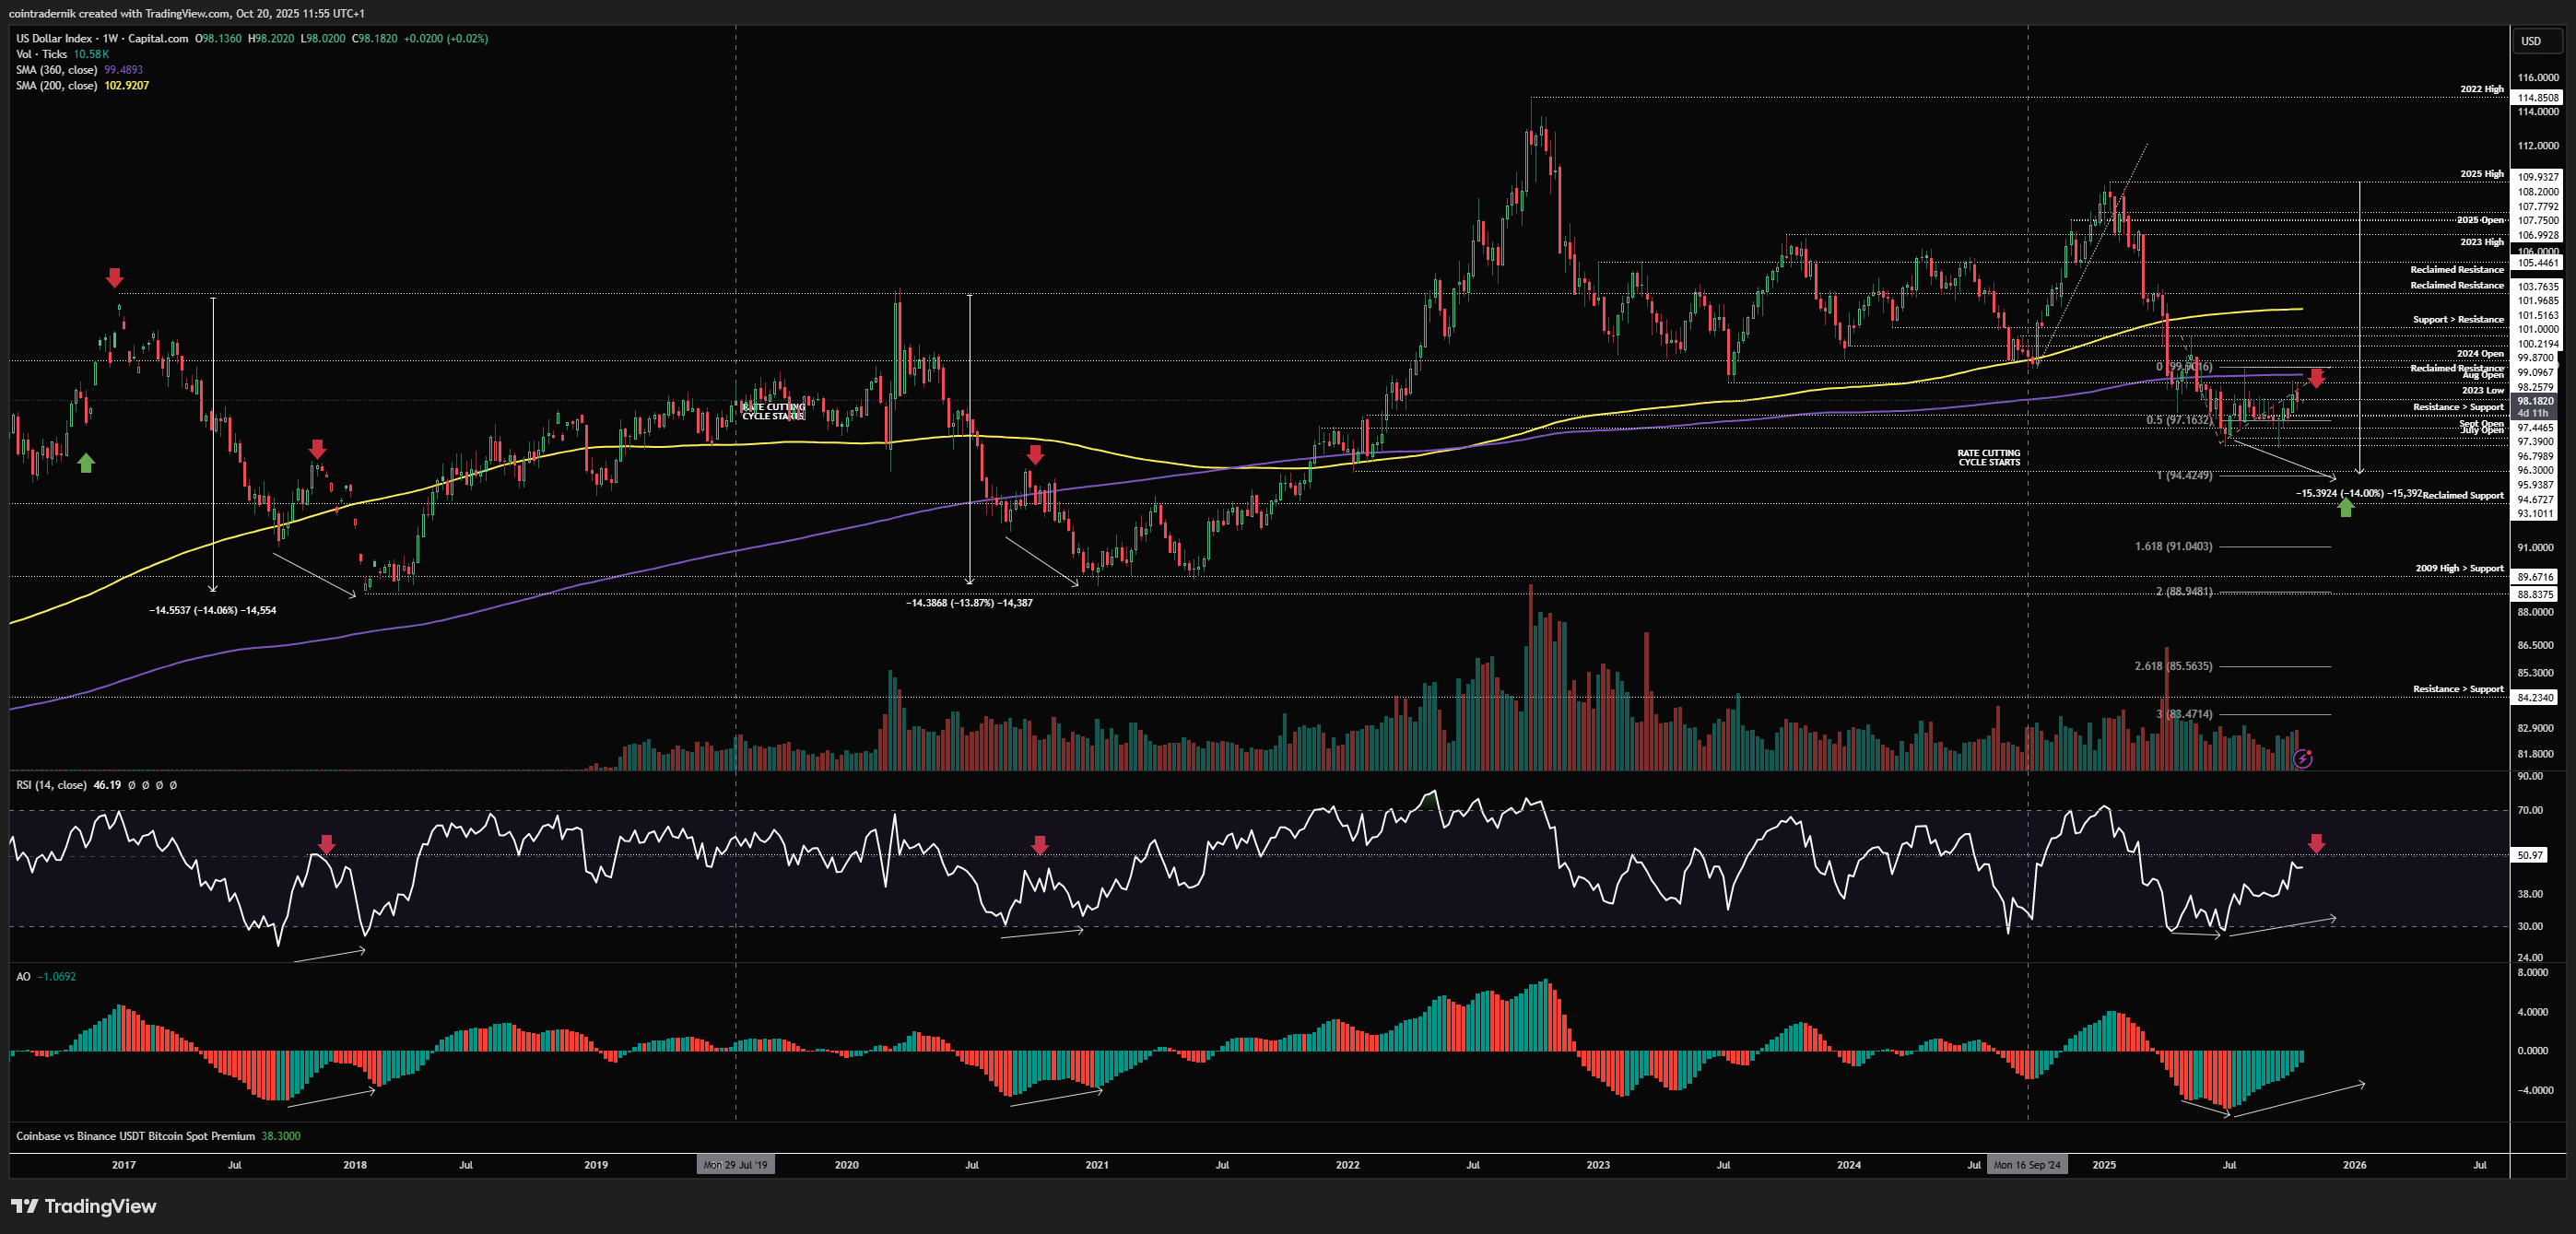
Beginning with the weekly view for DXY, we can see that last week saw price push higher again but reject around the 99 handle to close the week red, with weekly RSI right below that 50 level. I am in two minds here as to whether we get one more push higher towards 101 or we are forming a local top here from which we push lower. Price-action this week will be telling into FOMC next week and if we see acceptance below support at 97.4 I would be confident that the next move lower has begun, with price then likely to push down into 96, followed by at least 94.7 if not 93.1 later this quarter. If, instead, 97.4 holds firm as support this week and we push higher into the 100 handle, I will be looking for signs of exhaustion on the lower timeframes. As ever, invalidation on this broader view is acceptance back above 101 as reclaimed range support.
Daily:
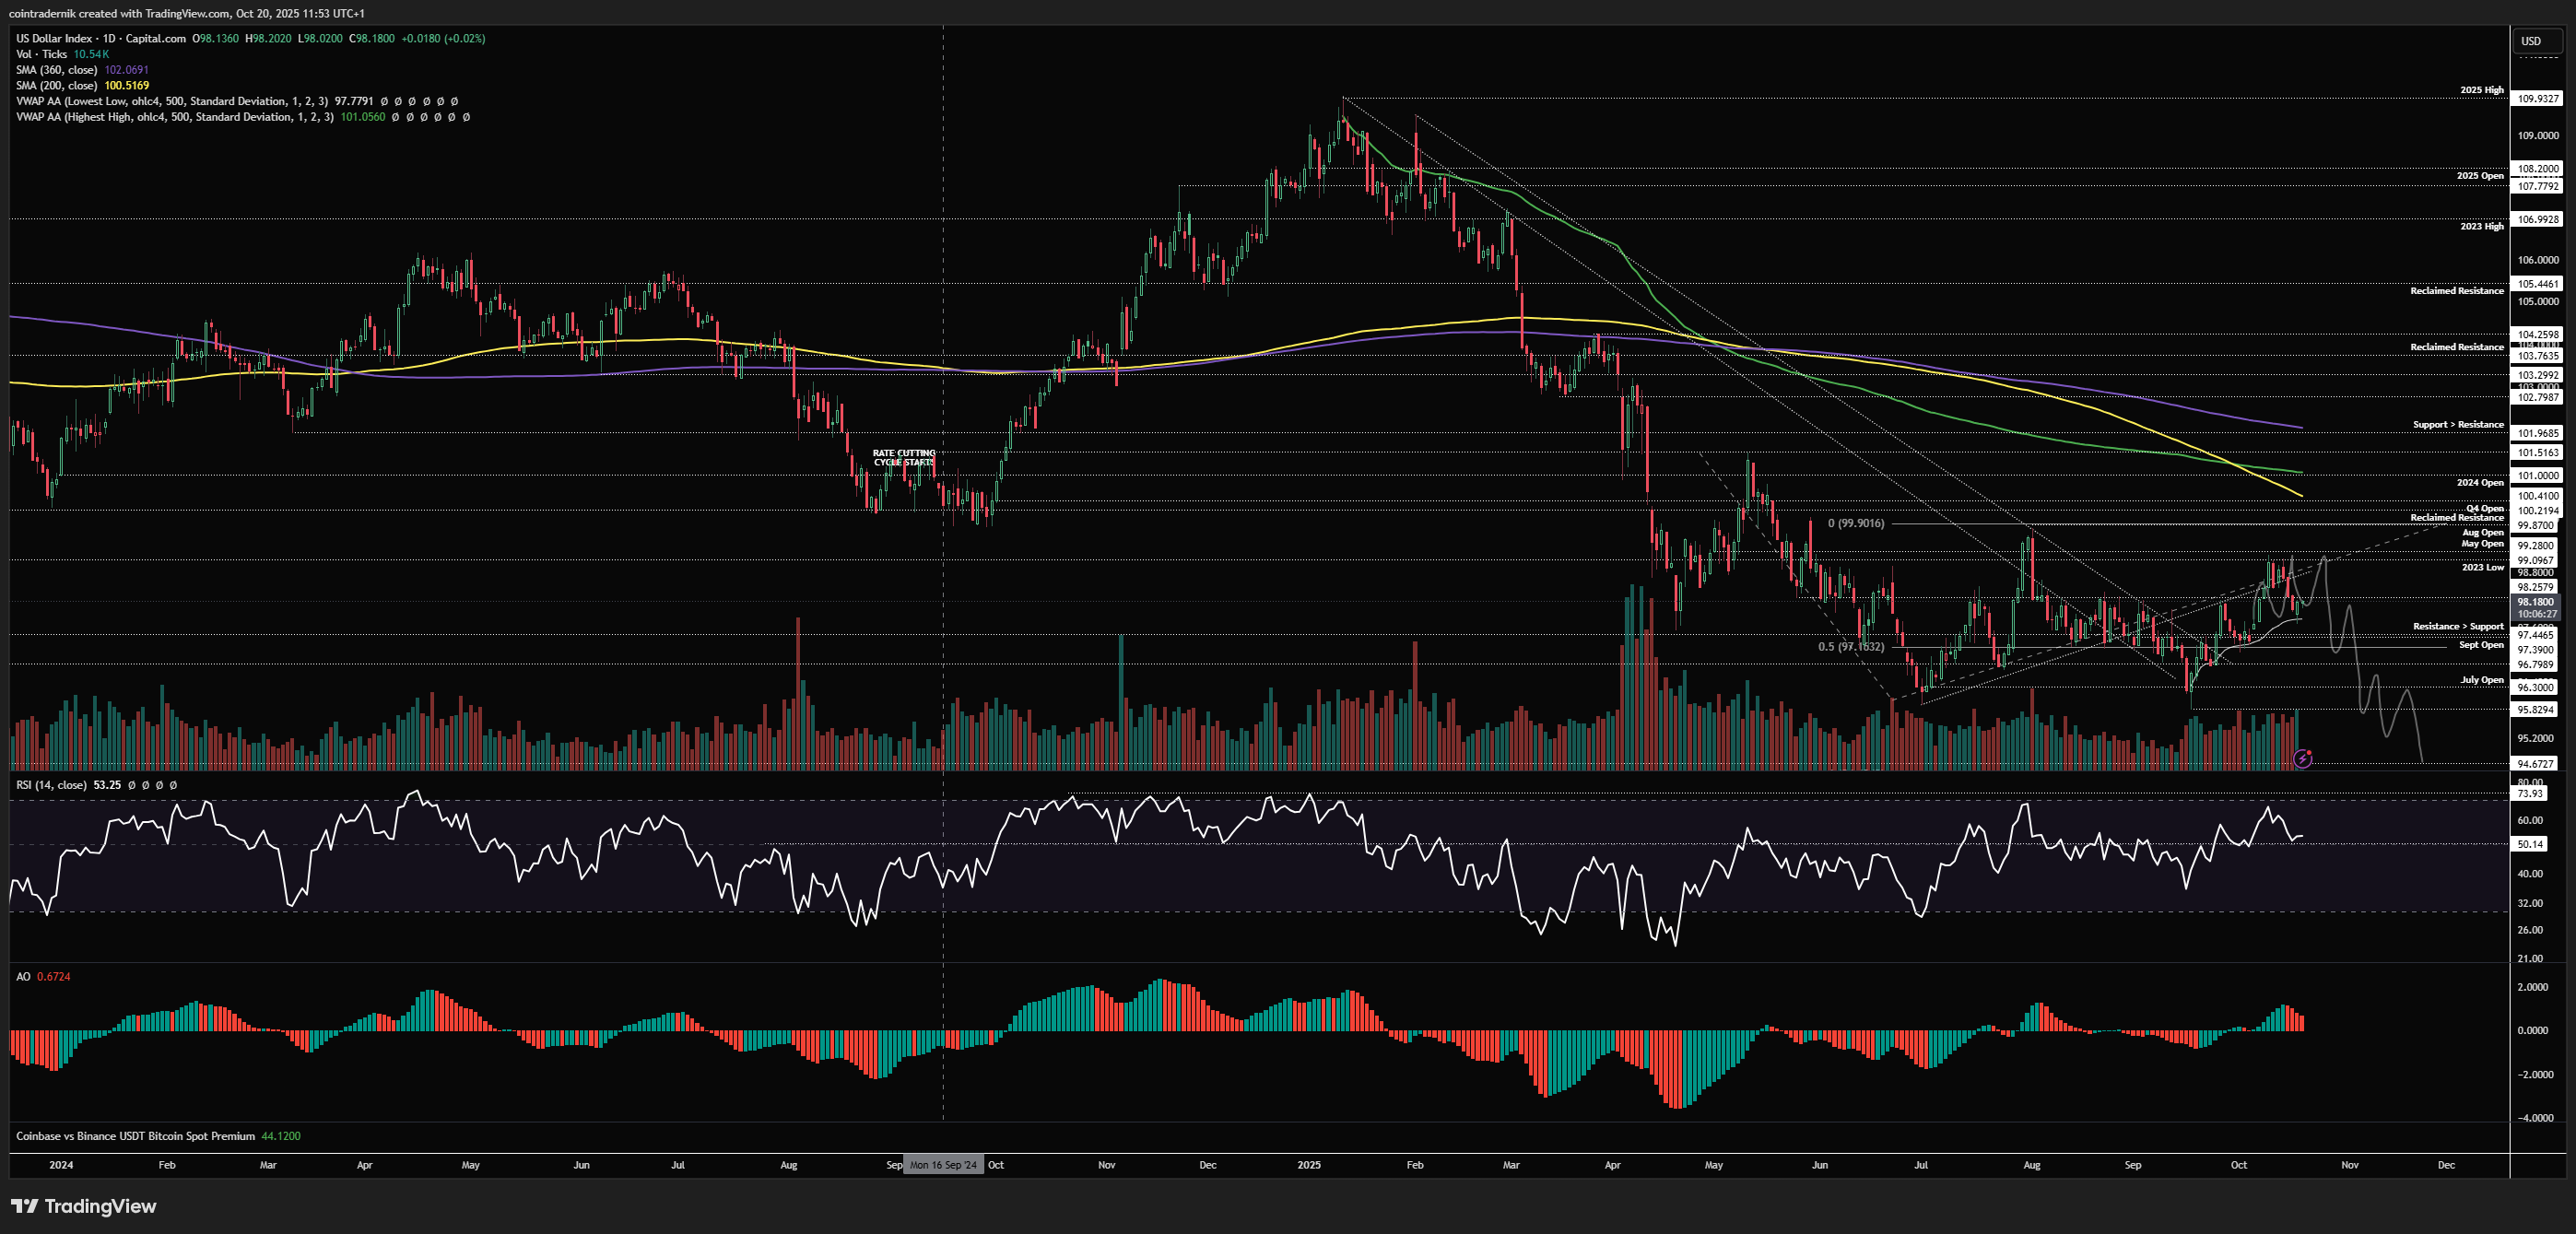
Looking at the daily, we can see that we've got bullish structure and moment here at present, with price so far following the trajectory I expected. We continue to find support and make higher-lows at the VWAP from the 95.83 low, thus this is obviously something to watch for if we push lower and flip that VWAP into resistance. I am leaning towards one more push higher here into next week for the Dollar, with some sort of momentum exhaustion into the highs followed by a breakdown and shift in market structure, accompanied by a loss of 50 on daily RSI to signal a shift in momentum. Not much else to add here for now...
Price: $4254
Weekly:

Beginning with the weekly view for Gold, last week saw price scream higher into $4381 off the weekly open, rejecting at that level to close at $4250 on the highest weekly volume in years. There are some signs now of a blow-off top, particularly with the context of queues to buy gold etc. and gold miners continuing to underperform on the ascent and looking like a complacency shoulder is forming. We also closed 9 straight weeks green and have never closed 10, though there is a first time for everything. I mentioned that I expected a multi-week top to be forming over this coming week on X, and whether we close this week green or red I think the next few weeks are likely to see lower Gold prices than what we're seeing here today. I have re-shorted GDX at 82.30 after covering initial shorts at 75 and am looking to play this lower into November. For Gold, if I am right and we form the local top into next week, we can see that we have formed basically no major support since the breakout of the range and whilst I don't think it is likely we trade back into $3500, that is the highest level of weekly support on the chart. I would expect at least the past couple of weekly lows to be swept in any case in November before we form some sort of re-accumulation range and consolidate for a while. Perhaps I am wrong and we get one marginal red week followed by many more weeks of upside, but that would genuinely be a new paradigm.
Daily:
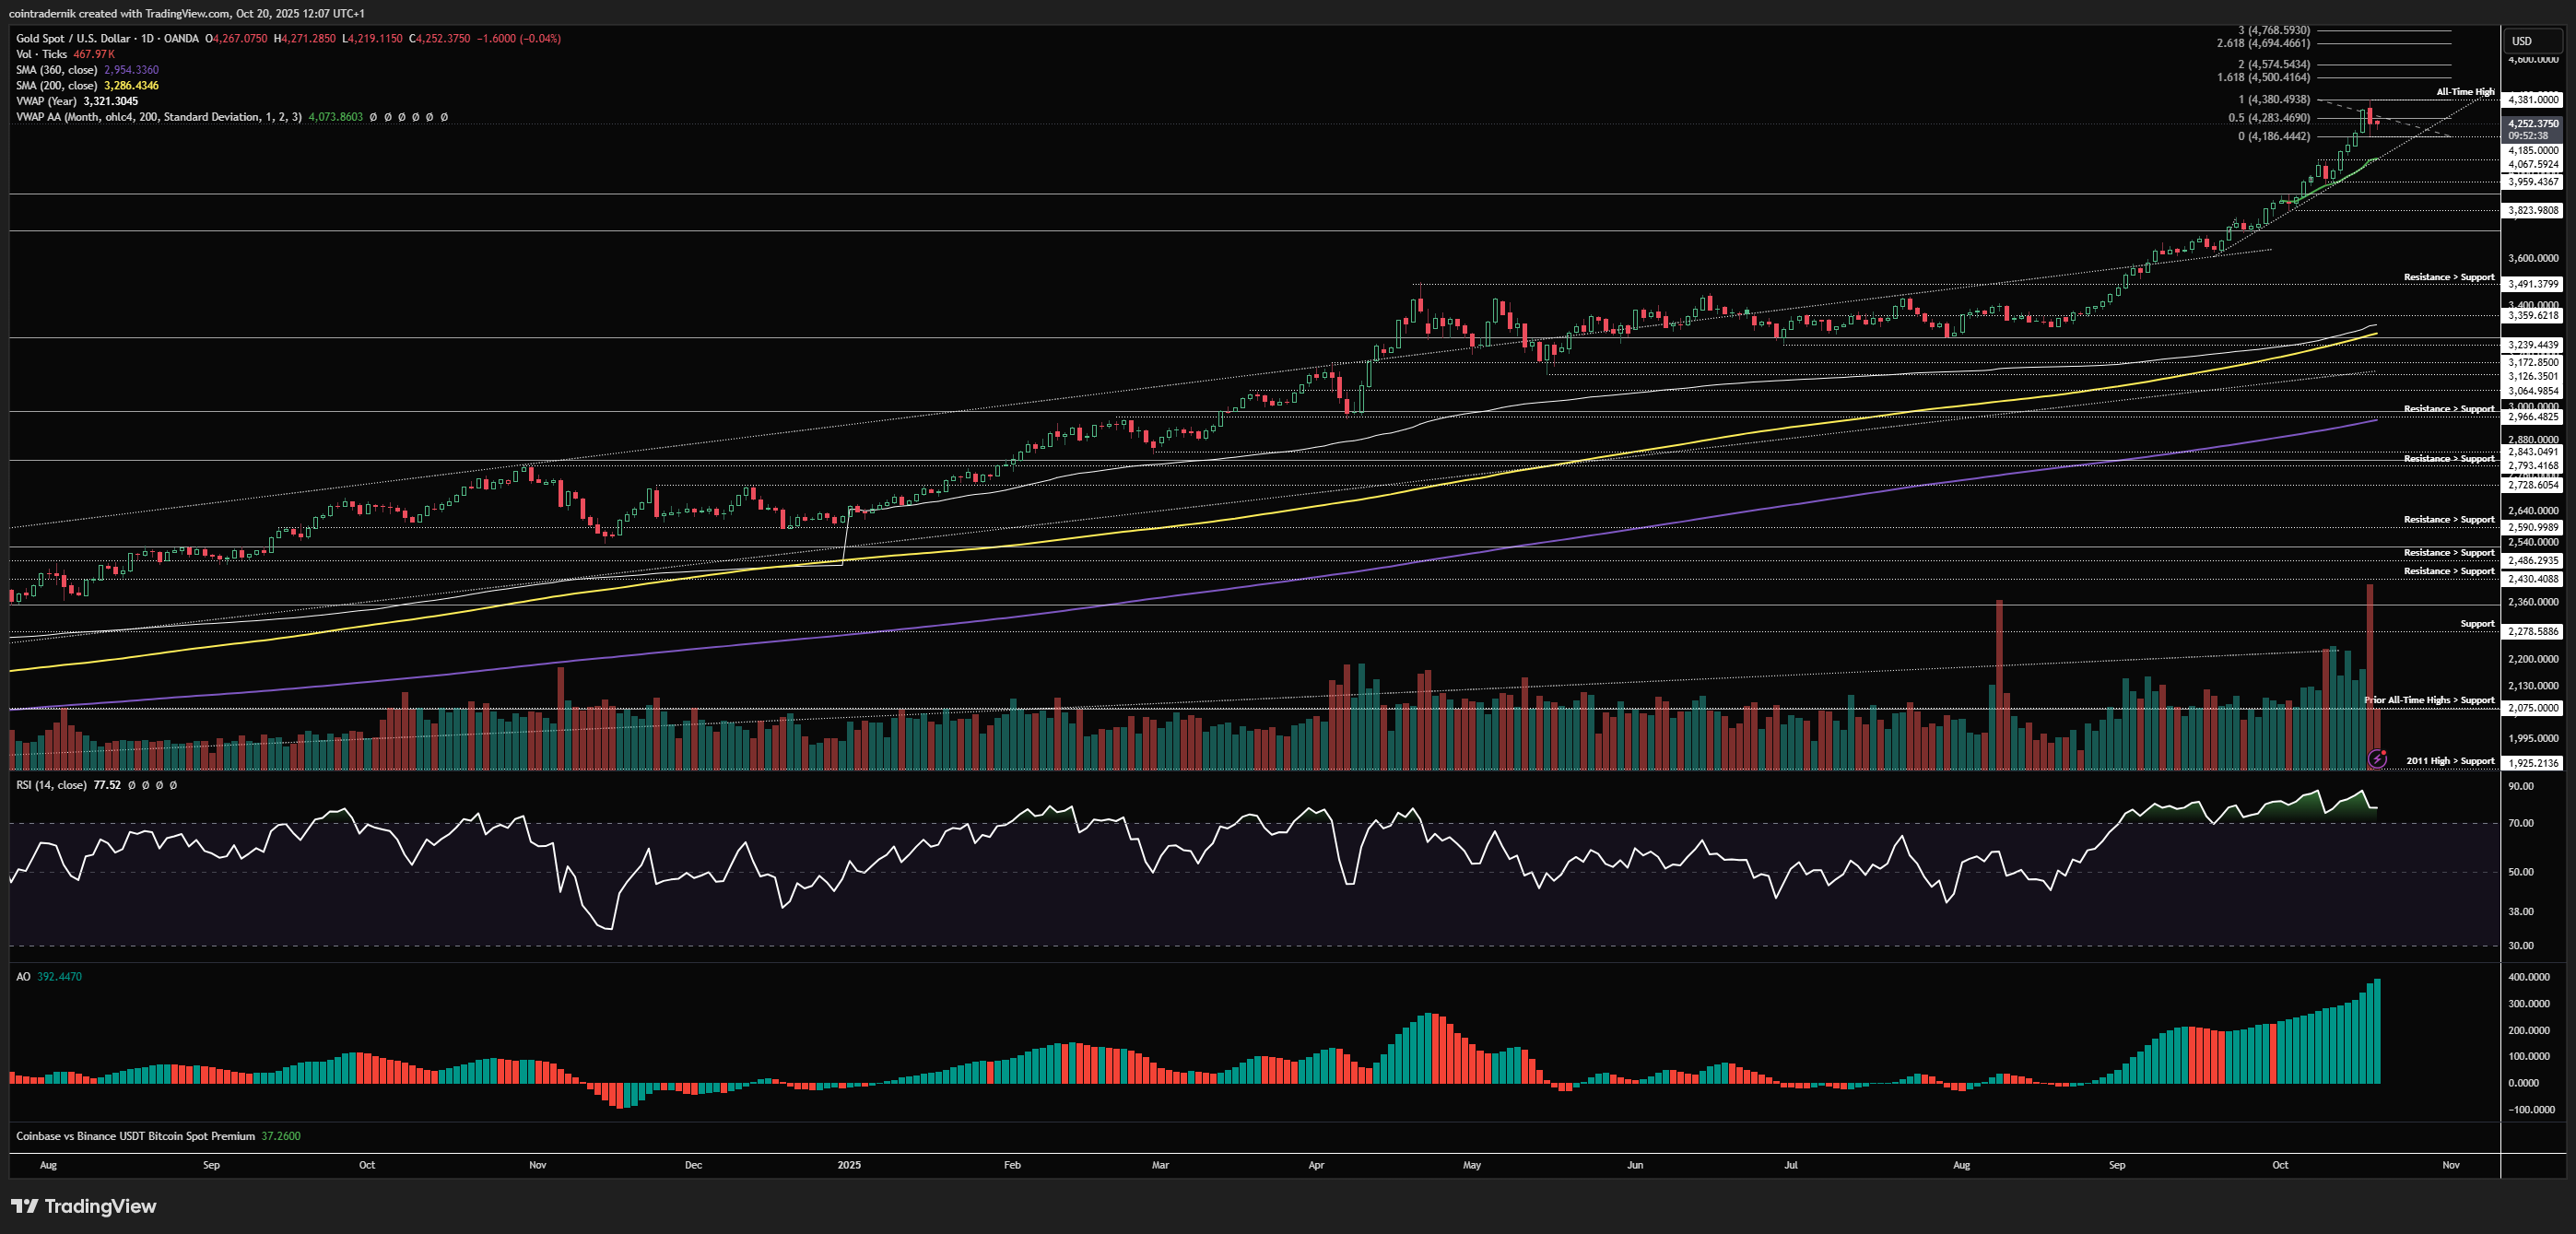
Looking at the daily, we have very marginal bearish divergence on the most recent push higher for RSI (I'm talking barely a divergence at all) but AO has not confirmed this. I don't think it is likely we see a proper divergence before the top forms here, to be honest, though if we do get one leg higher through $4400 into $4500 (the 1.618 extension of the prior daily range where the most volume was traded), then look for that lower high on RSI and AO as signal. What we did see late last week was a strong push higher followed by the highest-volume daily candle in years, which happened to close red as price rejected a move higher beyond $4380. Bears really want to see this act as a bull trap into the highs and squeeze the late longs here, so if we close below that prior daily low at $4185 and form a swing-high I think there's a good chance that was our local top from which we at least retest the monthly VWAP at $4073, which is confluent with prior resistance turned support. Ultimately, if we are putting in our multi-week top here, I would expect price to trade into $3960, which would be about 10% off the highs assuming $4380 sticks. If we get one more leg higher perhaps we only retrace into that October VWAP before a bottom is found and a new range forms. What I do know is under no circumstances would I want to be looking for fresh longs on Gold anymore.
Price: $5.02
Weekly:
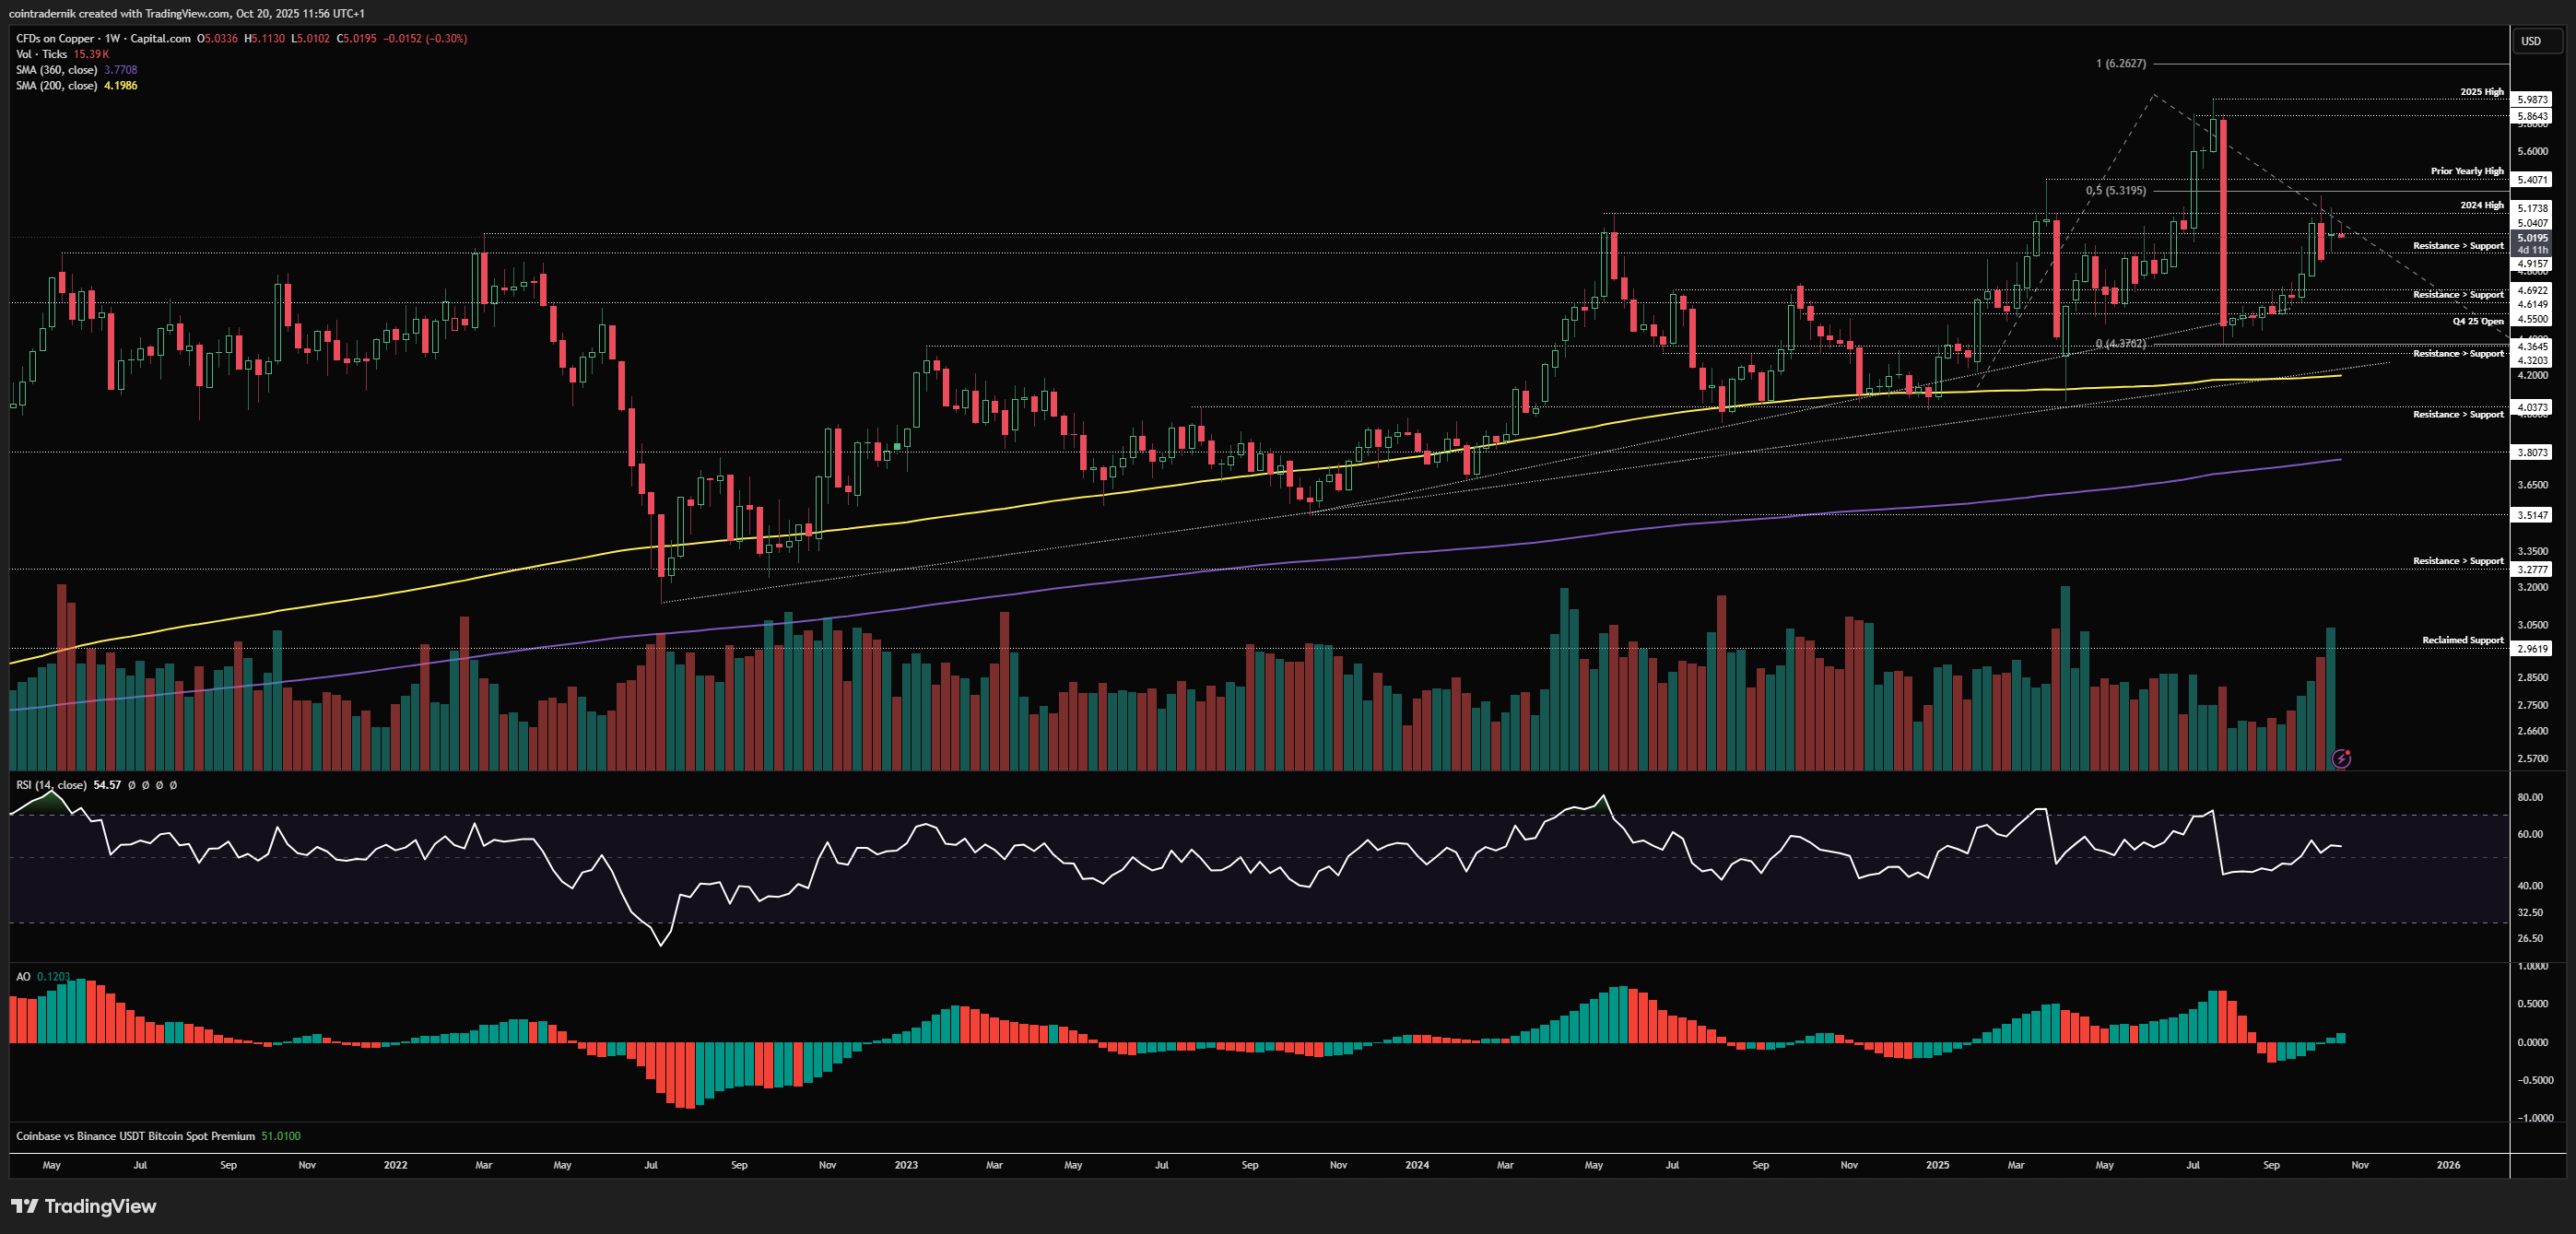
Beginning with the weekly for Copper, we can see price has been consolidating in tighter weekly ranges after the impulse out of the range into $5.30. Volume continues to grow and I expect we are pretty close to an upside resolution of this consolidation and the next leg higher for Copper into 2025 highs and beyond. I am still sidelined to be honest as I don't really like the R/R of a long right here inside this range when invalidation of my broader view is down below $4.30, so I am hoping I get some nice structure on the lower timeframes that presents an opportunity to jump on...
Daily:
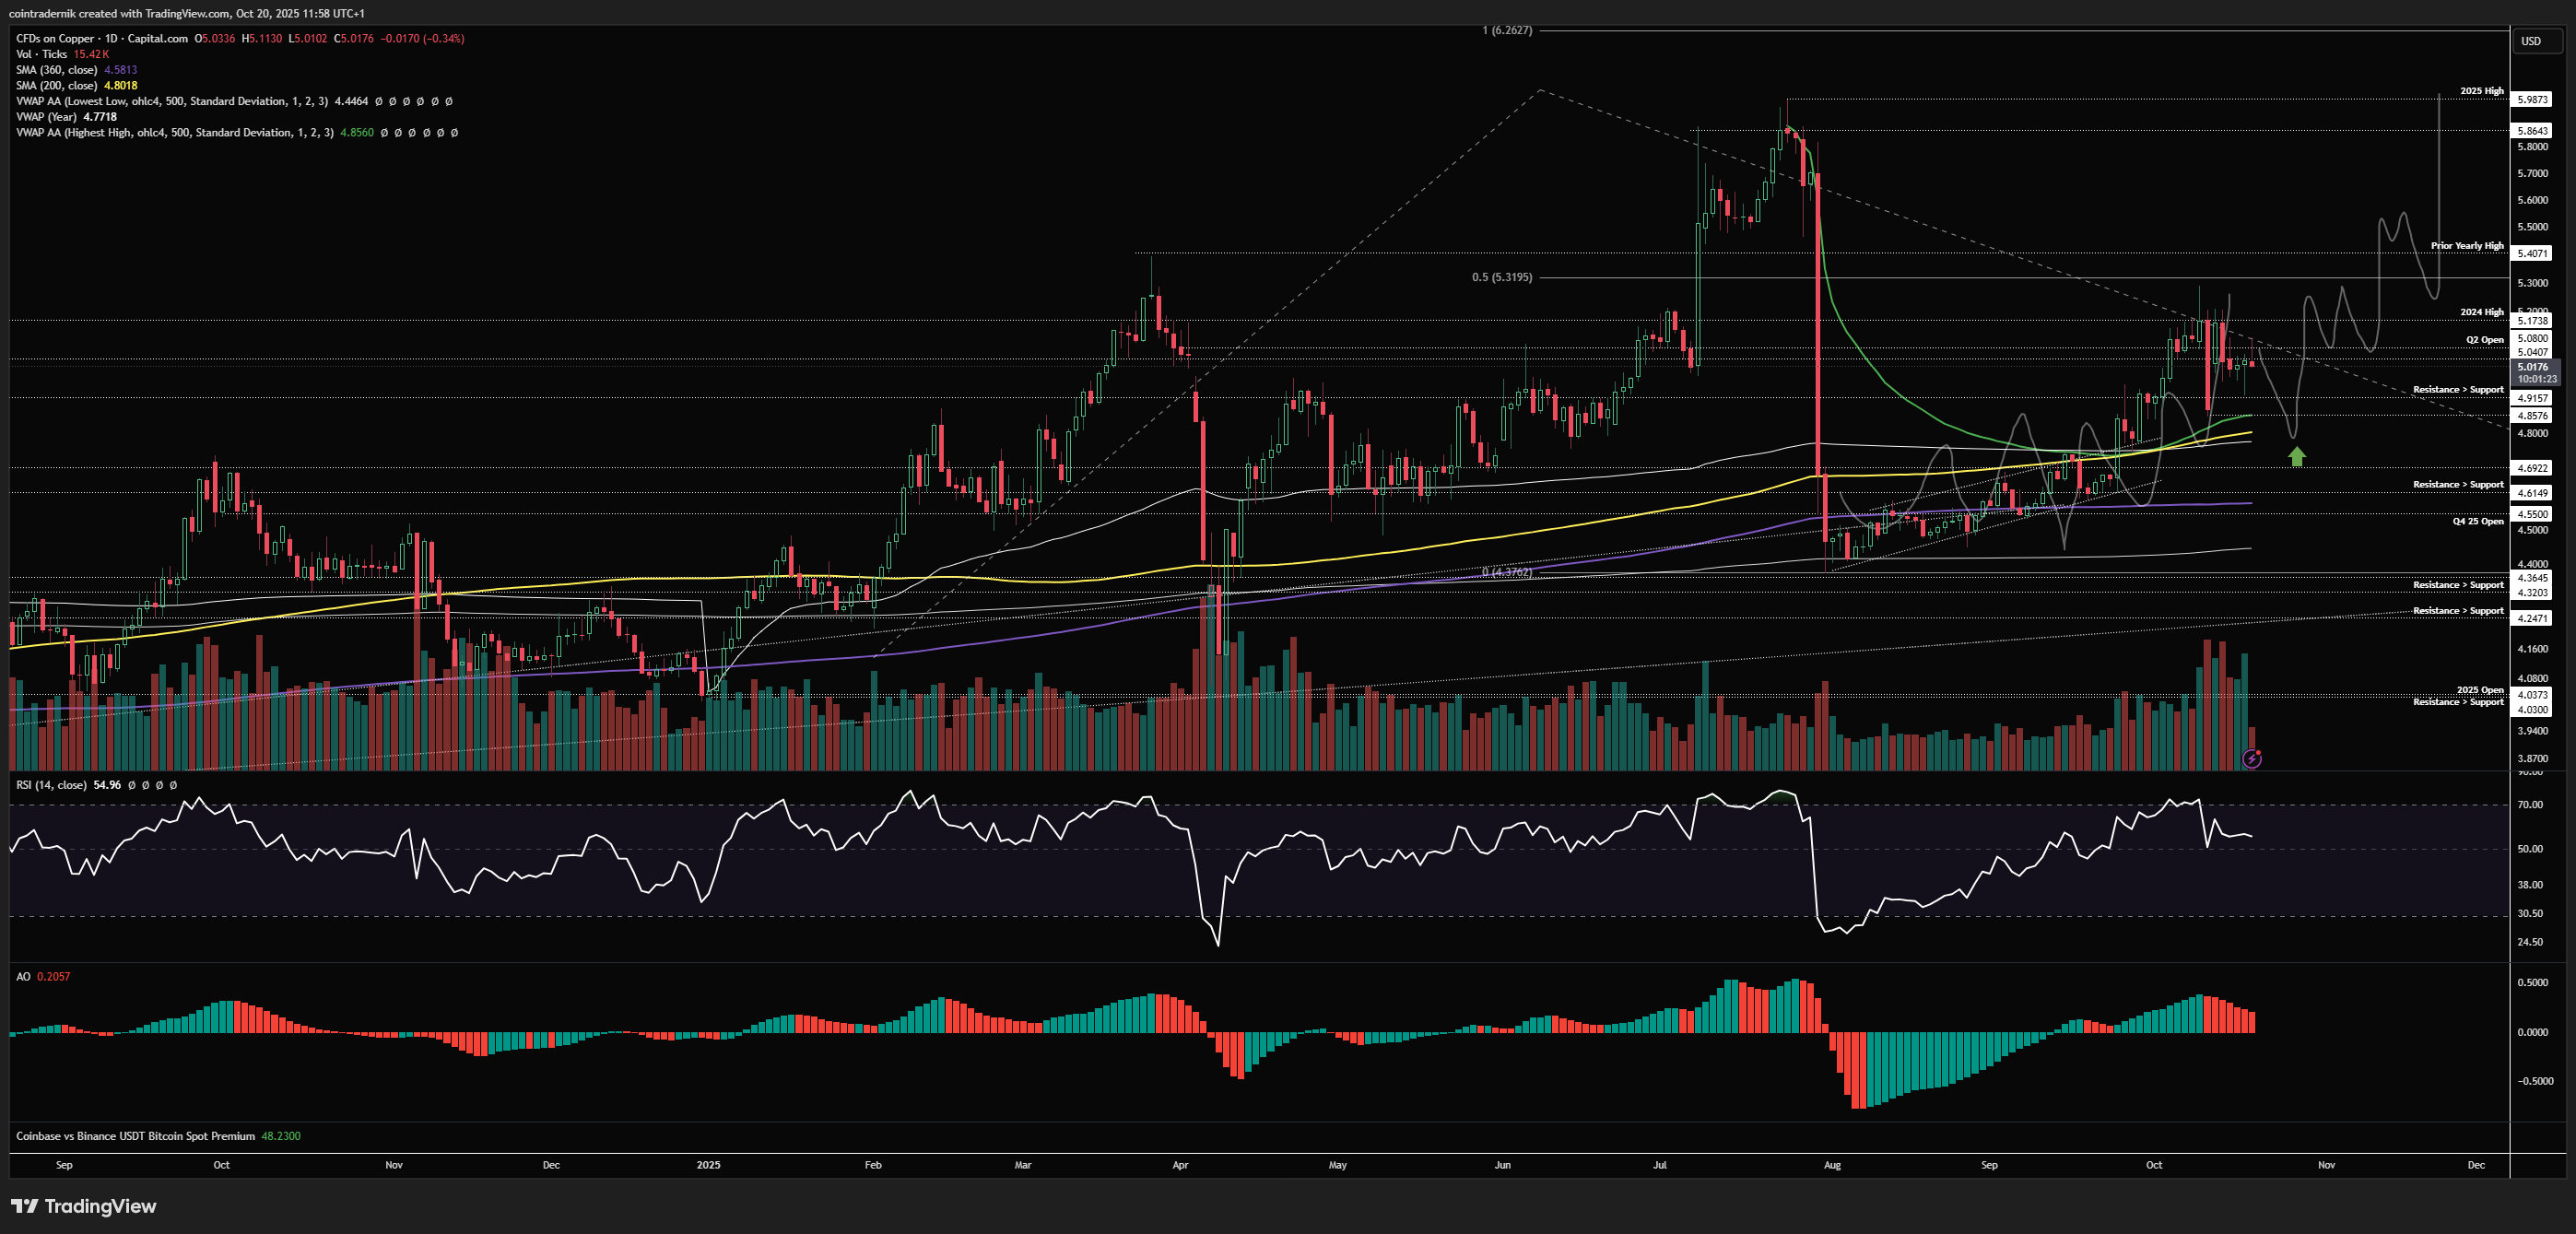
Looking finally at the daily, we can see that price pretty much perfectly played out the range trajectory I had expected which culminated in that breakout move through multiple prior support levels into $5.30, where price rejected and has since been consolidating within the range of that large daily rejection candle, above reclaimed support at $4.90 and above key MAs and VWAPs. What I would love to see as sidelineoor is a quick flush lower through the low of that daily range at $4.85, into the VWAP from the all-time high and the 200dMA, where I will be placing limits with invalidation on acceptance below $4.36, looking for $6+ into year-end. If we don't get the flush and rip higher from here, I will look to buy a dip into the 2024 highs from above as resistance turned support with invalidation moving to a daily close below $4.70 in that scenario, as we would have resolved this range to the upside and should not be closing back below the range if we're bullish. Let's see how the next couple of weeks plays out.
I hope you've found some value in the read this week!
And if you've not already signed up for Ostium, please do so and test out some of the recent updates, including:
Sign up here (you don't have to use my ref link, of course): https://ostium.app/trade?from=CL&to=USD&ref=CTNIK

.avif)