

Market Outlook #50
September 8, 2025
-
12
min read


This blog references an opinion and is for entertainment and informational purposes only. It is not intended to be investment advice. Seek a duly licensed professional for investment advice.
In this 50th Market Outlook here at Ostium Research, we'll be taking a look at the week ahead in markets, focusing specifically on price-action, positioning and event risk for Bitcoin, Ethereum, DXY, Gold and Crude Oil.
Firstly, let's take a look at the calendar for the moderately busy week ahead, with a quiet Monday and Tuesday but more action-packed weekly close:
WEDNESDAY: SNB CHAIRMAN SCHLEGEL SPEECH
WEDNESDAY: US PRODUCER PRICE INDEX EX FOOD & ENERGY (MOM) (AUG): (CONSENSUS 0.3% VS PREVIOUS 0.9%)
THURSDAY: ECB INTEREST RATE DECISION: (CONSENSUS 2% VS PREVIOUS 2%)
THURSDAY: US CONSUMER PRICE INDEX (MOM) (AUG): (CONSENSUS 0.3% VS PREVIOUS 0.2%)
THURSDAY: US INITIAL JOBLESS CLAIMS: (CONSENSUS 240K VS PREVIOUS 237K)
FRIDAY: US MICHIGAN CONSUMER SENTIMENT INDEX: (CONSENSUS 59.2 VS PREVIOUS 58.2)
Now, let's dig into asset-specific price-action for the week ahead, looking firstly at Bitcoin:
Price: $111,132
Weekly:
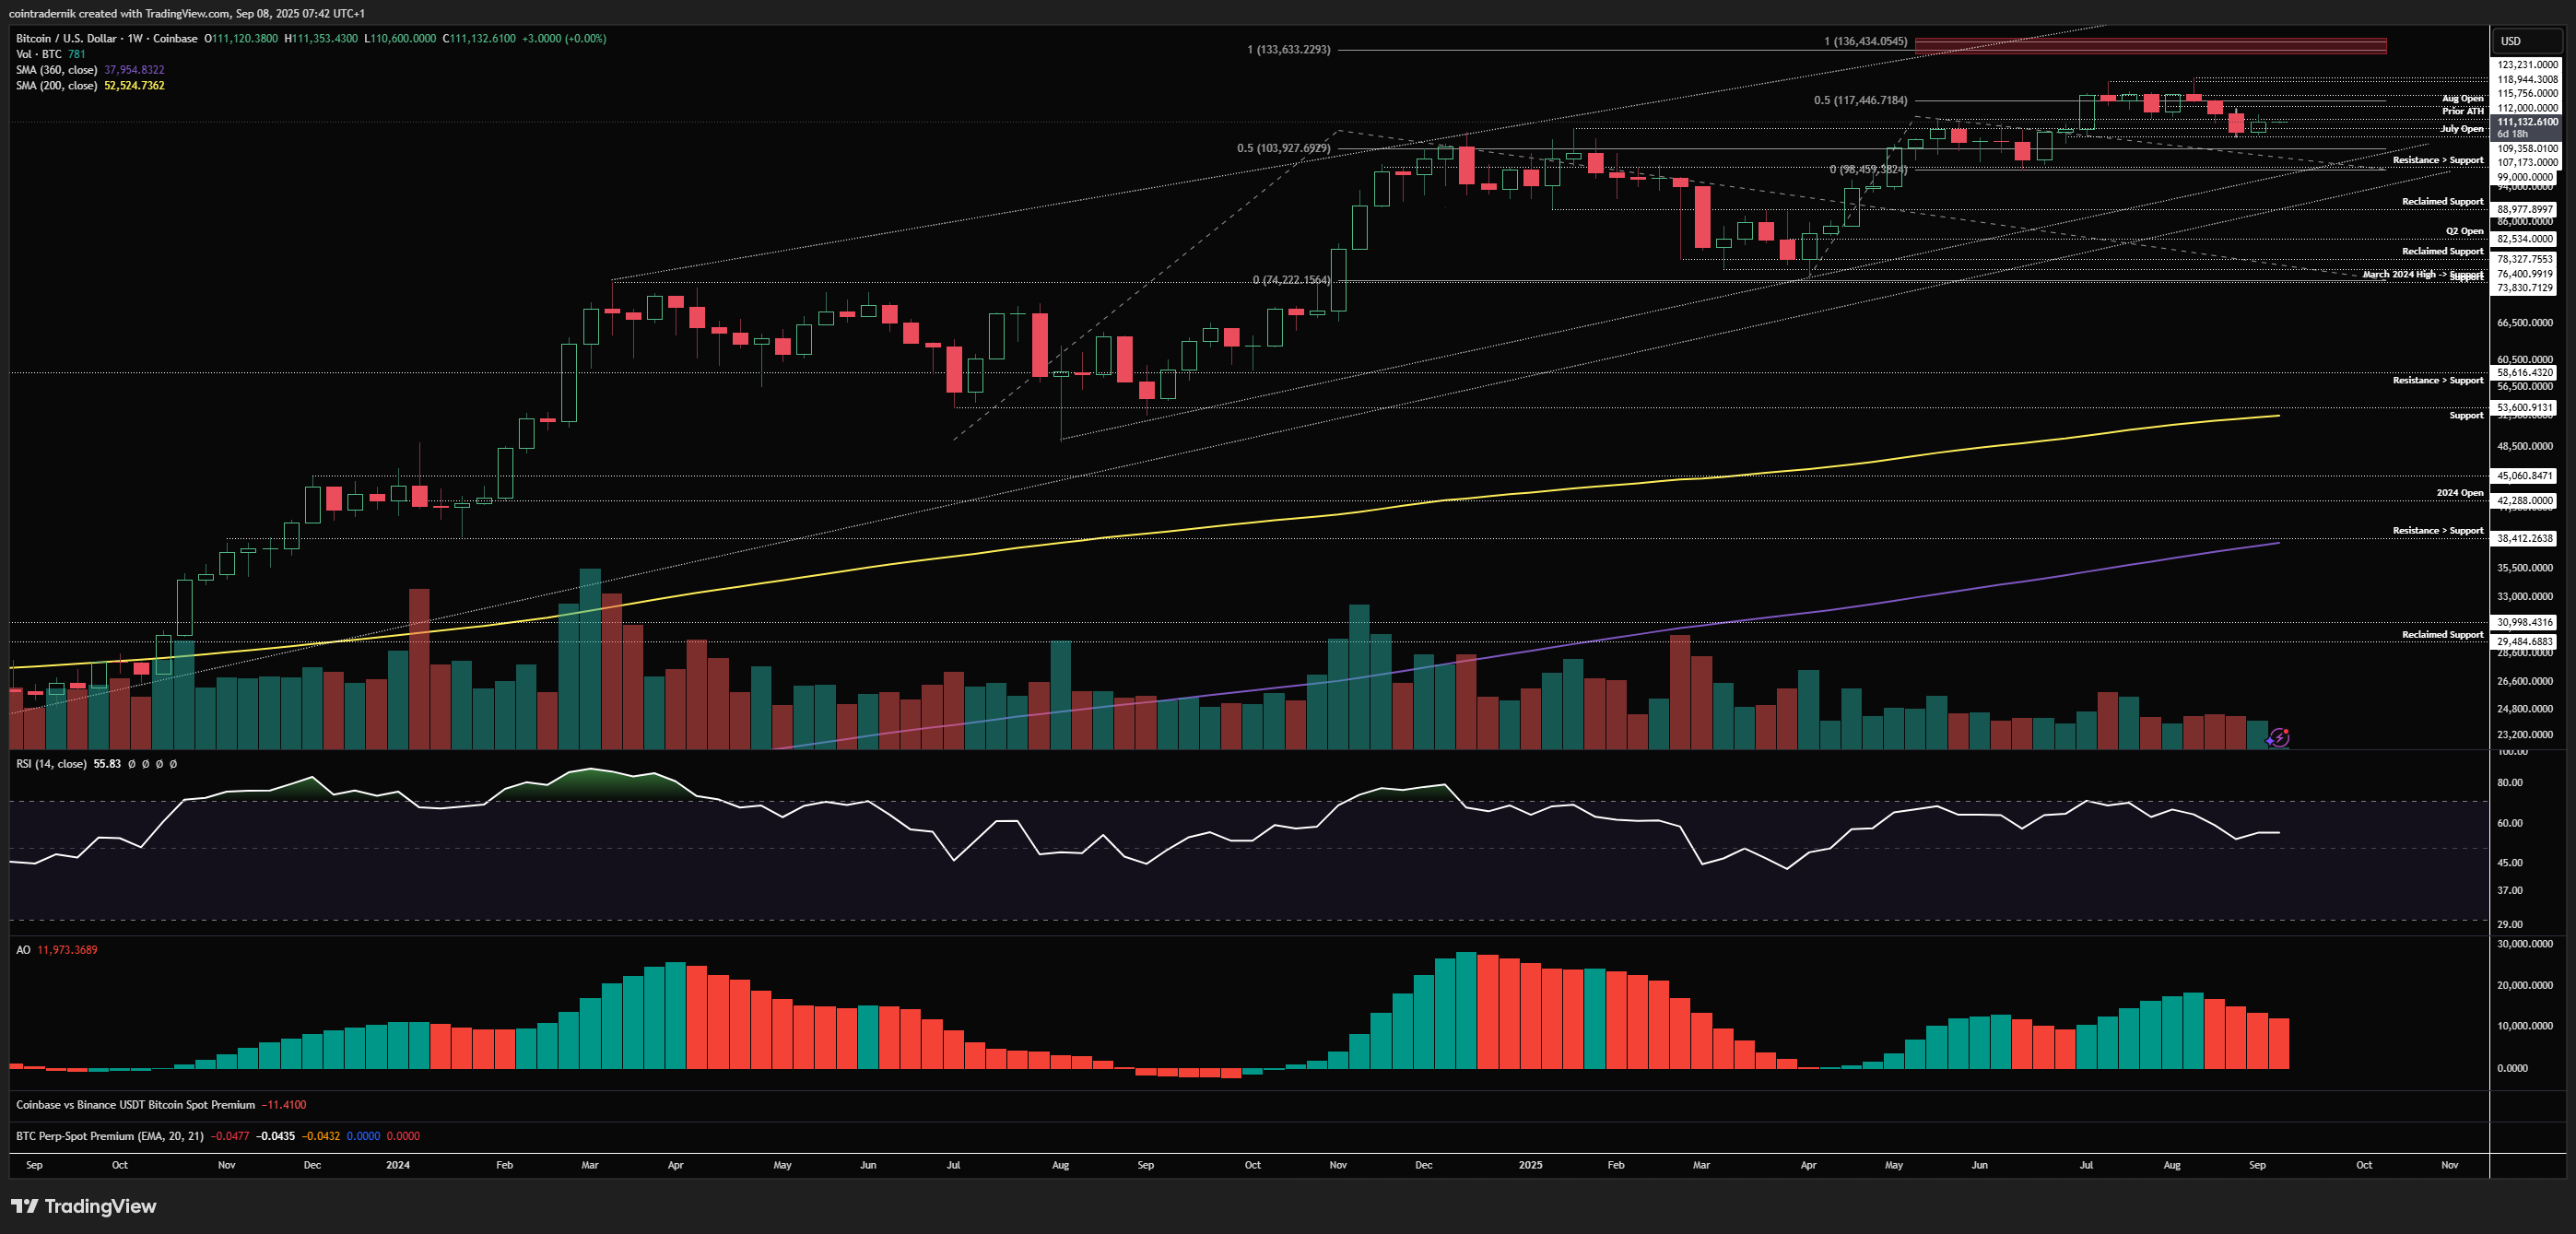
Beginning with the weekly view for BTC, we can see that last week closed marginally green after finding support above the July open to close the week at $111.1k, rejecting below previous all-time highs and major resistance at $112k. We remain in bullish weekly structure above that $99k higher-low and weekly momentum continues to look supportive of higher prices from here. For bears, you want to see $112k hold as resistance this week and price to push through that July open at $107k, closing below that level to confirm further downside into $99k, where it is likely we would see some sort of liquidation event around that key swing-low and trendline support before a major low can form. Only on acceptance below $99k can you start entertaining more bearish outcomes than that, in my view. I am currently very much of the expectation that we are forming our higher-low here above $99k from which we retest all-time highs, and I would expect any wick lower this week back into the July open to be met with demand and a reclaim of $112k into the weekly close, from which we continue into the $117.5k area next week.
Daily:
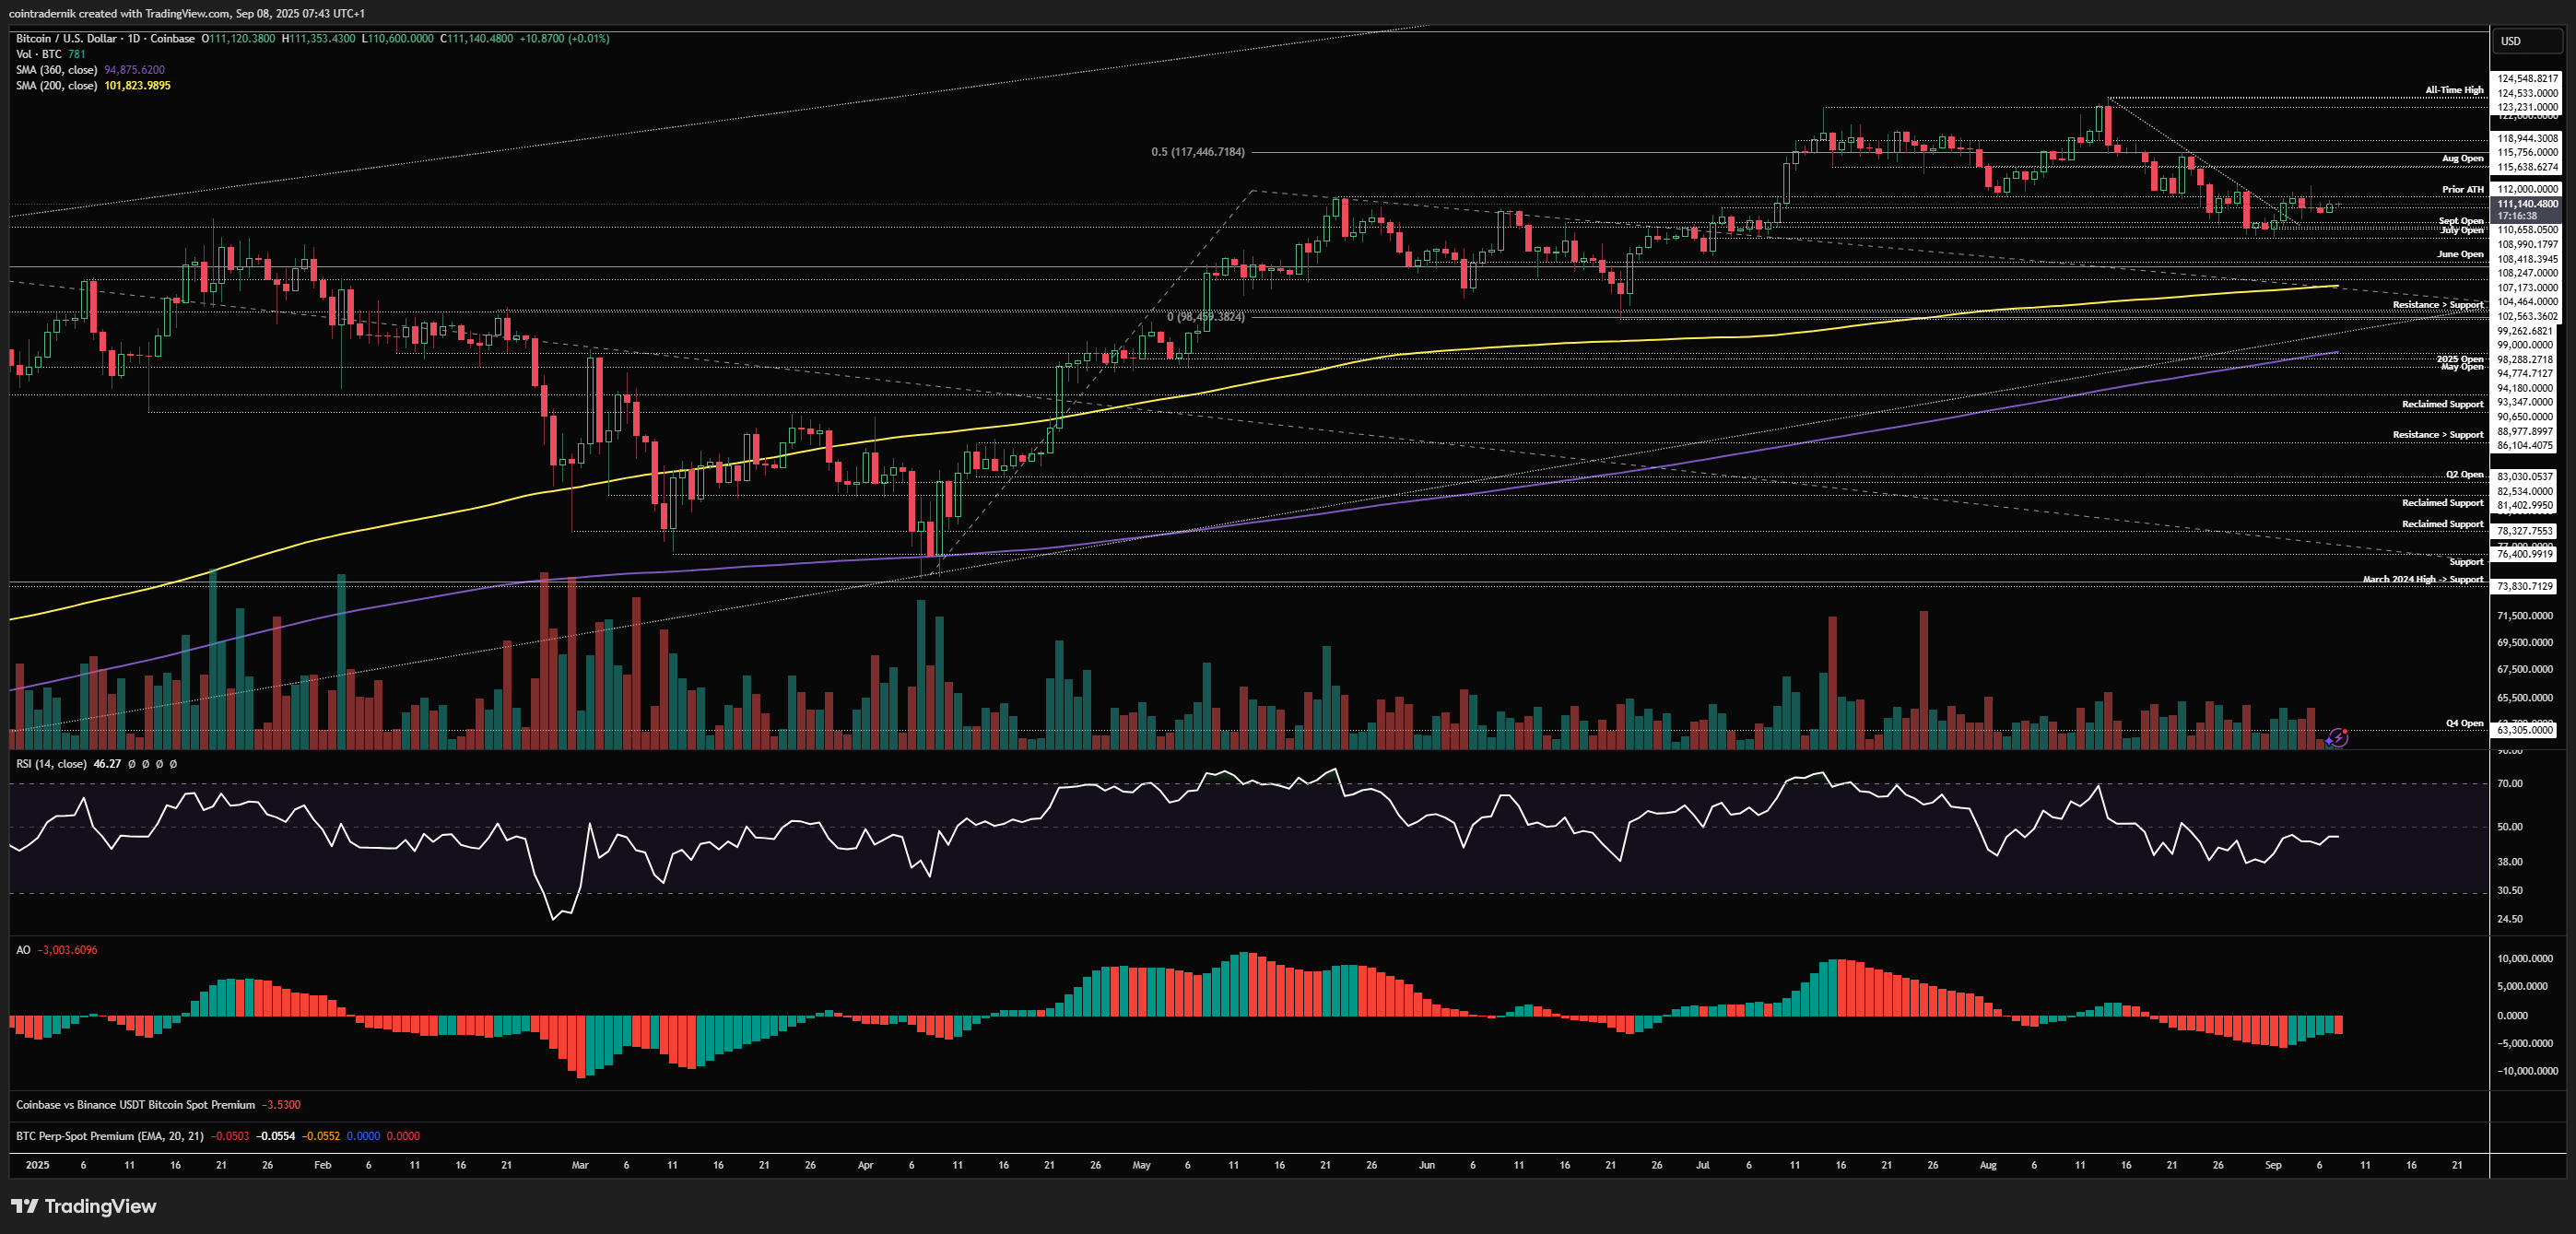
Looking now at the daily, momentum looks to have bottomed out here and last week saw price break out above trendline resistance from the all-time high. Nonetheless, daily structure continues to be bearish until we reclaim $112kish as support. If we move lower early this week below the weekend lows into the September open, I think that is where you need to see buyers step in for this higher-low formation to be validated; if we close back below the Sept open I think it is likely we take out the July open and there the reaction will be telling as to whether that is a deviation and reclaim of support or acceptance for another leg lower into the confluence of support around the 200dMA. Given that we did wick below the previous weekly low last week right into that July open and bounce, I lean towards the bottom being in here and a higher-low to form above $107k this week from which price reclaims $112k into the weekly close.
Now, thinking about potential setups for this week, I want to preface this with the fact that I believe there is a decent chance you don't actually get the opportunity for an 'easy' long this week and instead we just rip higher once we accept above $112k. This is primarily because I don't think there is much headline risk this week even with inflation data ahead. But, if we do see derisking into Wednesday, I think you can long a sweep of the weekend lows into the September open as long as we don't take out the Friday high at $113.5k first (so you basically want to see downonly.exe from here into Weds):
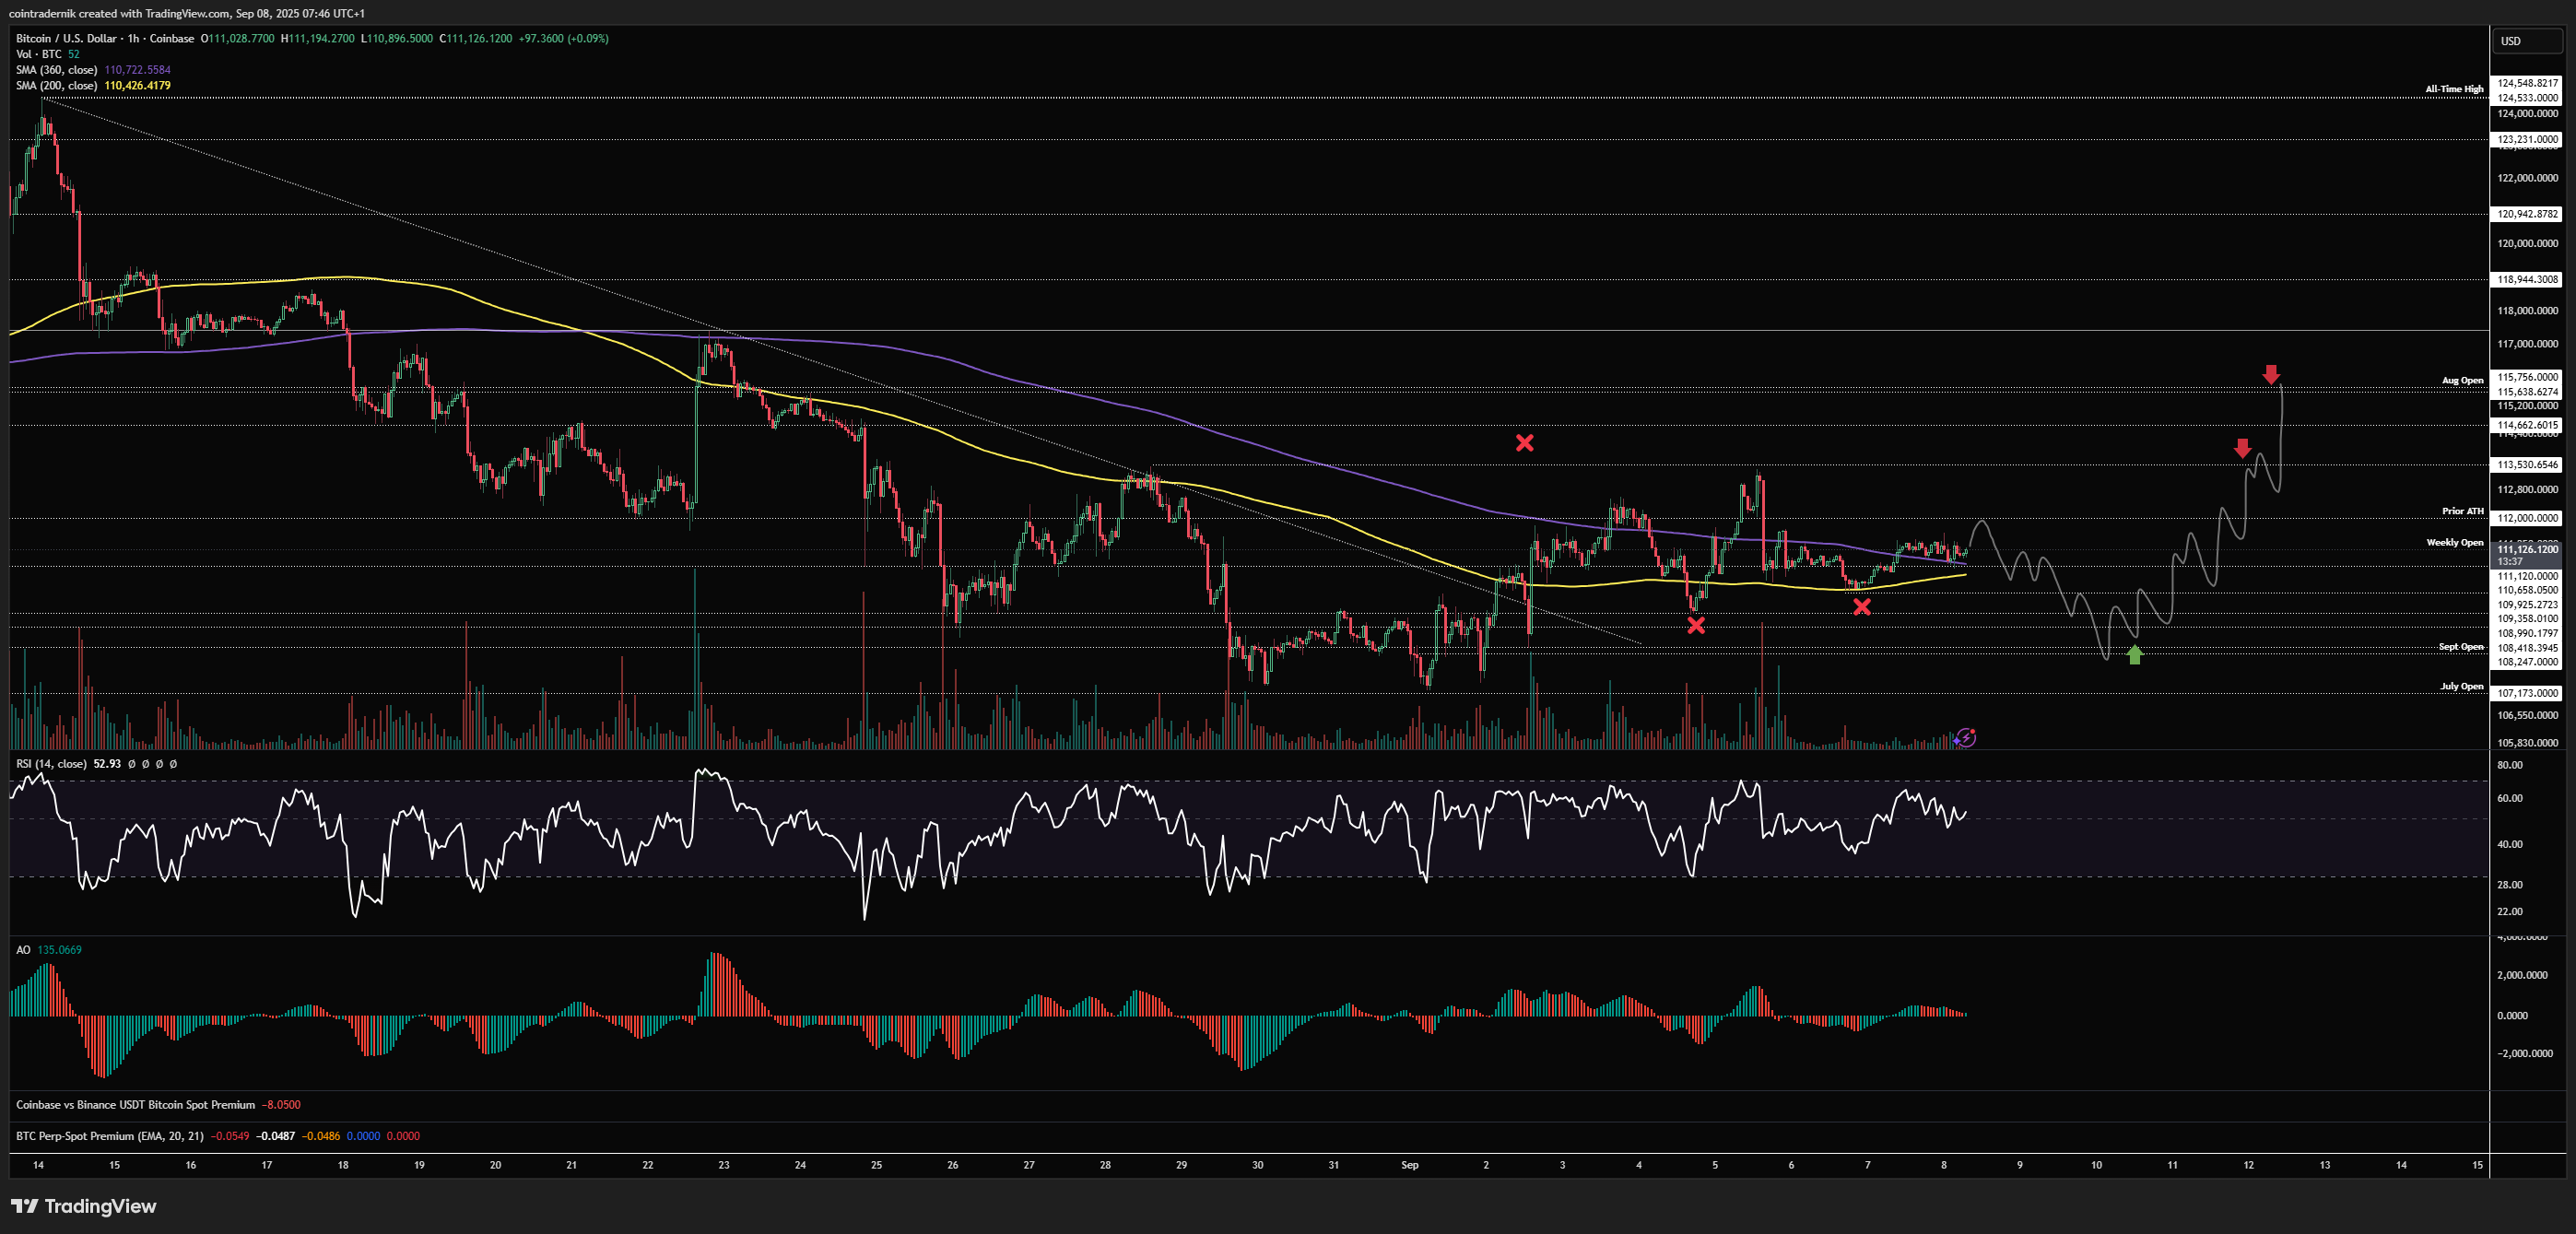
On the short side, you want to see us leave the weekend lows untouched and rip higher early this week, but then form trend exhaustion around the Friday highs and then short a breakdown back below that Friday high at $113.5k, with TP1 at the weekly open and TP2 at the Sept open. I wouldn't take this without confluence of momentum divergences because we could just be flipping structure here and continuing to rip higher into the weekly close - that weakness and subsequent breakdown into perceived headline risk is what would make the fade more probable:

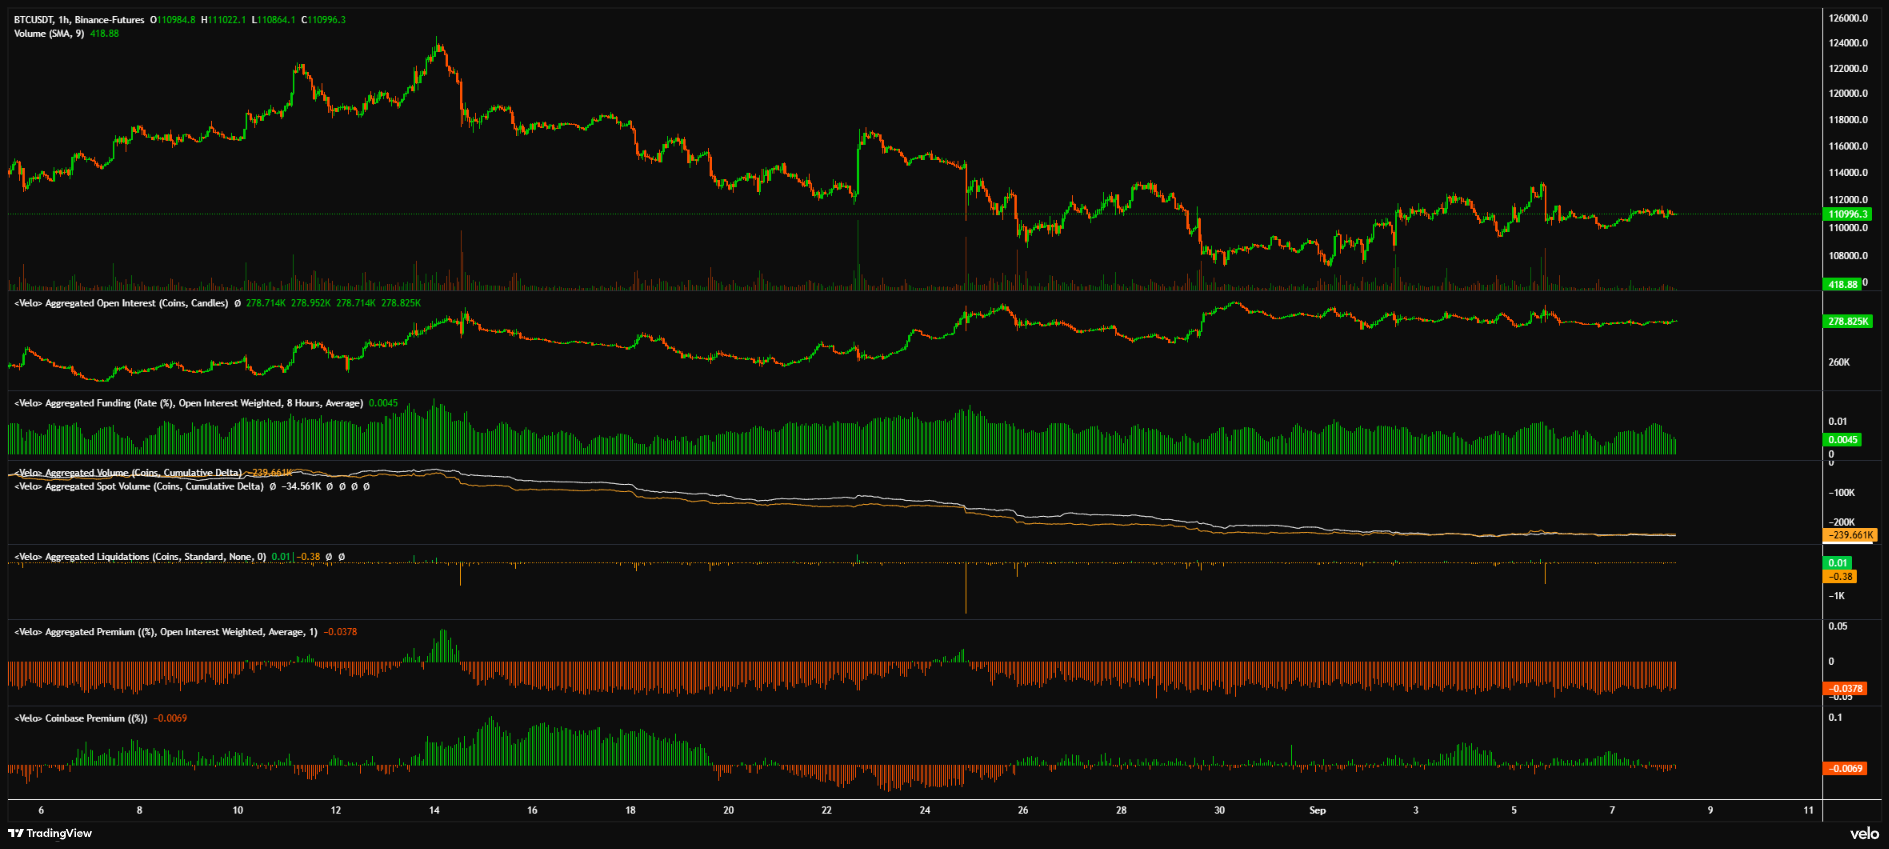
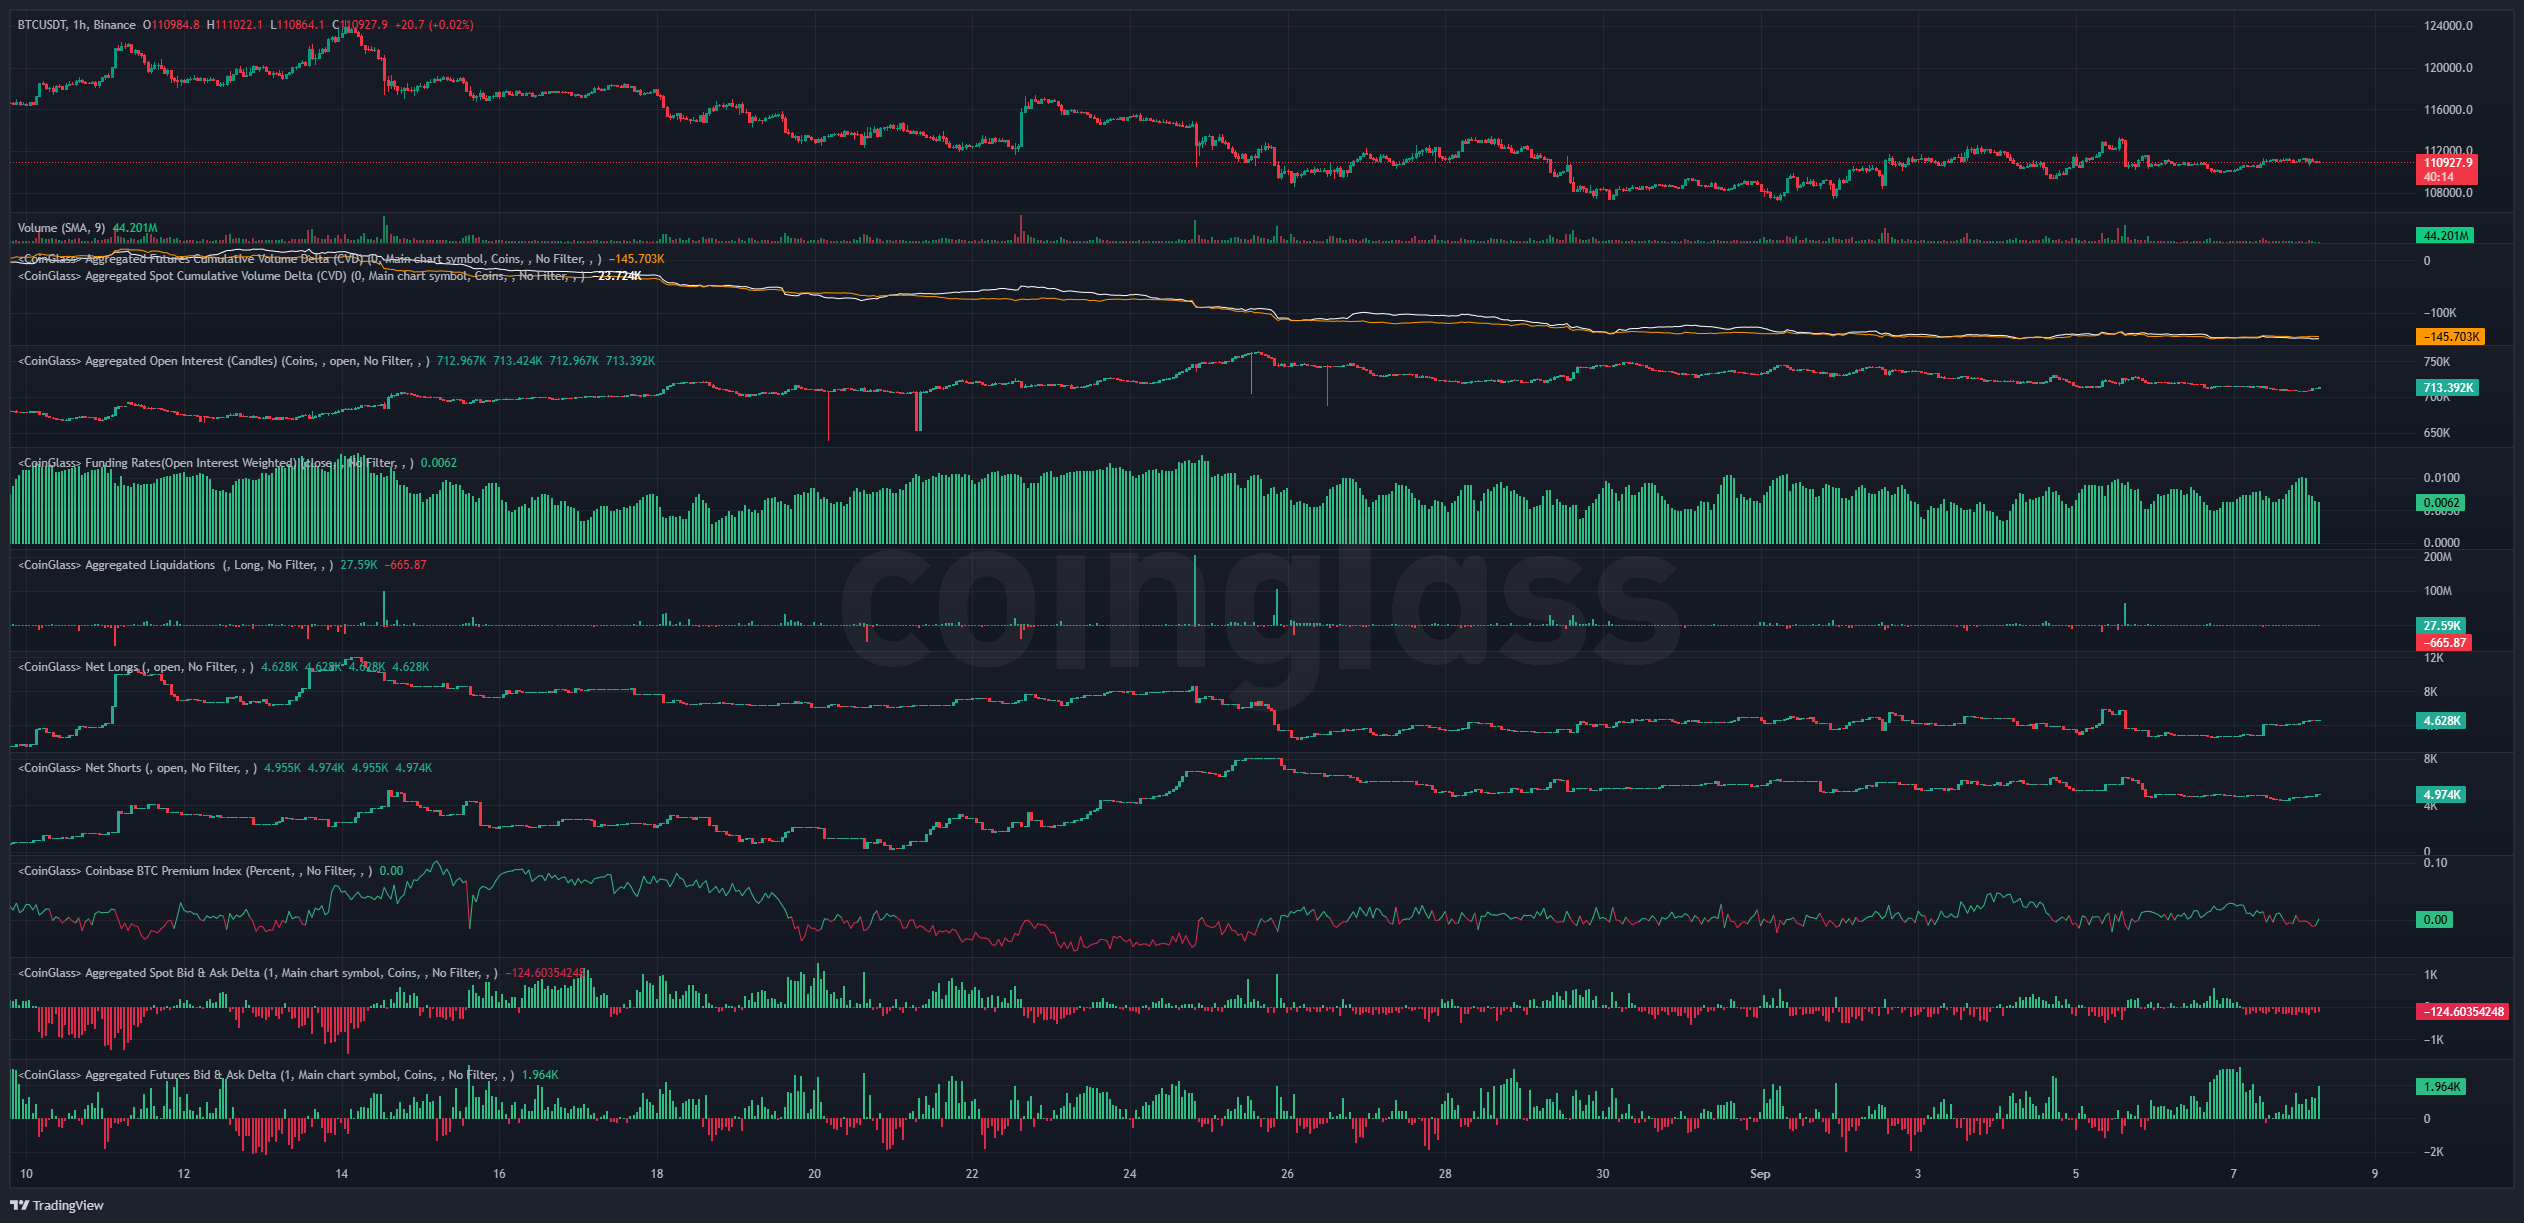
And here's a snapshot of positioning across Velo and CoinGlass:
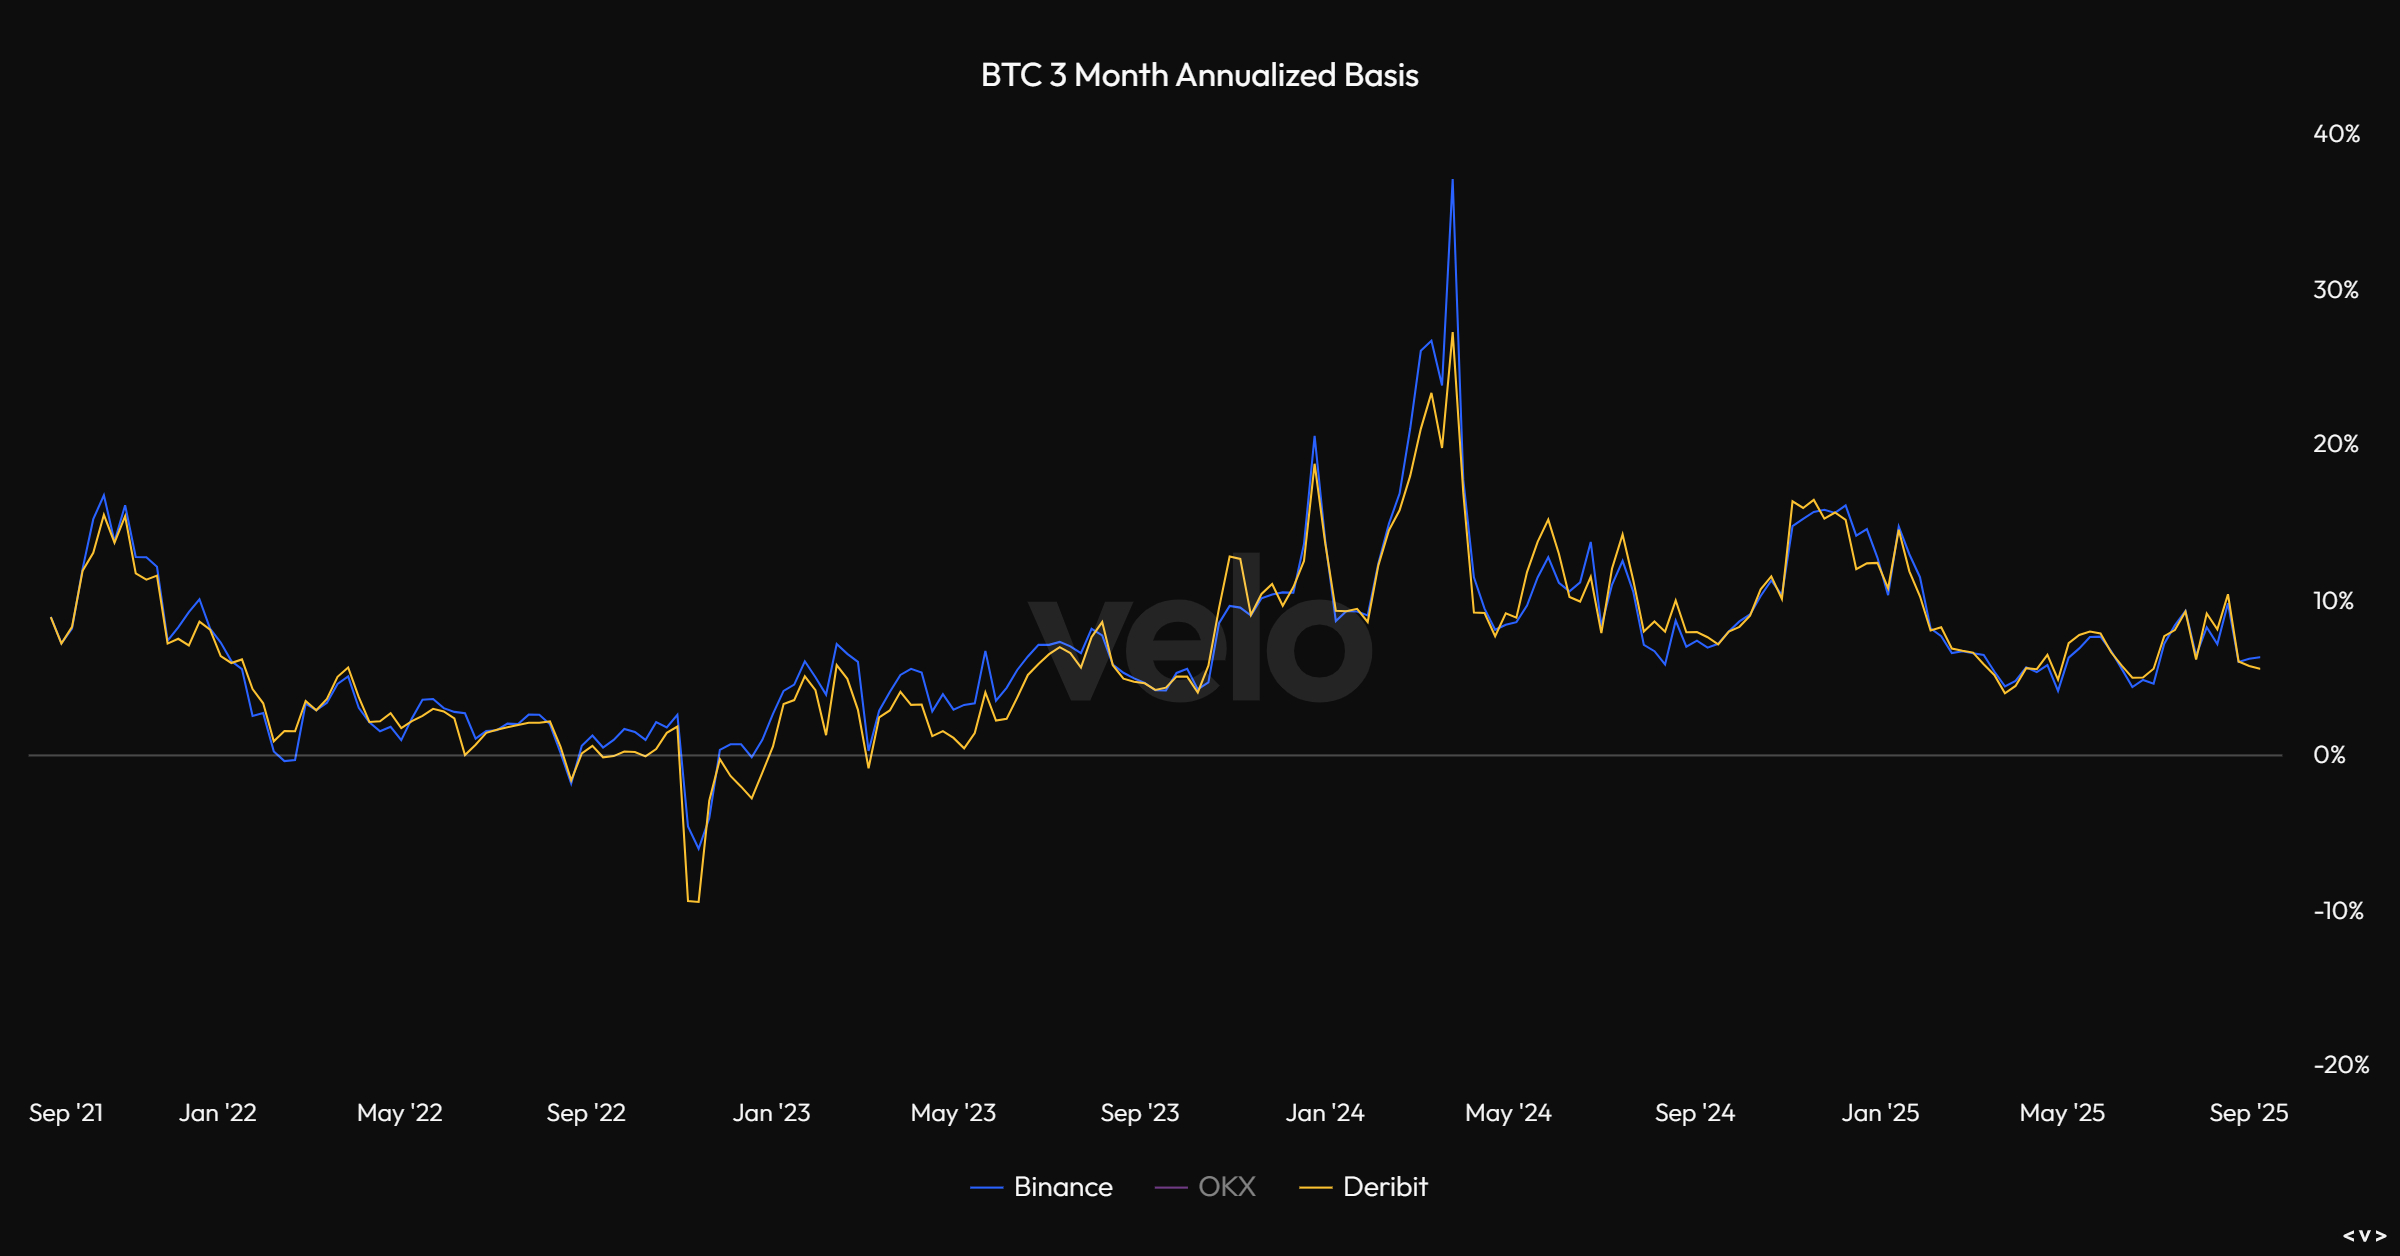
And here's 3-month annualized basis:
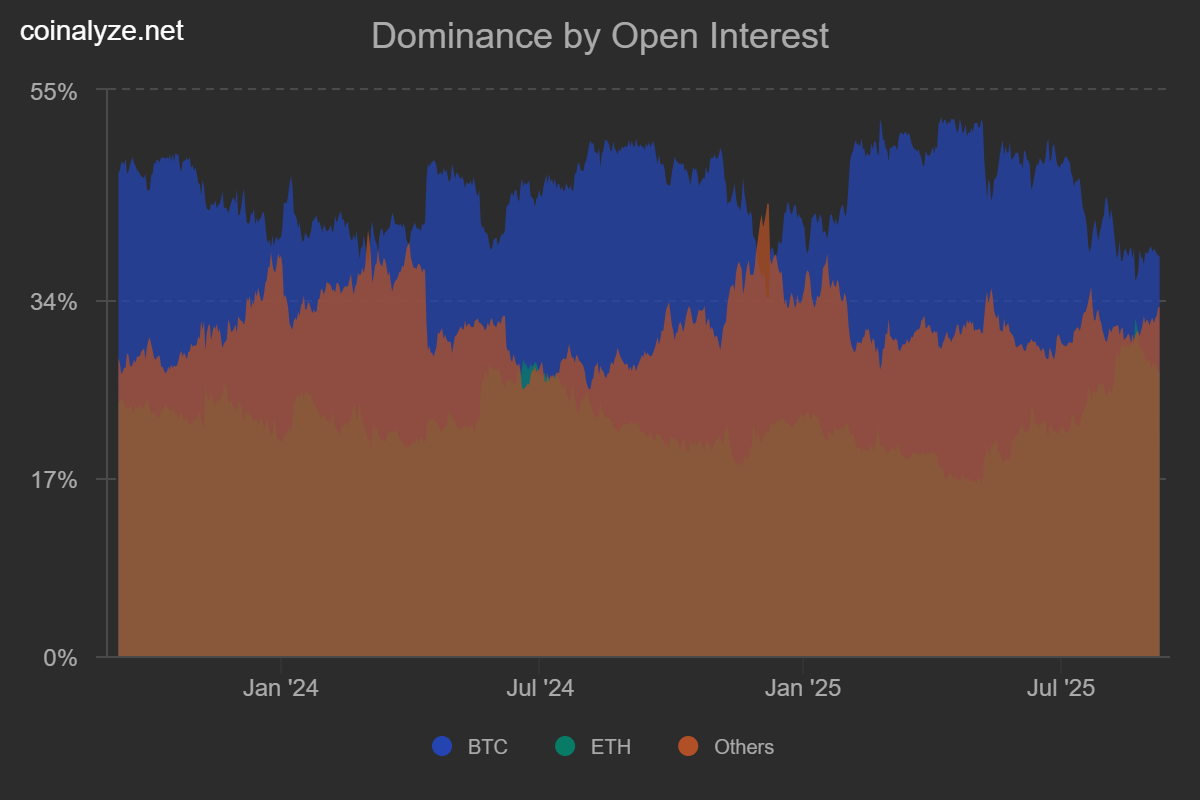
And Bitcoin OI vs Altcoin OI:
And finally some of the expected 1-week and 1-month liquidation levels:
-2025-09-08_07_18_17.png)
-2025-09-08_07_18_45.png)
Price: $4293
ETH/USD
Weekly:
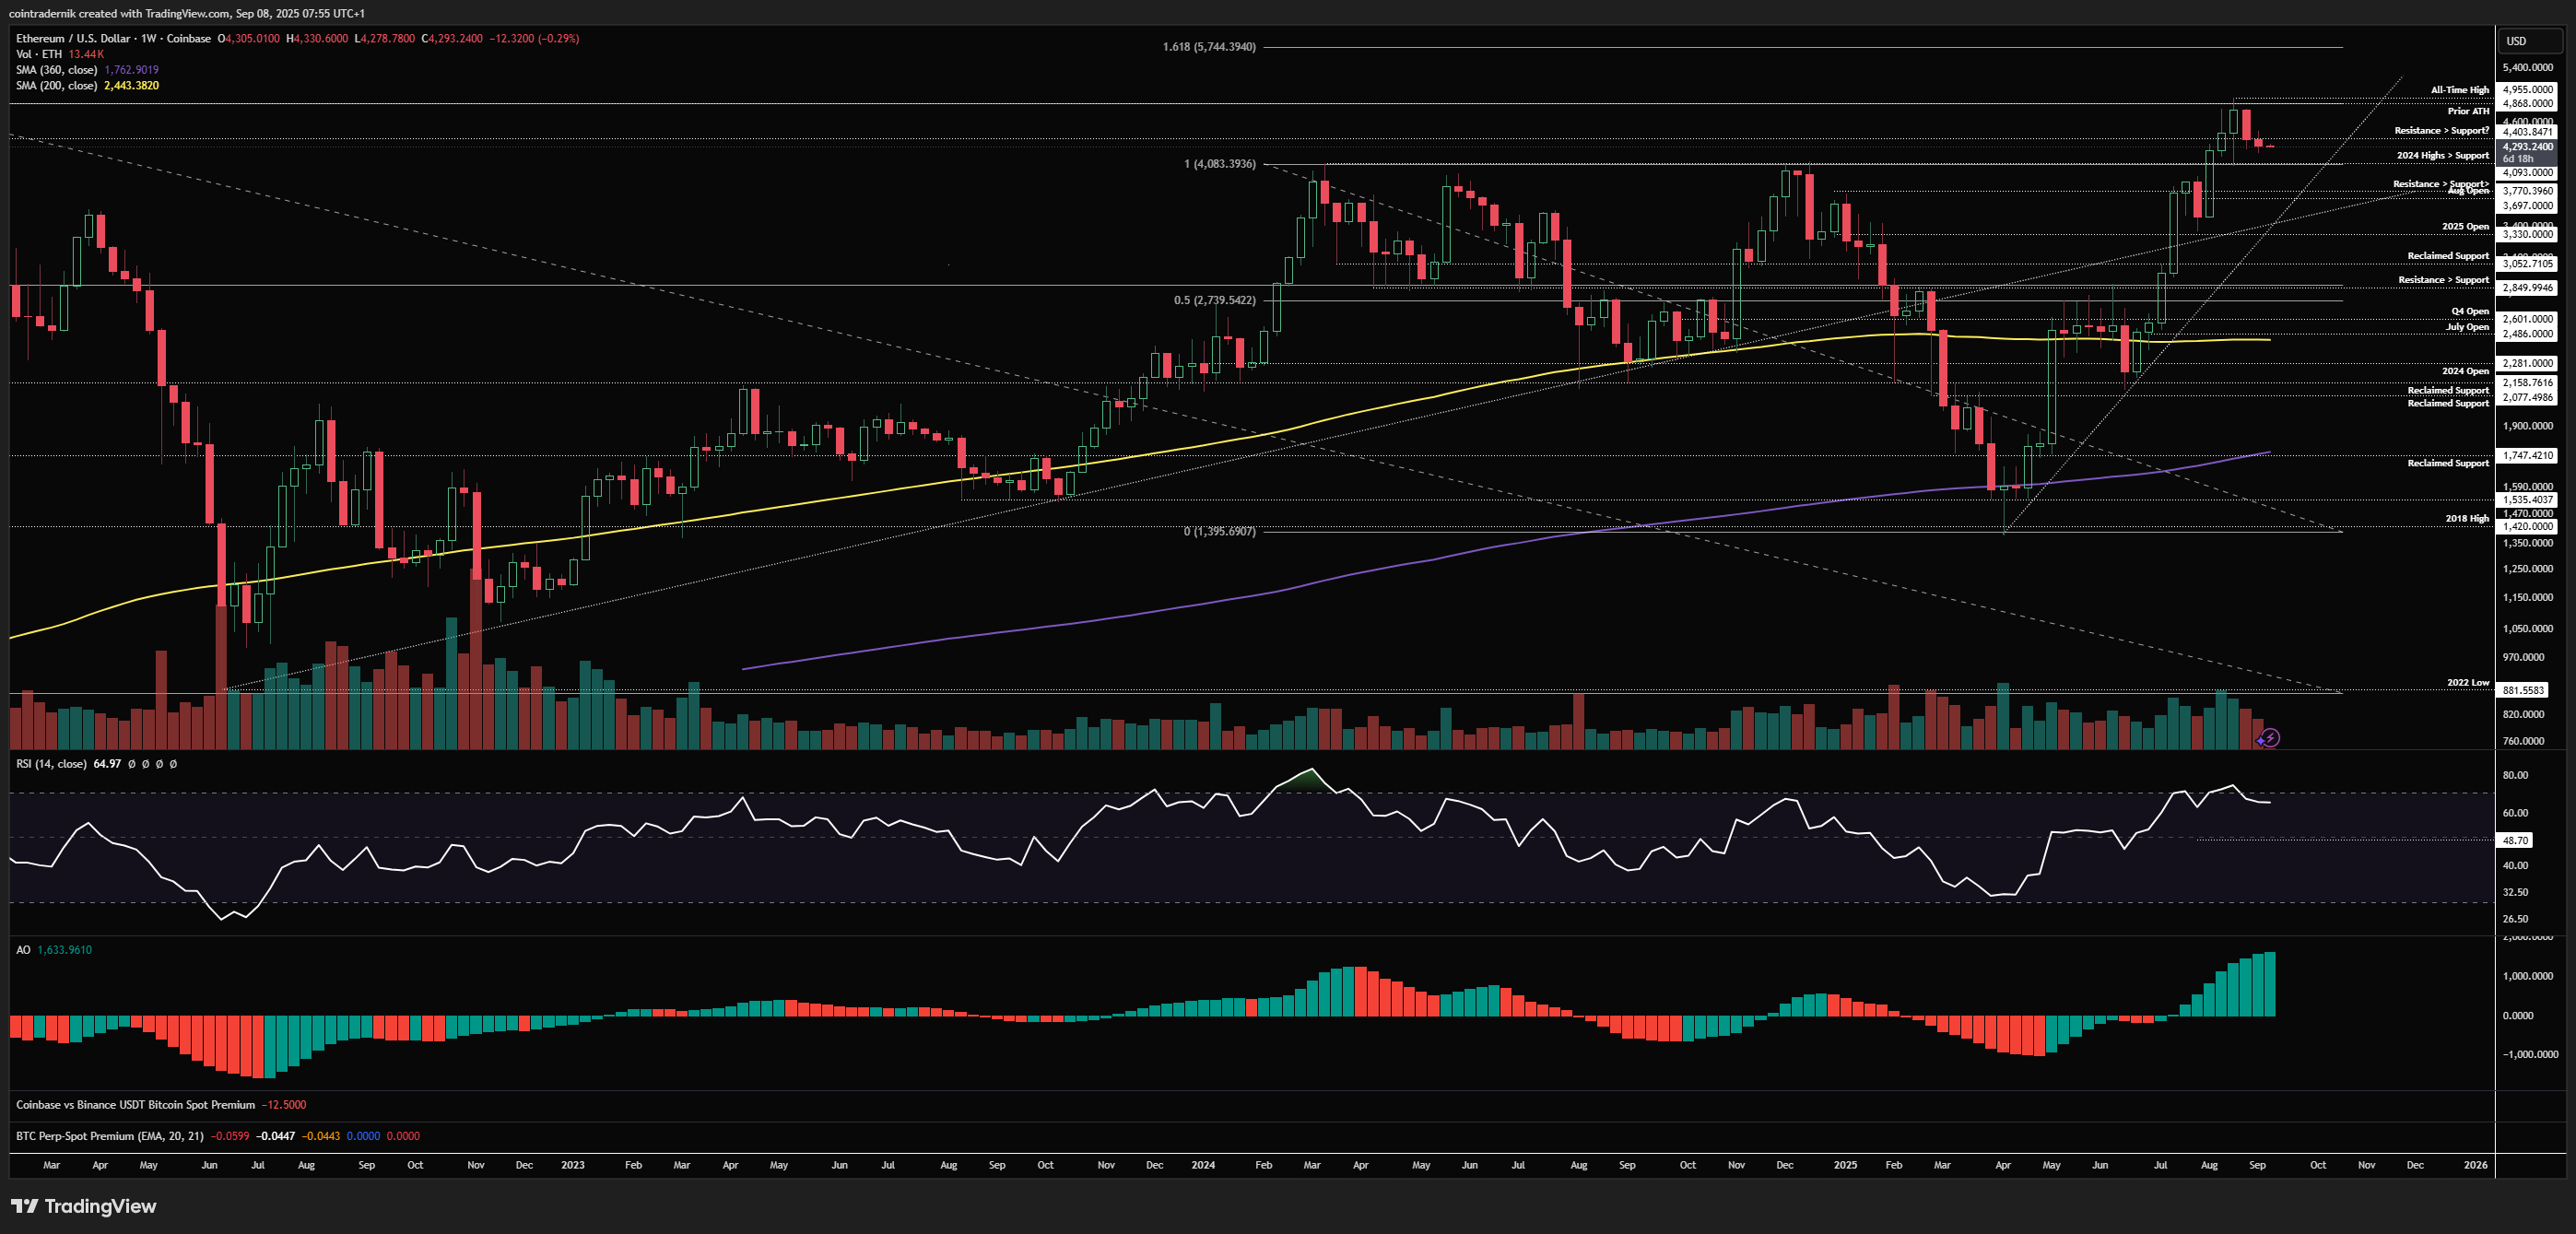
Beginning with the weekly timeframe for ETH/USD, we continue to consolidate below all-time highs but above multi-year resistance turned support at $4093. Weekly momentum still looks supportive of a breakout leg higher, with no exhaustion on this timeframe, and you would need to see $4090 flipped back into resistance to really get bearish here in my view, where we then have a chance at a much deeper correction. Whilst $4090 continues to hold as support, the base case is higher, where a weekly close through $4900 opens up $5750 as the 1.618 extension of the 2025 downtrend. Weekly structure remains bullish whilst we are above the 2025 open at $3330, which gives you some indication as to how much breathing room ETH has but also how brutal the pullback could be if we lose this major level.
Daily:
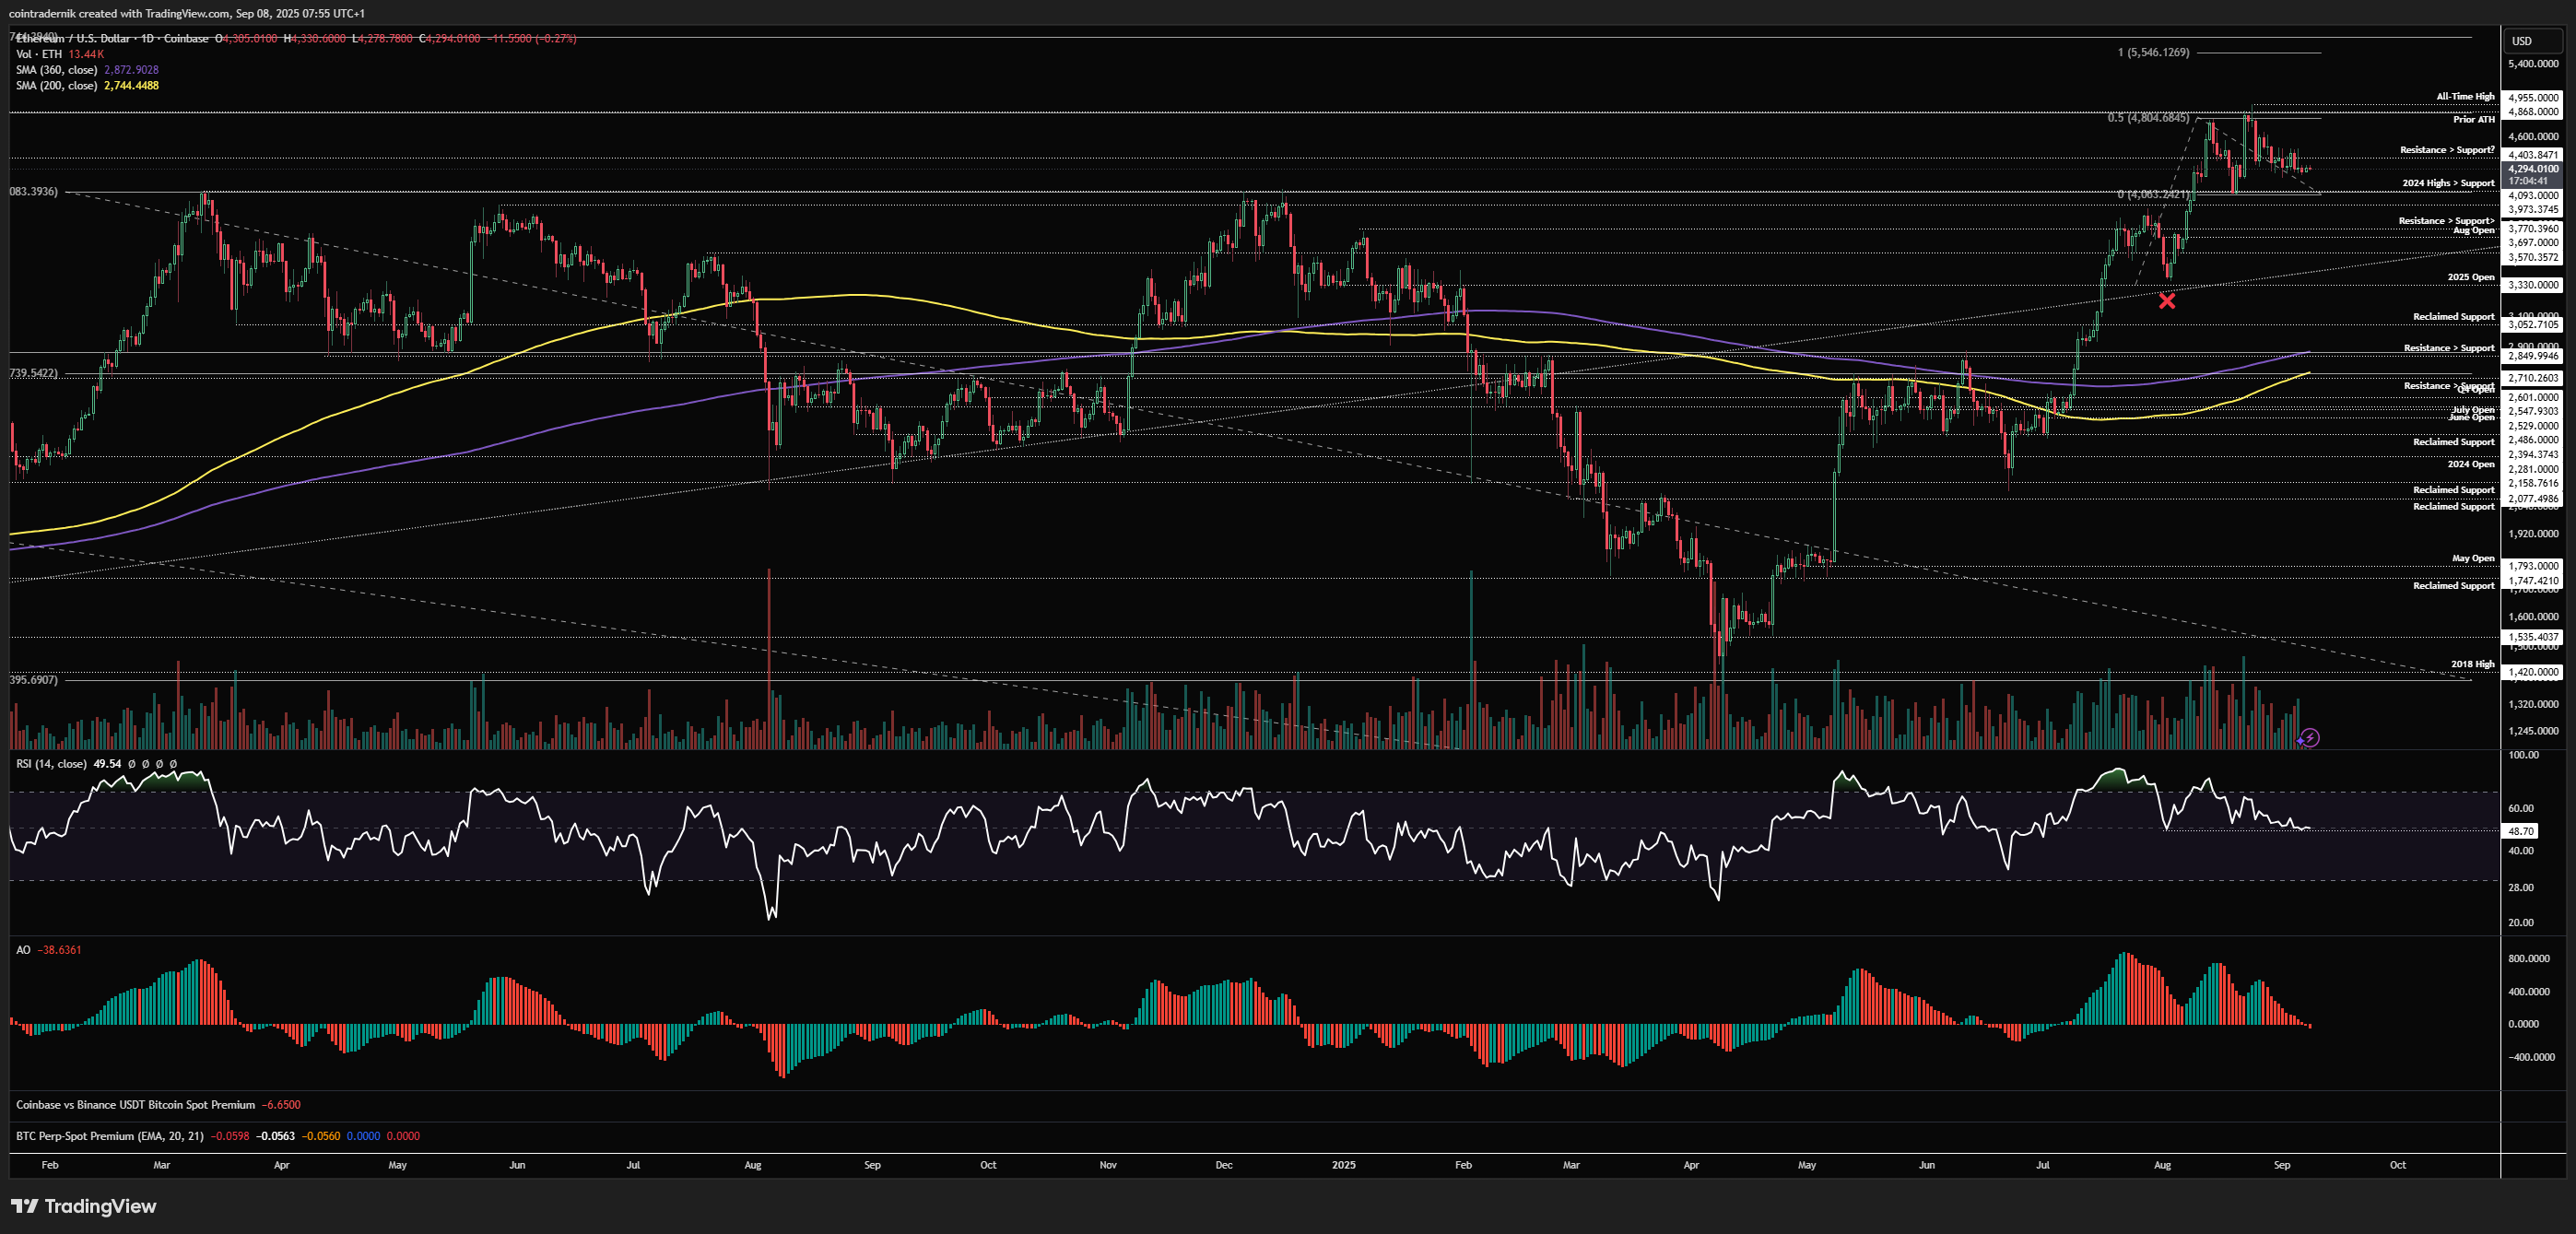
Dropping into the daily, we can see that there is momentum exhaustion on this timeframe but it has not been validated by price, which continues to hold a higher-low above $4090 whilst daily RSI is failing to break down. This presents a clear setup for downside should price break $4090 whilst daily RSI pushes lower, where you could look for shorts at least into the trendline but potentially as low as the 2025 open with a very tight invalidation. Until that occurs, however, you should be expecting the higher-low to hold here, particularly with how BTC itself is shaping up. If we can break convincingly back through $4400, having held this higher-low, I think that begins the breakout leg through $5000 into price discovery.
ETH/BTC
Weekly:
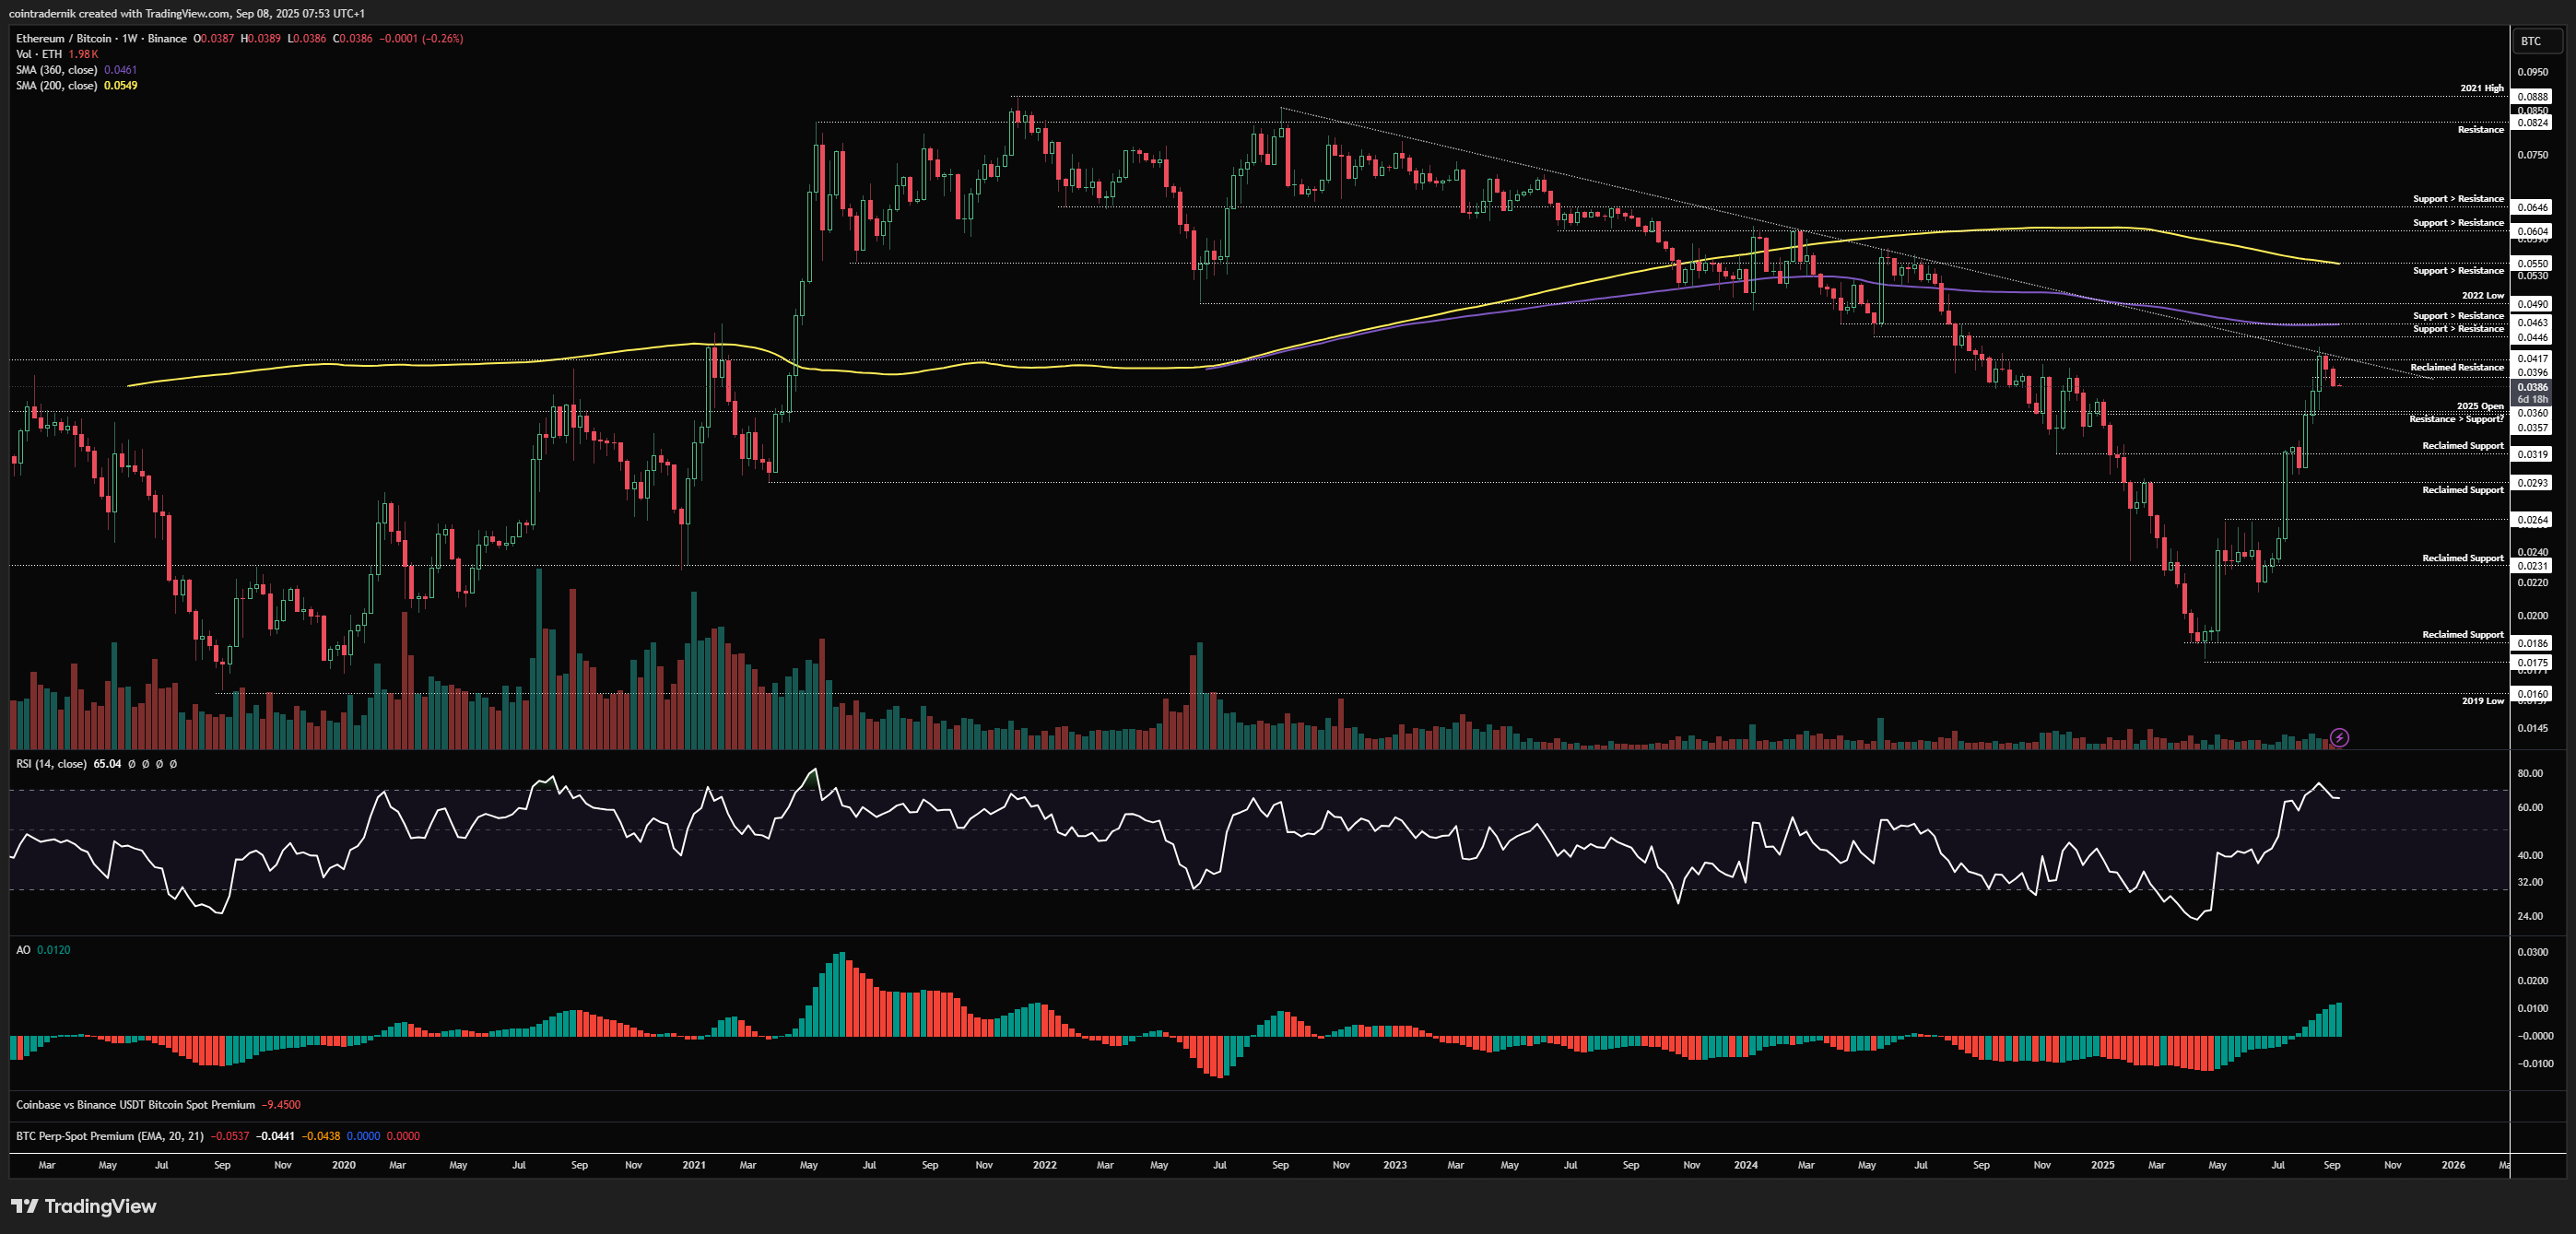
Looking now at ETH/BTC on the weekly, we can see we have put in a swing-high into that long-term trendline resistance and turned lower, but weekly momentum still looks strong and weekly structure is very much bullish. Nonetheless, this is exactly where you could expect a decent pullback in the pair, and if we cannot get back above 0.0396 this week I think we bleed lower towards the yearly open at 0.036 before marking out a low. Acceptance above 0.0417 is obviously where things can get silly, as we would have a trendline breakout with weekly momentum at multi-year highs, and we would be looking for as high as 0.055 from there.
Daily:
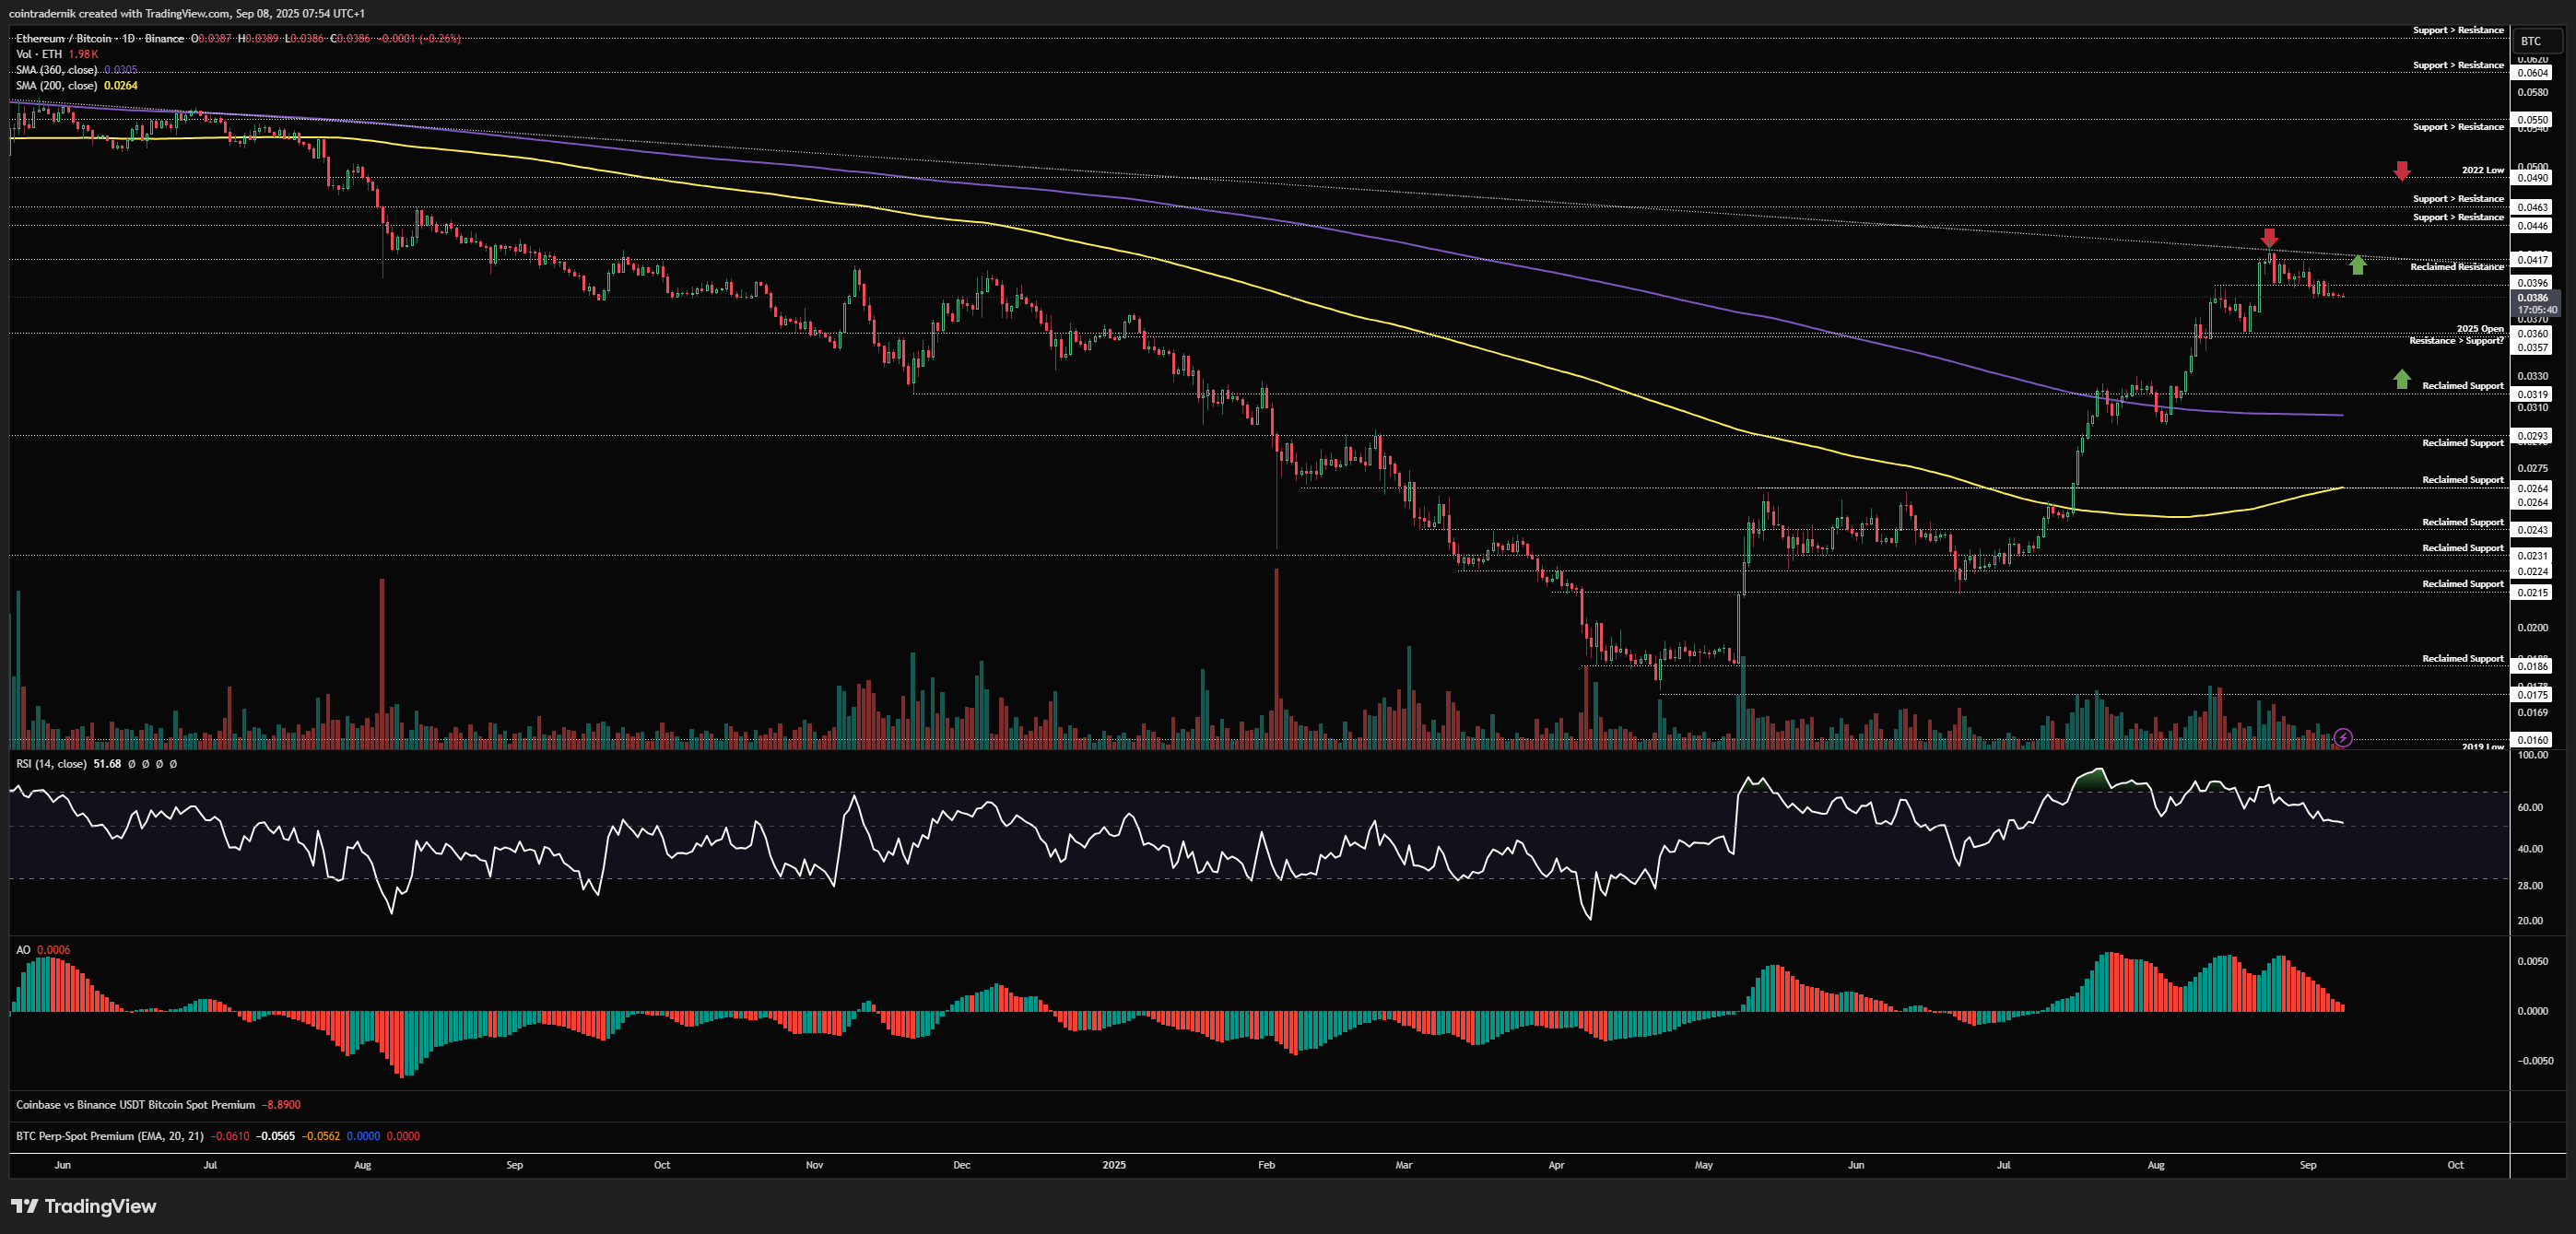
Looking at the daily, we can see that waning momentum into the trendline retest led to this push lower, but daily structure also remains bullish whilst that swing-low at 0.036 (the yearly open) is held above. If we reject below 0.0396 this week and push lower, I think we take out that 0.036 level and form a low between there and the 360dMA going into October; conversely, if we can hold above the yearly open this week and push back above 0.0396, we retest the trendline and likely break it this time, with 0.049 as the first target above that. Not much else to add here for now...
Receive the latest updates directly to your inbox

Price: $97.29
Weekly:
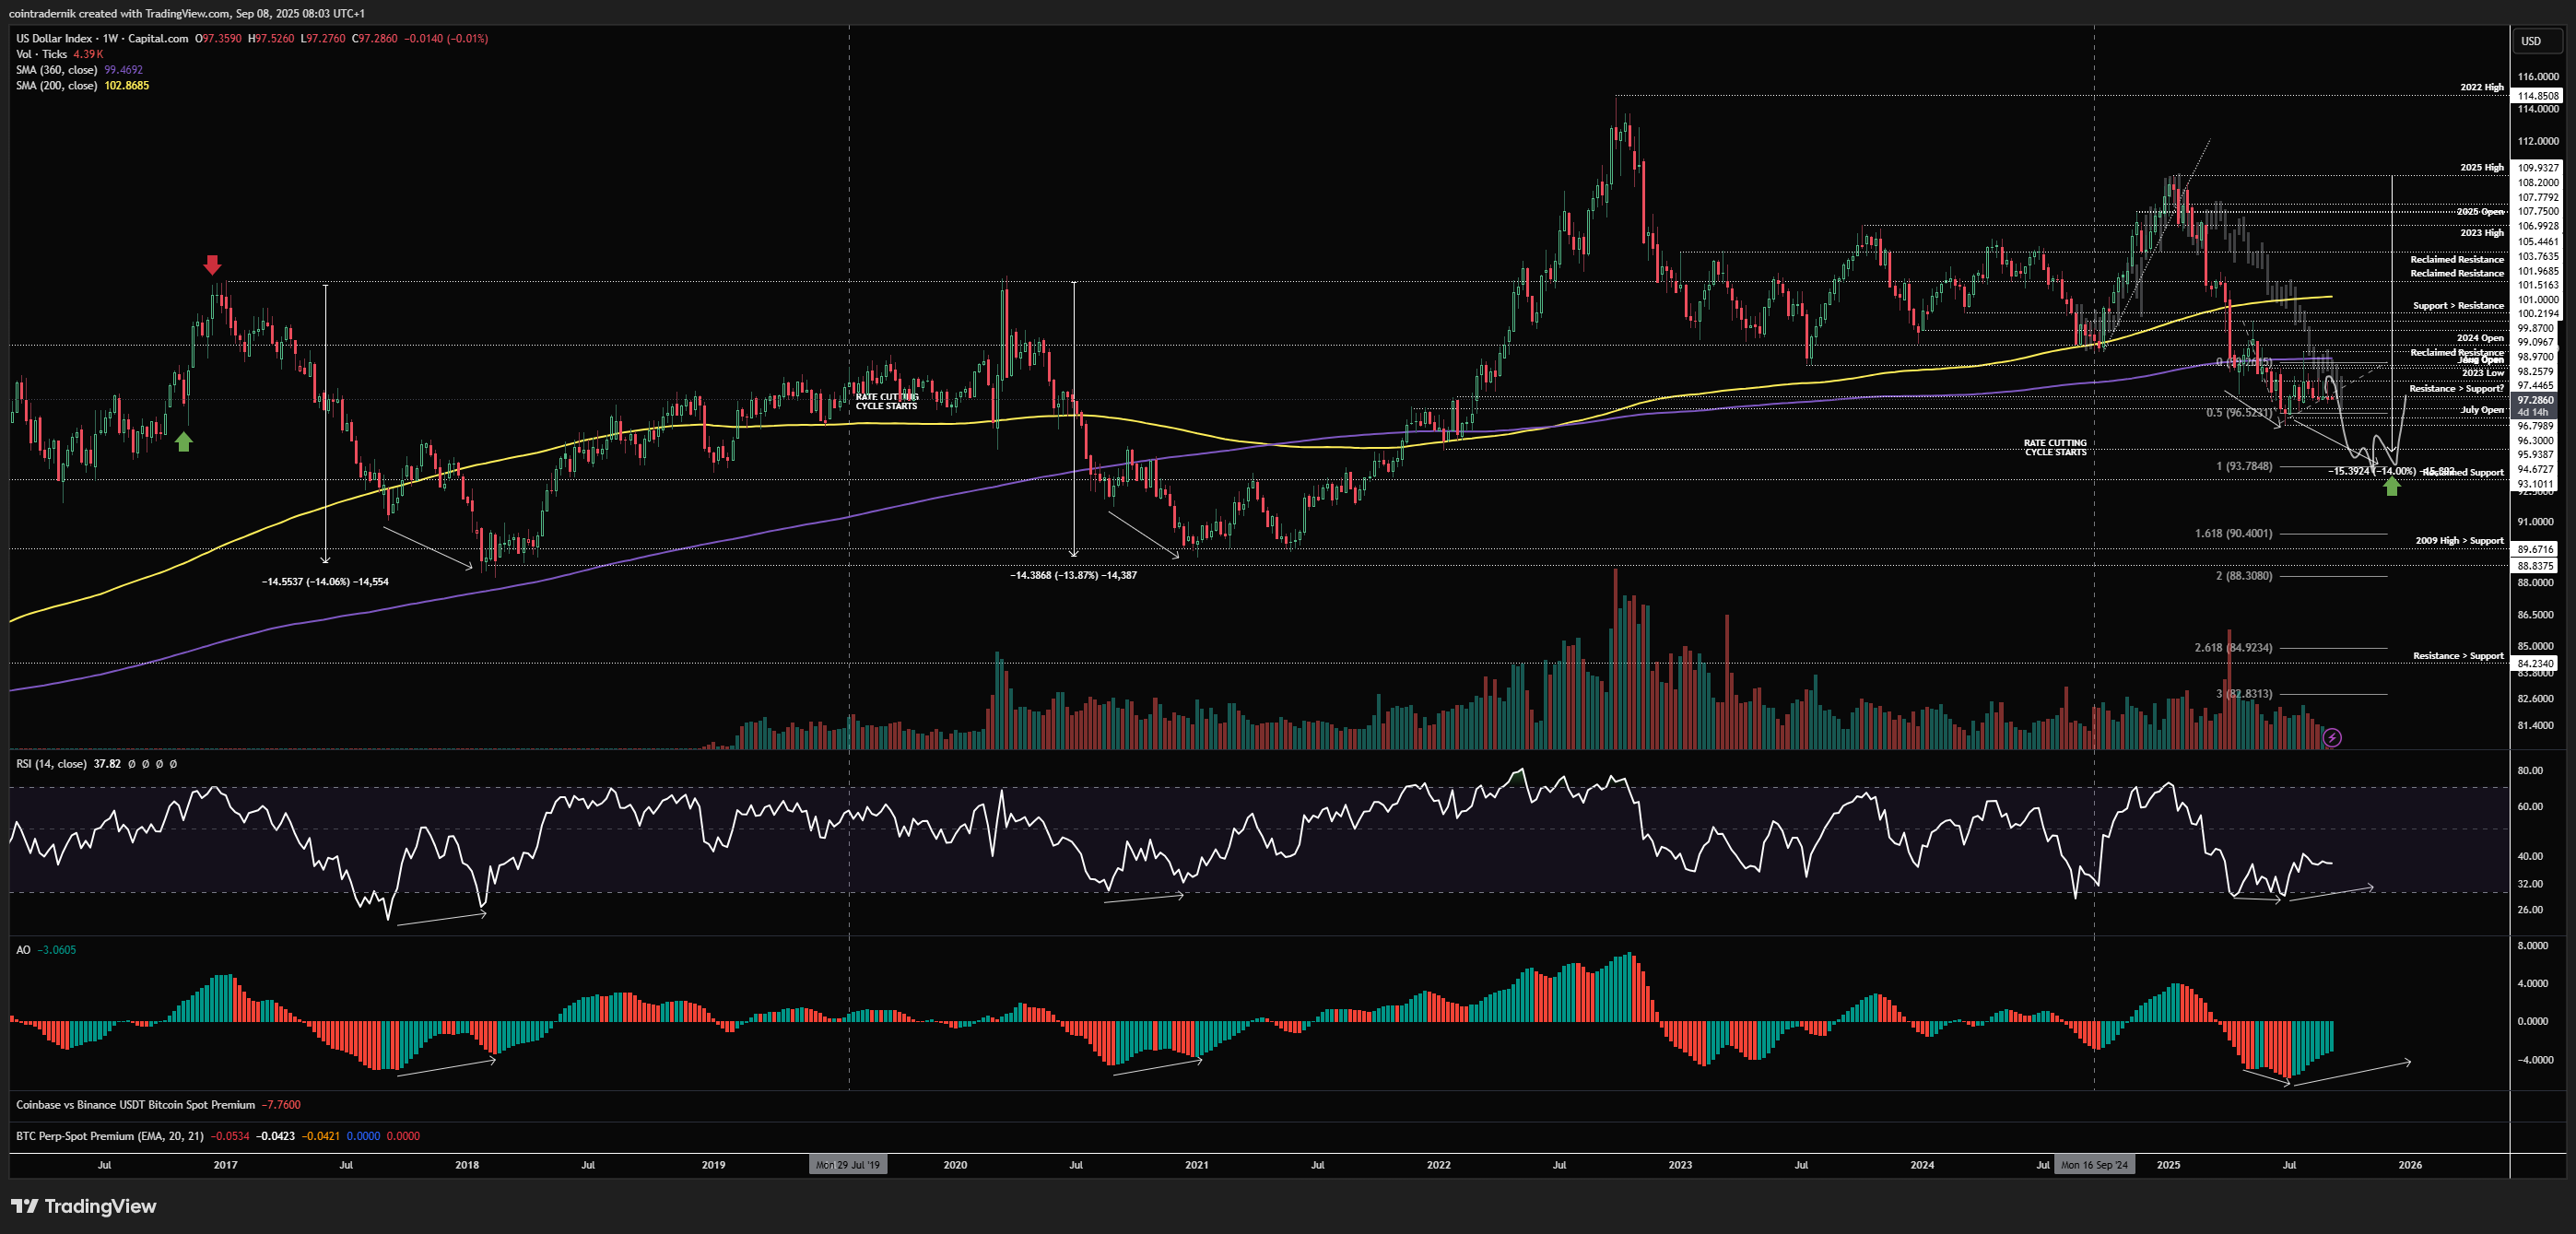
Beginning with the weekly view for the Dollar, nothing much has changed since the more recent updates where I expect the DXY short squeeze to have ended and then next leg lower to have begun, particularly in the fact of last week's jobs print and the continuing trend of real rates across the curve moving lower. We should now see the July open retested and any acceptance below that to lead to another leg lower towards 93 into Q4, where I will continue to watch for higher timeframe signs of exhaustion similar to prior DXY cycles. Invalidation of my broader views on the Dollar remains on acceptance back inside the multi-year range support at ~100. Below that, we are very much bearish and weekly structure remains so.
Daily:
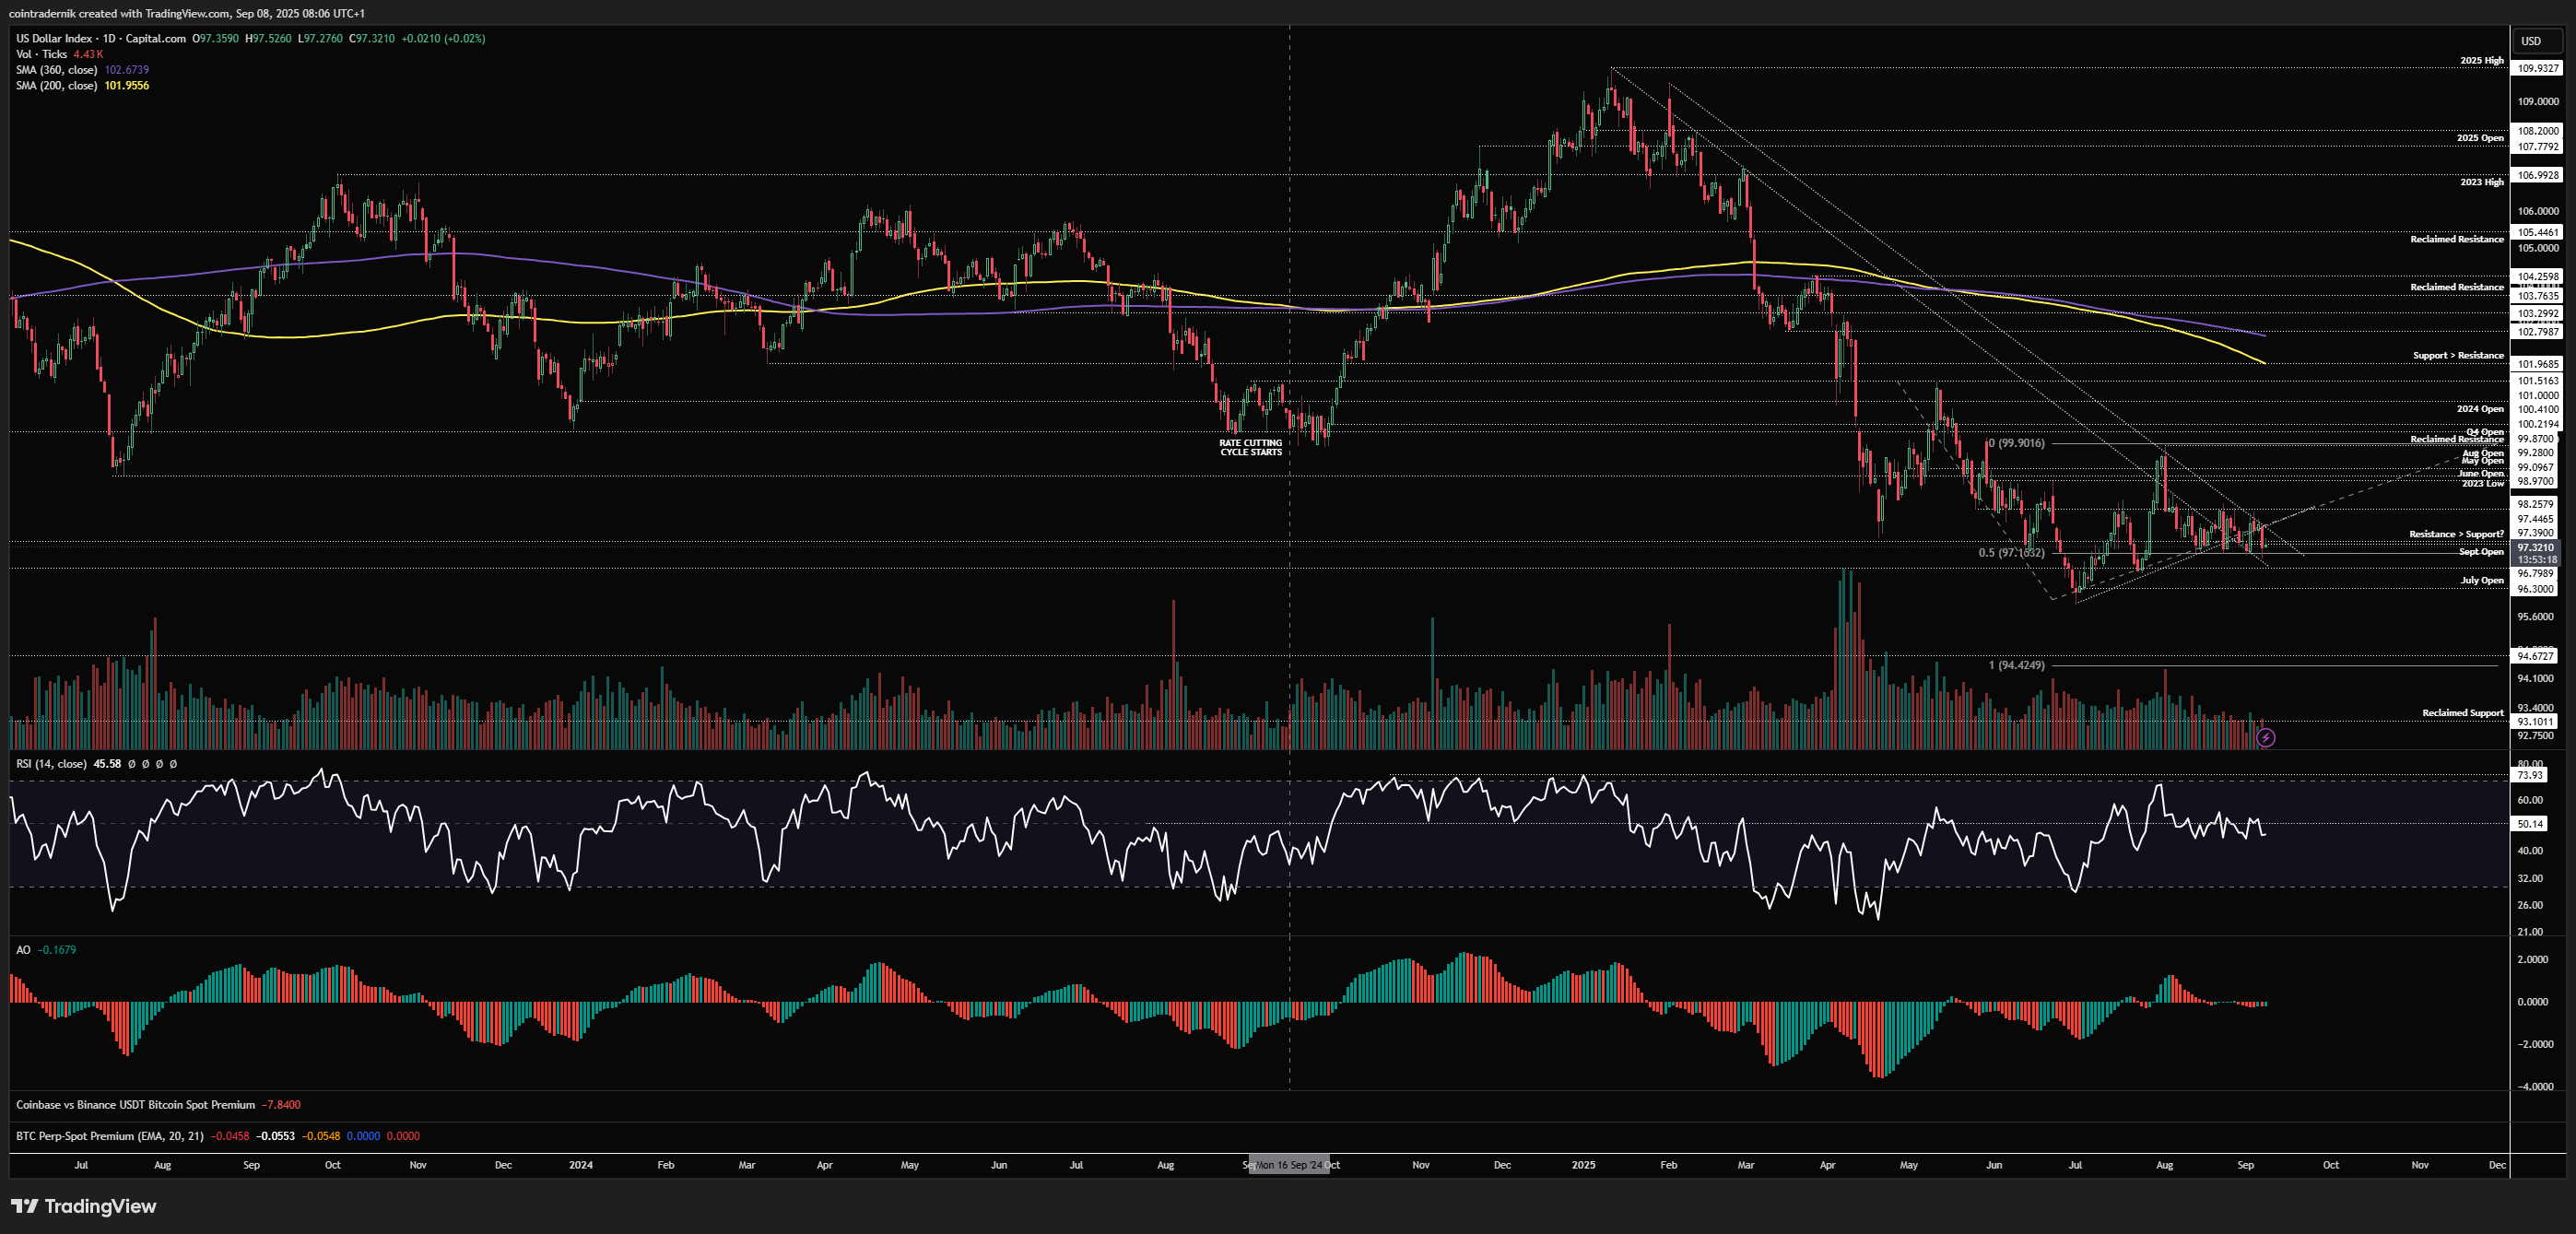
Turning to the daily, last week I mentioned that any push higher in DXY into that upper trendline around 98.25 was likely to be a fade, and that is precisely where price rejected and turned lower. Daily RSI is also choppy here much like price-action but failing to hold above the 50 level, which was similar to Feb 2025 and May 2025. In fact, I think the move off the July lows back into the bottom of the multi-year range is very much resemblant of the move above the top of the range in January, with the subsequent momentum breakdown leading to the trend lower. I think we are breaking lower here and I want to see daily RSI break this cluster of lows as price accepts below 96.8 to be more certain of the next leg lower beginning. Should we deviate below the level and then bounce higher with daily RSI breaking higher too, that would look like a bear trap and a potential extension of this squeeze at least back into 99, but given the forward outlook I find it difficult to be a mid-term dollar bull here. Again, I would drastically change my view if we accept back above the August high and range support at 100.
Price: $3601
Weekly:
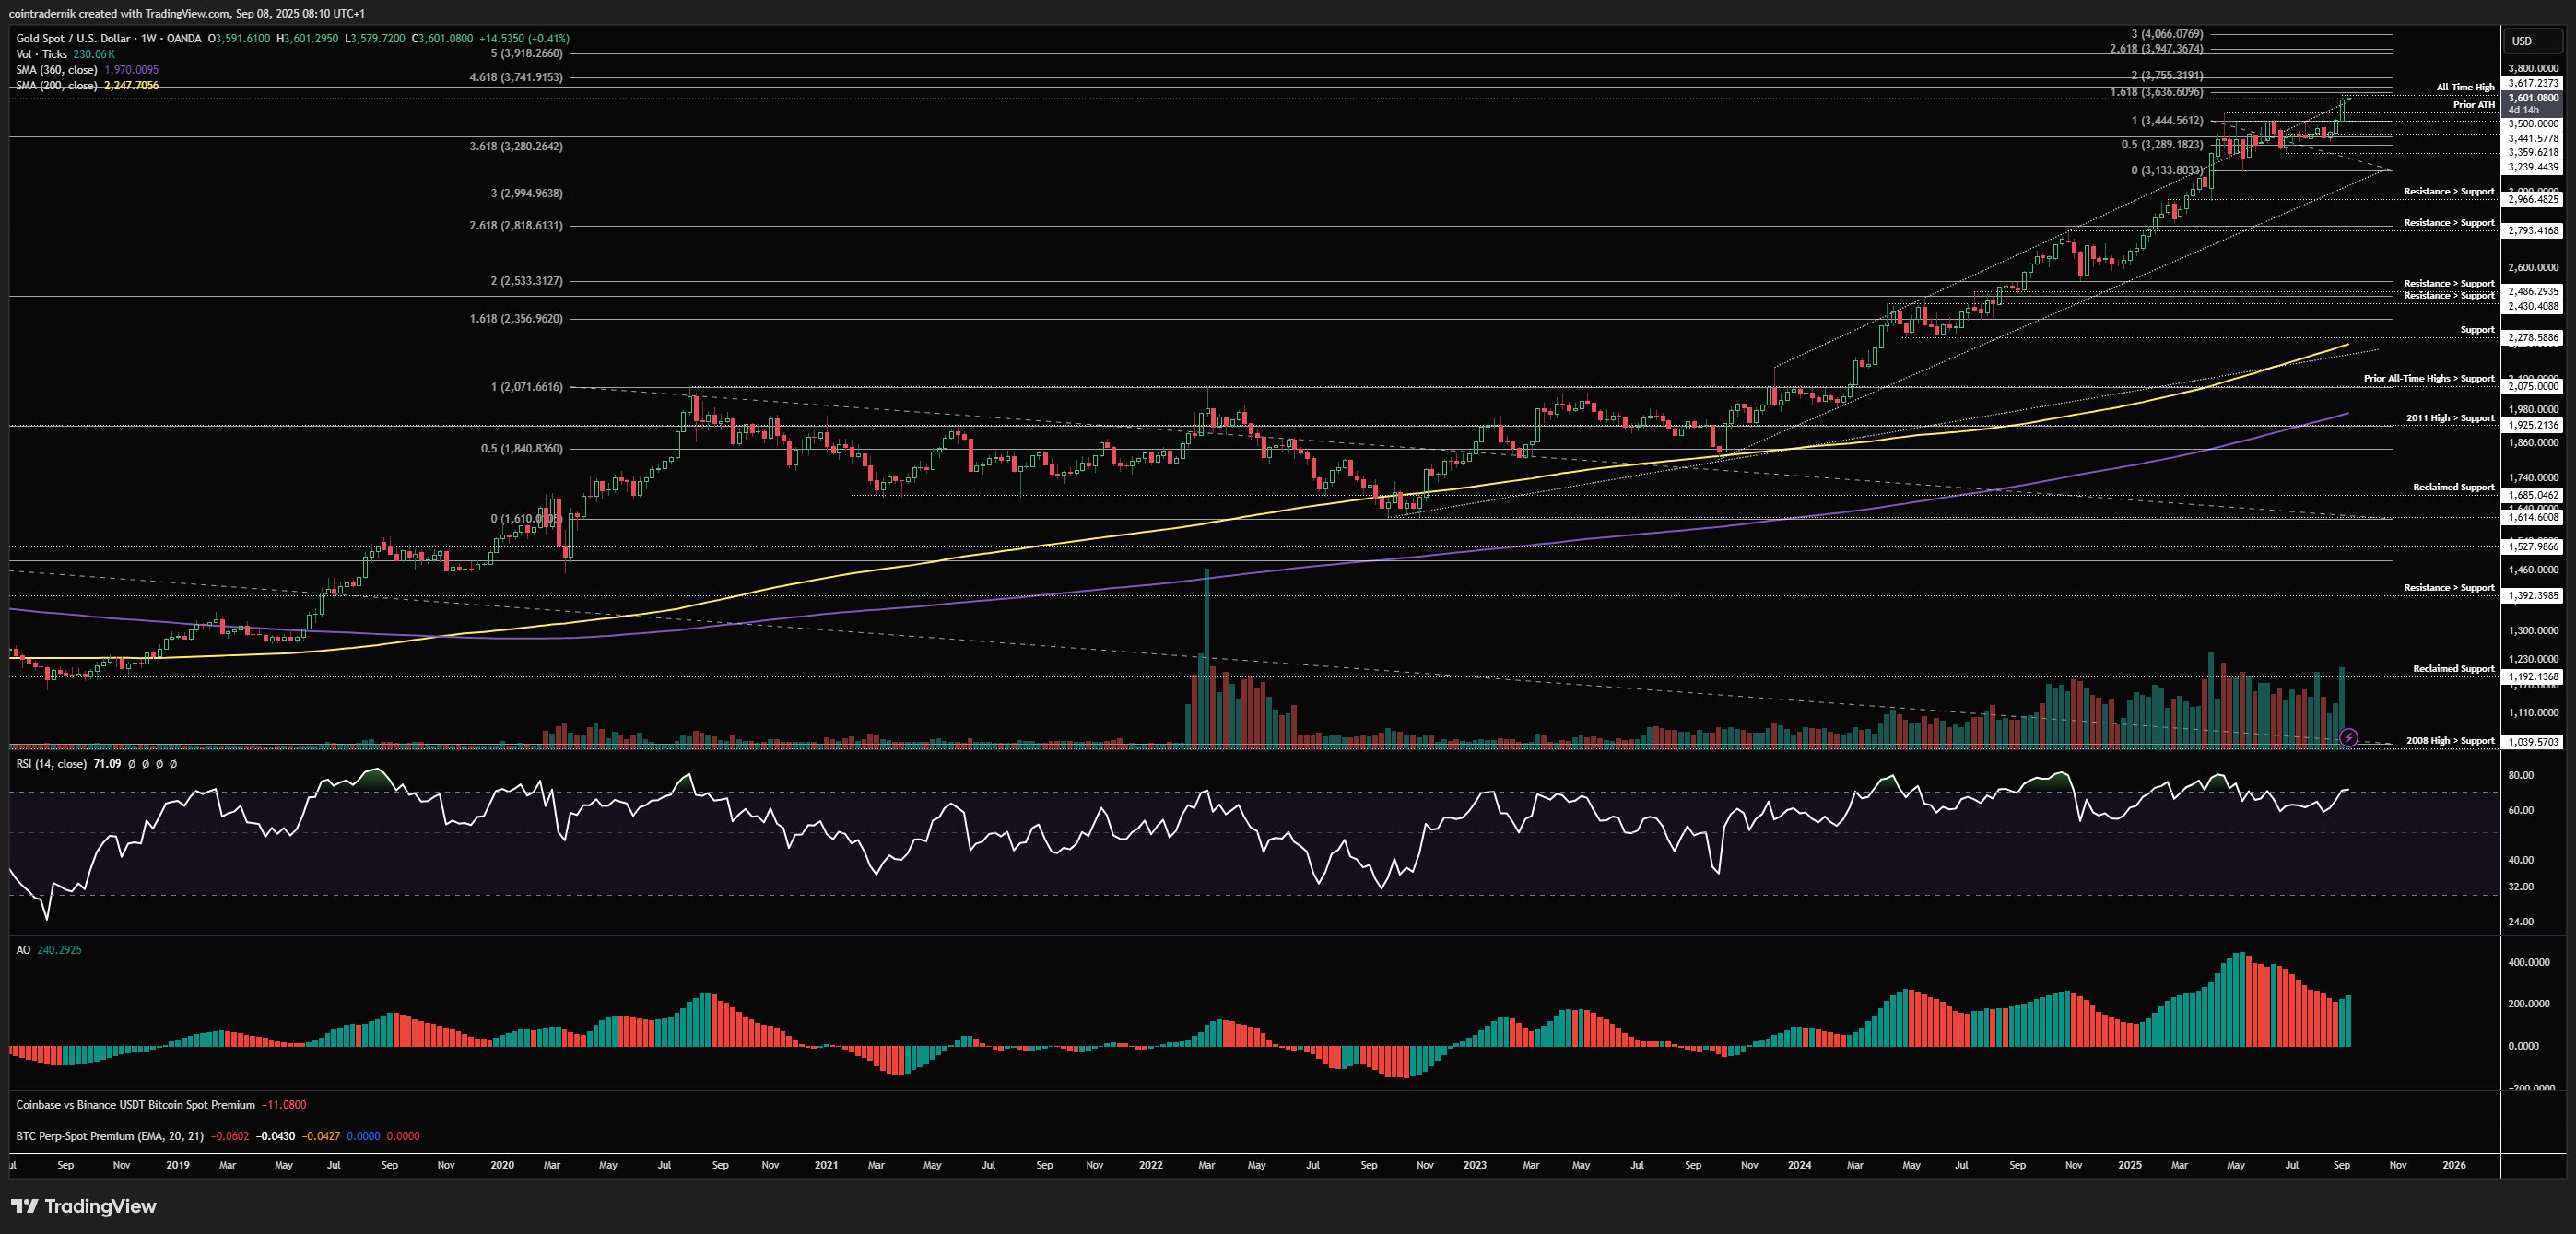
Beginning with the weekly timeframe for Gold, last week saw the major breakout we were anticipating after the move through $3440, with Gold making fresh all-time highs through $3500 into $3600, with early price-action this week continuing that rip higher. Weekly structure is bullish here and weekly momentum reset and has now turned higher, supporting the trend higher. Price is also breaking marginally above the channel resistance from late 2023, above which it also accelerated into the $3500 local top. We should see price extend from here at least into that confluence of fibs around $3750, in my opinion, where some resistance is likely to be found. Dips are for buying, particularly given confluence around our views on the Dollar here over the coming weeks.
Daily:
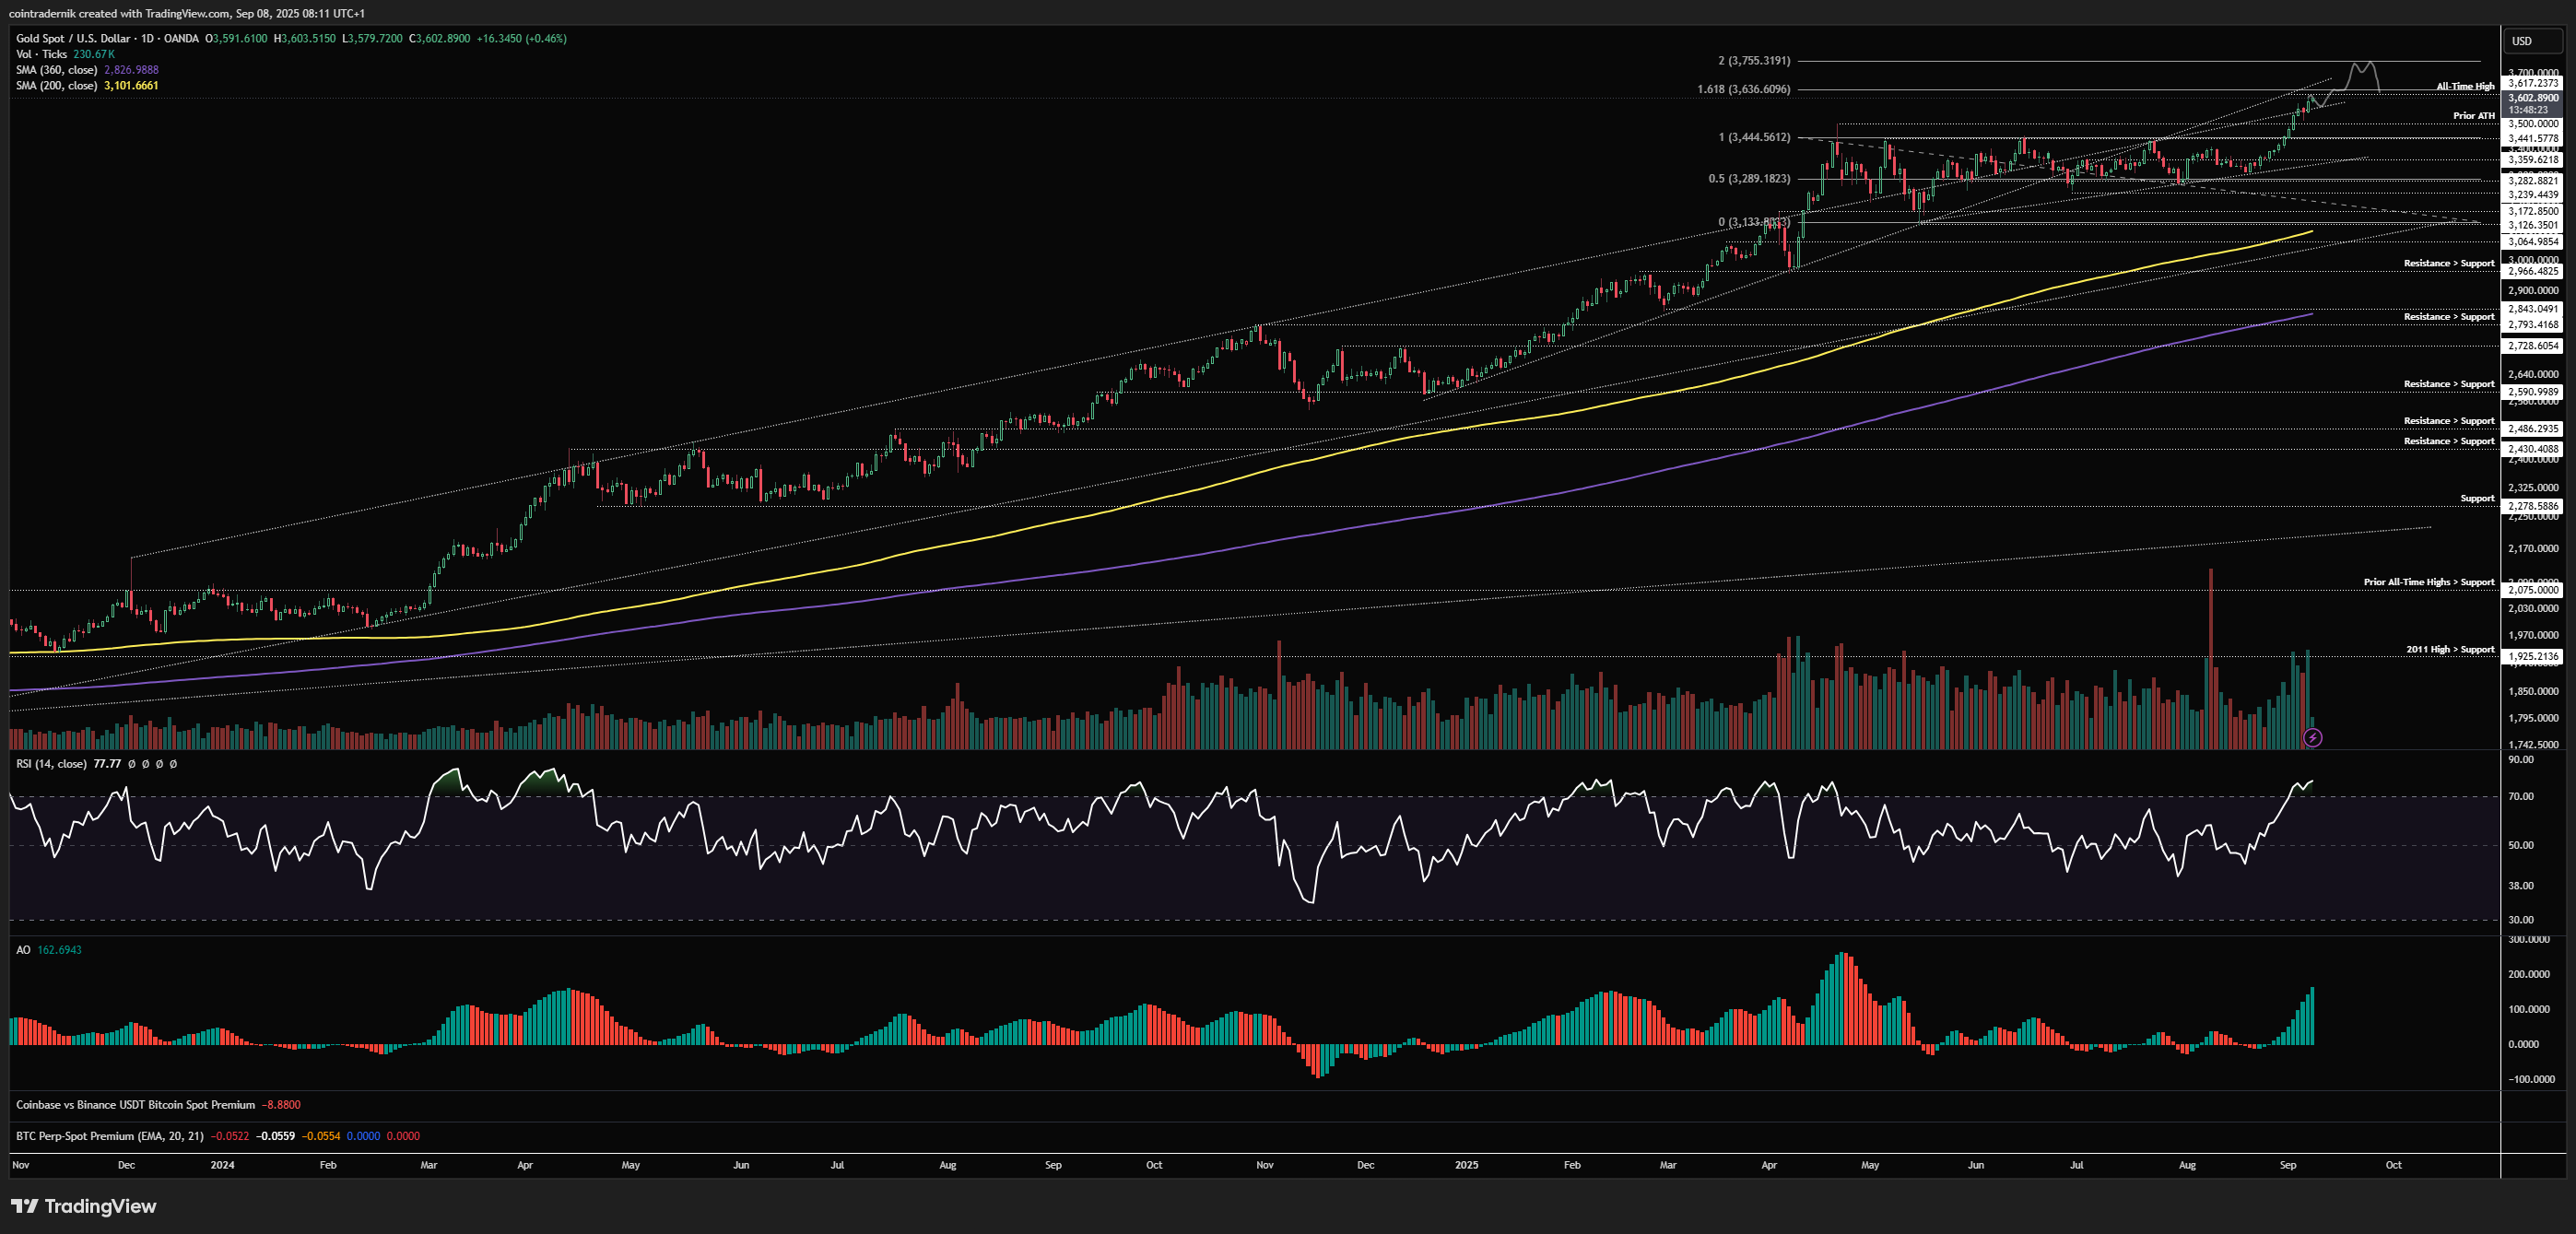
Dropping into the daily, we can see just how strong this move has been after breaking through $3440 range resistance, with momentum pushing hard and price briefly retesting the prior high before ripping higher. We are just below the 1.618 extension of the prior range at $3636, so we could see some minor resistance here and another test of support, but I expect the formation of a higher low above $3500 to lead to extension into $3750 going into October, where we could then look for signs of momentum exhaustion for a local top formation. Also worth keeping an eye on search trends as they helped us with picking out the top back in April/May. Onwards and upwards for now...
Price: $62.95
Weekly:
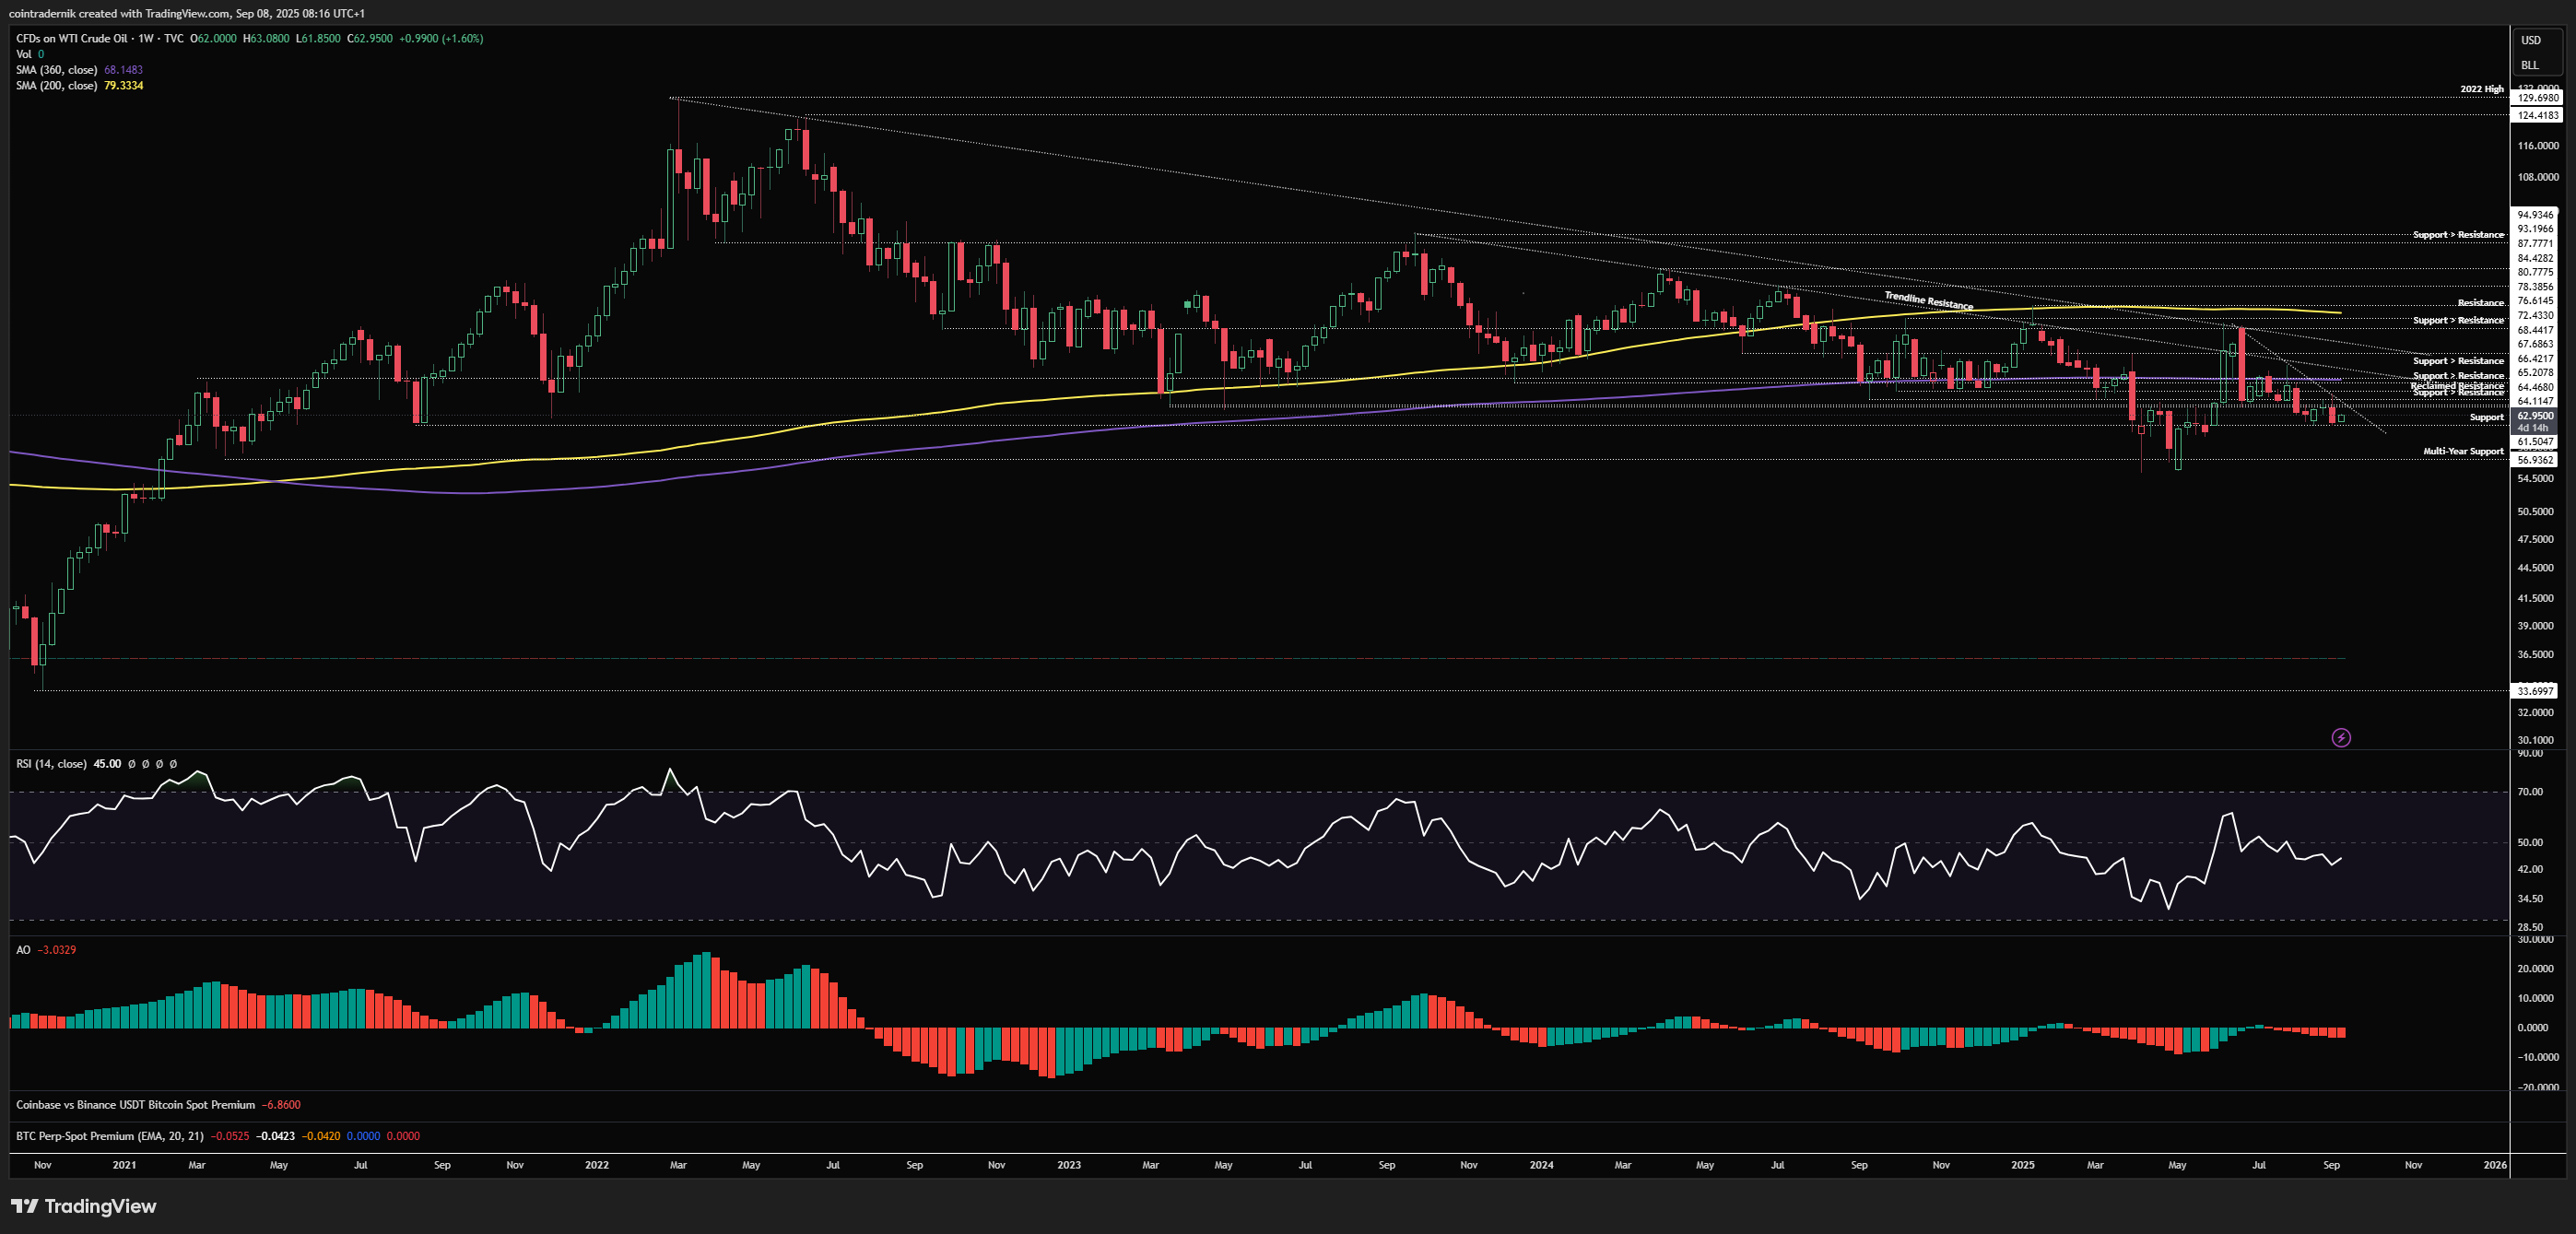
Looking firstly at the weekly for Oil, we have move lower as expect right into that major support at $61.50, with price now compressing below trendline resistance from the summer highs. It is likely we get a breakout here this week or next, where I am looking for a failed breakout in either direction as a potential trade setup. If break and close below $61.50 and then subsequently break out beyond the trendline after a support reclaim, we could look for longs back towards the lower trendline; conversely, a breakout above the trendline here to bait longs and then a move below $61.50 opens up another leg lower into $57, which has held since 2021.
Daily:
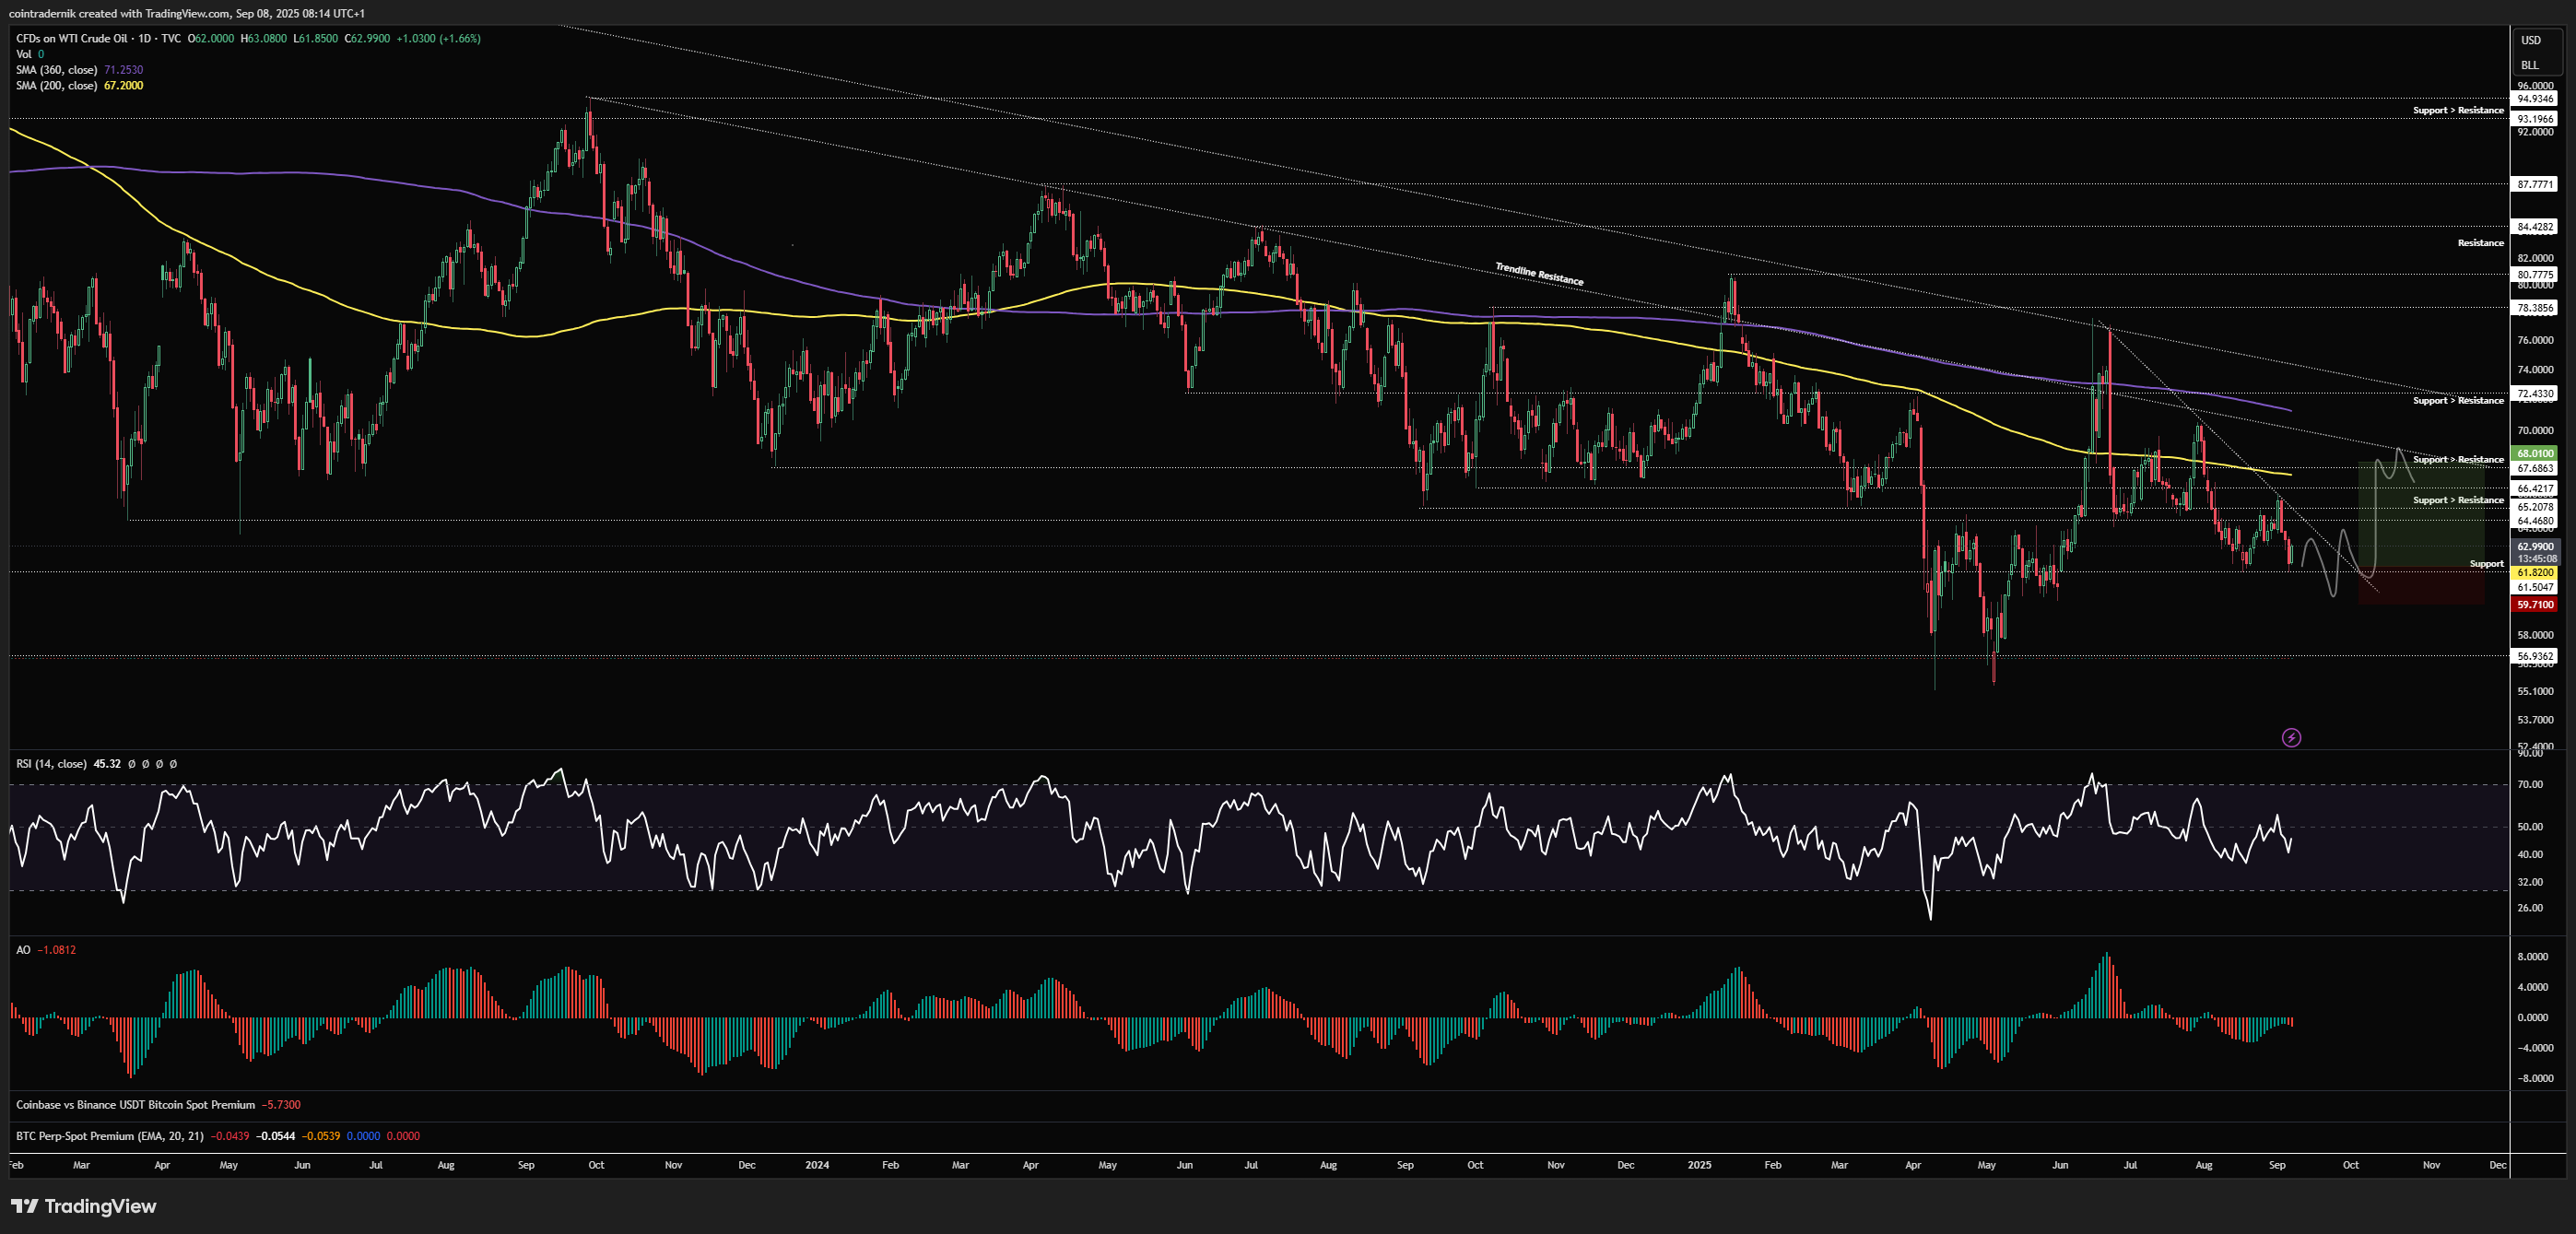
I have marked out the long idea on the daily timeframe here, where we would want to see shorts baited on a break below support and then trapped on a push higher, looking to bid any dip after that trendline breakout for a move back towards $68. Nothing else to add here on Oil but I thought given the price-action and structure here it could make for a nice multi-week trade in either direction if we get the bait-and-switch we're looking for from longs or shorts...
I hope you've found some value in the read this week!
And if you've not already signed up for Ostium, please do so and test out some of the recent updates, including:
Sign up here (you don't have to use my ref link, of course): https://ostium.app/trade?from=CL&to=USD&ref=CTNIK

.avif)