

Market Outlook #47
August 18, 2025
-
12
min read


This blog references an opinion and is for entertainment and informational purposes only. It is not intended to be investment advice. Seek a duly licensed professional for investment advice.
In this 47th Market Outlook here at Ostium Research, we'll be taking a look at the week ahead in markets, focusing specifically on price-action, positioning and event risk for Bitcoin, Ethereum, SPX, Copper and Crude Oil.
Firstly, let's take a look at the moderately busy calendar for the week ahead:
TUESDAY: FED BOWMAN SPEECH
WEDNESDAY: PBOC INTEREST RATE DECISION: (CONSENSUS 3% VS PREVIOUS 3%)
WEDNESDAY: RBNZ INTEREST RATE DECISION: (CONSENSUS 3% VS PREVIOUS 3.25%)
WEDNESDAY: FOMC MINUTES
WEDNESDAY: FED WALLER SPEECH
THURSDAY: US INITIAL JOBLESS CLAIMS: (CONSENSUS 227K VS PREVIOUS 224K)
THURSDAY: US S&P GLOBAL MANUFACTURING PMI (AUG): (CONSENSUS N/A VS PREVIOUS 49.8)
THURSDAY: US S&P GLOBAL SERVICES PMI (AUG): (CONSENSUS N/A VS PREVIOUS 55.7)
FRIDAY: FED CHAIR POWELL SPEECH
SATURDAY: JACKSON HOLE SYMPOSIUM
Now, let's dig into asset-specific price-action for the week ahead, looking firstly at Bitcoin:
Price: $115,443
Weekly:
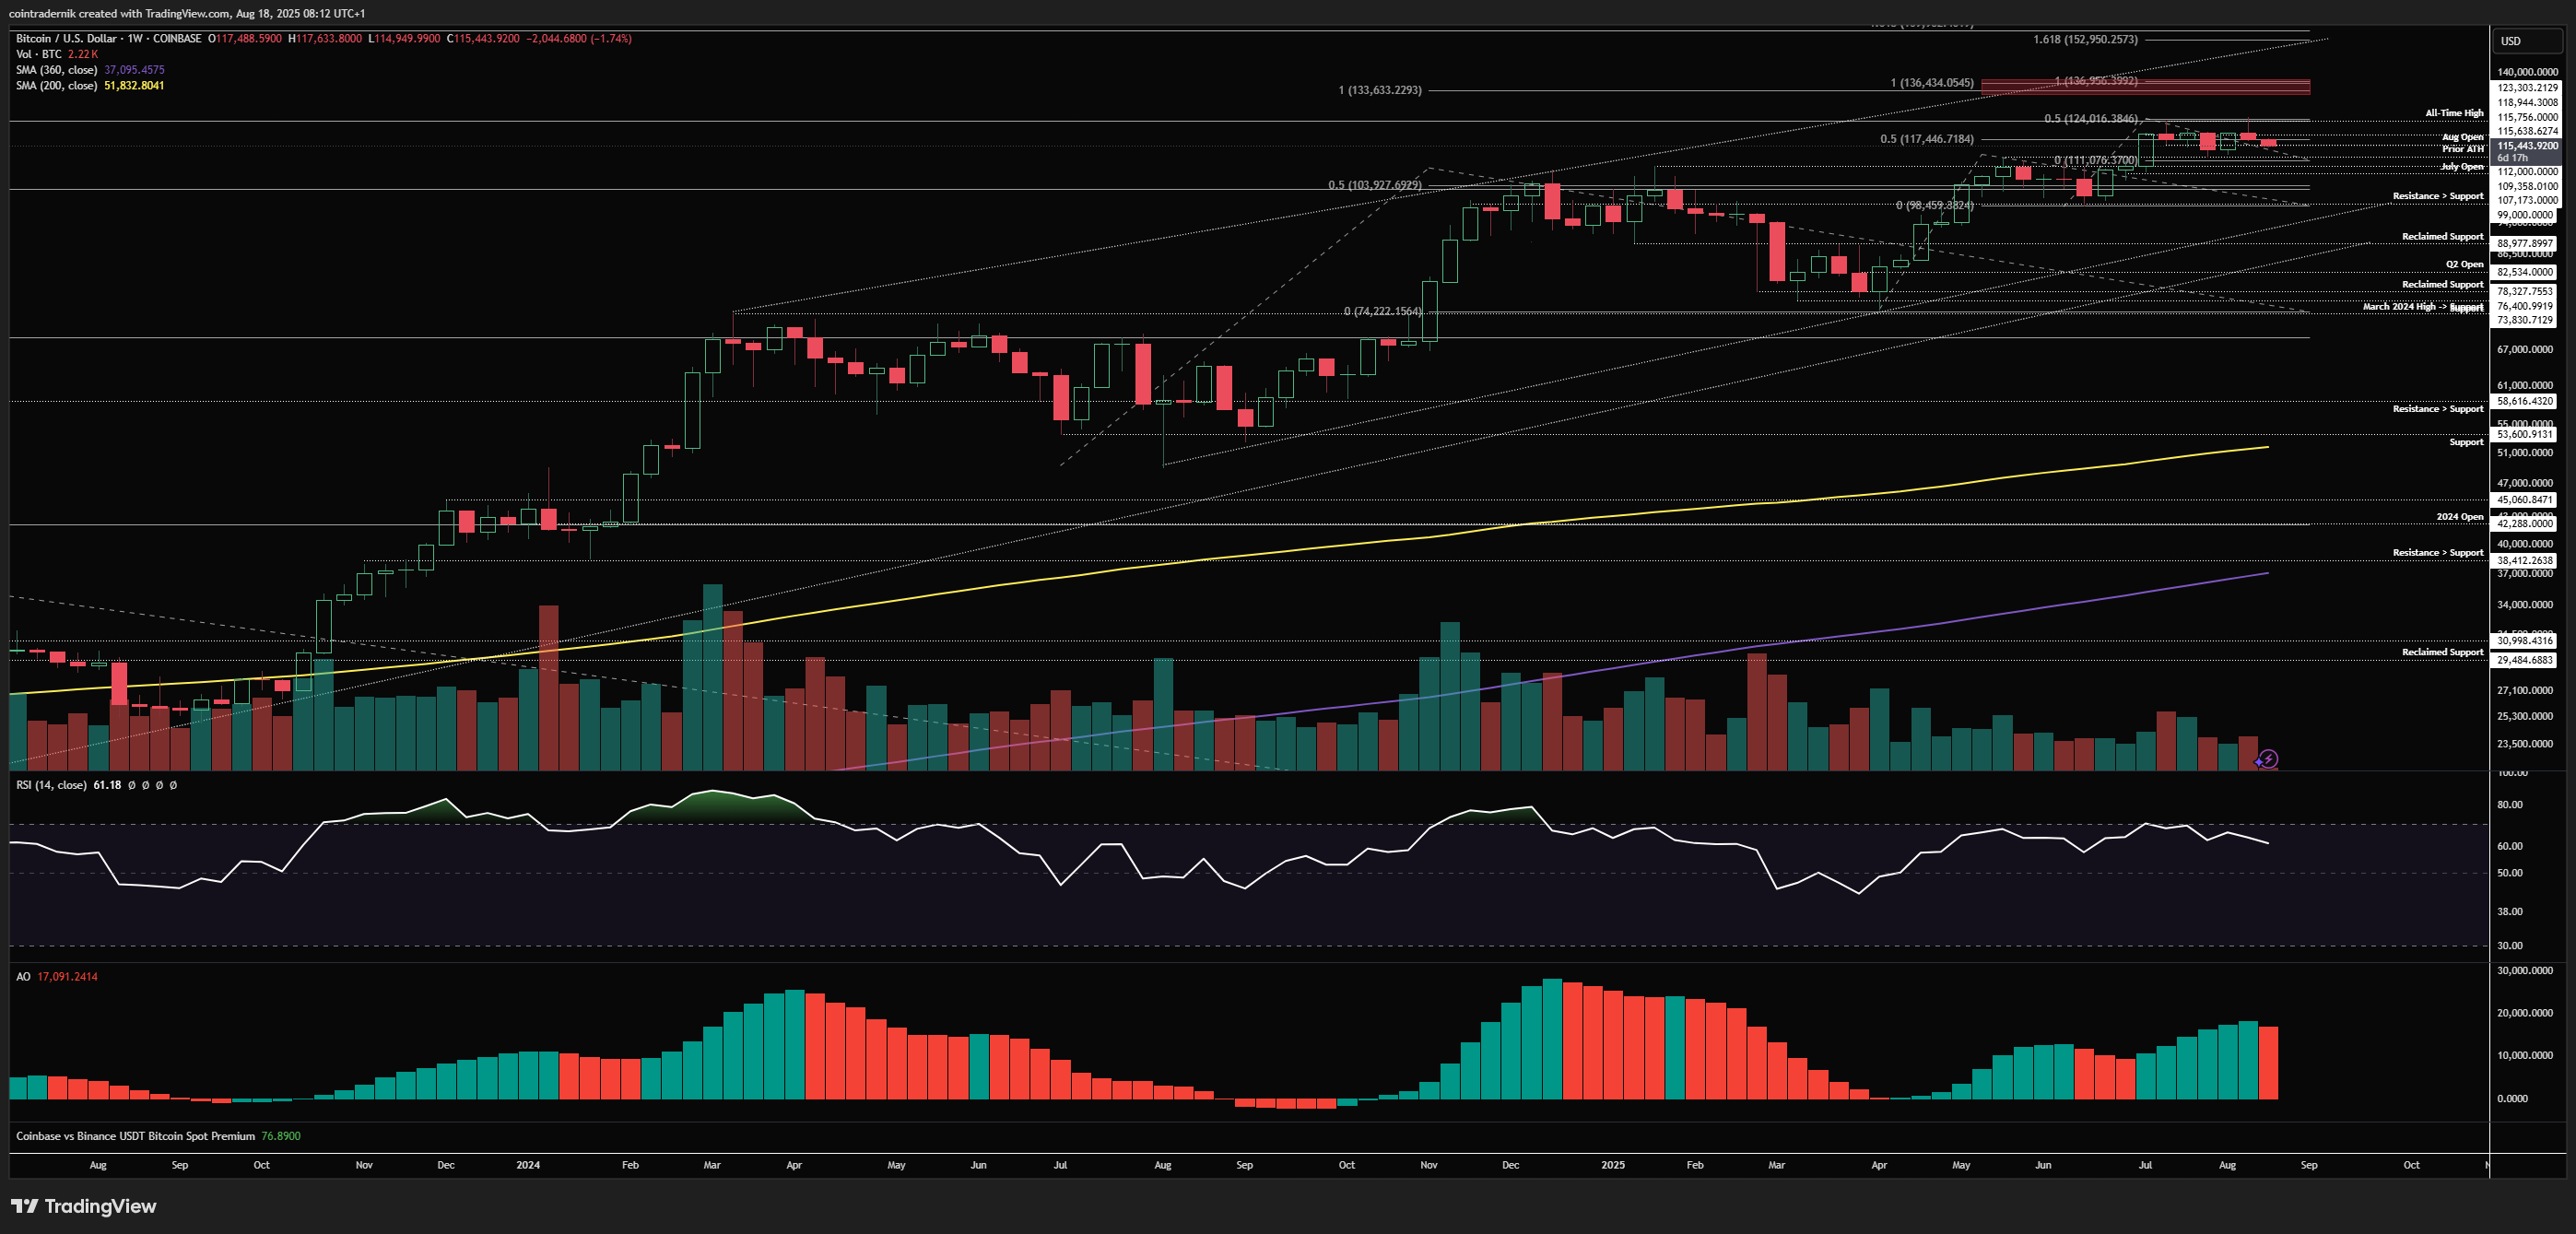
Beginning with the weekly for BTC, we can see that last week saw price wick above all-time highs at $123.3k into $124.5k before rejecting and closing back below multi-week resistance at $119k. Price ultimately closed at $117.5k, confirming an SFP of this breakout range and inside week failure after the previous weekly range. Given this, the more probable outcome this week (particularly given Jackson Hole at the end of the week) is to take out the bottom of the prior weekly range at $112.6k before looking to form a bottom. This does not have to occur, of course, but usually these inside week failure formations do play out and both sides of the inside week are taken out before the next trend begins. What bulls do not want to see here is a weekly close below $112k, back inside that prior all-time high and below the more recent low. This would open up more downside into the July open at $107.4k, though I would expect that area to find significant demand if retested. I still do not see anything here resembling a cycle top, but certainly the weakness into the close last week has made it less probable we see short-term upside through the highs. What we need to see to reassert bullishness short-term is a weekly close above $119k, confirming a breakout above the level that has capped the weekly closes for a couple of months and likely trapping late shorts. This would fuel further upside through $124k into the August close.
Daily:
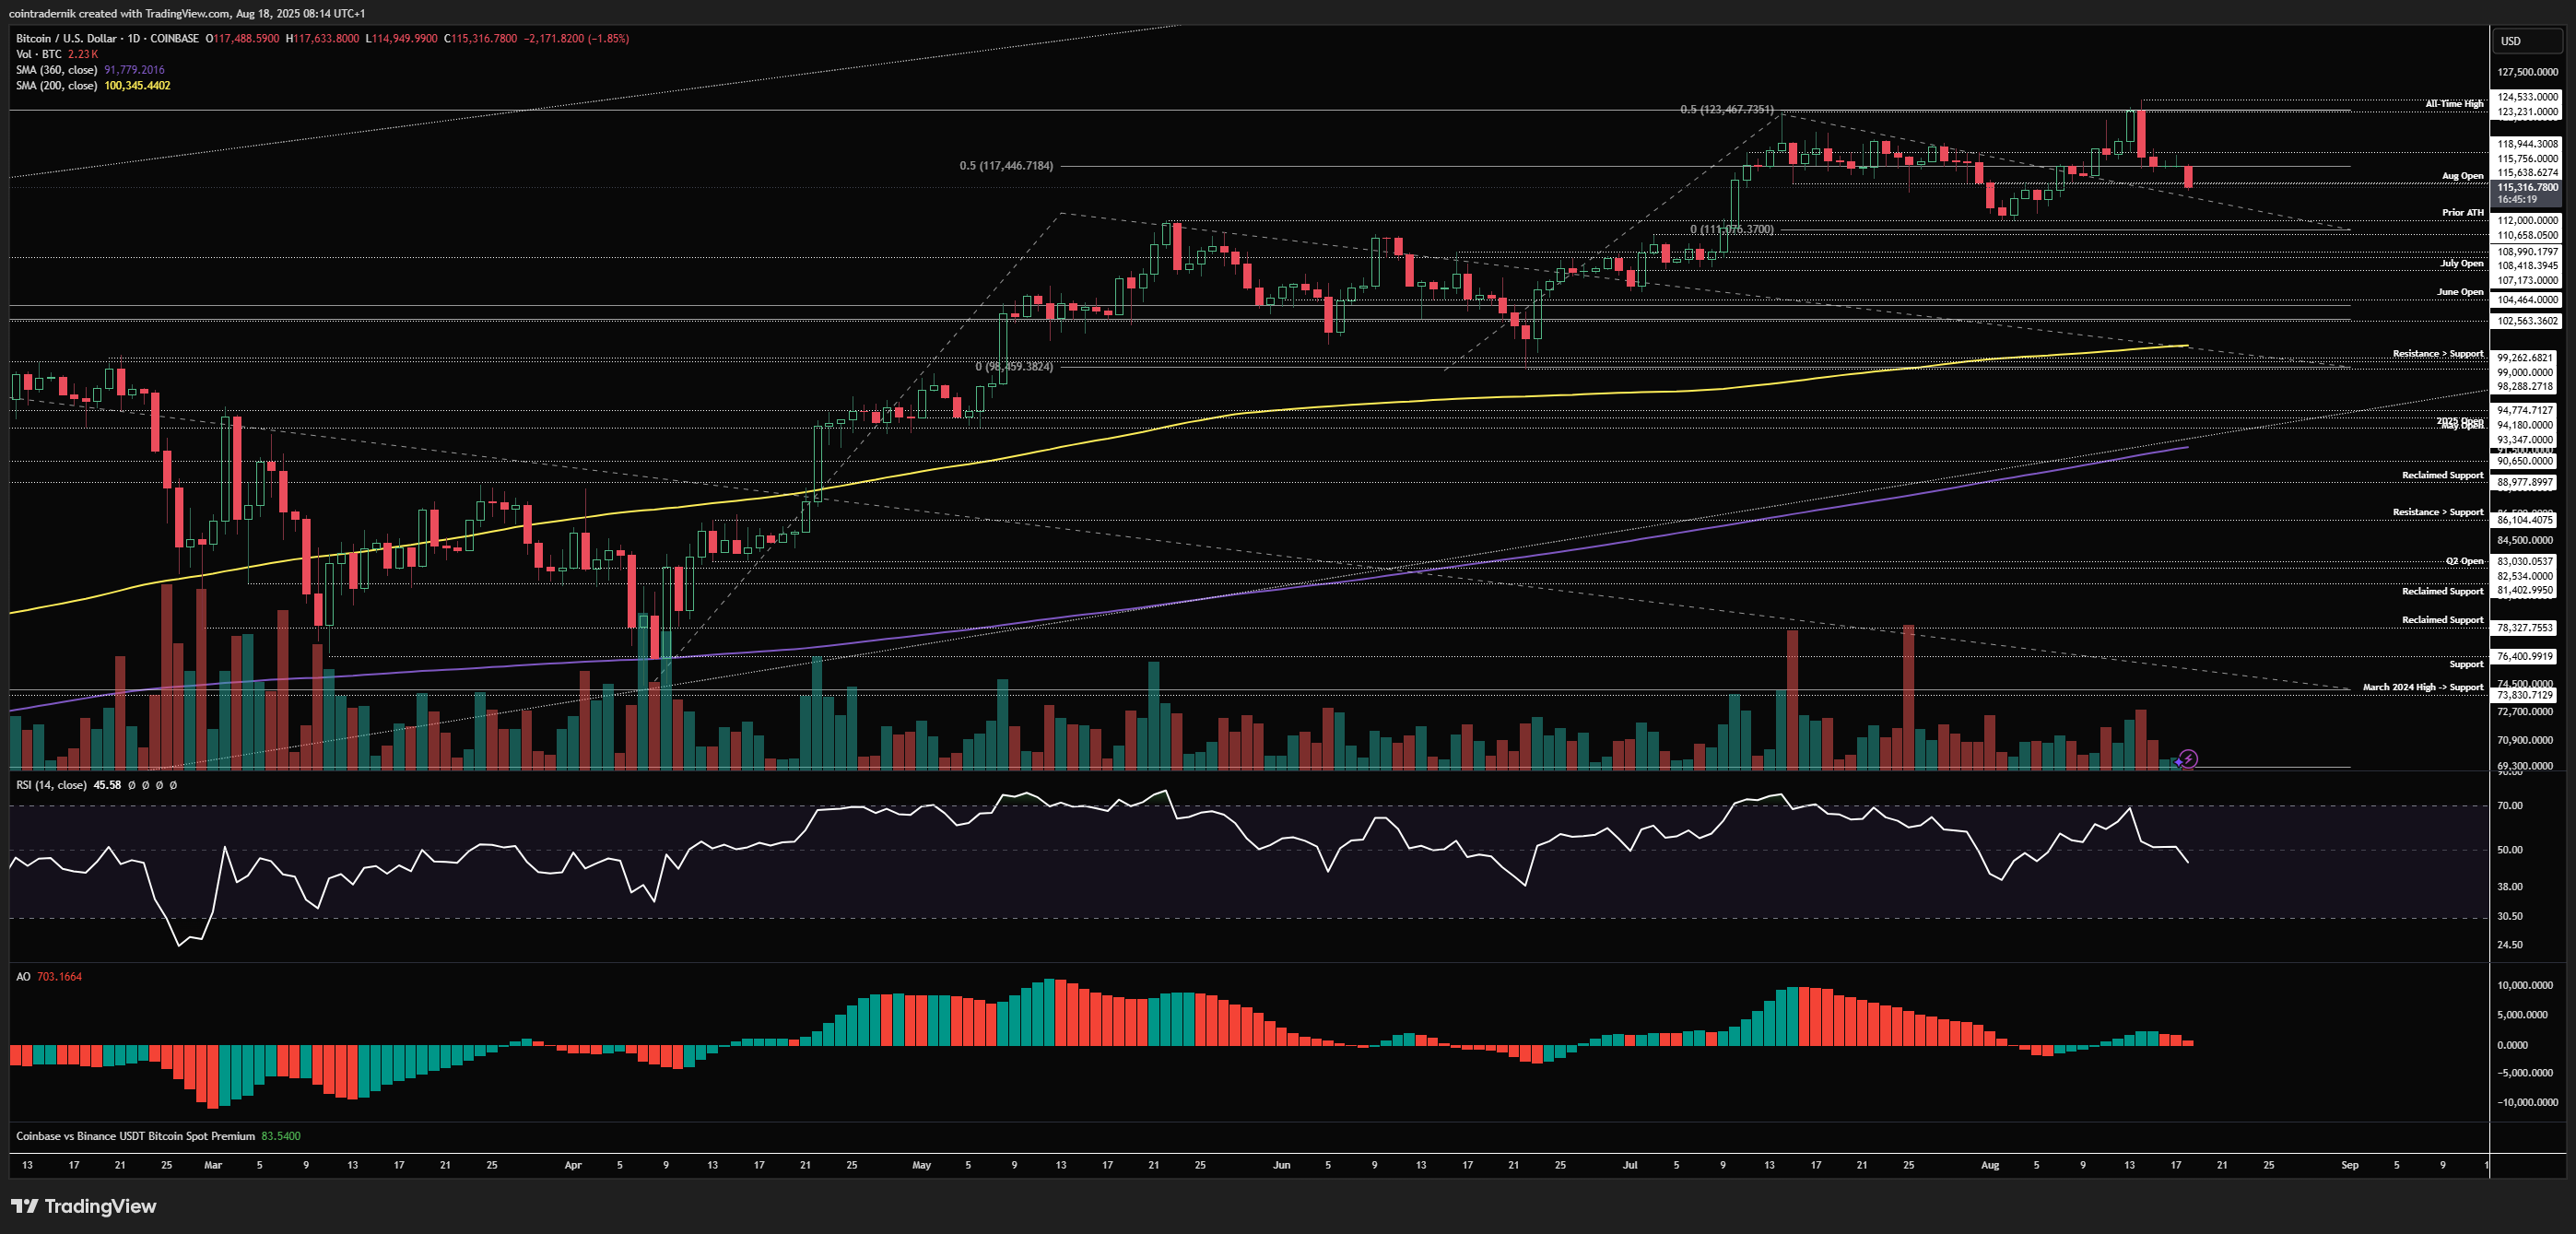
Looking at the daily, we can see that daily structure is still bullish given that the previous major swing-low on this timeframe remains intact at $112k, but the bull trap into the highs was particularly brutal, engulfing the prior breakout candle and reclaiming $119k as major resistance. We are now marginally back below the August open, but we did see price sell off right from the weekly open, forming the weekly high within the first 10 minutes of this weekly candle. These highs or lows formed right around the open are more often than not revisited, lending some confidence to longs this week targeting at least $117.4k. Now, it may well be that we see further downside early this week through the inside week low at $112.6k and then turn off that area and reverse back into the weekly open and beyond, killing two statistically probable birds with one stone; conversely, if we hold early this week at this August open level and pump back into $117.4k into mid-week, that could set up a fade for continued downside into Jackson Hole, where we may then take out that $112k area. Honestly, it is quite difficult to call here given the mix of signals across price-action, structure and momentum, in the context of a huge macro event at the end of this week. My gut is saying that derisking into Thursday leads to a very swift reversal out of the Fed event into fresh highs before the August close, with us carrying that momentum into September FOMC; if we close this week below $112k, I think we continue to correct and consolidate into early-mid Sept and mark out a low around then, which could well be back around the July open.
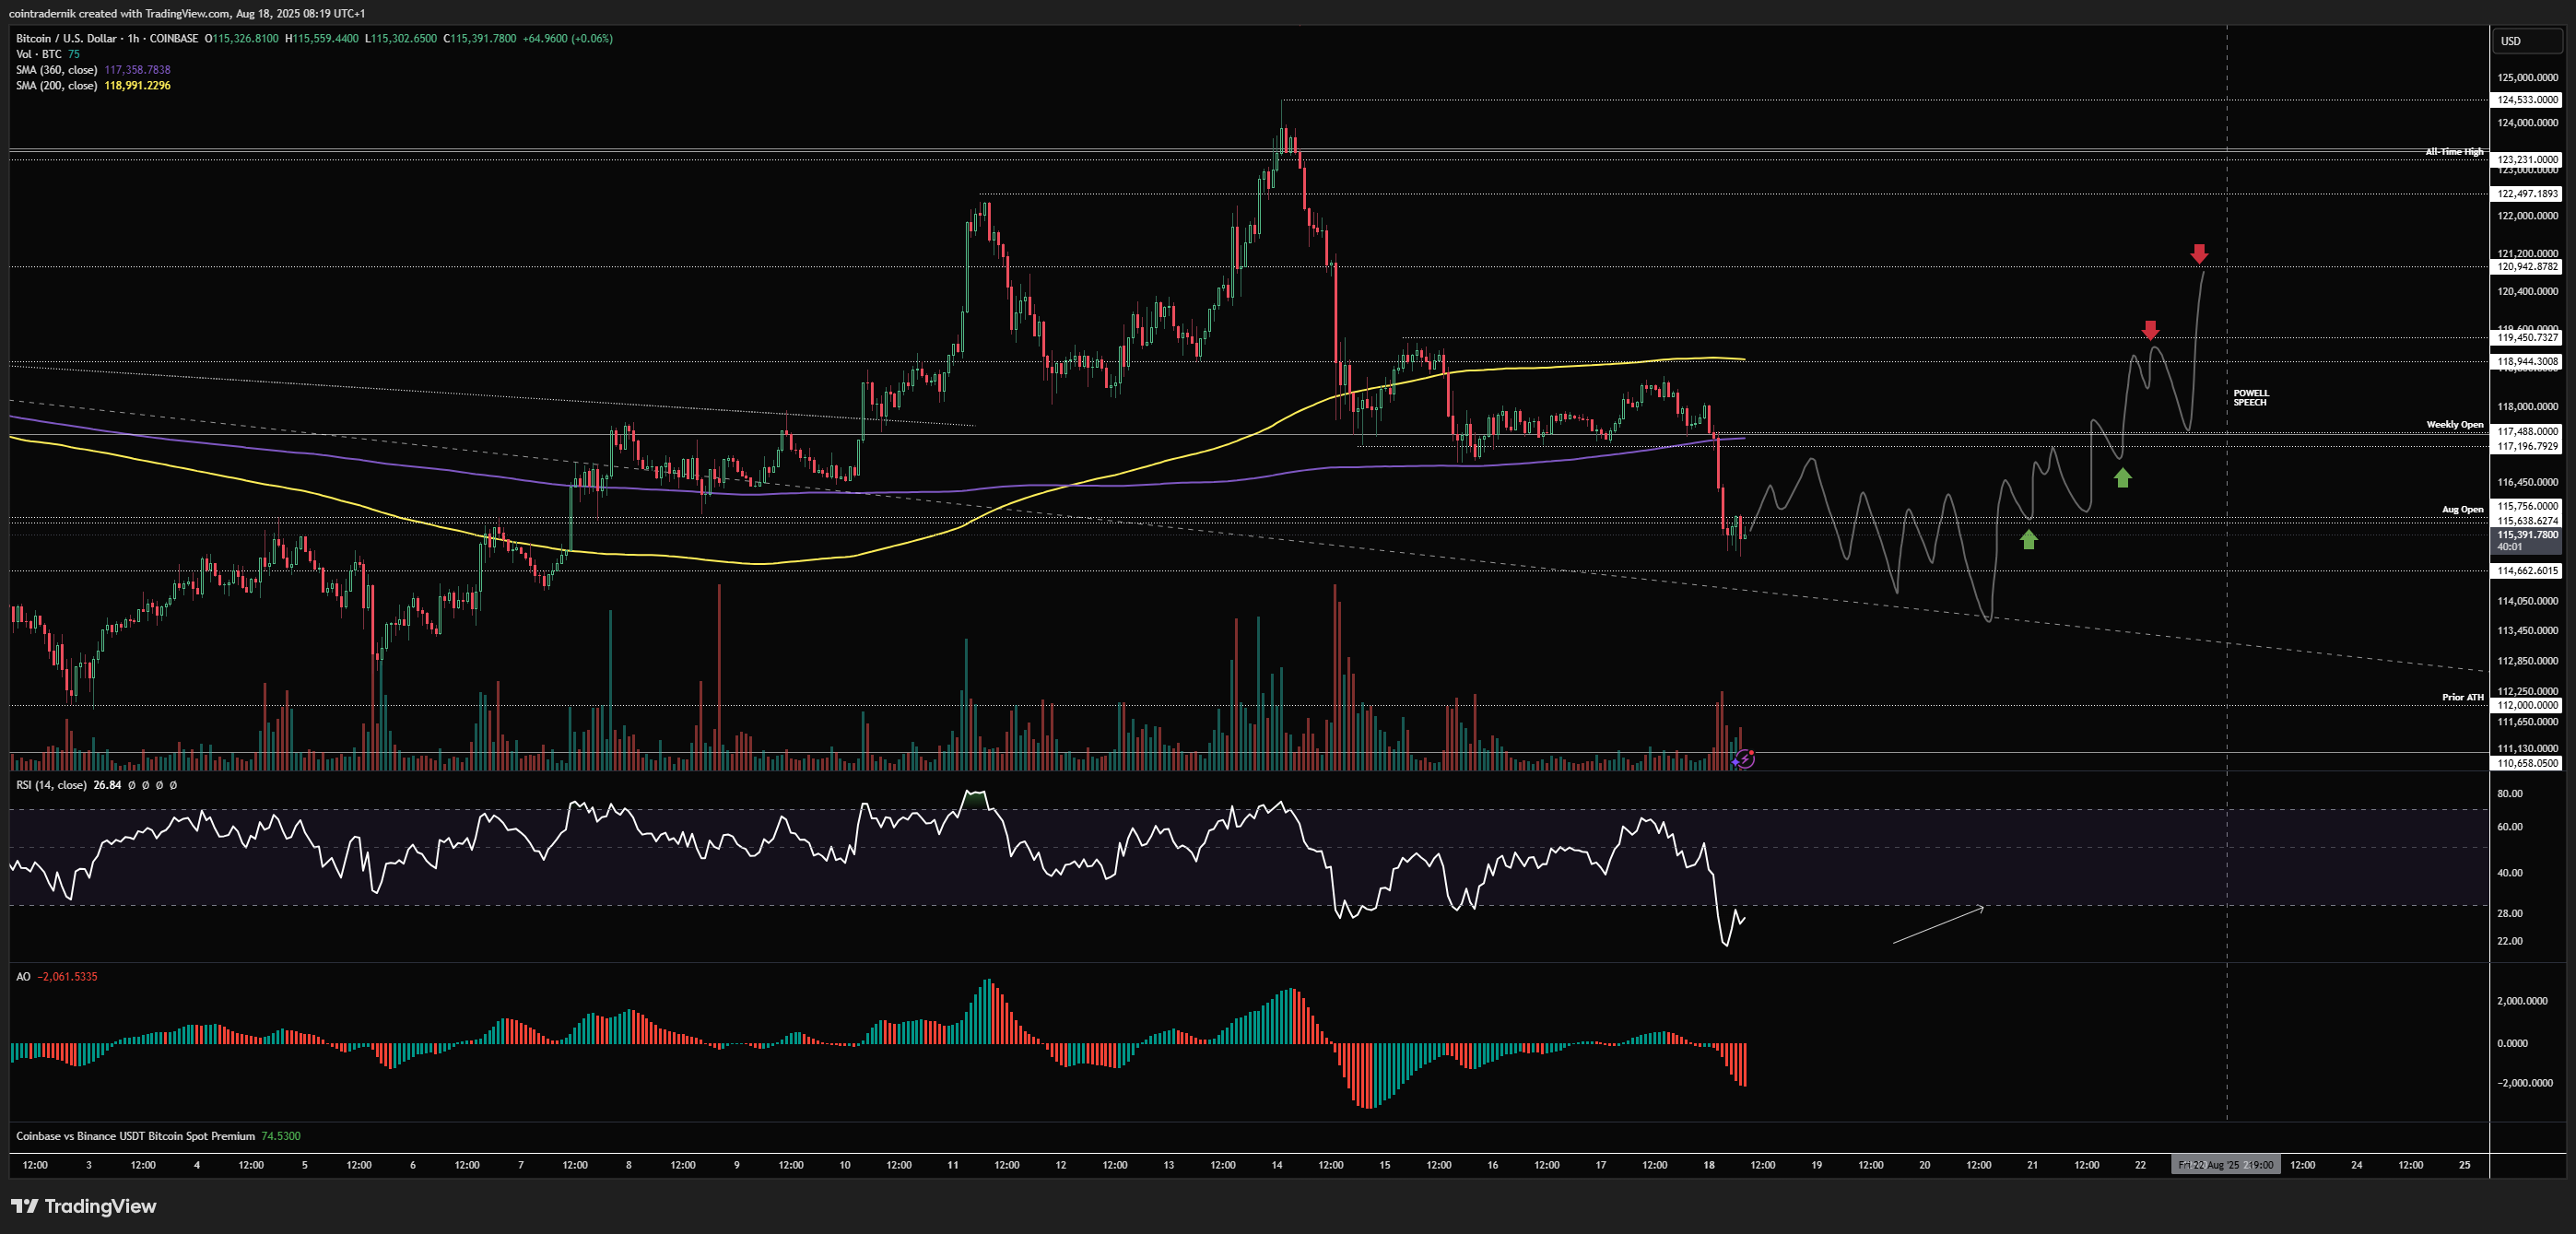
Now, looking at setups for this potentially volatile week, longs are favourable as mentioned above into $117.5k at least given the manner of the weekly open, but you ideally want to see continued downside from here into mid-week and then look for your entry. One potential scenario would be bullish divergence into that prior inside week low around $112.7k, where once that level is swept you could add into the lows (I have missed the green arrow here), then scale in back above Aug open, adding more if we turn the weekly open into support, though you could also just fully exit into that $117.5k level and re-assess for any further upside:
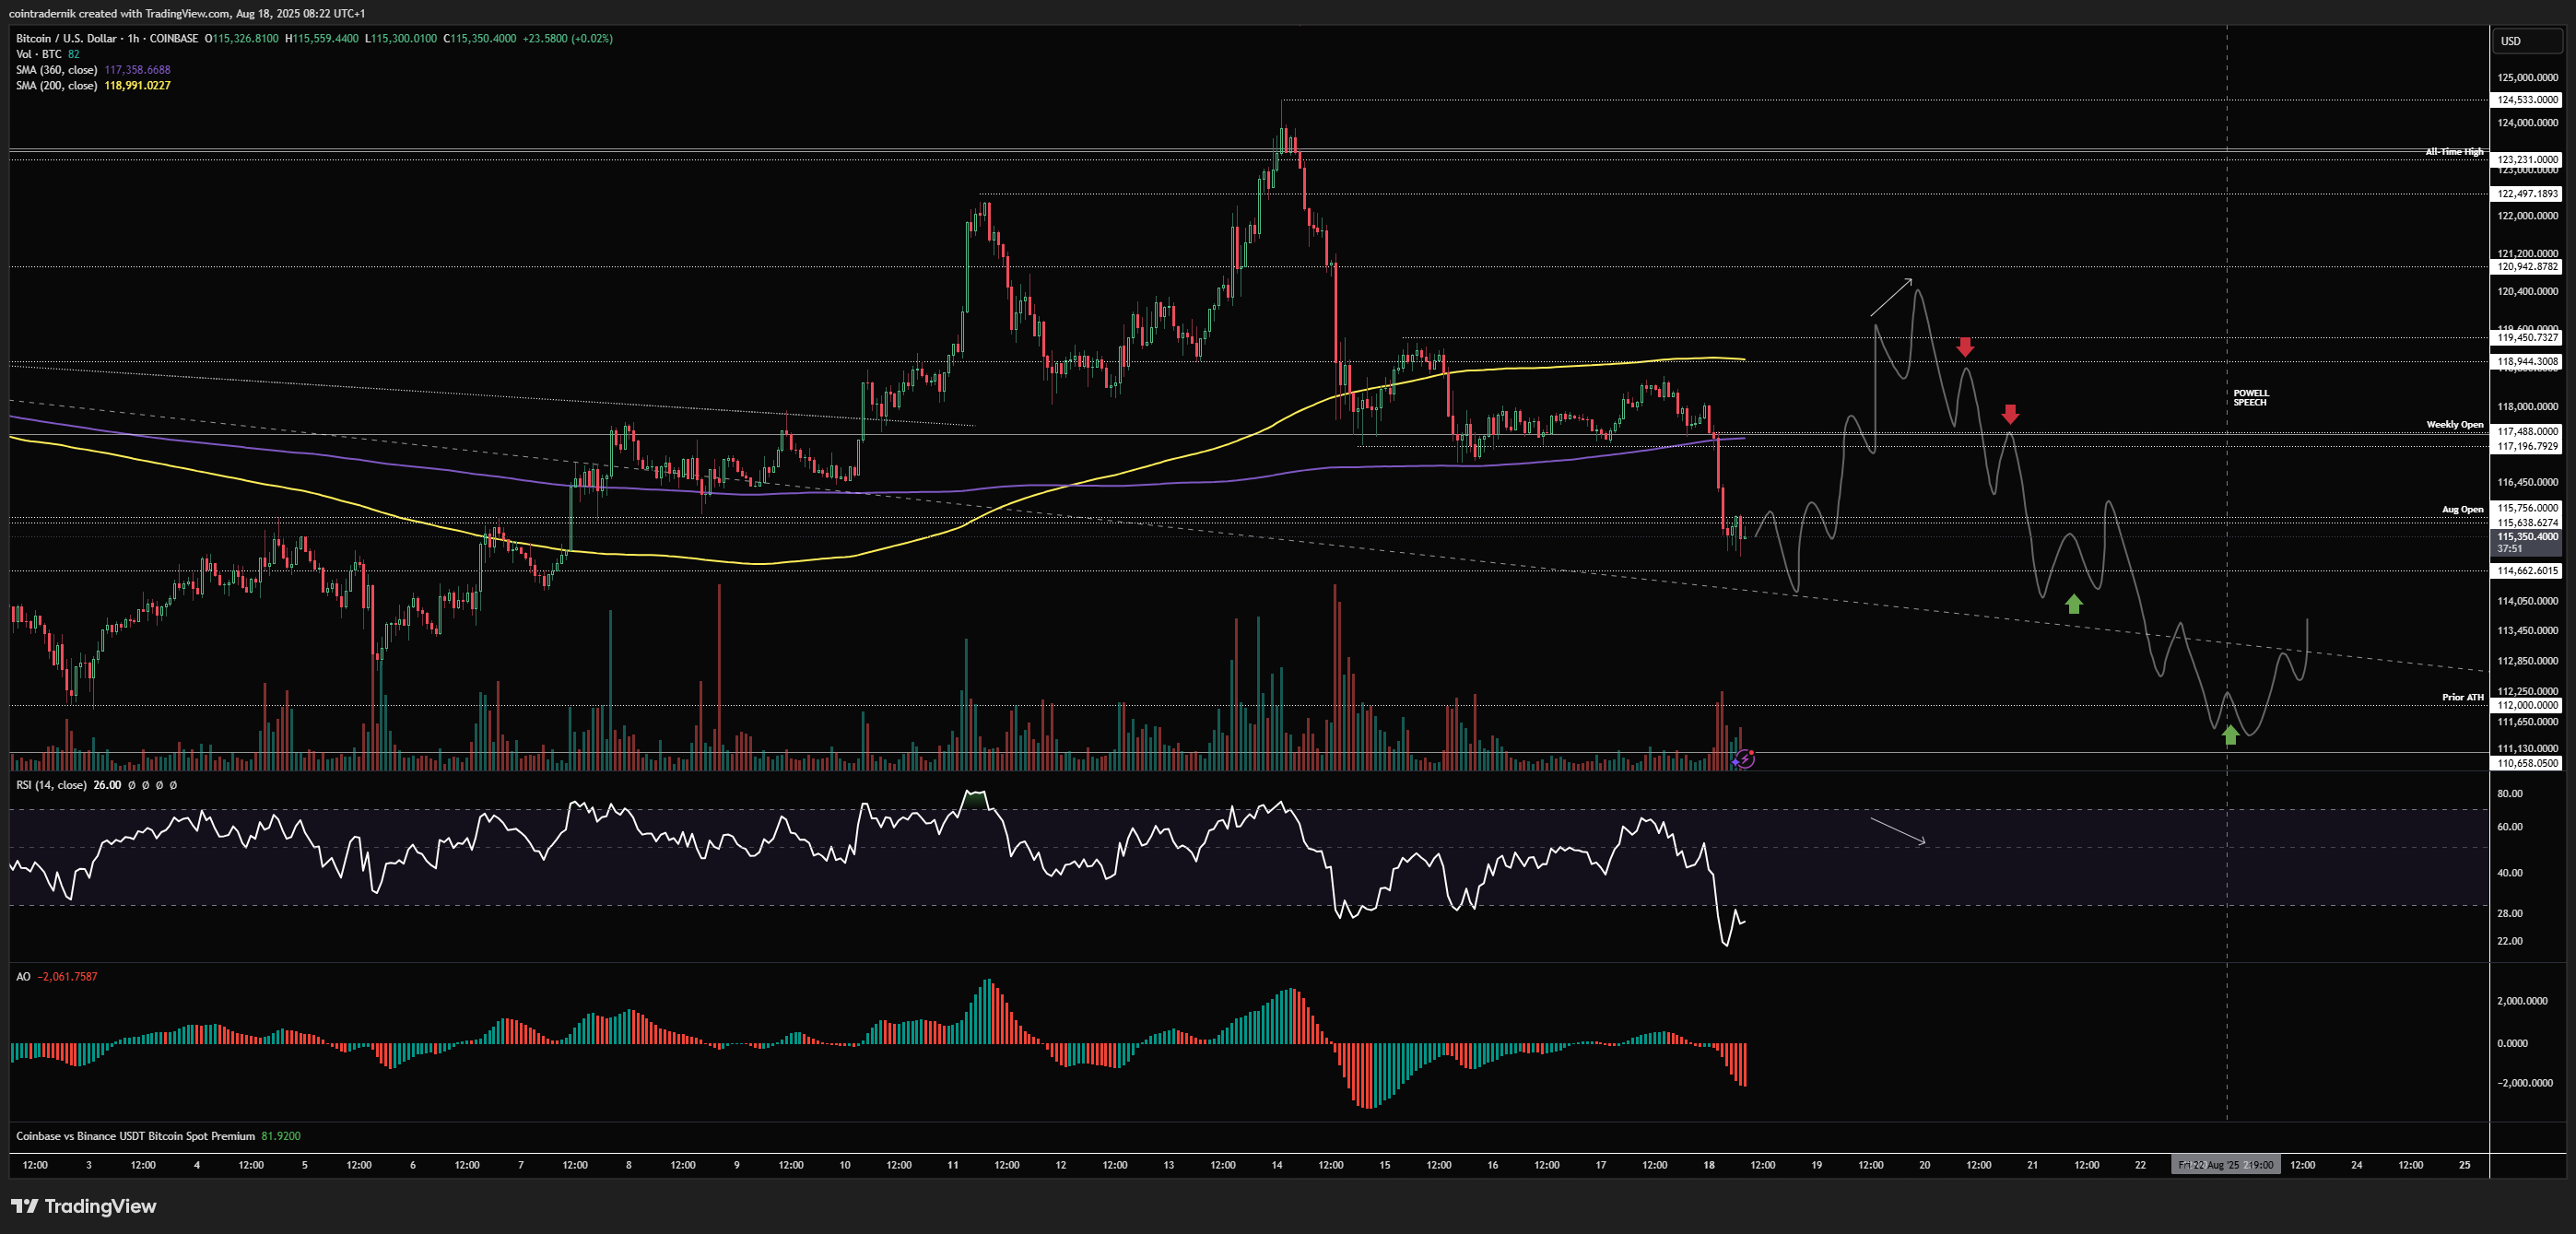
The cleanest short setups here would be to leave the inside week low untouched and rally early this week back through the weekly open, taking out the weekend highs and forming some exhaustion up there into mid-week, then looking to fade that all the way back into Friday where I think it is likely we would take out $112k before forming any bottom:
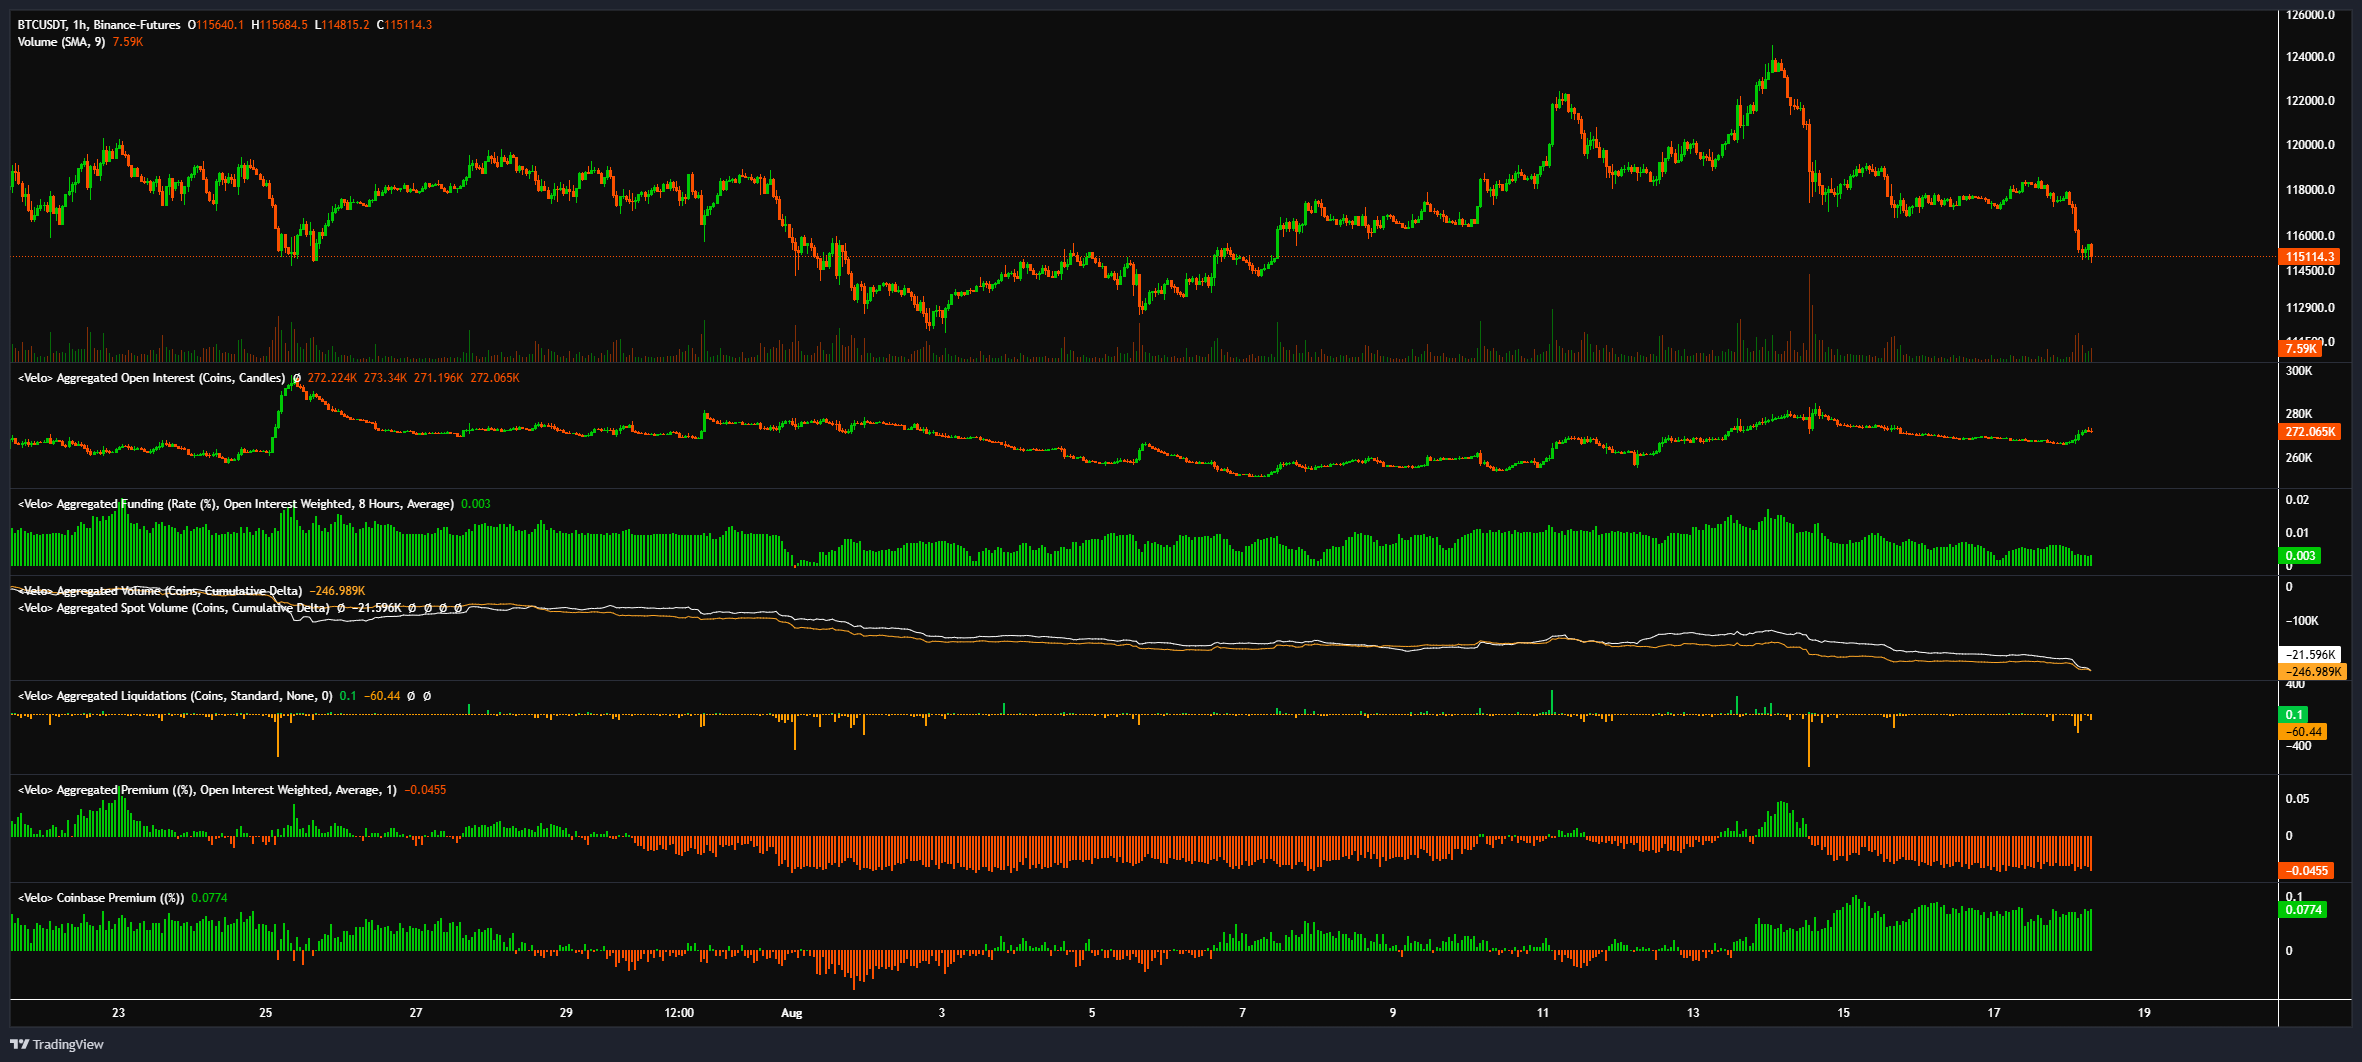
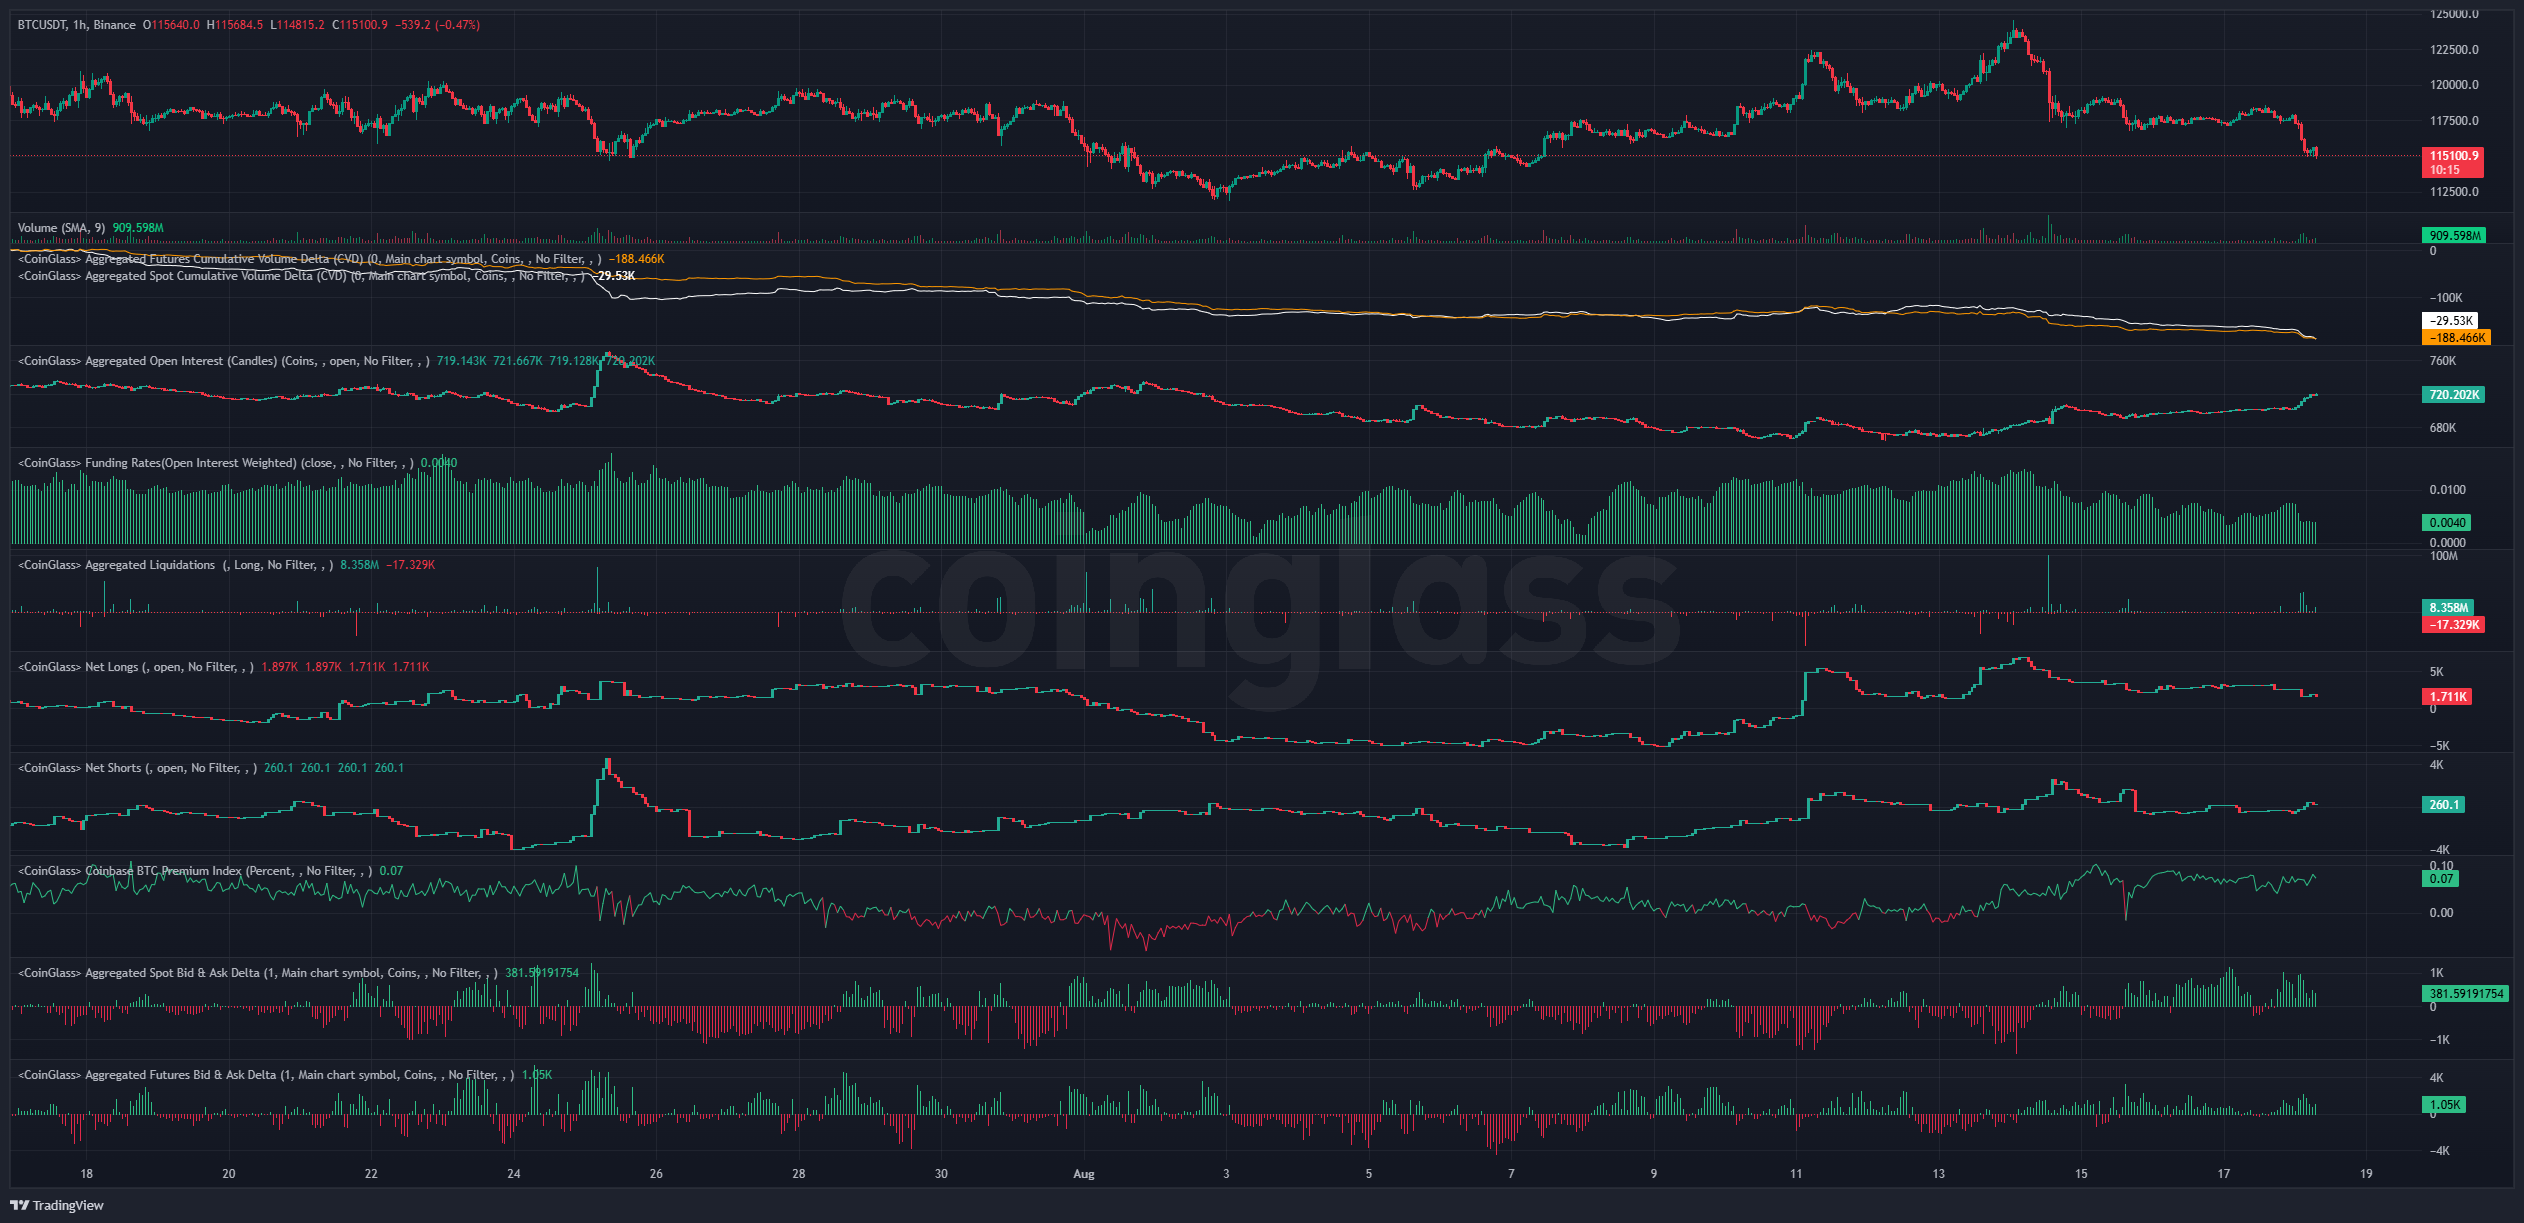
And here's a snapshot of positioning across Velo and CoinGlass:
And here's 3-month annualized basis:

And Bitcoin OI vs Altcoin OI:
.png)
And finally some of the expected 1-week and 1-month liquidation levels:
-2025-08-18_07_46_55.png)
-2025-08-18_07_47_34.png)
Price: $4248
ETH/USD
Weekly:
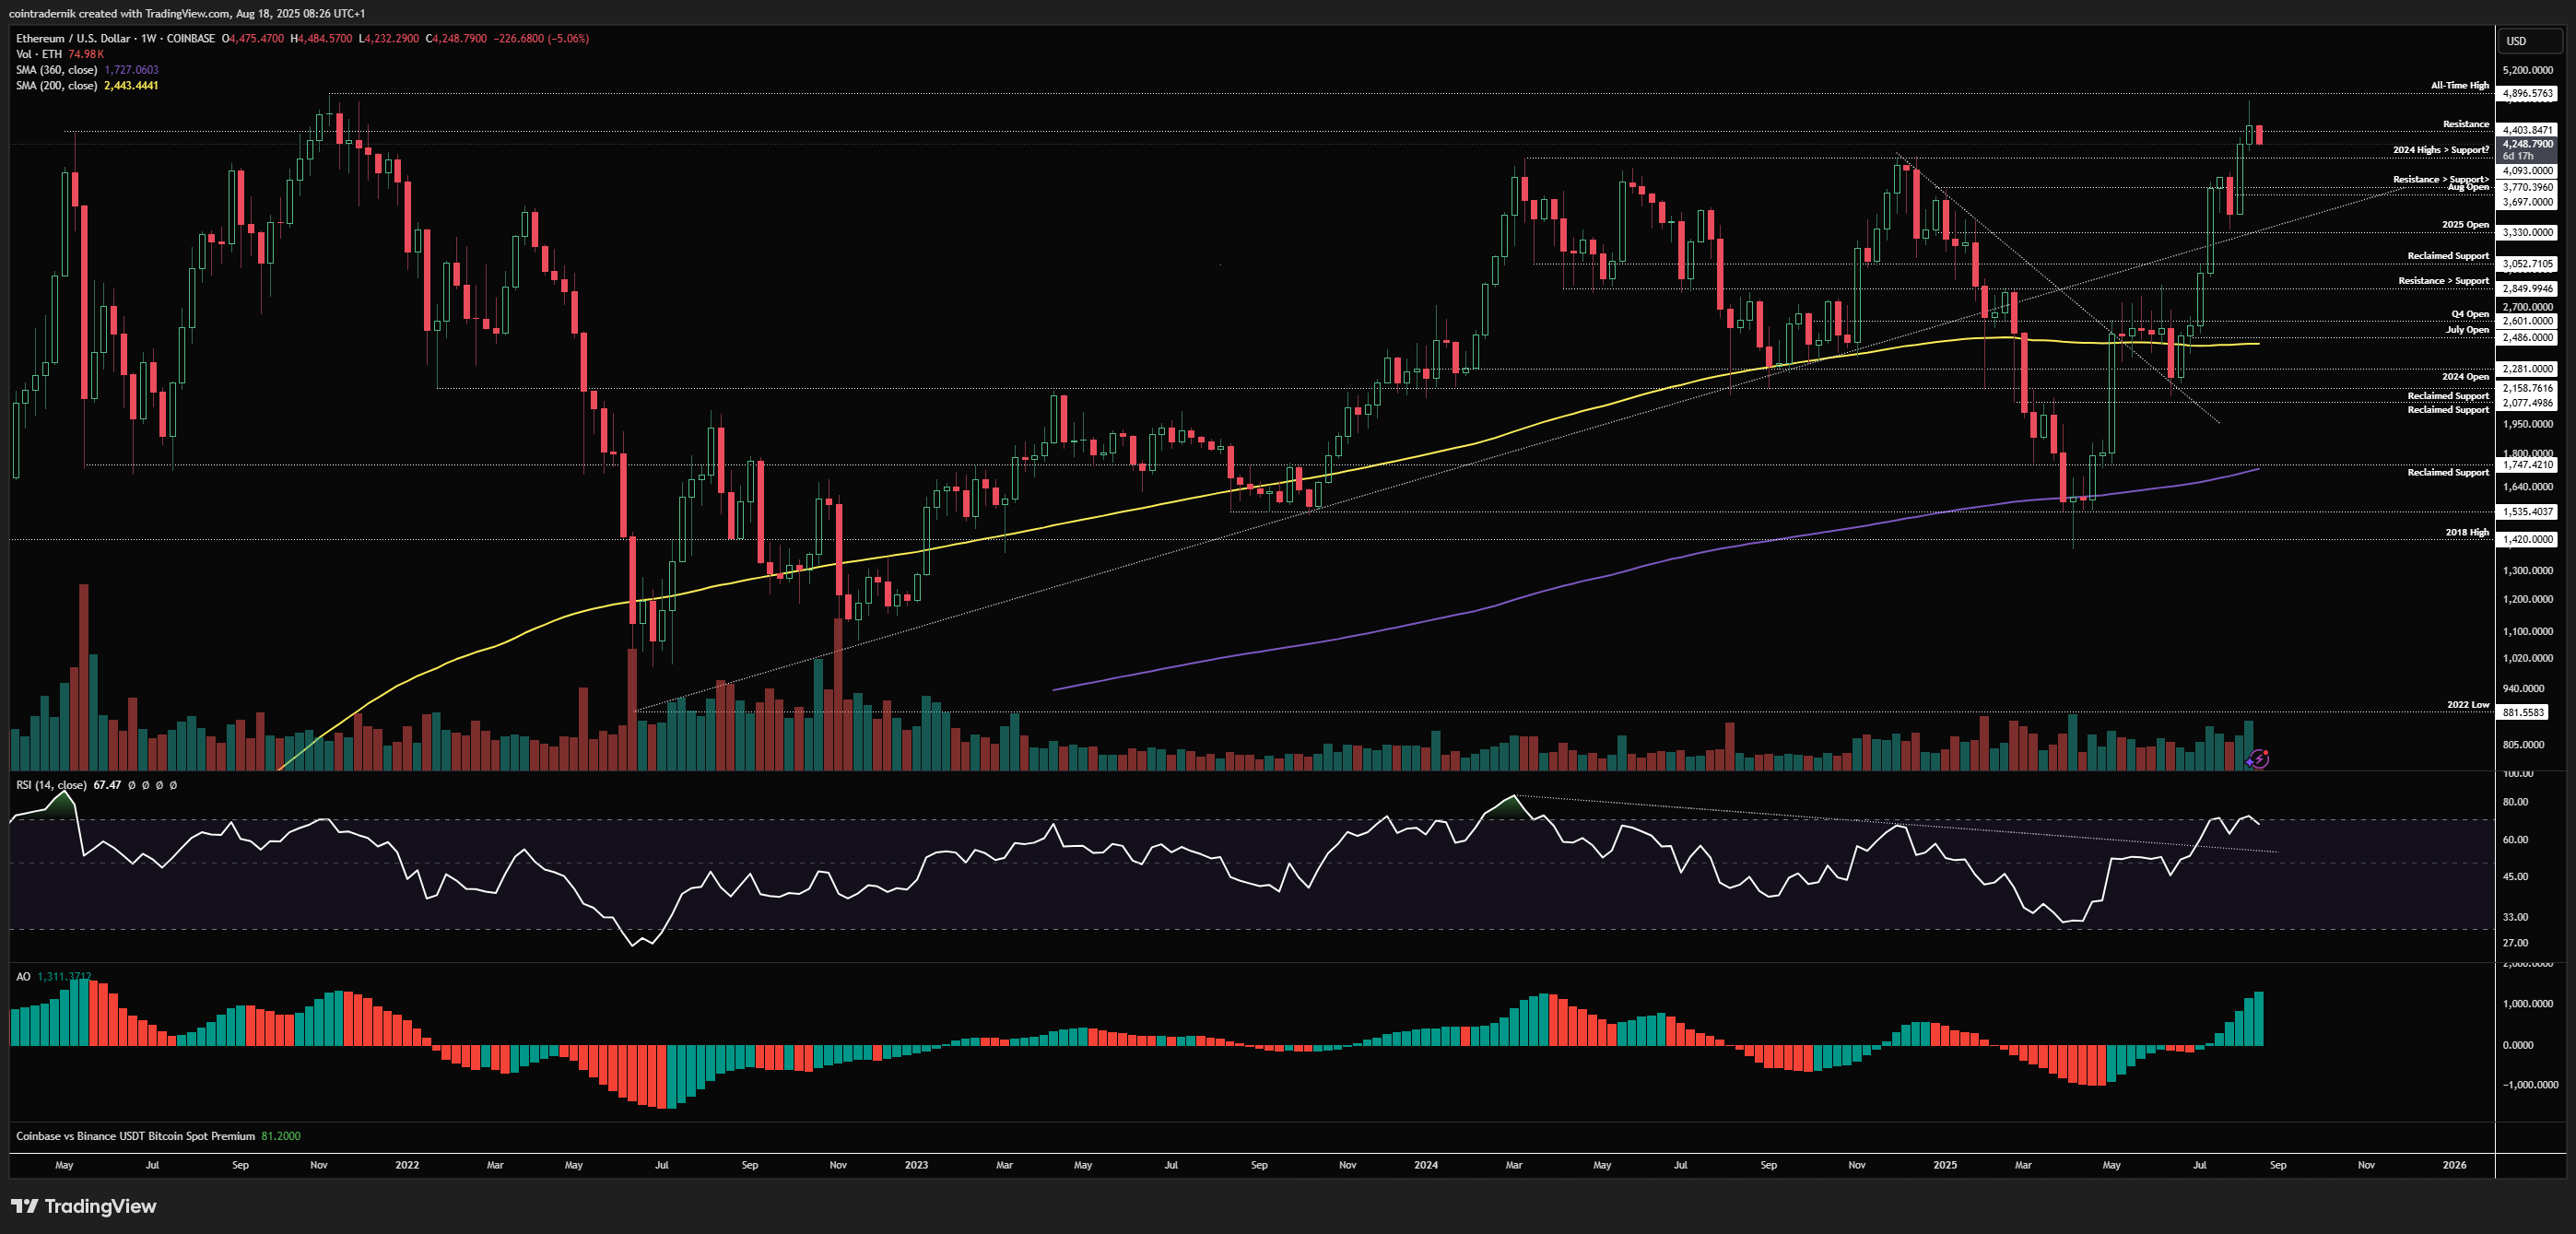
Beginning with the weekly for ETH/USD, we can see that price closed above resistance at $4400 after rejecting below all-time highs at $4893, as expected. We have bullish structure and momentum here with price now turning lower off this resistance level, likely to squeeze into that multi-year resistance turned support level below at $4093 this week. We should see demand step in around that level, and if we then close this week above $4400 I would expect another test of all-time highs before August close; if, instead, we break below $4093 this week into the close, we have a swing-high formation that I would expect to lead to continued downside into the August open at $3700, where I do expect us to form a higher-low and push on higher again. We should not be closing August back below $3700 if this is to remain mid-term bullish, in my view.
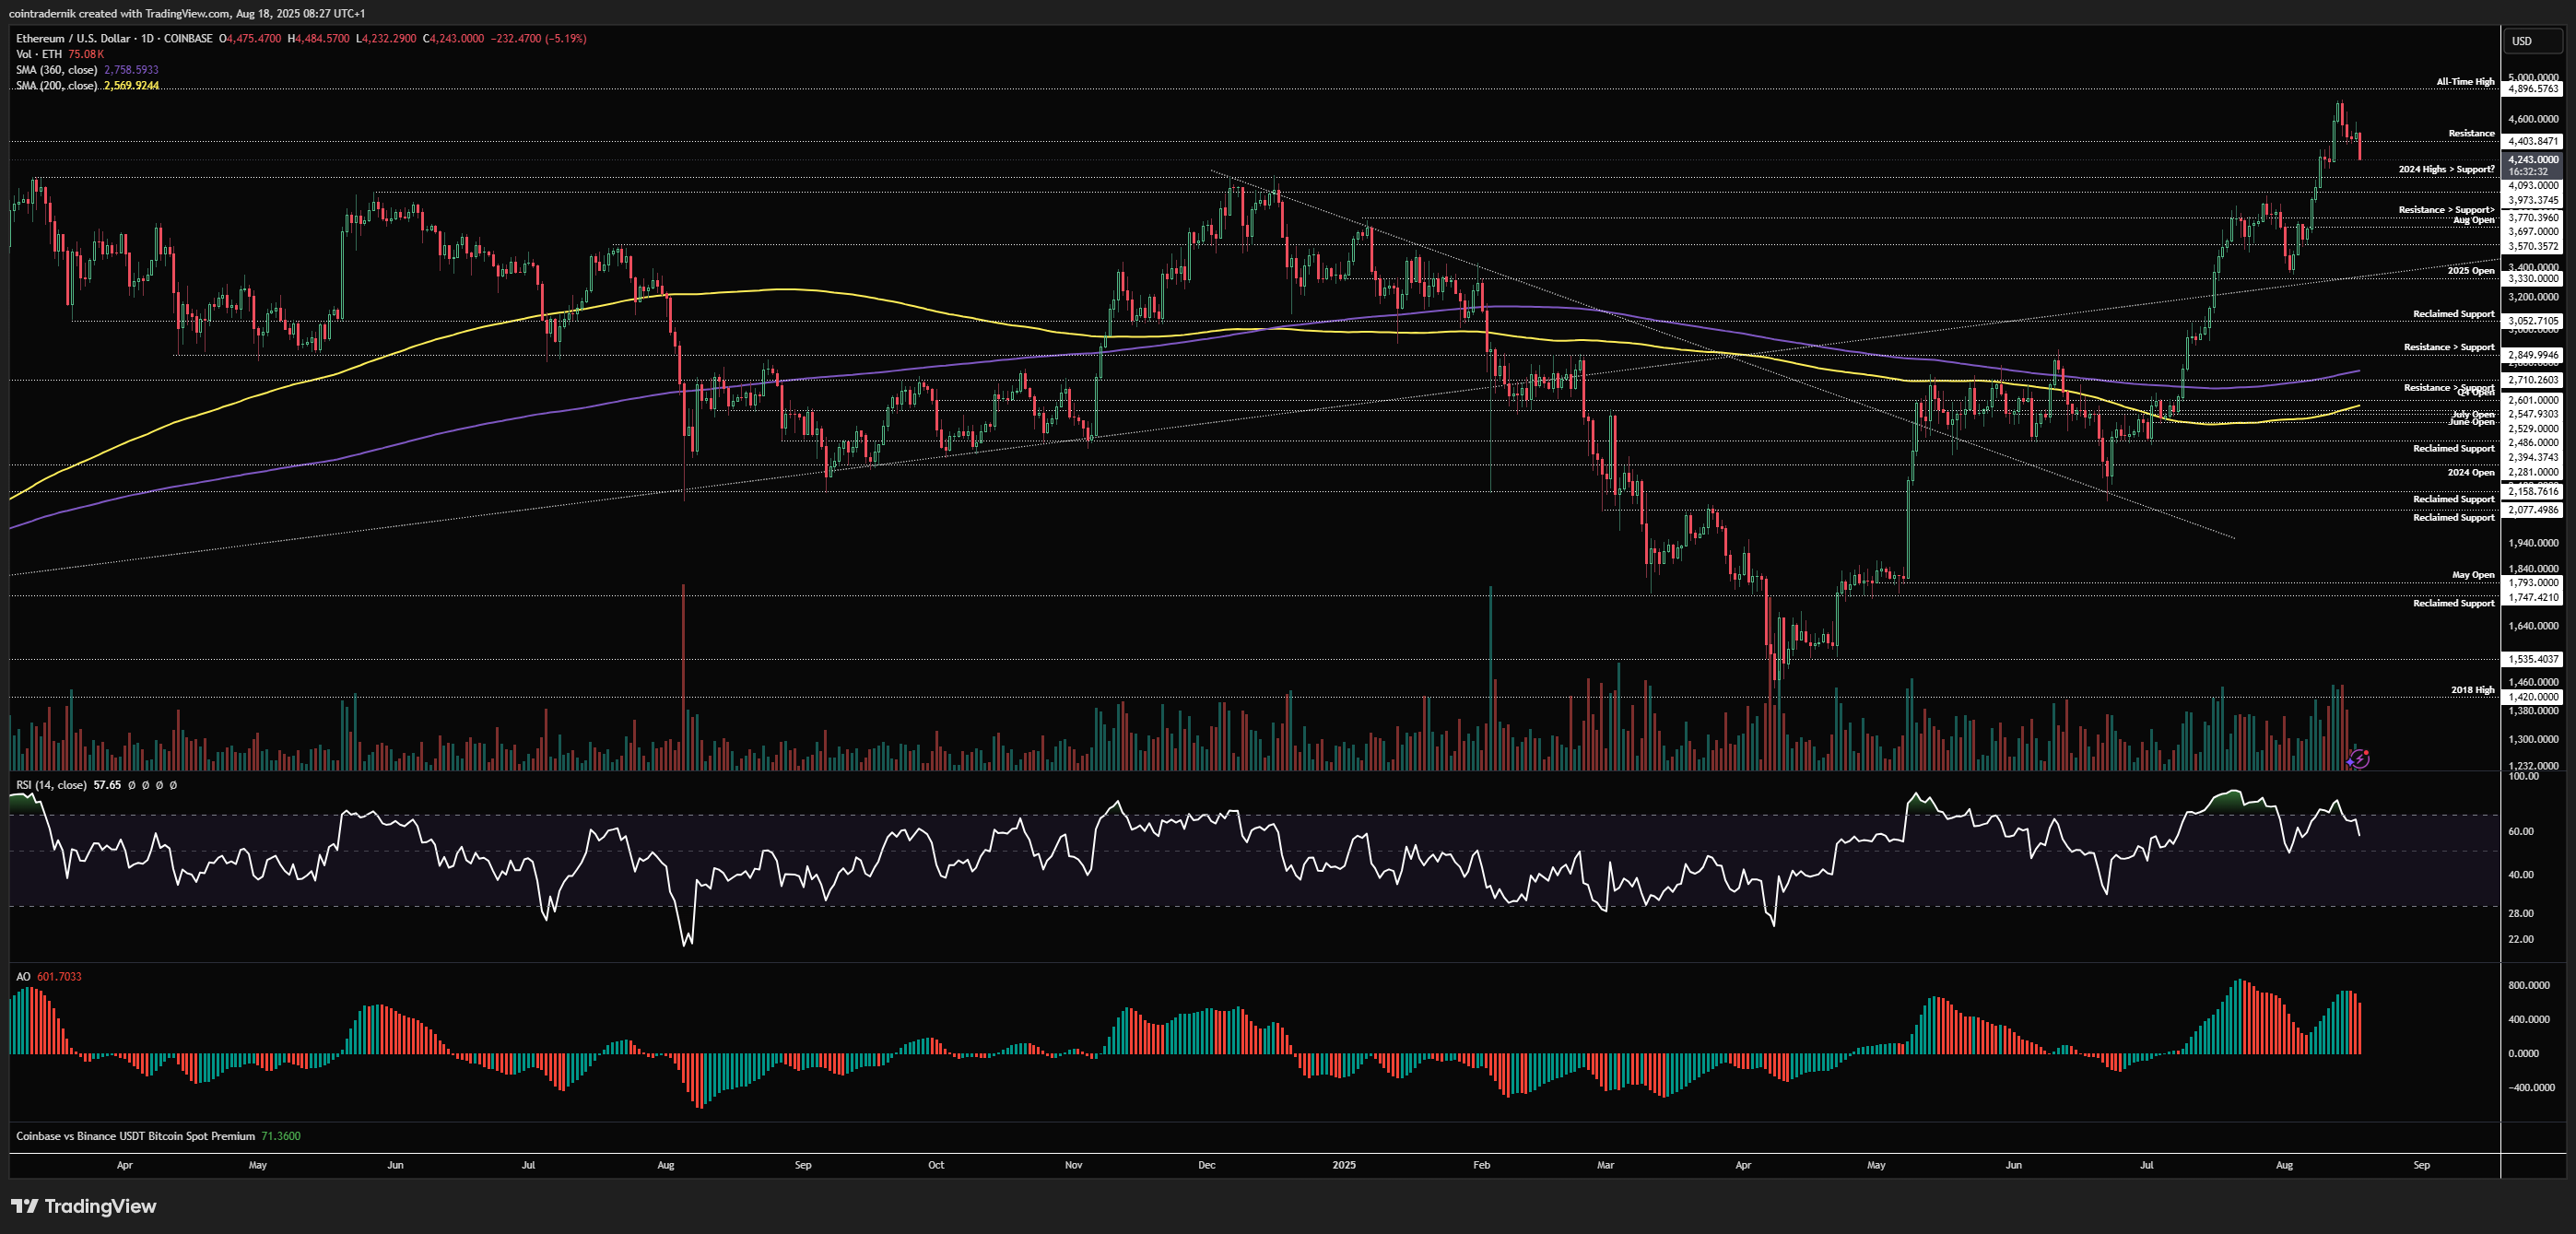
Turning to the daily, we can see that price is pushing into a local swing-low above $4093 that led to the run into $4800, so I would expect his area to get swept as the market derisks into later this week, but I am currently expecting $3973-$4093 to act as a demand zone and mark out a higher-low into next week from which we retest $4893. If we accept back below that demand zone, I think we set up a bear trap into that August open and then v-reverse out of it like the 2025 open retest a few weeks ago. Given higher timeframe market structure and momentum, we should expect a higher-low formation above that August open; if we flip that $3700 level into resistance I think we take out the 2025 open into early September and there's a lot of blood before any meaningful bottom is found and we can then re-assess for another attempt at the highs in Q4.
ETH/BTC
Weekly:
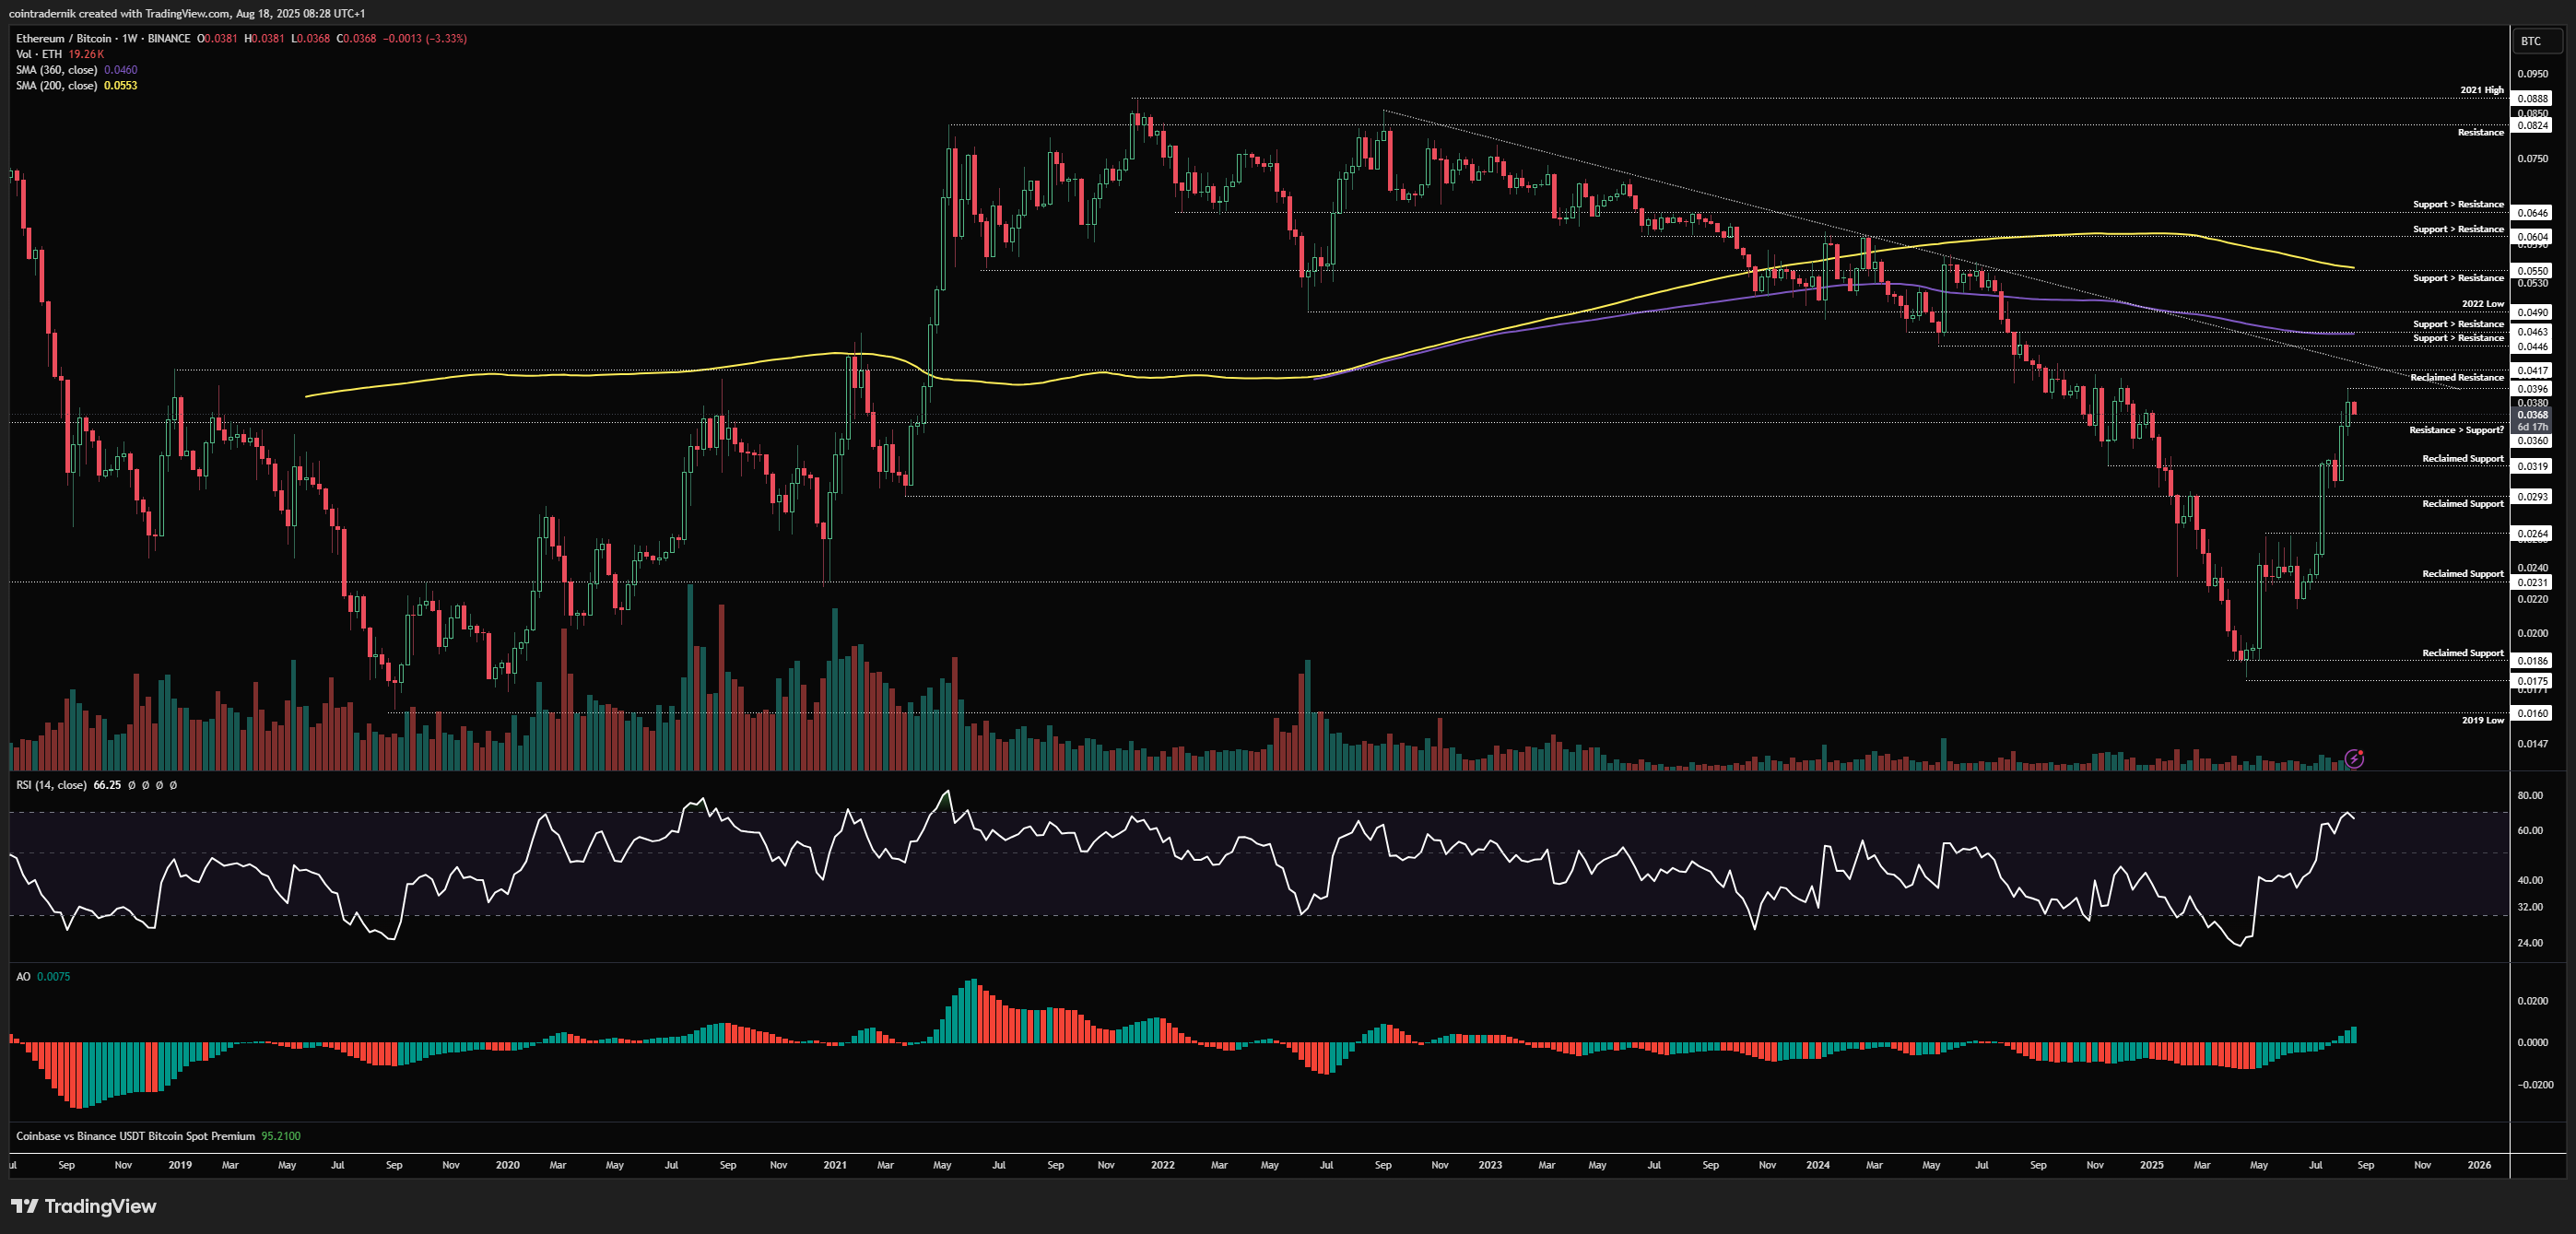
Looking at ETH/BTC on the weekly timeframe, we can see that weekly momentum and structure remain firmly bullish, with no signs of exhaustion and with price sat in no man's land between prior resistance at 0.036 and overhead resistance around that multi-year trendline and 0.0417 level. We should see 0.036 act as support on a retest here, leading to continuation higher into that major resistance cluster above, but if instead we see price close back below 0.036. there is still nothing bearish about this chart; all it would mean is price reaching for that 0.032 area to retest support and mark out a higher-low. Whilst weekly structure and momentum are bullish, we should expect pullbacks to form higher-lows and price to continue pushing higher. Until we reach that 0.0417 confluence with the trendline, I remain bullish ETH/BTC. Acceptance above that trendline = blow-off top vibes.
Daily:
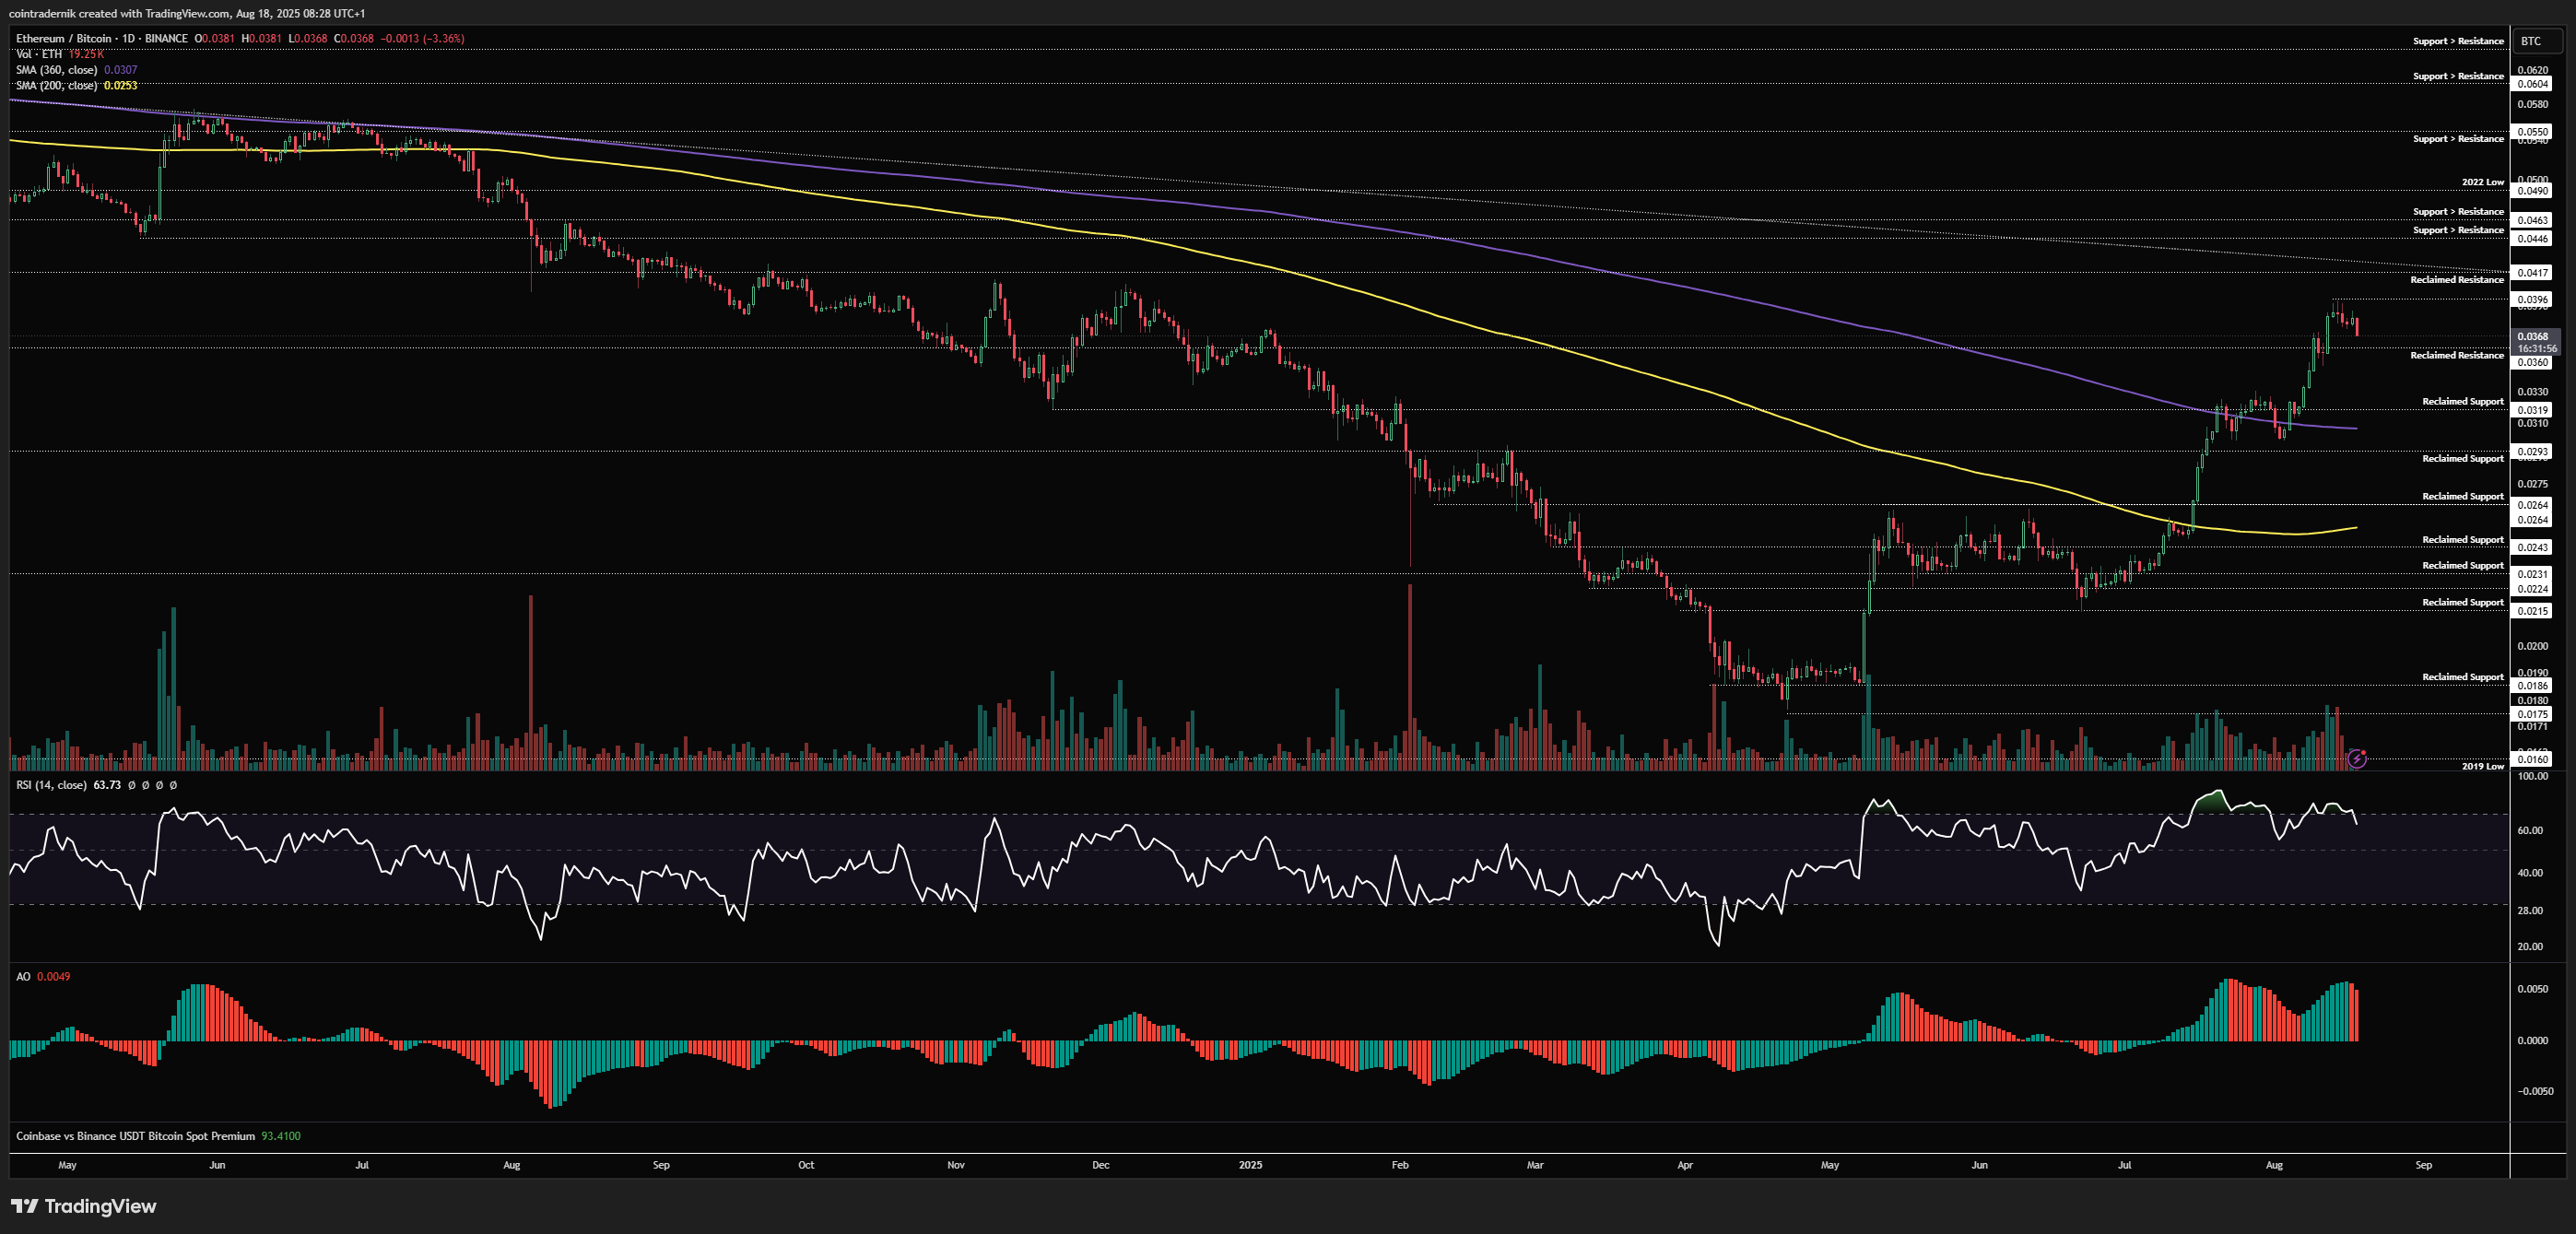
Looking now at the daily, we can see that momentum on this timeframe is rolling over a touch up here at 0.0396 and price is now retesting 0.036 as support. Again, if we catch a bid at this prior resistance, I think it is likely we see 0.0417 tagged into next week and that setups up some trend exhaustion into the August close. If we close the daily below 0.036, I think we reach for 0.033, front-running that 0.0319 level and the 360dMA retest, before marking out a higher-low and continuing towards that trendline overhead. Only acceptance above the trendline would open up higher targets and any bullishness I have had on the ETH/BTC pair will be reassessed at 0.0417. Higher until then.
Receive the latest updates directly to your inbox

Price: $6443
Weekly:
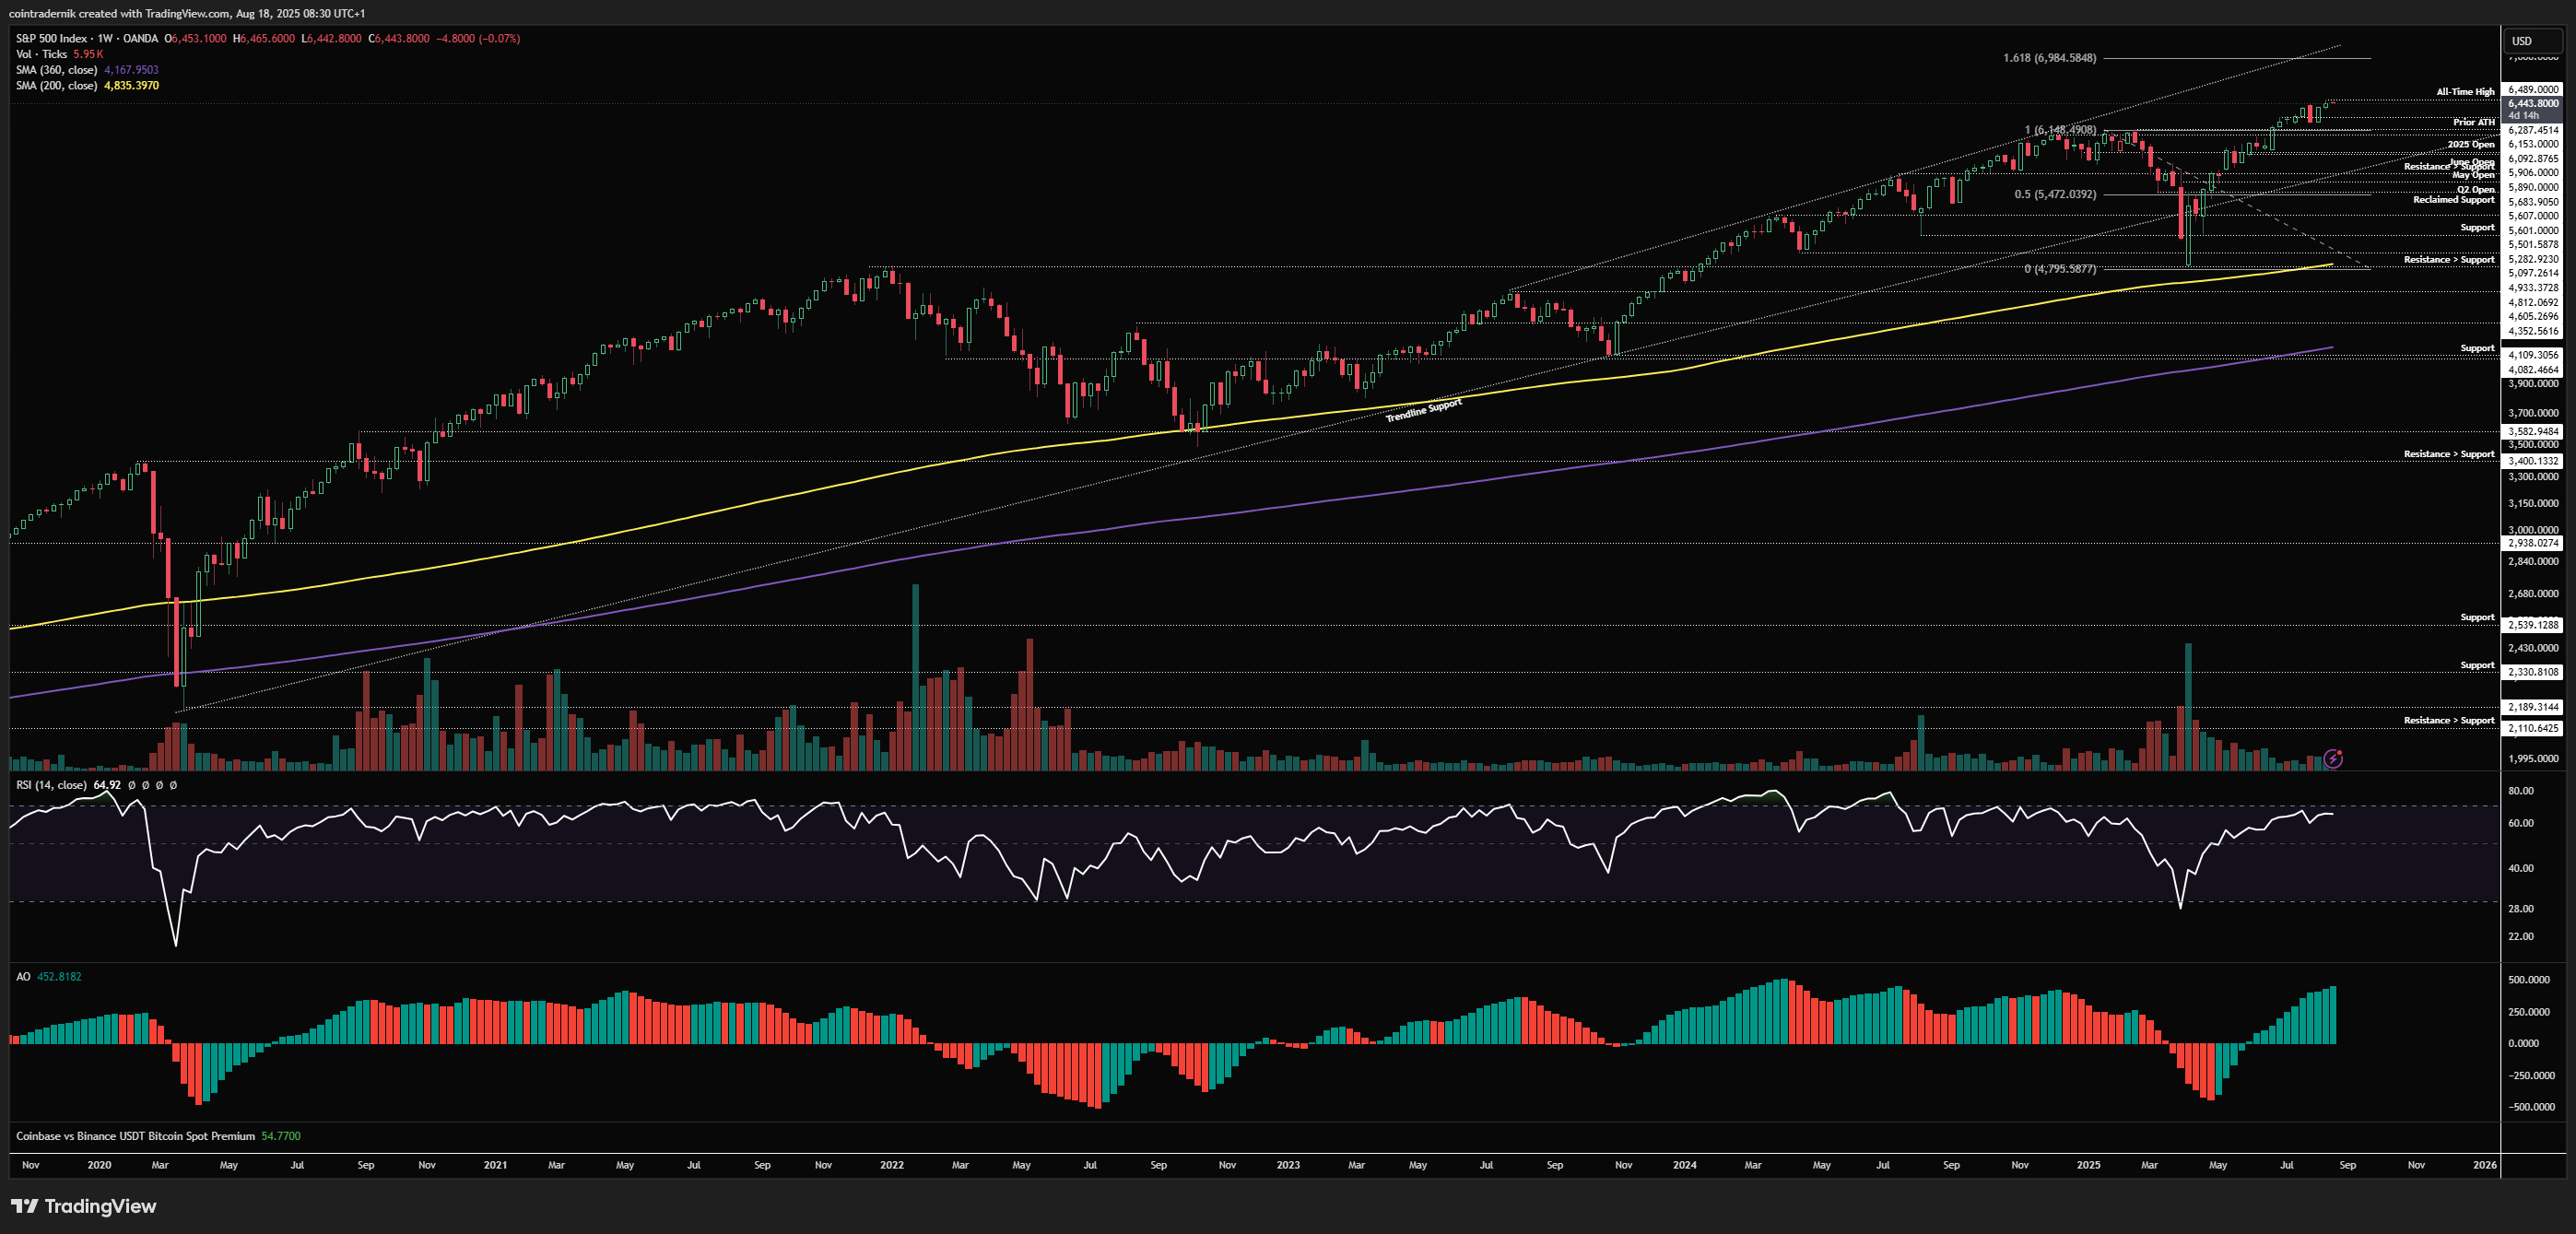
Beginning with the weekly, last week saw price close at $6453, having made new highs into $6489, with momentum continuing to build up here but with the potential for some divergence if we see weakness over the next couple of weeks. This is where we have two scenarios as outlined a couple of weeks ago: either we continue to grind higher, defying typical seasonality and climbing the wall of worry into September FOMC, after which we get the pullback when positioning is more stretched; or some sort of above-expectations hawkishness from Powell on Friday coupled with Russia-Ukraine tensions lead to the market correcting into mid-Sept, driven primarily by uncertainty, where resolution of that uncertainty post-FOMC kicks in the next leg of this bull market. My current expectation is the former is more probable than the latter given the price-action over the past couple of weeks, where I had initially expected weakness to kick in in early August that drove equities lower into September but resilience of demand coupled with continued bearish sentiment and moderate positioning has made me reassess this view. If we now see a neutral-to-dovish Powell post-jobs report, looking through the singular hot PPI print, I think the markets rip higher into September and that's where some of the euphoria gets trapped around that next FOMC. On a non-price-related note, I think Powell's Jackson Hole speech is likely to cement the fact that we are now moving towards a post-Powell Fed in the eyes of the market and that his July FOMC was his swan song, with the path ahead marked by a progressively more dovish Fed.
Daily:
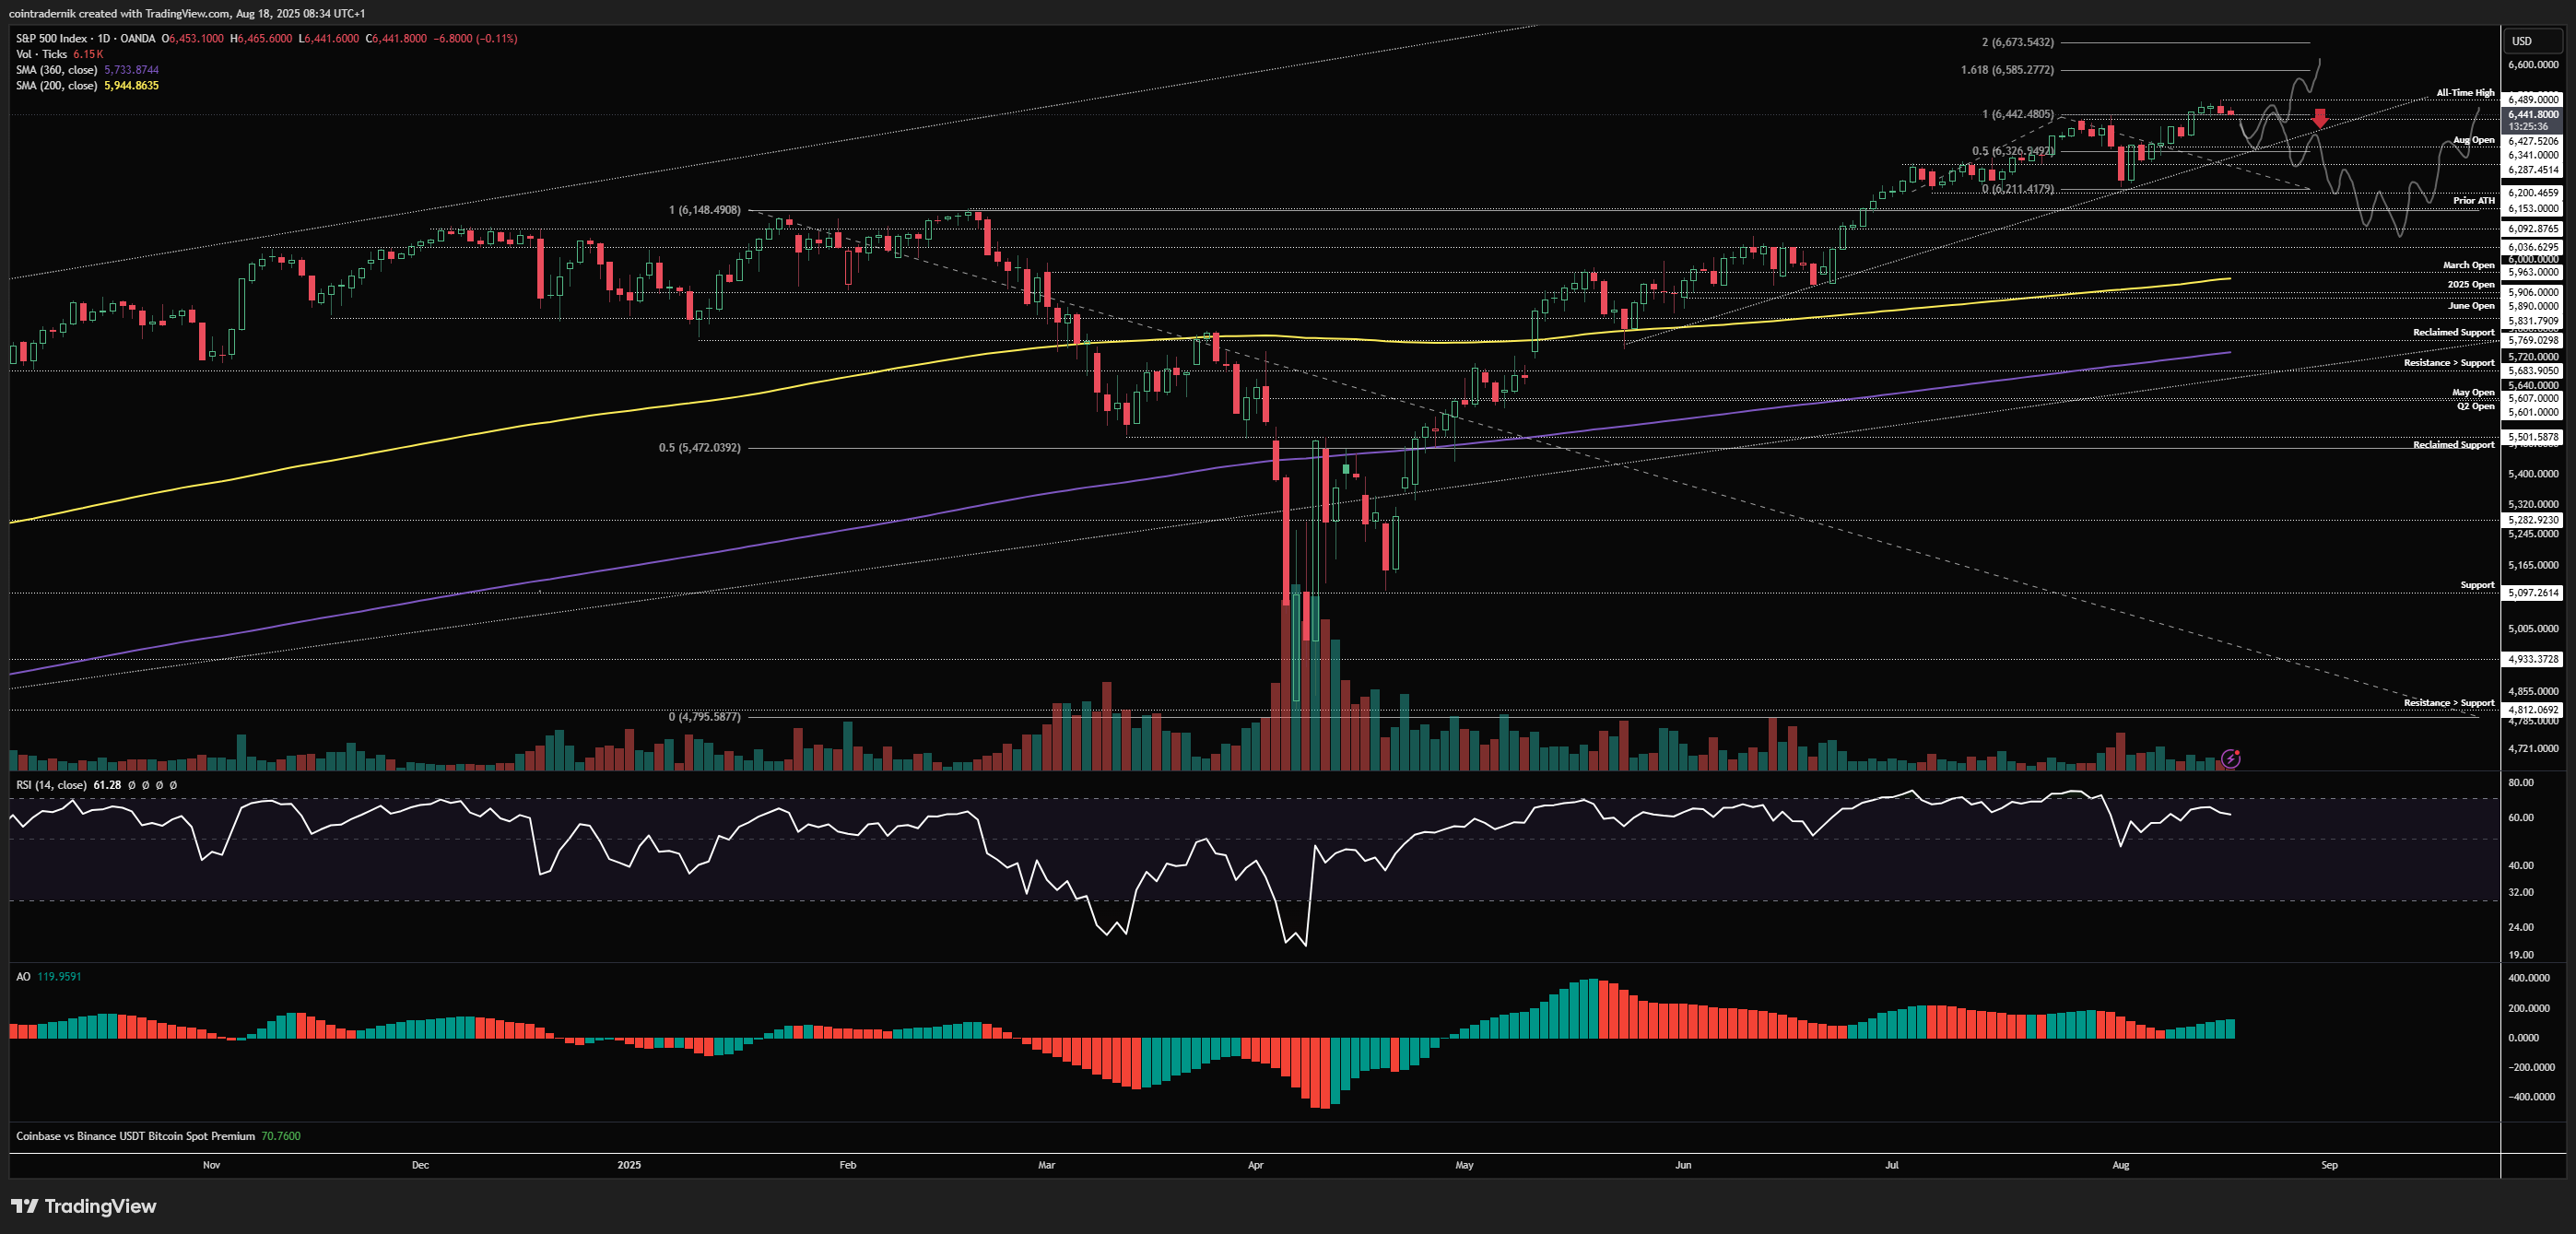
We can see these two paths marked out more clearly on the daily chart, where derisking into Jackson Hole followed by a rally into next week through all-time highs sets up that continuation rally into $6600+ before Sept FOMC, where I would then expect positioning and sentiment to be more reflective of price-action and set up the subsequent correction; conversely, rejection below $6440 next week and a breakdown below trendline support = deeper correction into September, through $6200 towards the prior all-time highs at $6150. Let's see how this next week or so plays out...
Price: $4.52
Weekly:
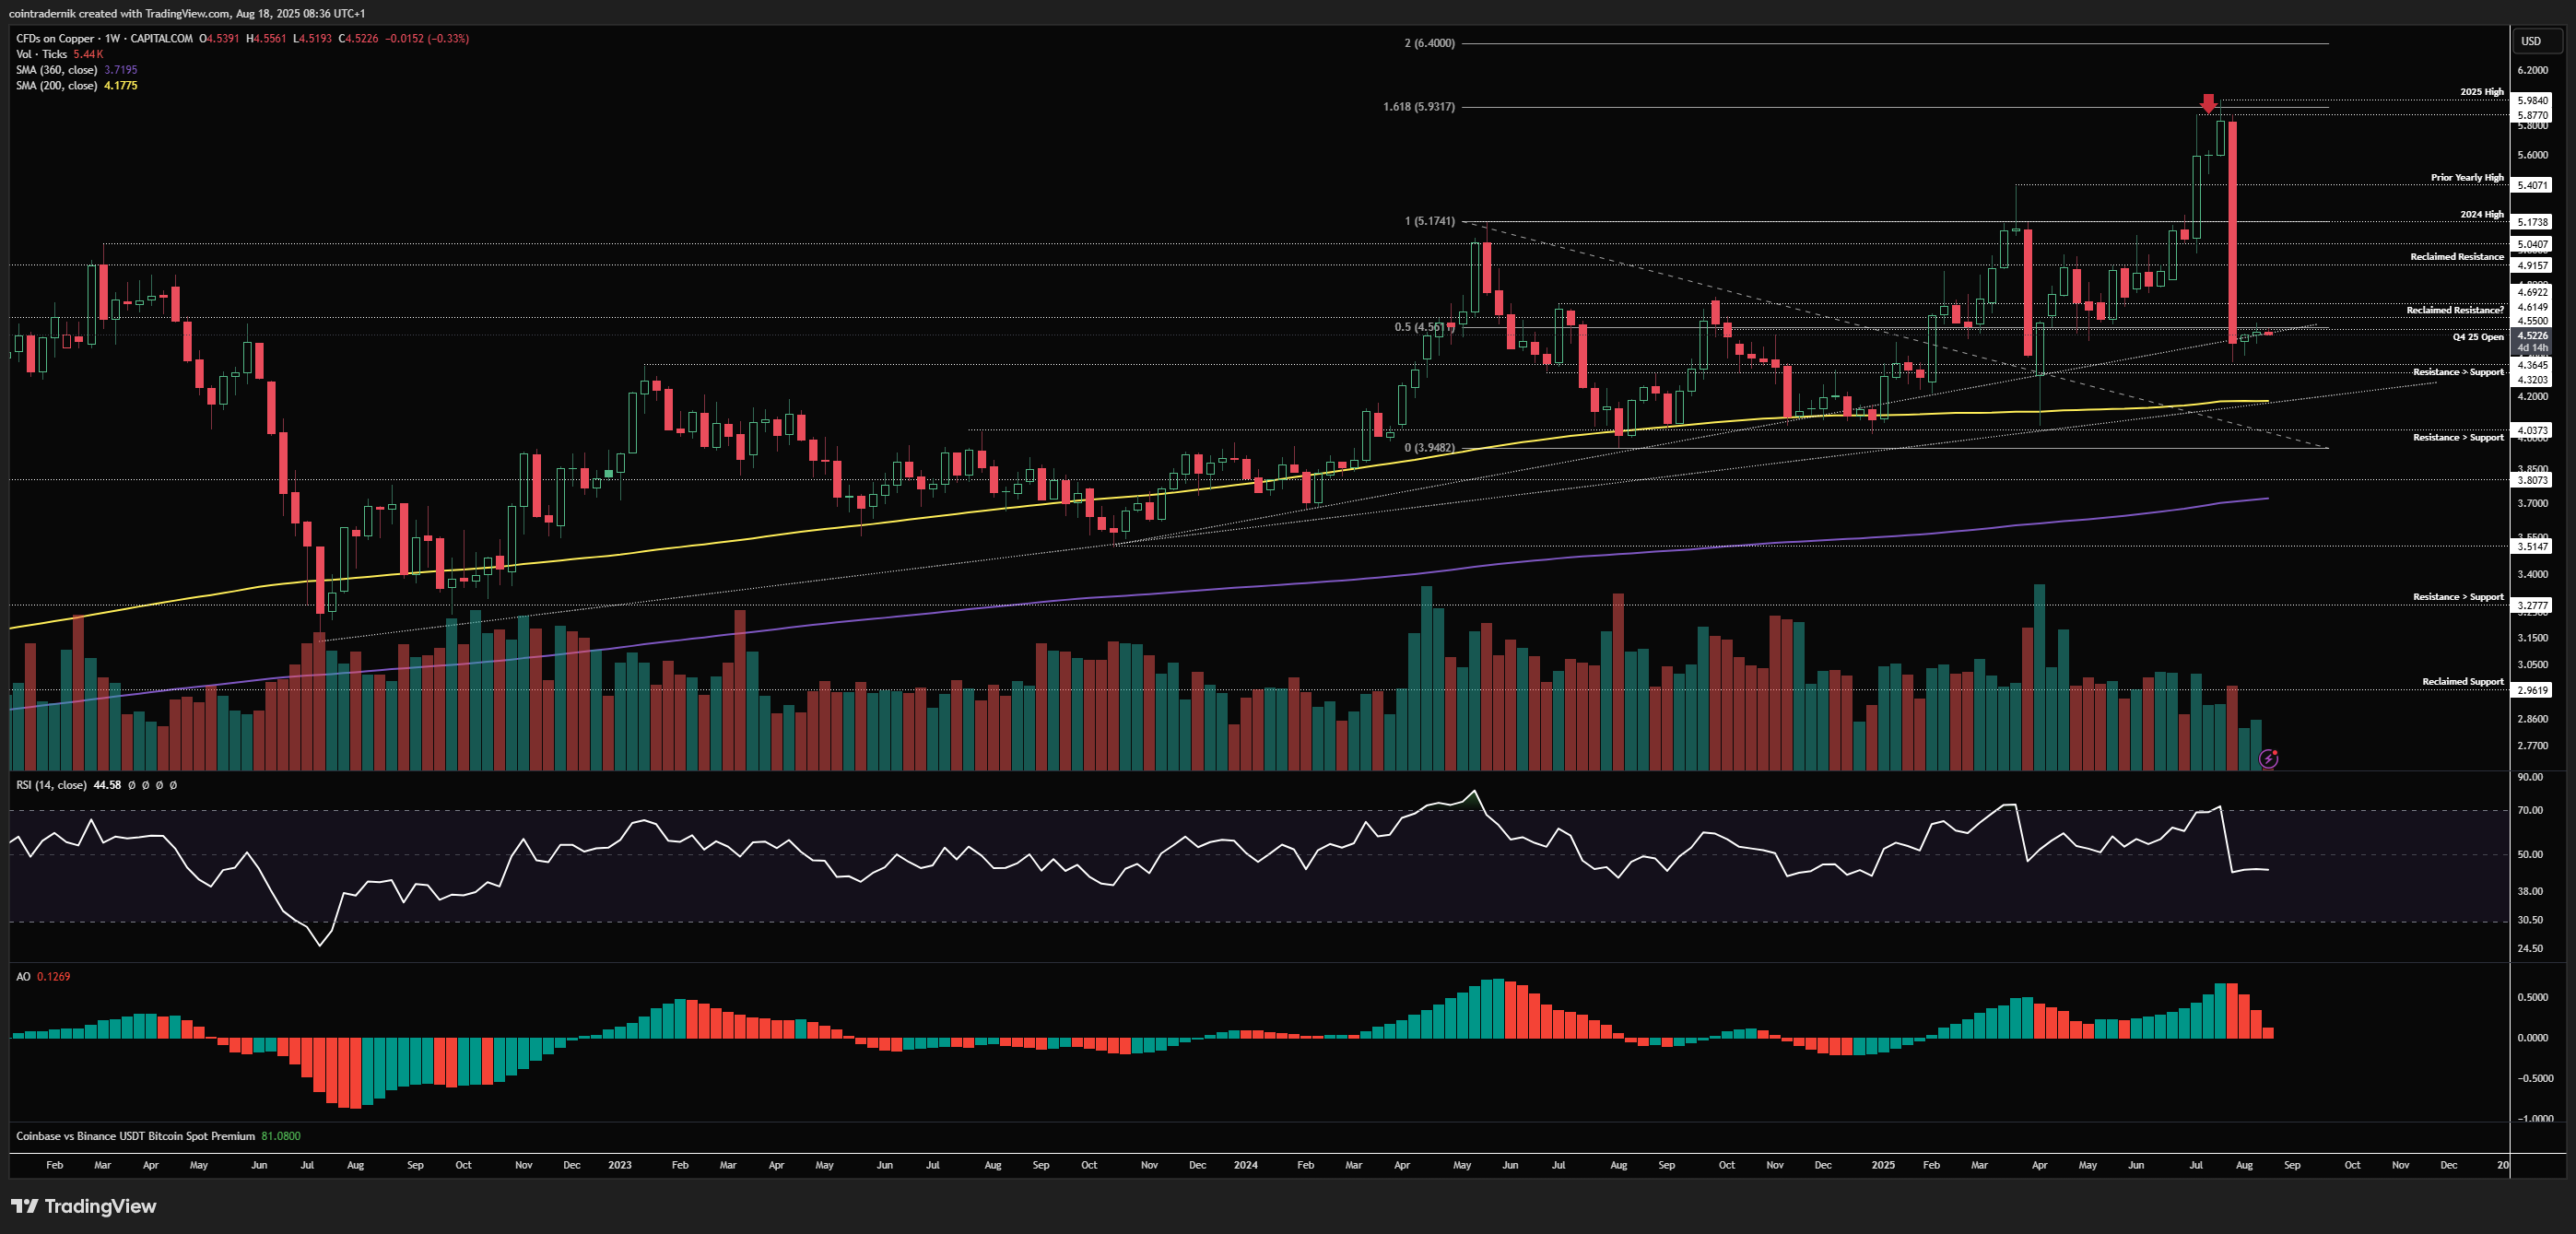
Copper has had one of the craziest years of volatility in quite some time, with price recently tagging our 1.618 extension target at $5.93 before rug-pulling in an even more brutal manner than the Liberation Day price-action after recent tariff exclusions around Copper. This led to the entire post-Liberation Day rally being reversed in a single weekly candle back into multi-year support above $4.32, and despite all of this Copper continues to trade within a longer-term uptrend with higher-lows and higher-highs. Given where we are in the broader global manufacturing cycle, and where it is likely we see inflation in 2026, I think it is unlikely the Copper bull market has ended, but I would not look to blindly buy right here, rather awaiting more structure to develop on the lower timeframes before looking for an entry. I continue to expect Copper to trade towards $6.40 going into Q1 2026 and unless we close below $4 market structure looks absolutely fine.
Daily:
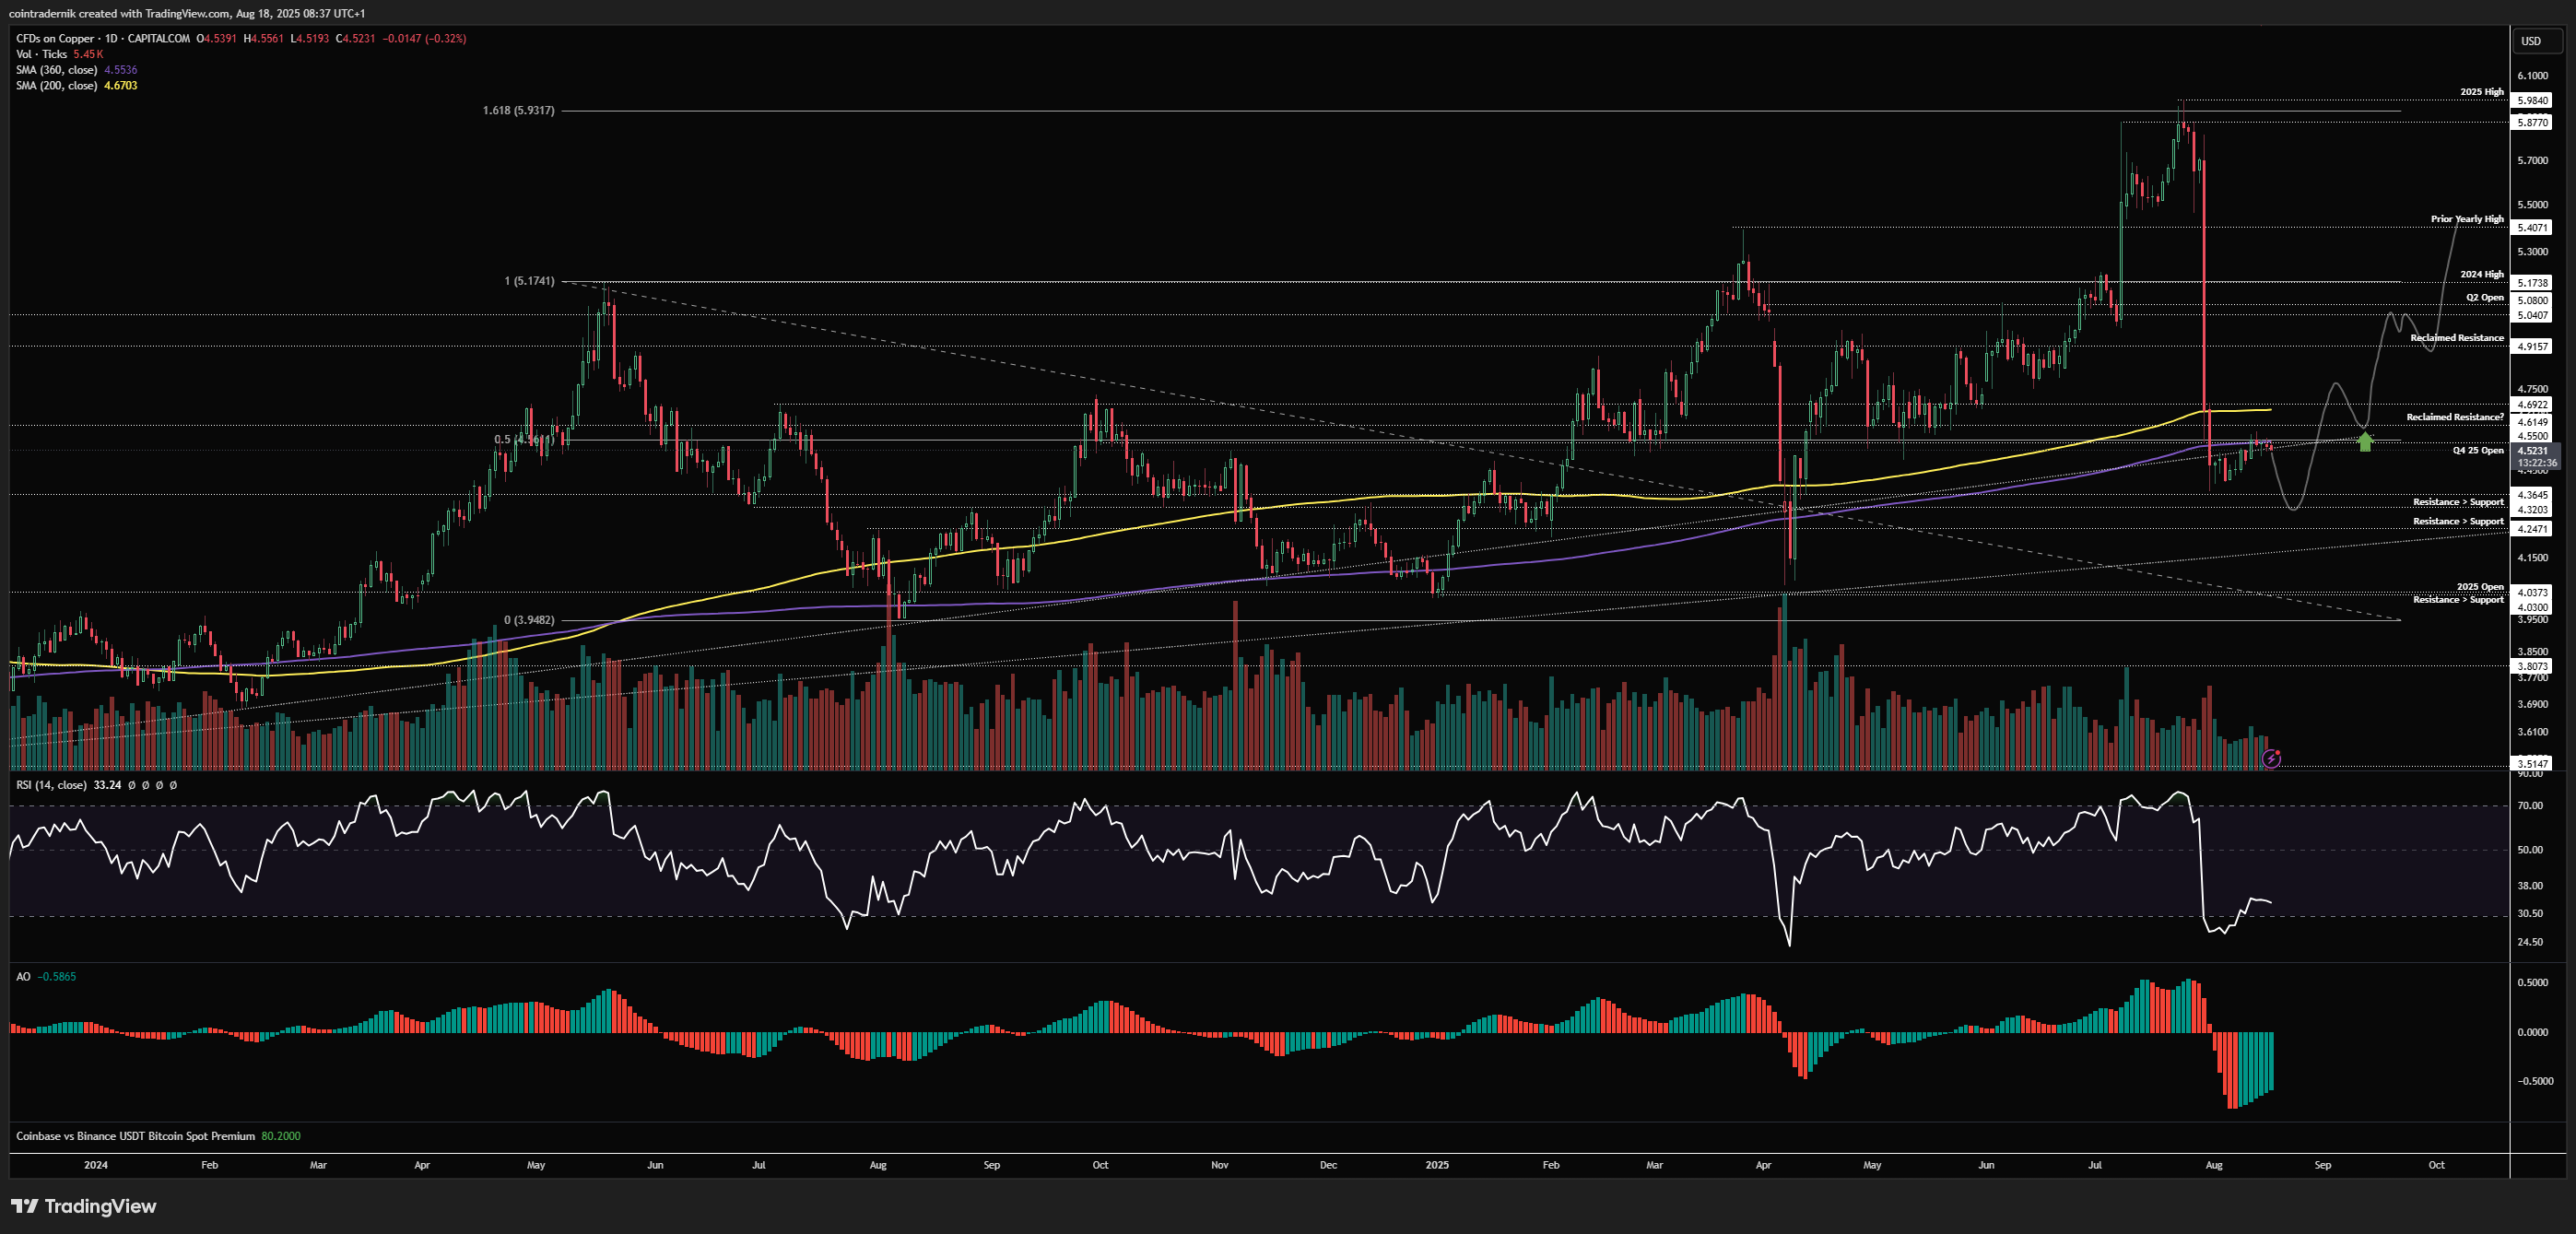
Looking at the daily, what we would want to see for an entry is the recent lows to be swept into demand and price to then rally out of that $4.30 area back above the 360dMA and 200dMA, through $4.70 turning daily structure bullish. We could then look for entries on any pullbacks into that zone with invalidation below $4.25 and looking for continuation of the longer-term uptrend back towards the yearly highs. As mentioned above, the higher timeframe bias for Copper only shifts if $4 turns resistance. Nothing else to add here for now but let's see how structure develops into September.
Price: $61.97
Weekly:
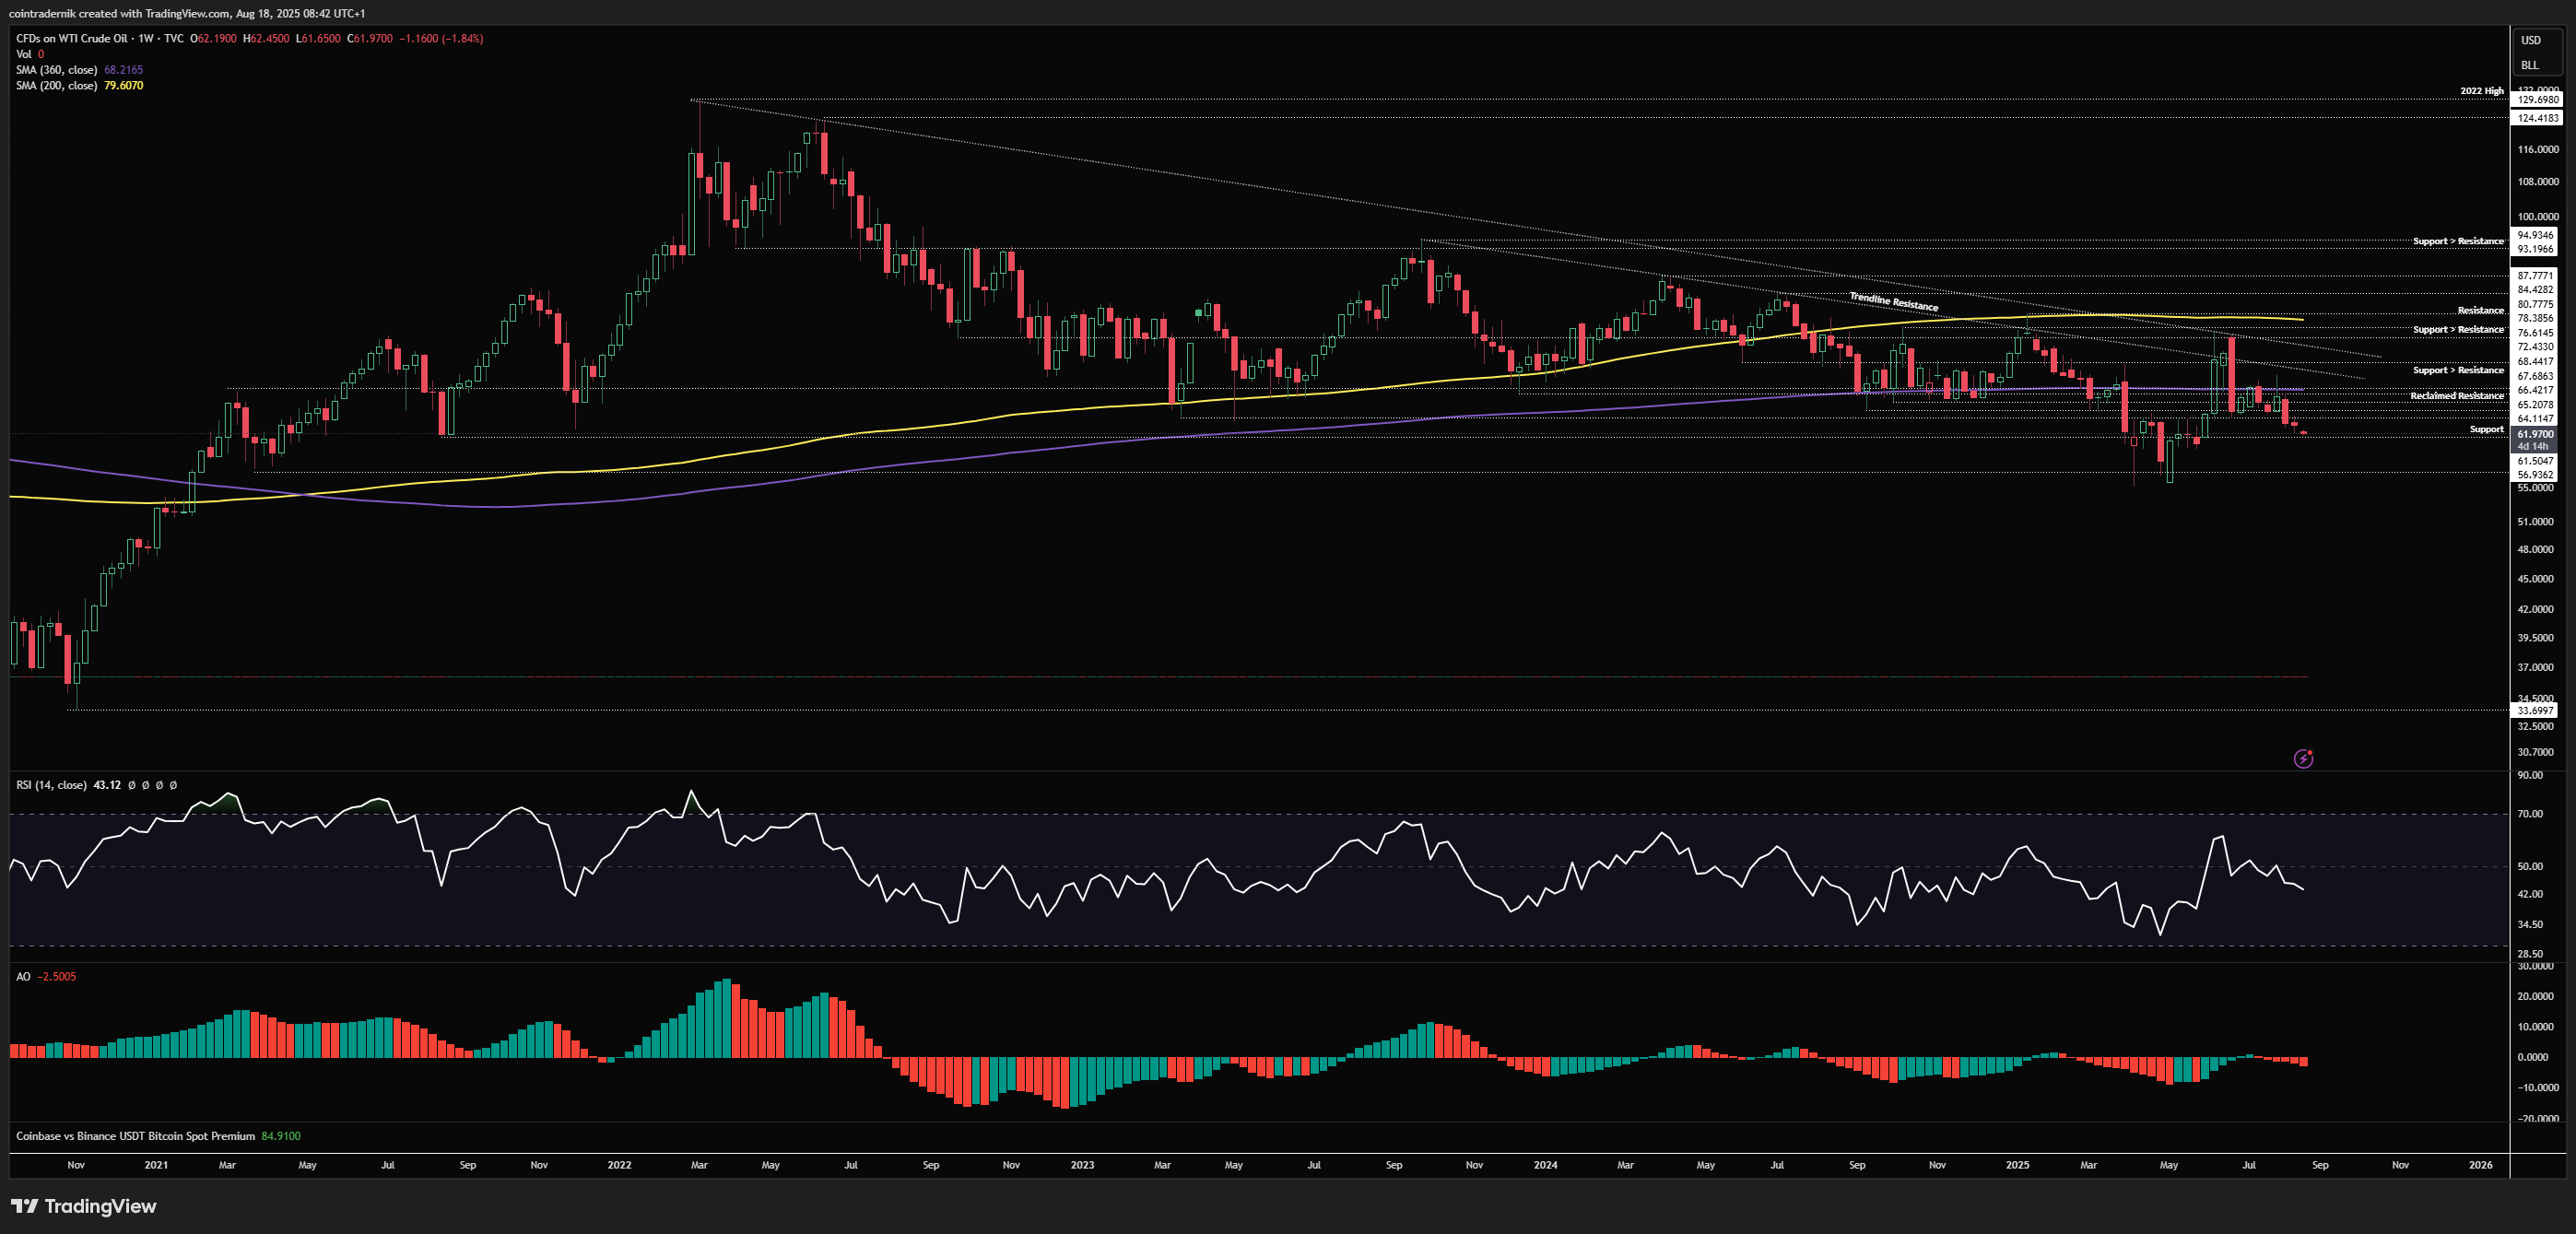
Looking at Crude Oil on the weekly, we can see that the longer-term trendline resistance continues to cap the rallies, with price rejecting a retest of that lower trend a few weeks ago and now pushing lower, extending below $64 local support into $61.50 support here, above which it is sat. This is the last major support before a return to the yearly lows around $57 - an area of demand that has held since 2021. I would expect to see continued chop here to be honest, with price likely to form a higher-low above $57 and then look to move higher again for another test of the 360wMA and cluster of resistance around $66-68. A clean break and acceptance below $57 = the beginning of a new downtrend that I would not be looking to fade.
Daily:
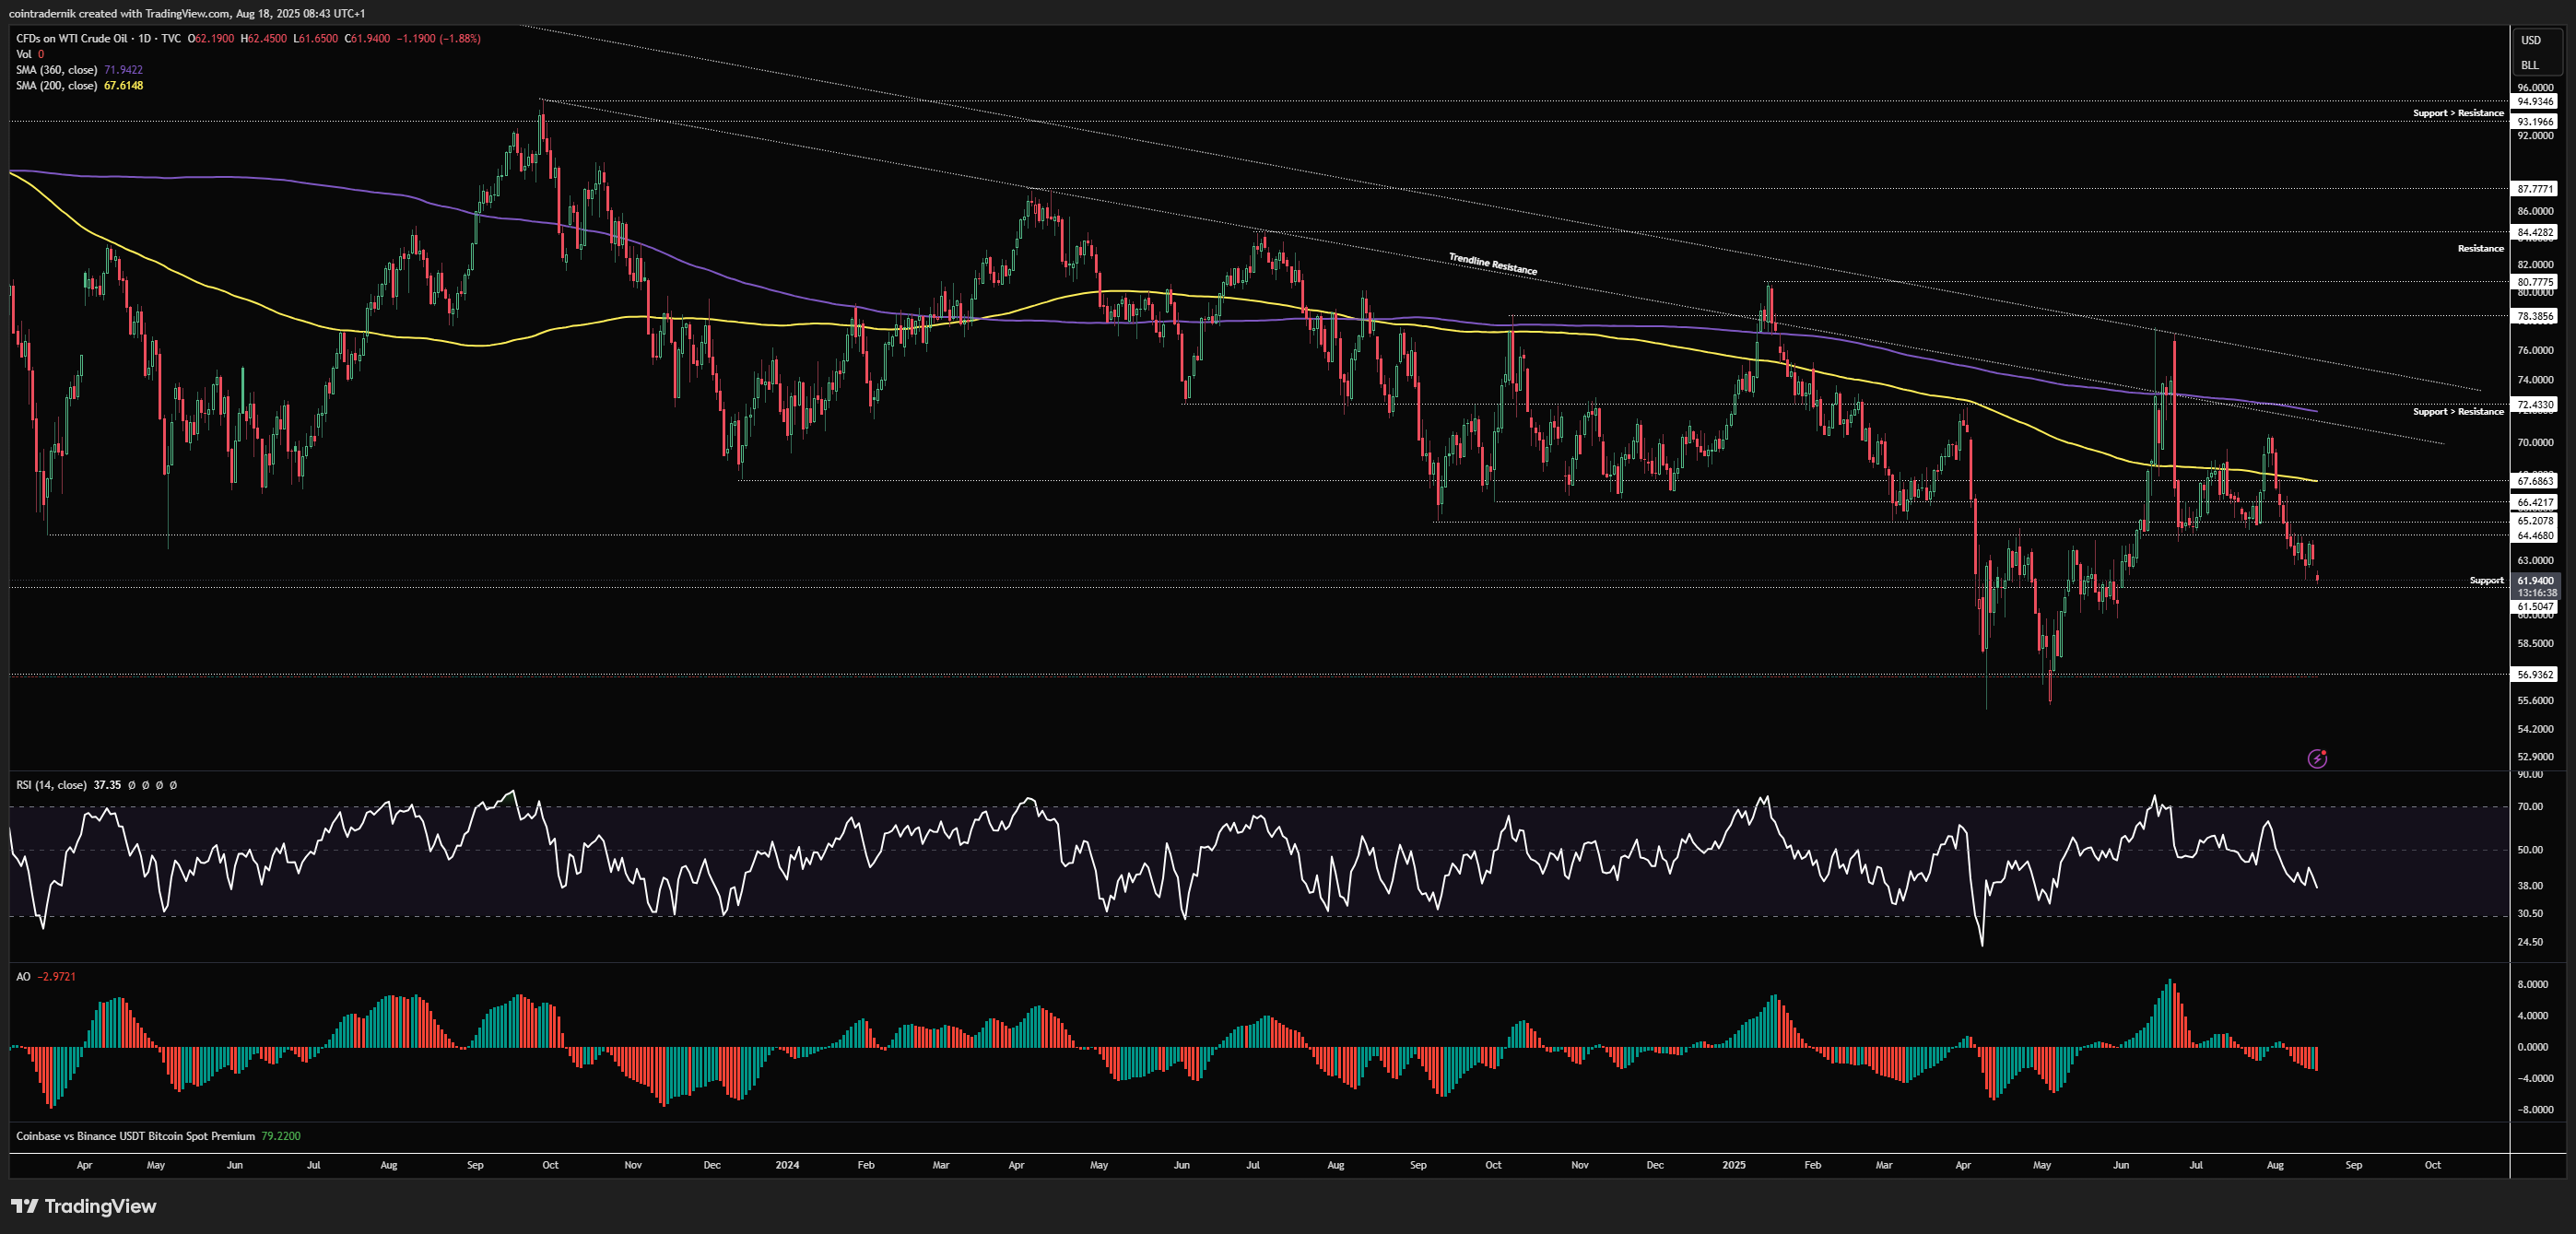
Finally, looking at the daily, we can see that price deviated above the 200dMA but got slapped back down as expected, and this is precisely the trend I expect to continue into Q4, with rallies turning into fakeouts before price returns to long-term support. The only thing that would change this view beyond that $57 breakdown would be for price to flip the lower trendline resistance and 360dMA into support above $72.40, where we could then look for longs into $78. Ultimately, given the administration in power, I think it is extremely unlikely Oil is allowed to push through this multi-year trendline resistance, so rallies should continue to be faded when the opportunities arise.
I hope you've found some value in the read this week!
And if you've not already signed up for Ostium, please do so and test out some of the recent updates, including:
Sign up here (you don't have to use my ref link, of course): https://ostium.app/trade?from=CL&to=USD&ref=PRIRP

.avif)