

Market Outlook #46
August 11, 2025
-
12
min read


This blog references an opinion and is for entertainment and informational purposes only. It is not intended to be investment advice. Seek a duly licensed professional for investment advice.
In this 46th Market Outlook here at Ostium Research, we'll be taking a look at the week ahead in markets, focusing specifically on price-action, positioning and event risk for Bitcoin, Ethereum, Gold, SPX and altcoins.
Firstly, let's take a look at the moderately busy calendar for the week ahead:
TUESDAY: RBA INTEREST RATE DECISION: (CONSENSUS 3.6% VS PREVIOUS 3.85%)
TUESDAY: US CONSUMER PRICE INDEX (YOY) (JUL): (CONSENSUS 2.8% VS PREVIOUS 2.7%)
TUESDAY: US CONSUMER PRICE INDEX EX FOOD & ENERGY (YOY) (JUL): (CONSENSUS 3% VS PREVIOUS 2.9%)
TUESDAY/WEDNESDAY: VARIOUS FED SPEECHES
THURSDAY: US INITIAL JOBLESS CLAIMS: (CONSENSUS 227K VS PREVIOUS 226K)
THURSDAY: US PRODUCER PRICE INDEX EX FOOD & ENERGY (YOY) (JUL): (CONSENSUS N/A VS PREVIOUS 2.6%)
FRIDAY: US NY EMPIRE STATE MANUFACTURING INDEX (AUG): (CONSENSUS -1 VS PREVIOUS 5.5)
FRIDAY: US RETAIL SALES (MOM) (JUL): (CONSENSUS 0.5% VS PREVIOUS 0.6%)
Now, let's dig into asset-specific price-action for the week ahead, looking firstly at Bitcoin:
Price: $122,193
Weekly:
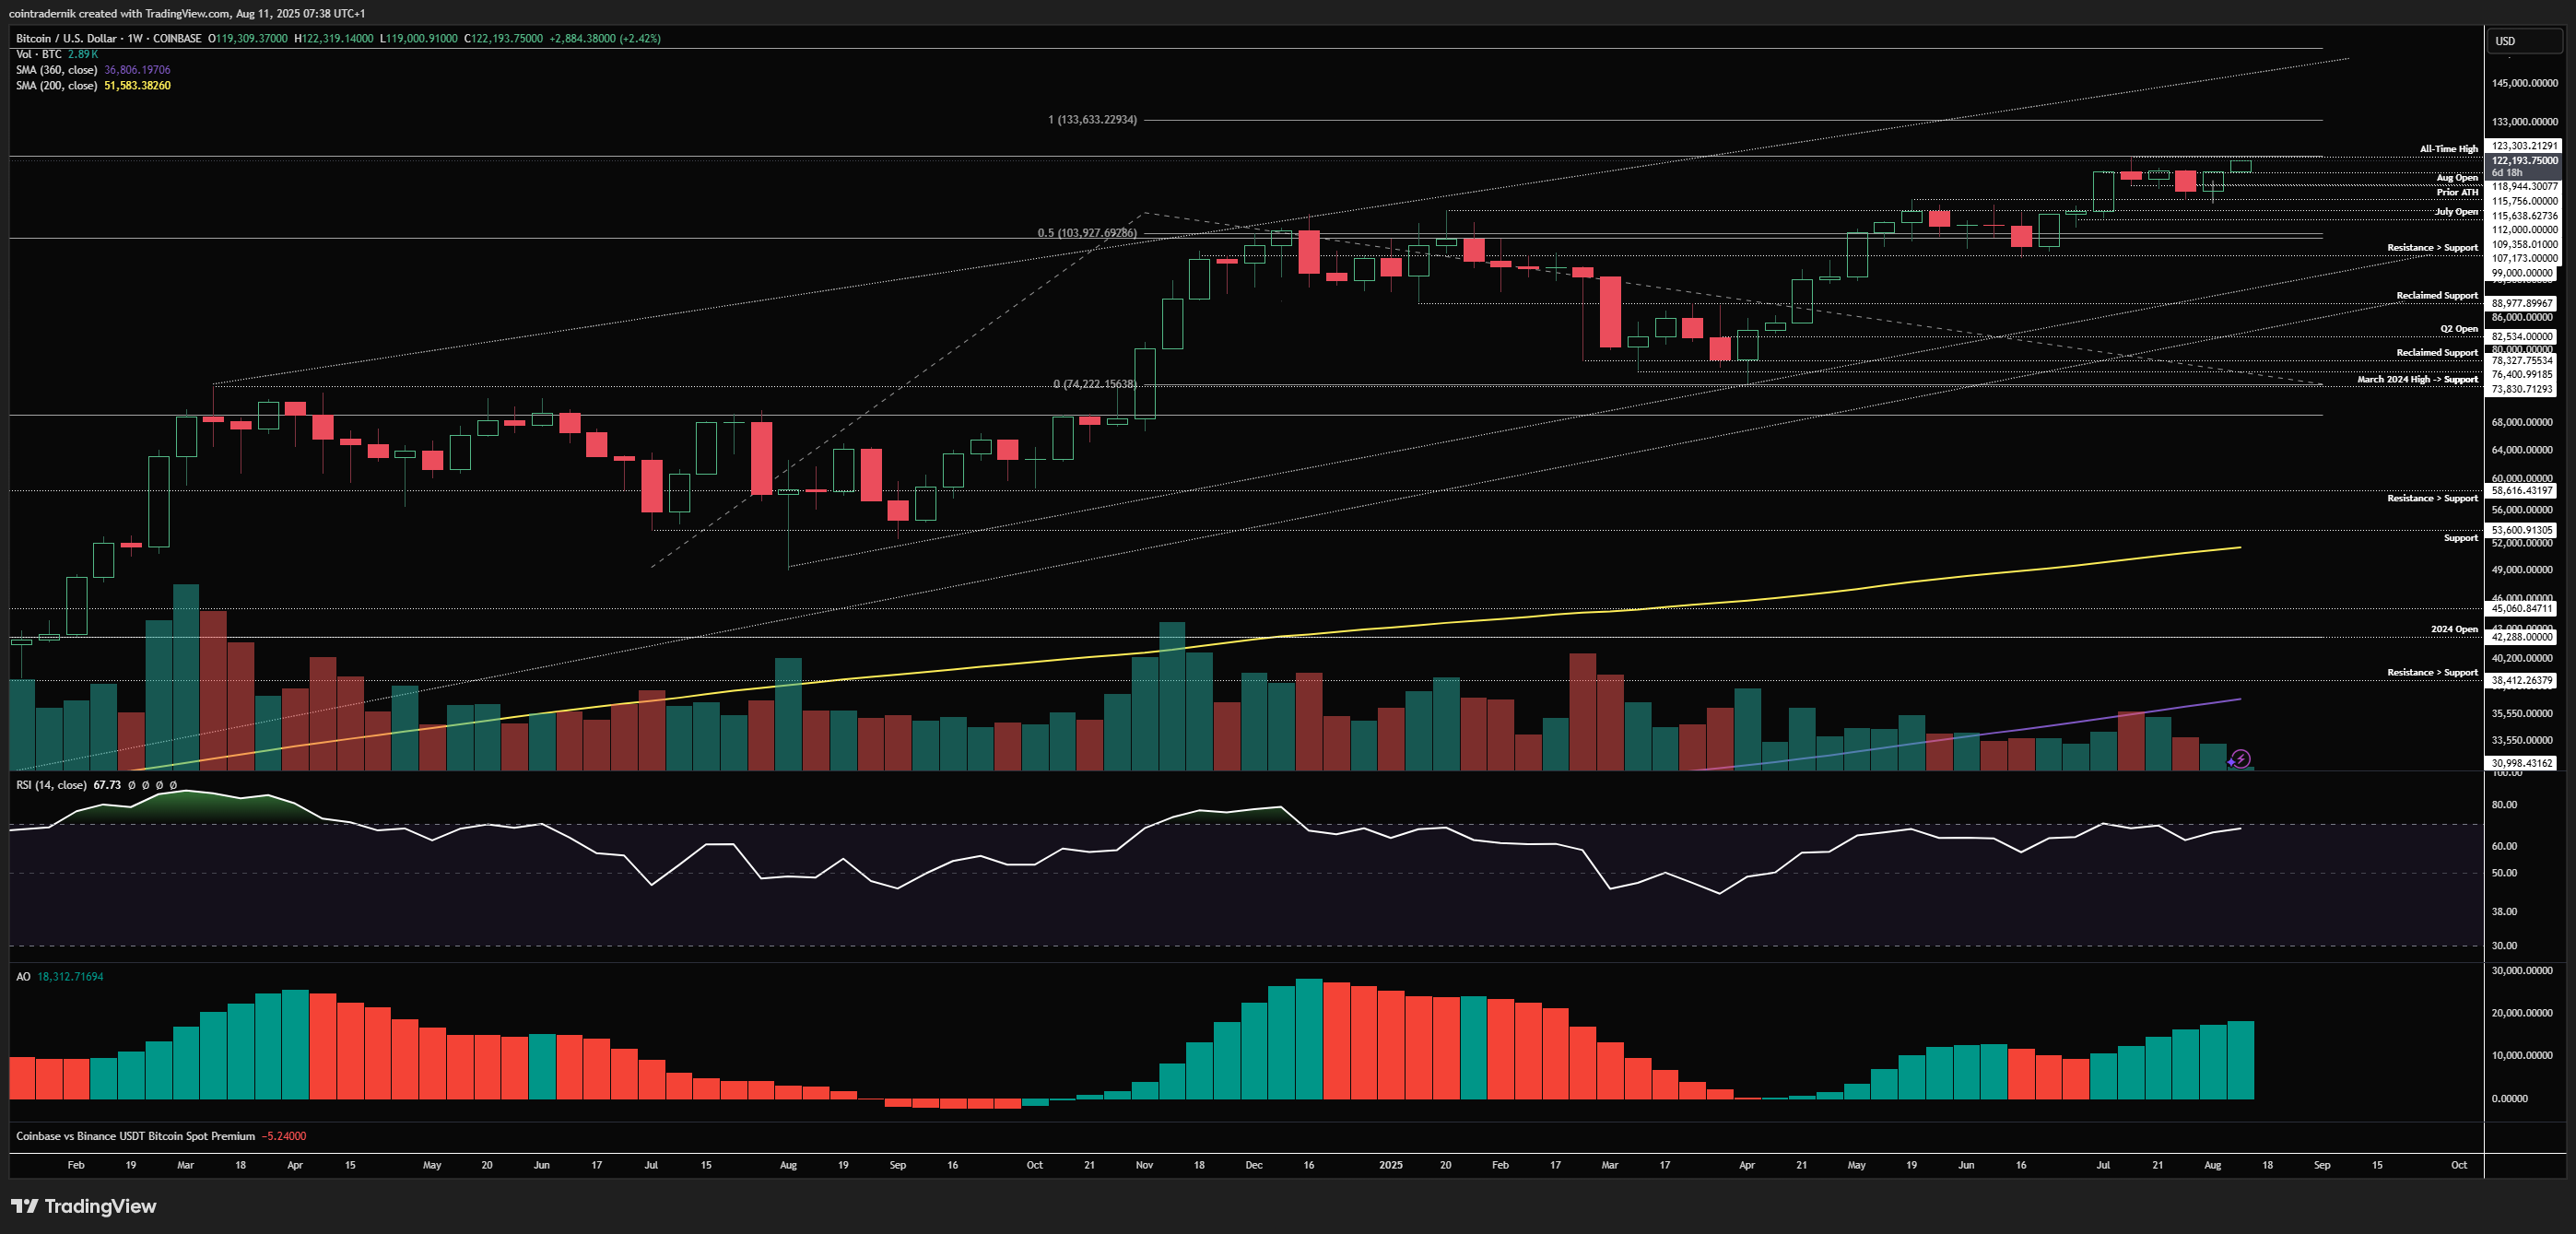
If we begin by looking at BTC/USD on the weekly timeframe, we can see that last week saw price bounce off the weekly open, retesting prior all-time highs above $112k as support and rallying all the way into the second-highest weekly close of all time at $119.3k, though volume is falling here. Momentum is however continuing to tick higher and any acceptance this week above $119.4k would open up the next leg higher for Bitcoin, with $133.6k as the next level of interest on this timeframe. Reject at these highs and close the week back below the August open at $115.6k and things look more short-term bearish, with the expectation then that we would take out the lows around $112k and go for that flush into the July open at $107.2k. This is very much the bear's last stand here around these highs.
Daily:
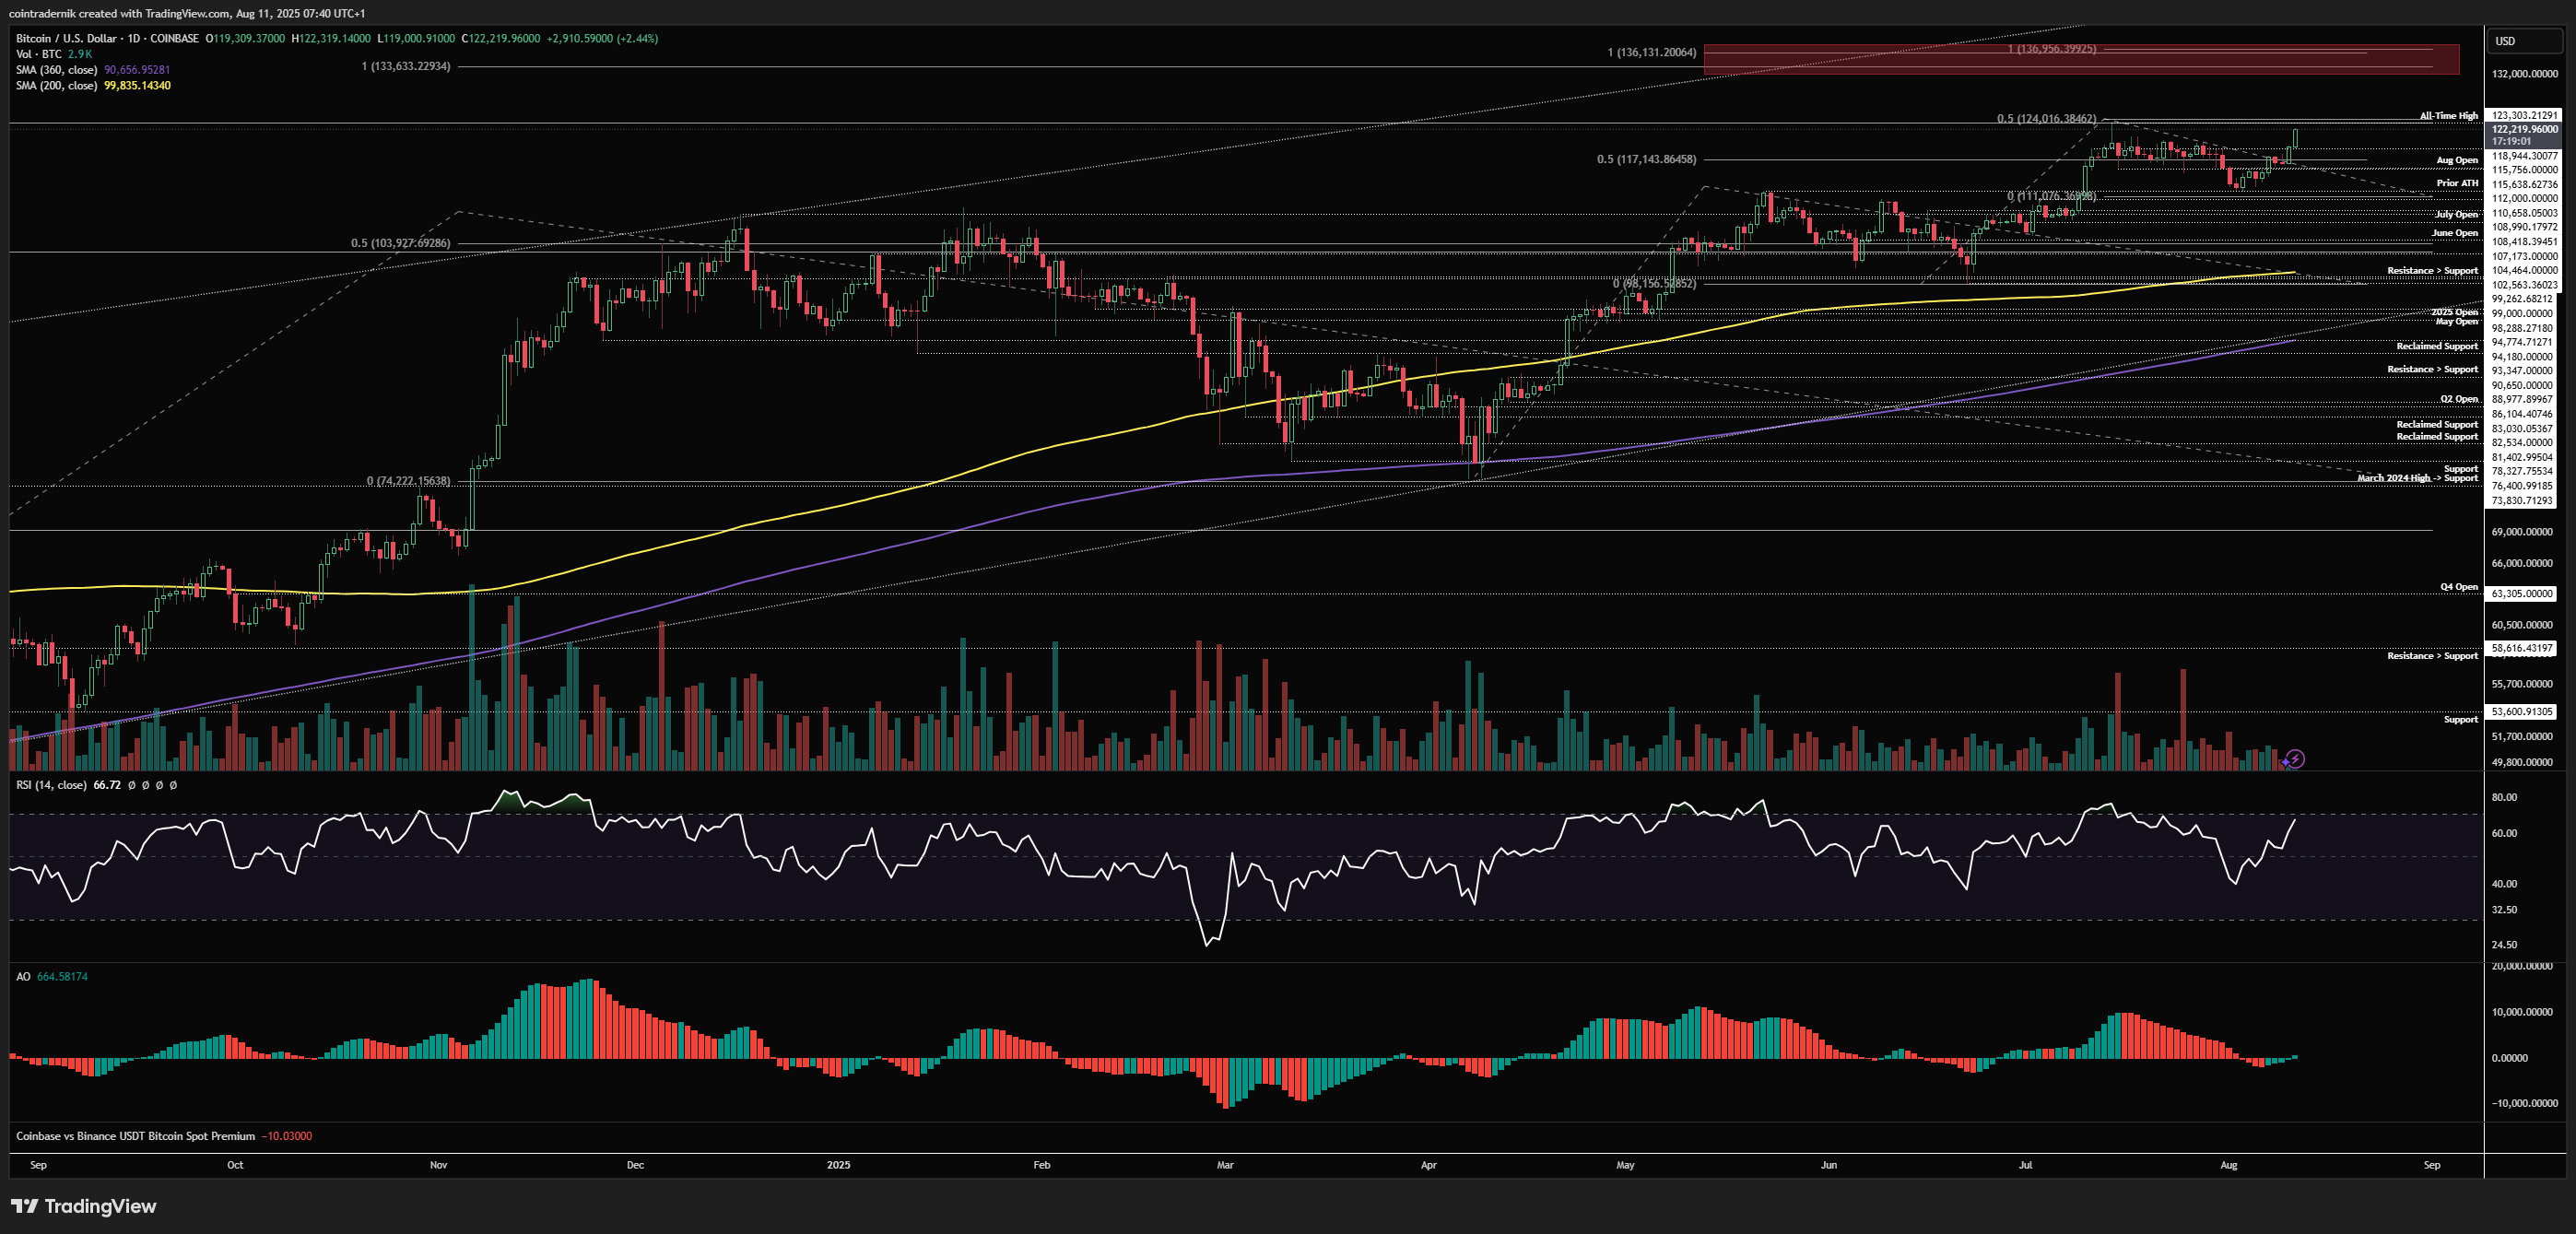
Dropping into the daily, we can see structure looks great, with price bouncing off prior highs and reclaiming the August open and local range support before pushing higher, having reset daily momentum with plenty of space for continuation higher now. As of this morning, we have pushed through $119k resistance and are sat a thousand dollars below fresh all-time highs, and depending on how this day shapes up we could see an all-time high daily close. This very much continues to look like a clean uptrend with prior resistance levels continuing to be turned into fresh support. We should see $119k act as support early this week on any pullbacks if we are to expect price discovery, where acceptance above all-time highs will lead to that cluster of fib levels between $133k-$136k being tested. For what it's worth, I would consider any SFP of the highs if it occurs either today or tomorrow to be bait - but if we get a deep wick above $124k and then close the week red, then that would look much worse for prospects of an imminent breakout.
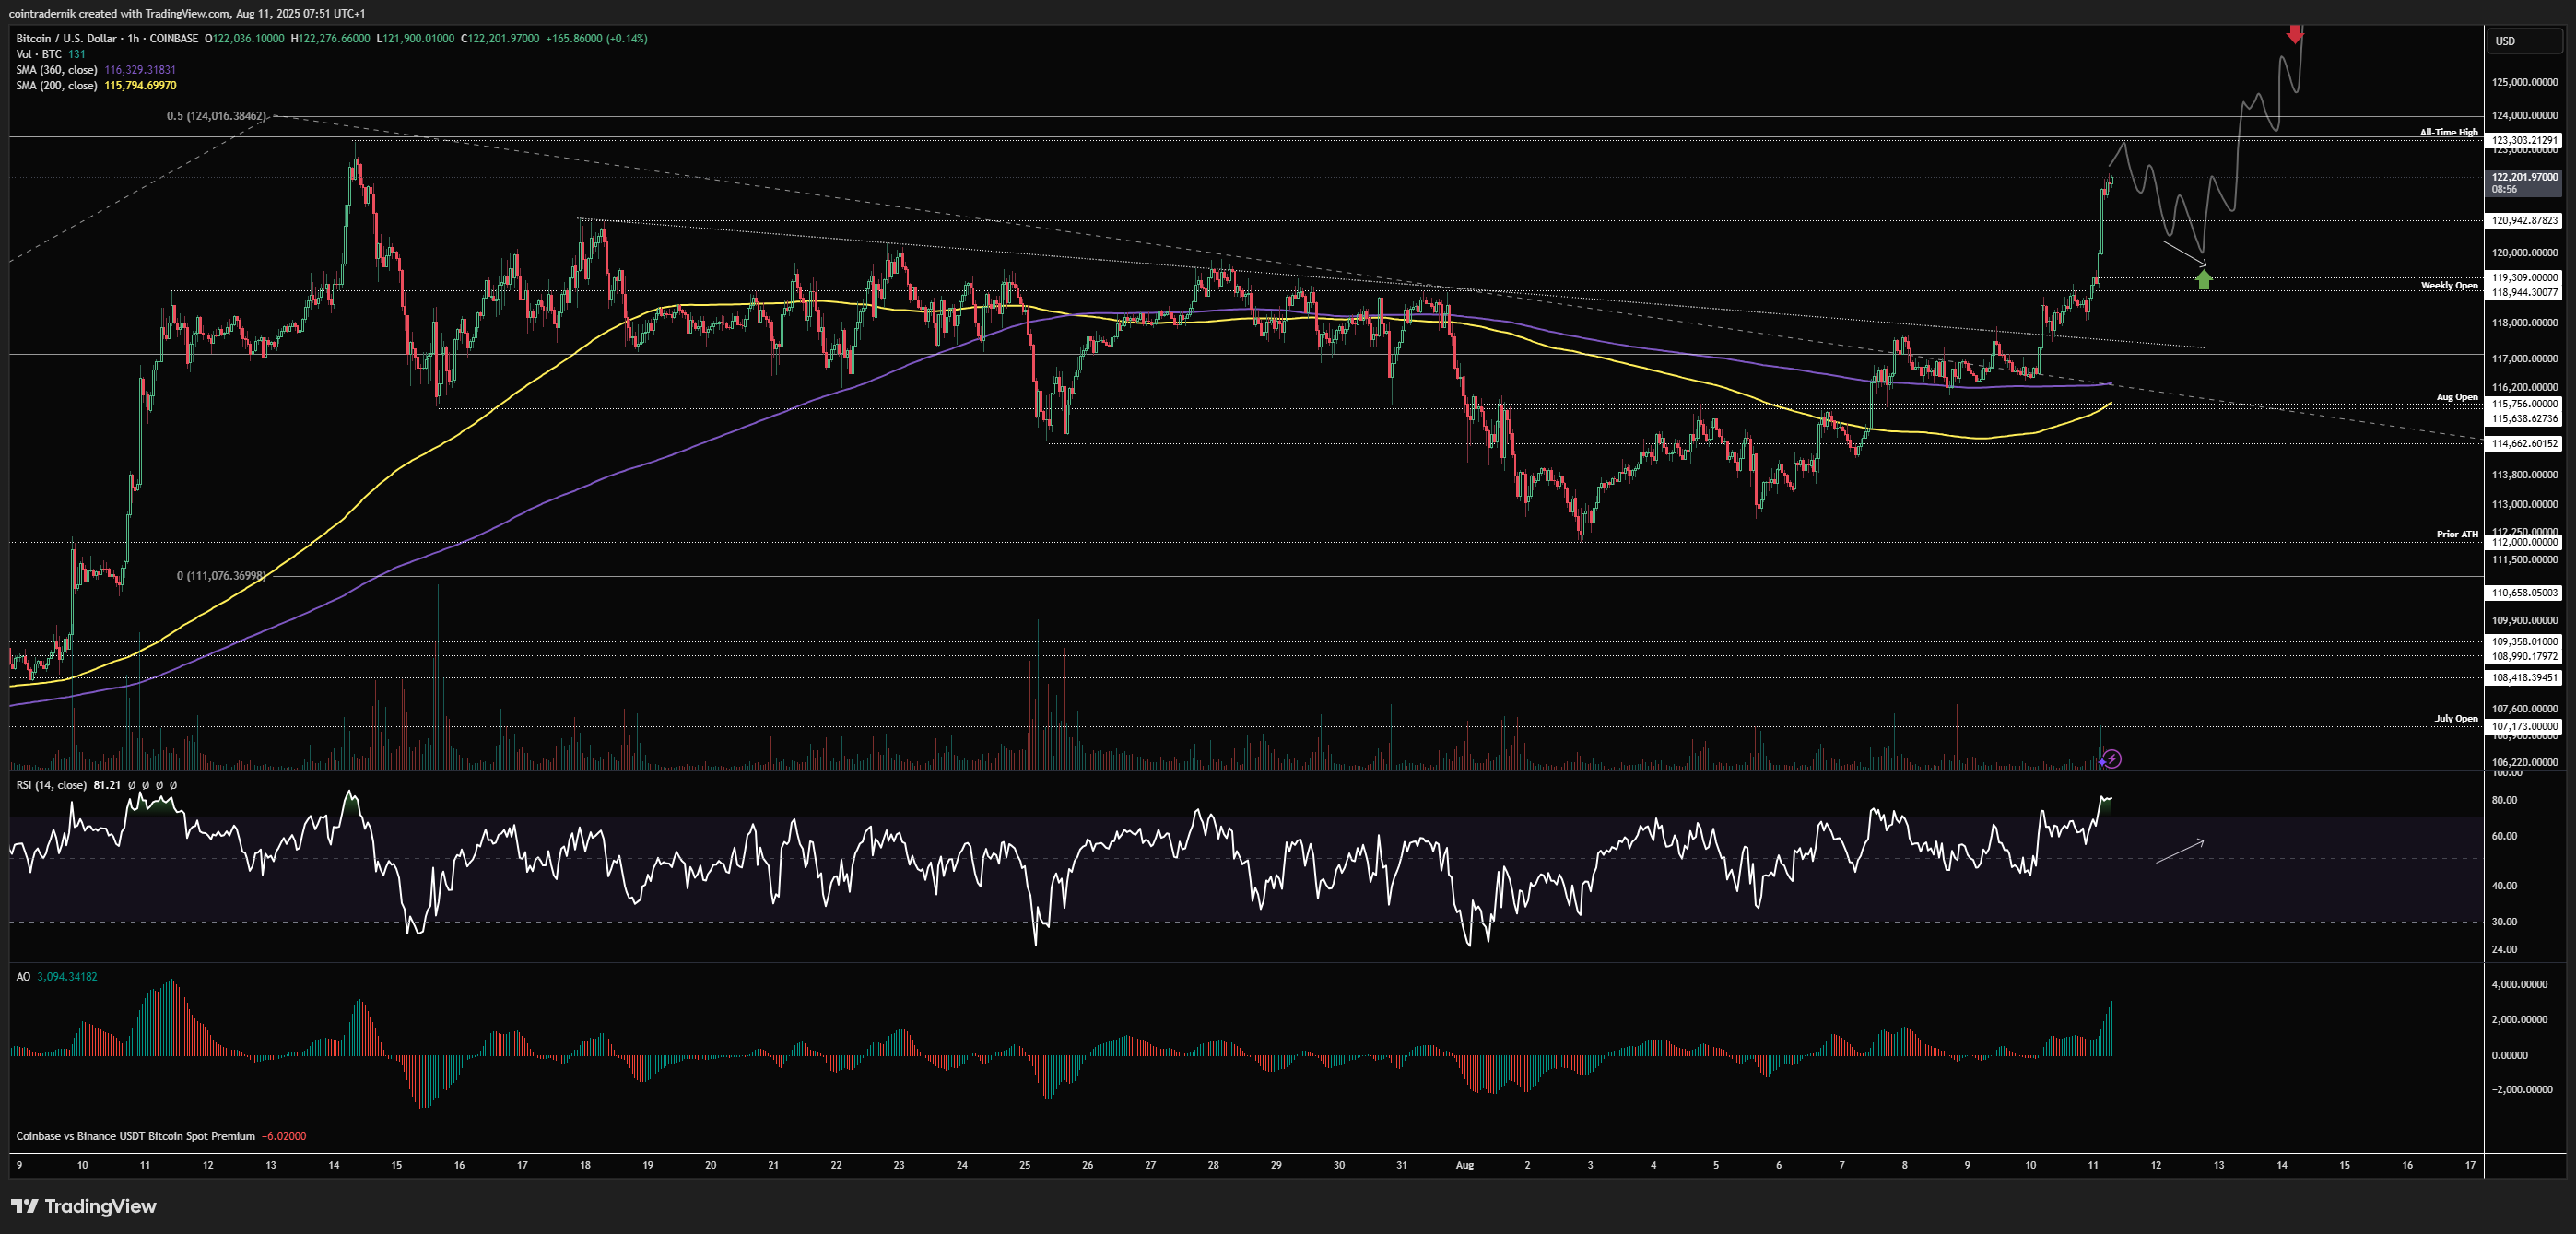
Now, turning to potential setups for the week, if you're sidelined and want a nice long you don't want to see fresh highs today, rather seeing some sort of double top and a flush lower with a higher low forming above the weekly open into tomorrow:
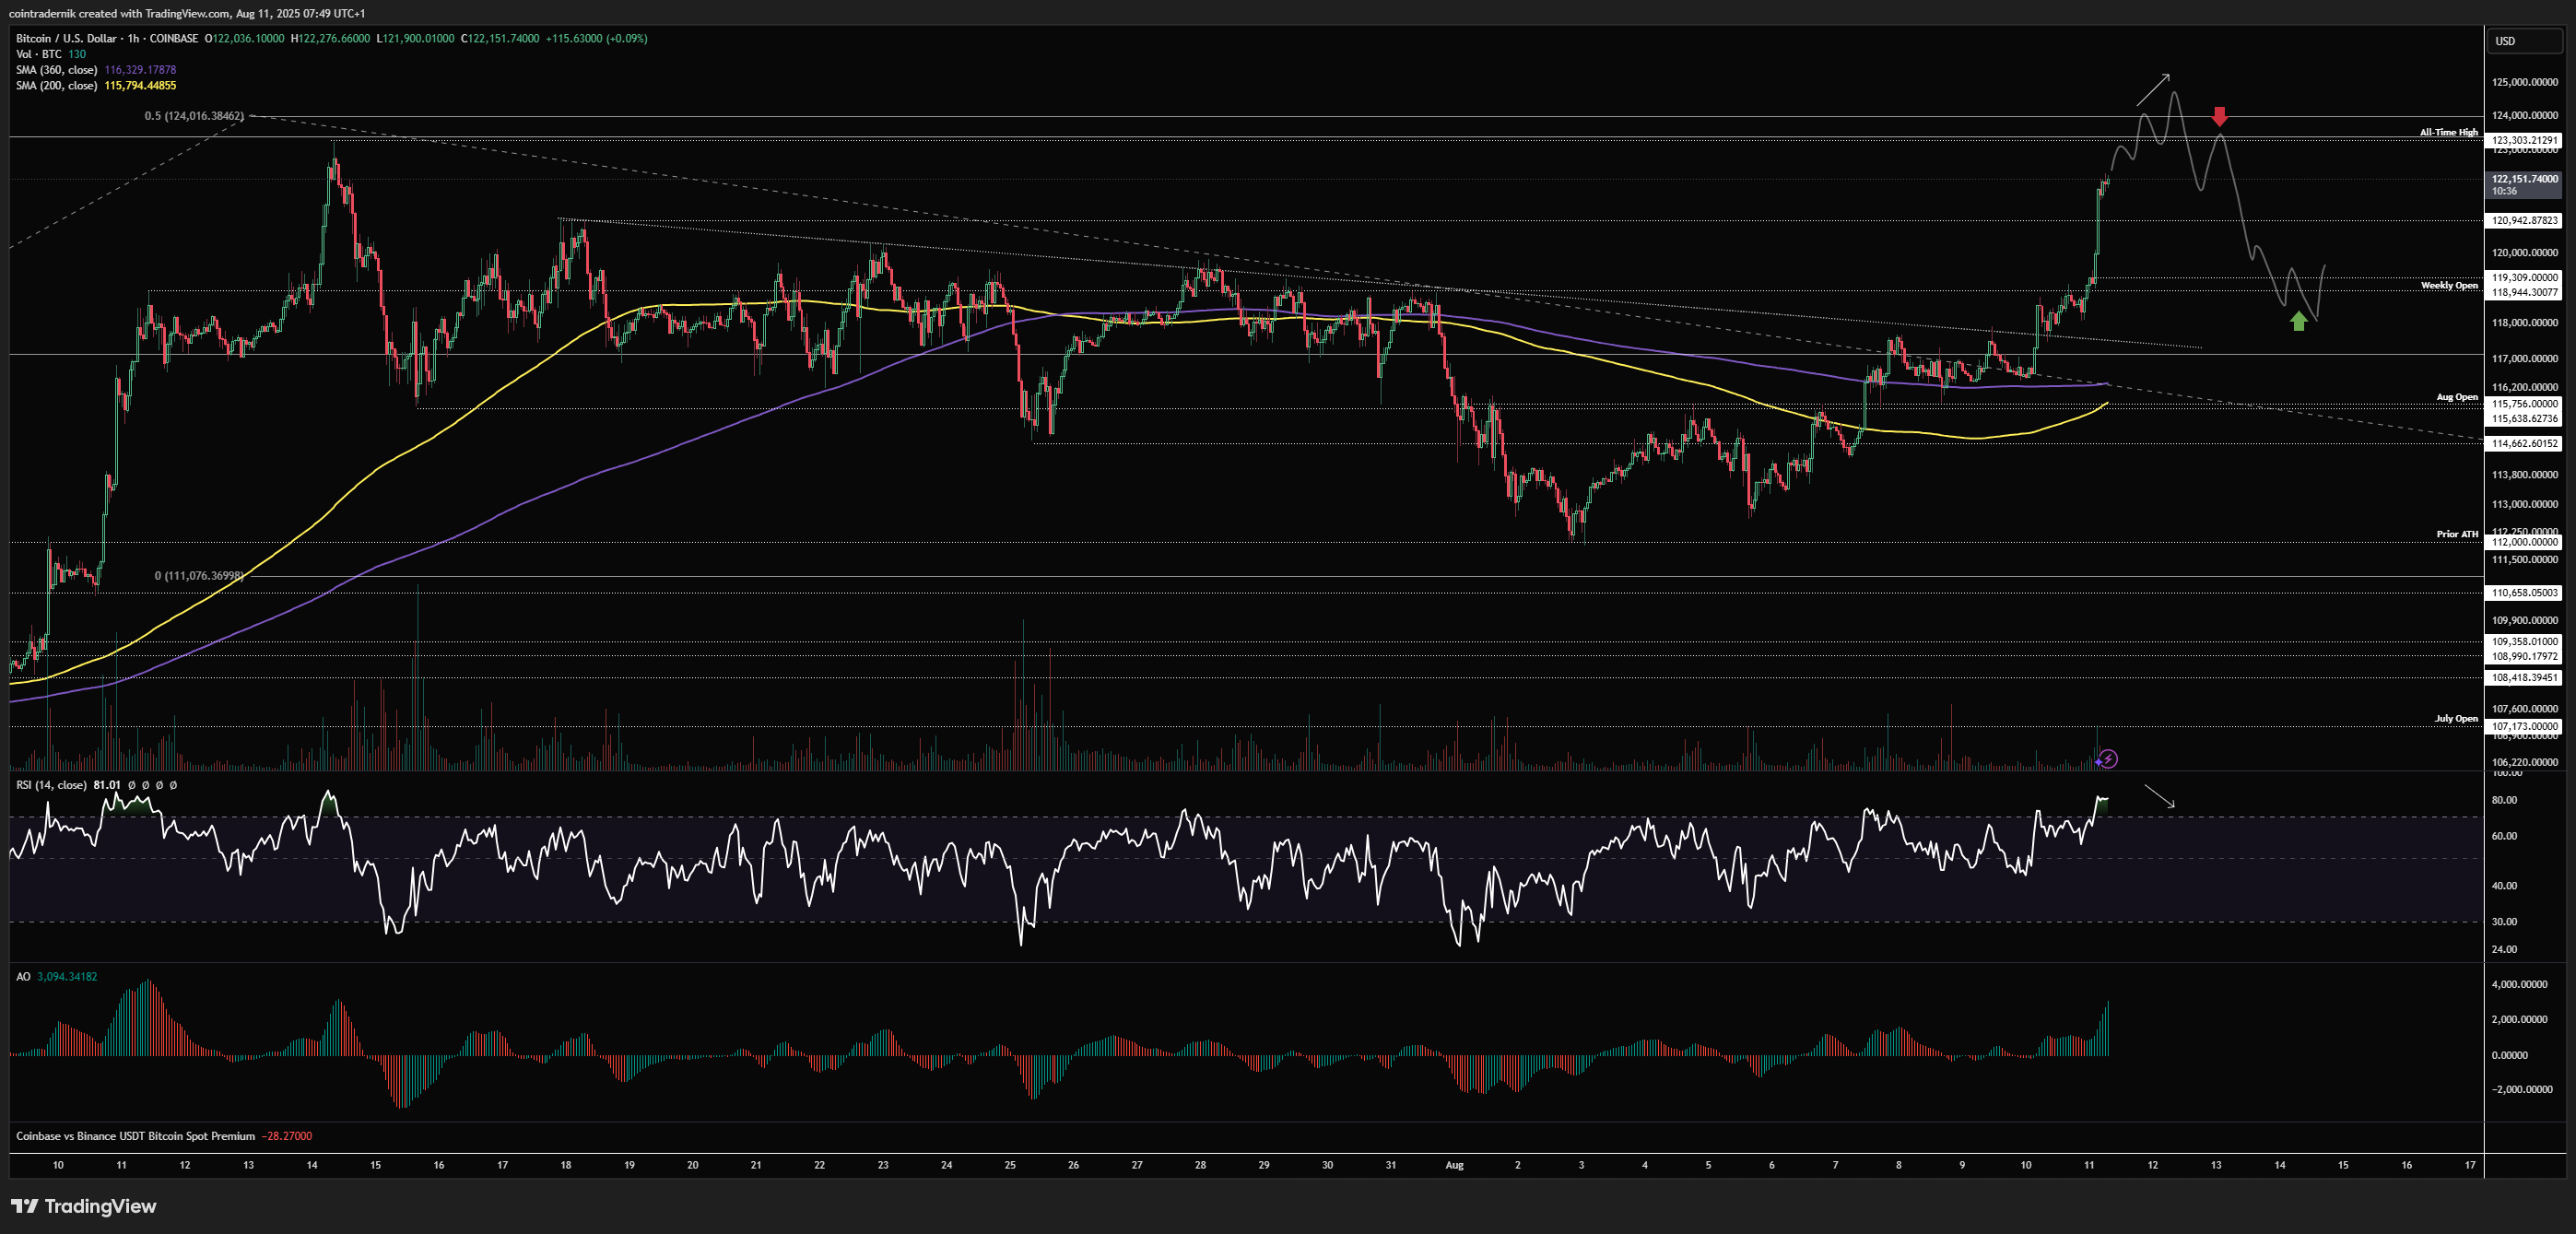
Conversely, if you want to fade this back to the weekly open at $119.3k, you do want to see us push through those highs and form some trend exhaustion up there, then see price break down and $123.3k flip back into resistance. You would then have very clean invalidation on a short back into that weekly open early this week:
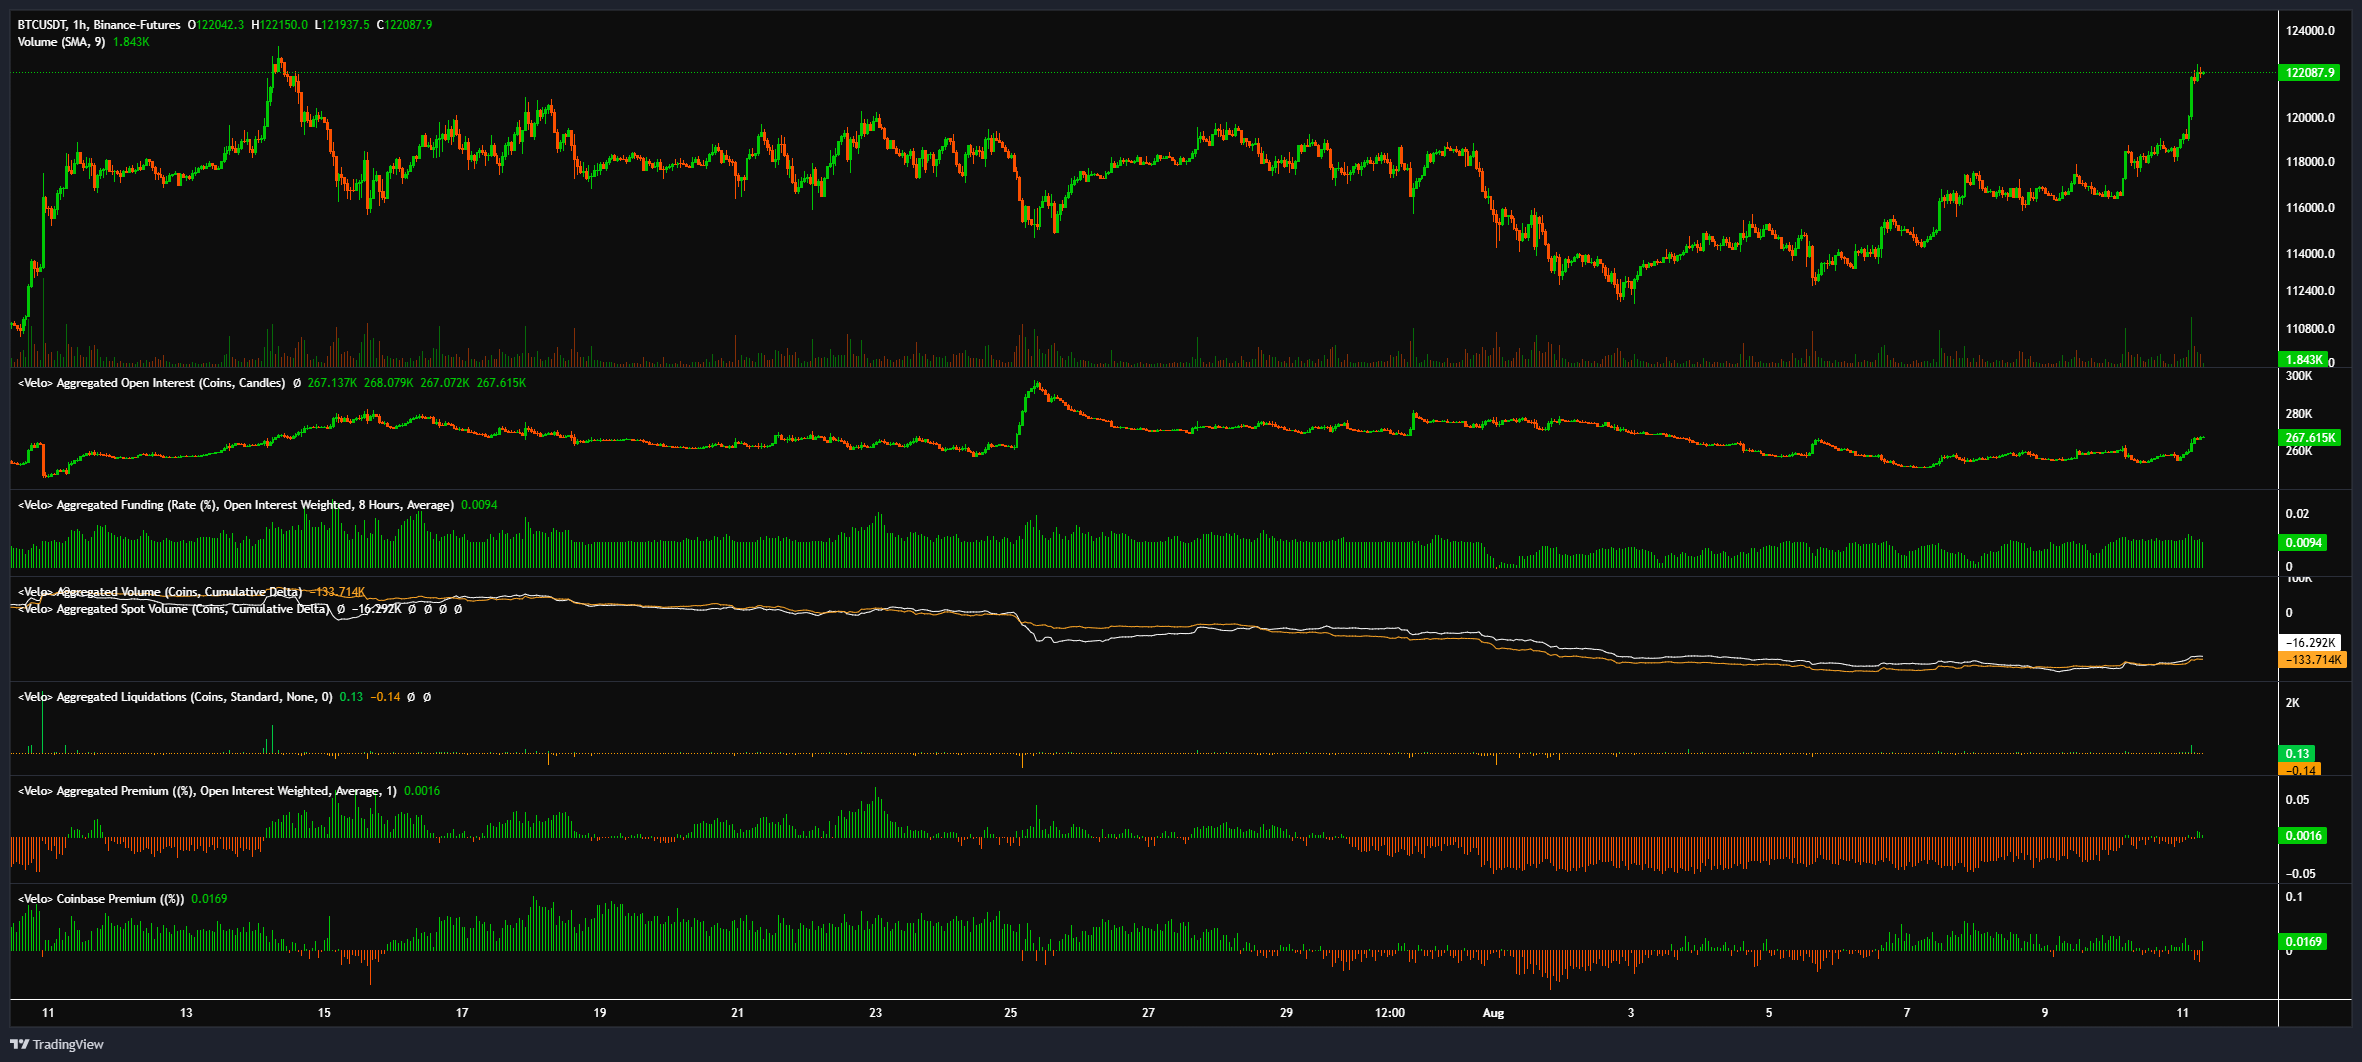
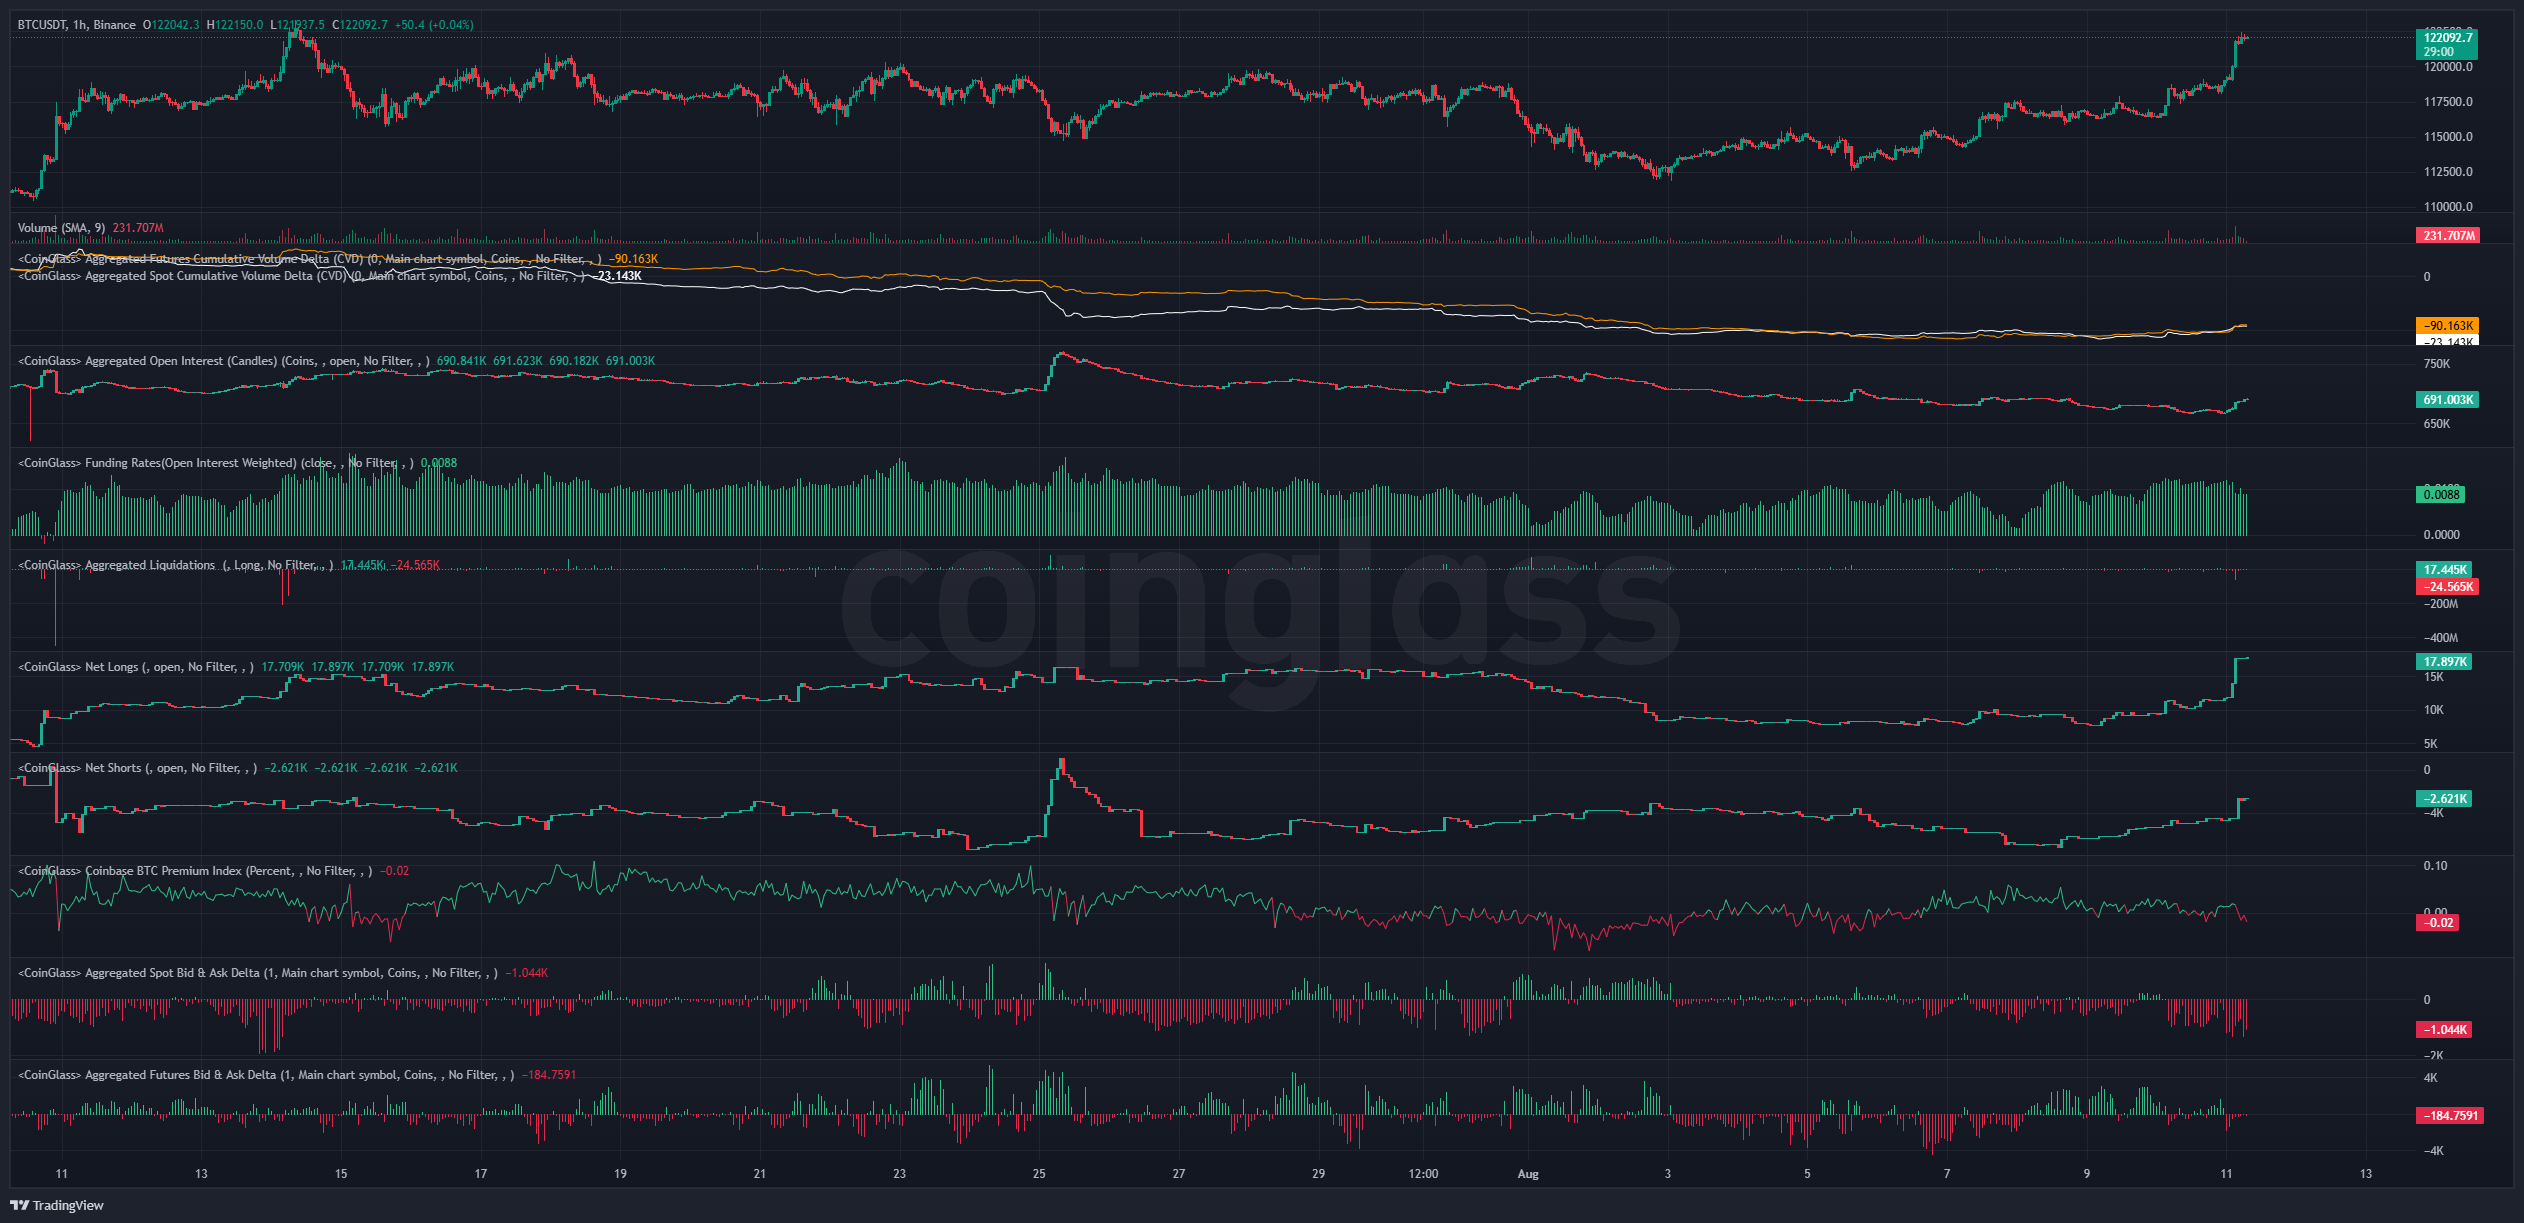
And here's a snapshot of positioning across Velo and CoinGlass:
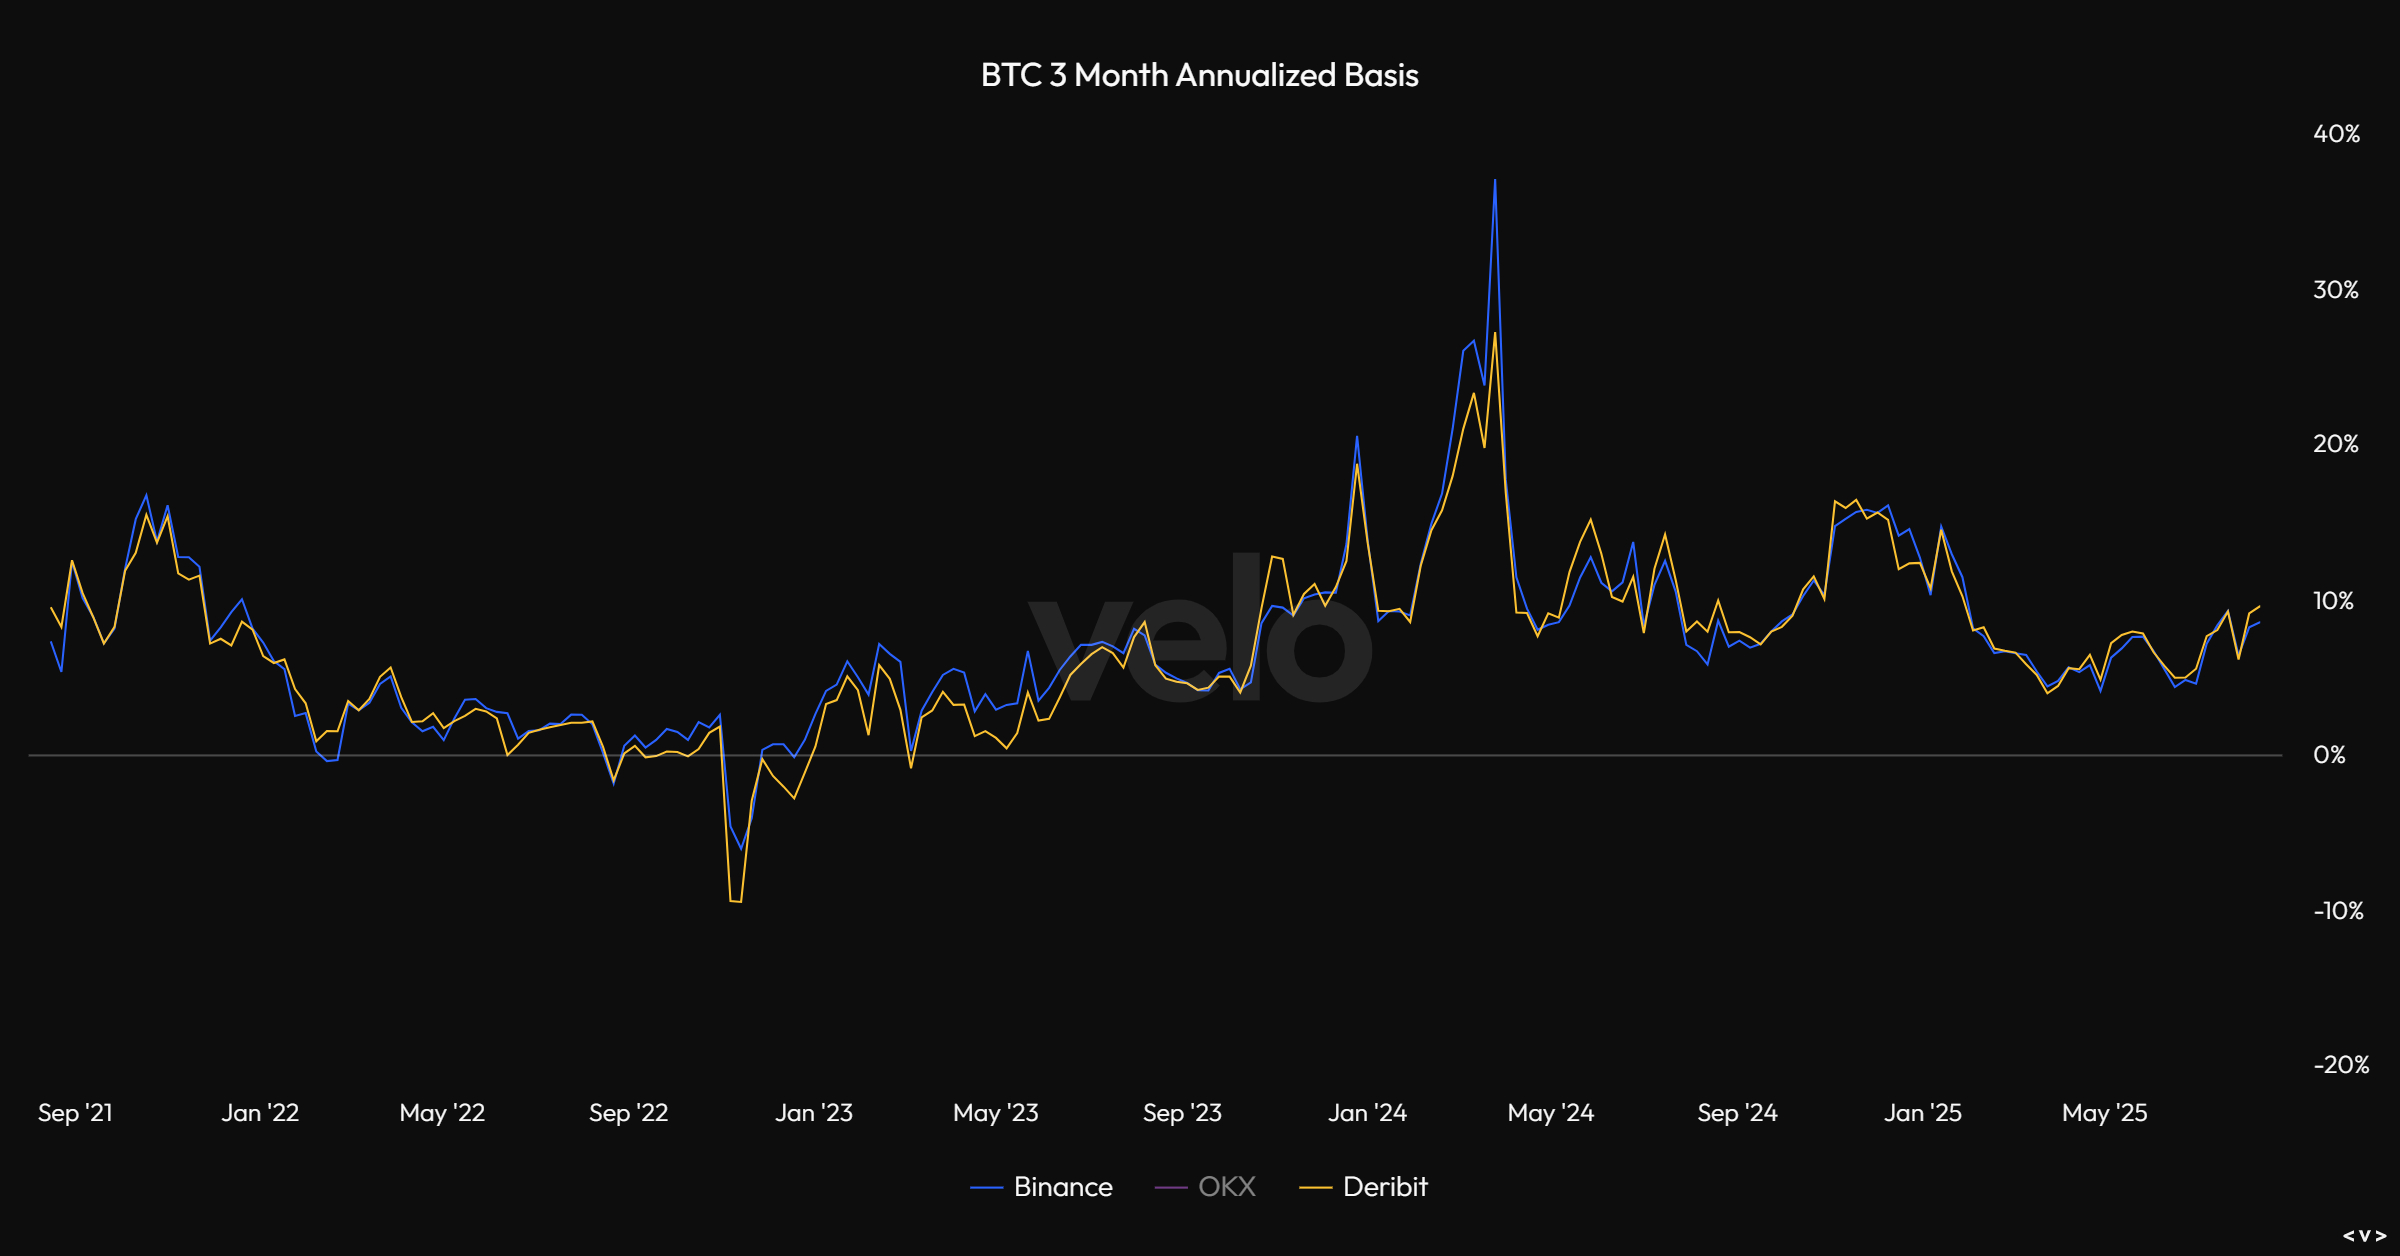
And here's 3-month annualized basis:
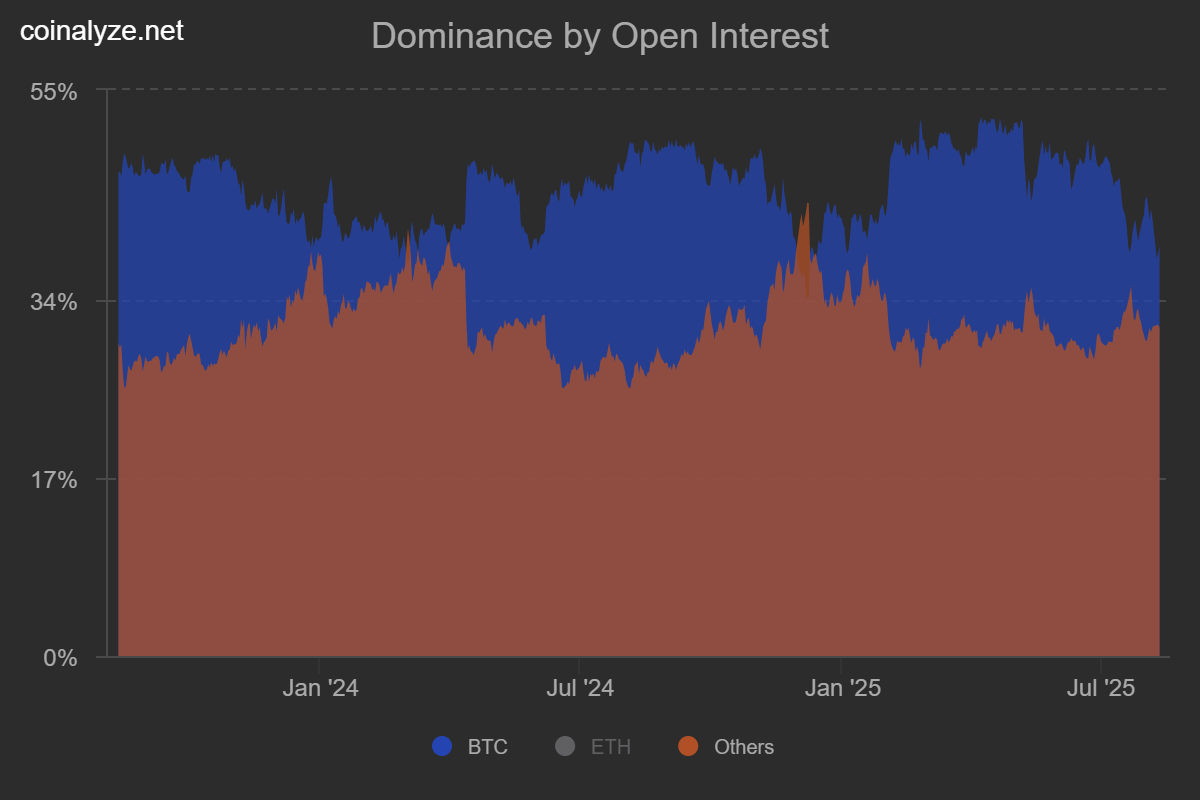
And Bitcoin OI vs Altcoin OI:
And finally some of the expected 1-week and 1-month liquidation levels:
-2025-08-11_07_31_46.png)
-2025-08-11_07_33_39.png)
Price: $4302
ETH/USD
Weekly:
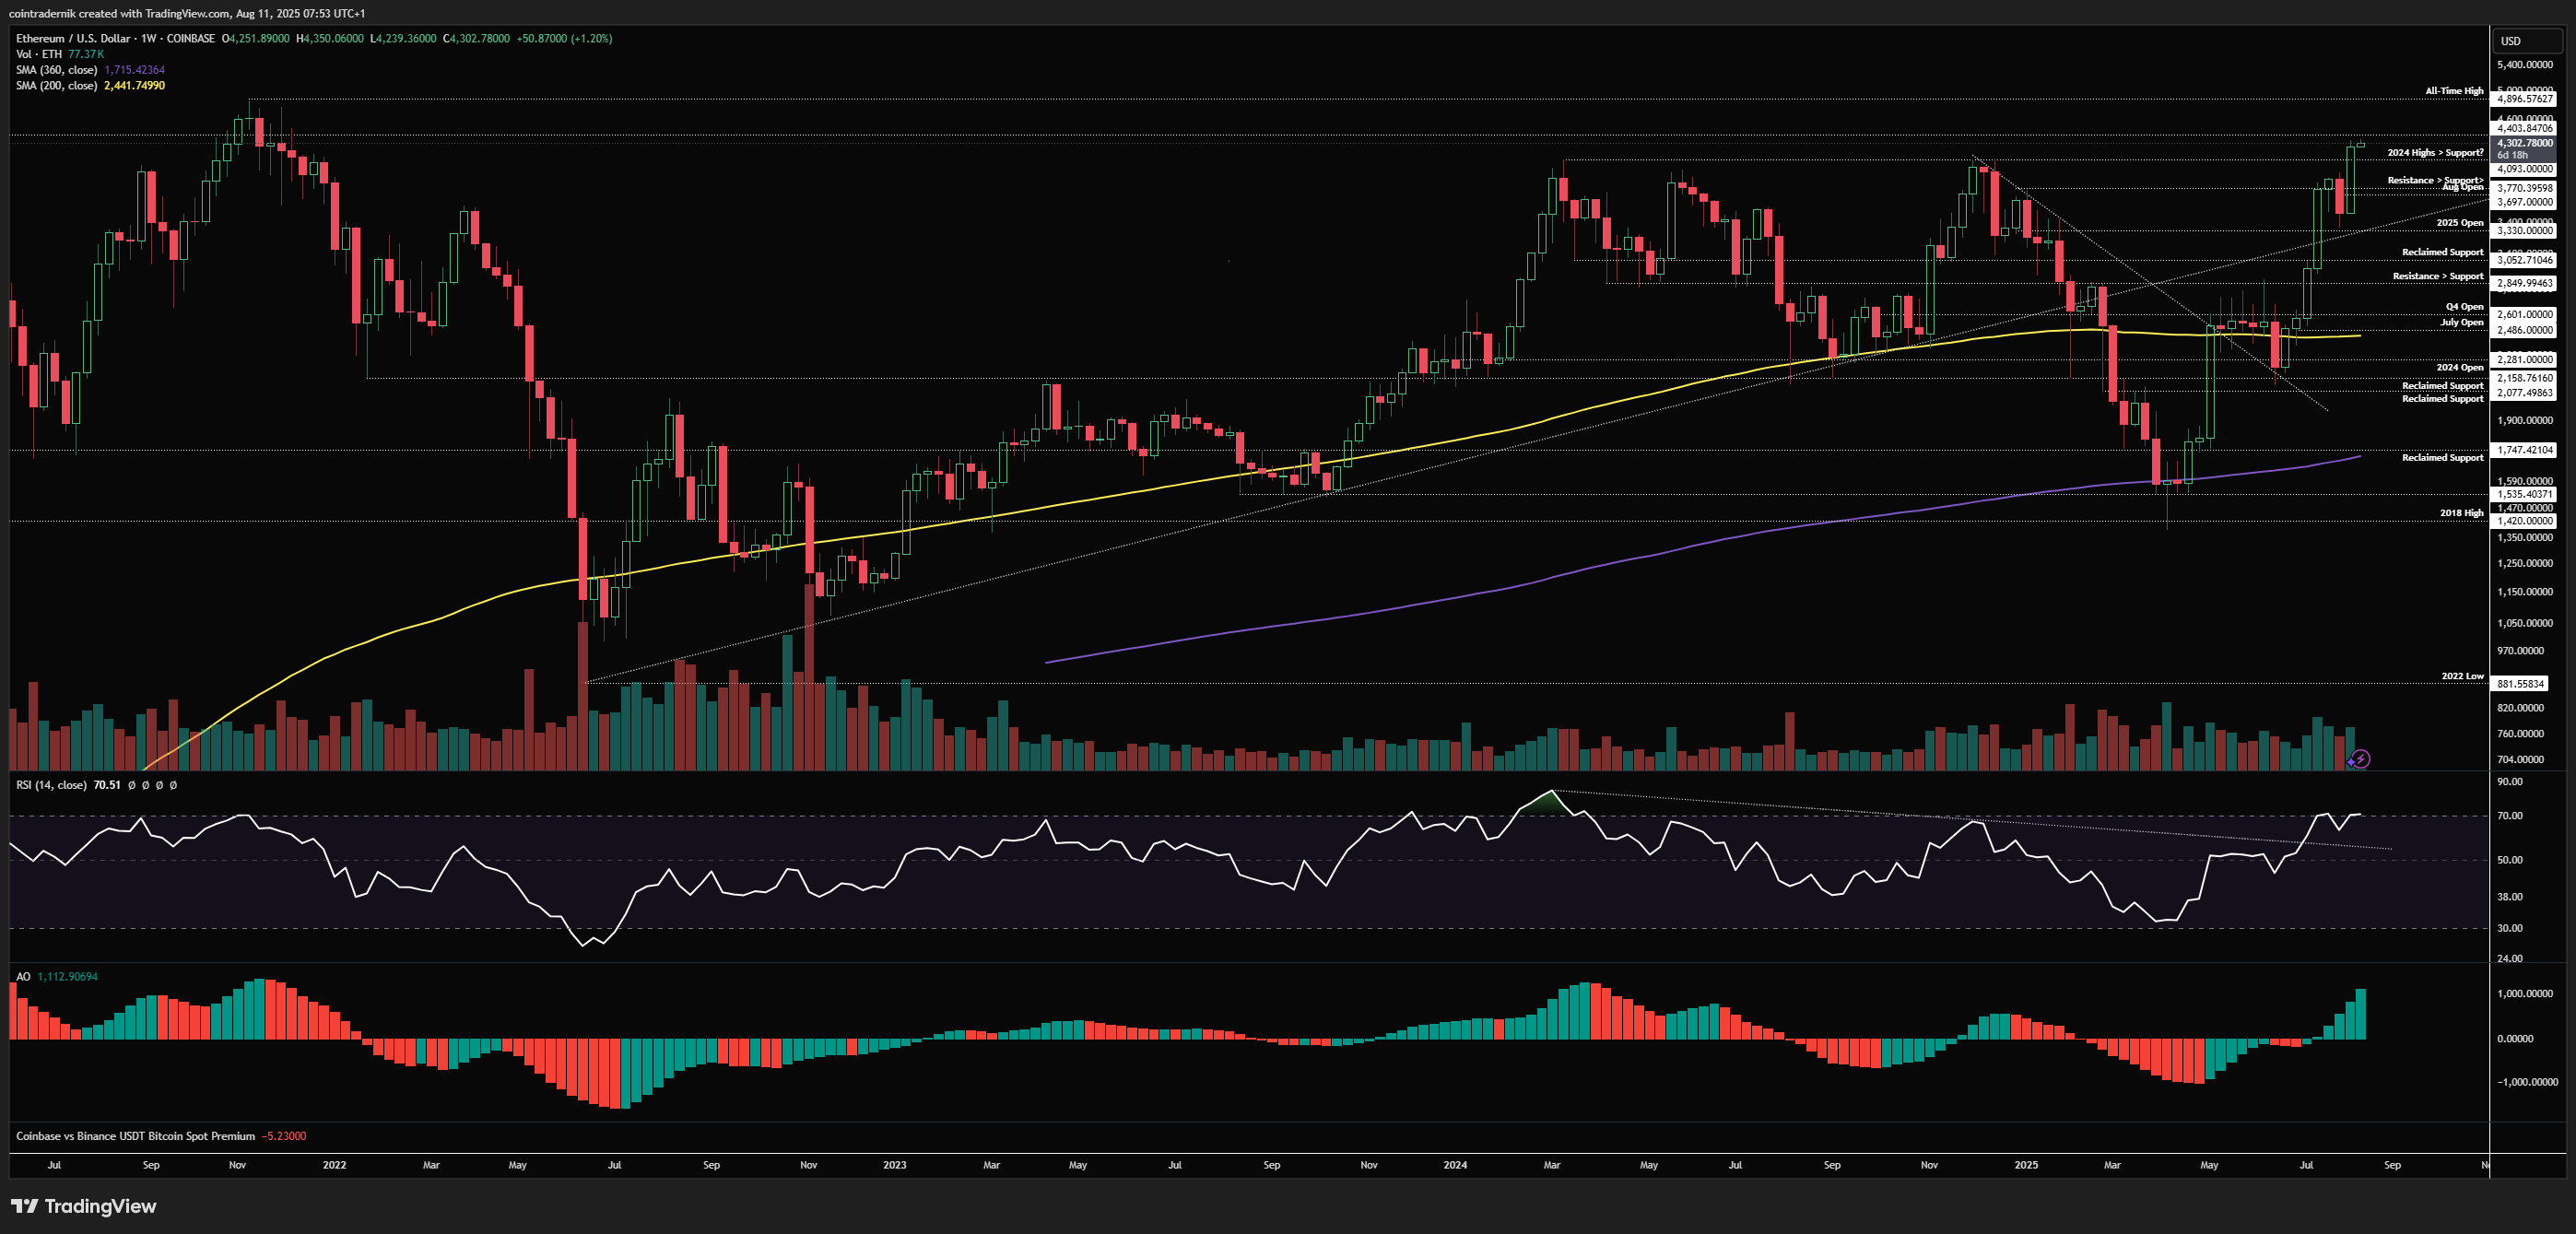
Beginning with the weekly for ETH/USD, we can see that last week saw price rally off the weekly open on growing volume and momentum, pushing through local resistance into and beyond multi-year resistance at $4093, ultimately closing the week at $4251. This was a huge level to break through and we should now see that level act as support on any pullback this week, with the expectation that we take out $4400 resistance and push towards all-time highs now at $4896 before the next major pullback occurs. If we close this week back below $4093, it begins to look like a failed breakout (which could very much be bait, though we would need to see an immediate reclaim of the level the subsequent week for this to be the case). If it is a failed breakout, we likely see $3770 retested as resistance turned support, where I would expect a higher-low to form before the next attempt at $4400 resistance. Acceptance back below $3700 = 2025 open retest. But right now this looks super bullish and like it wants to continue to rip towards that ATH retest...
Daily:
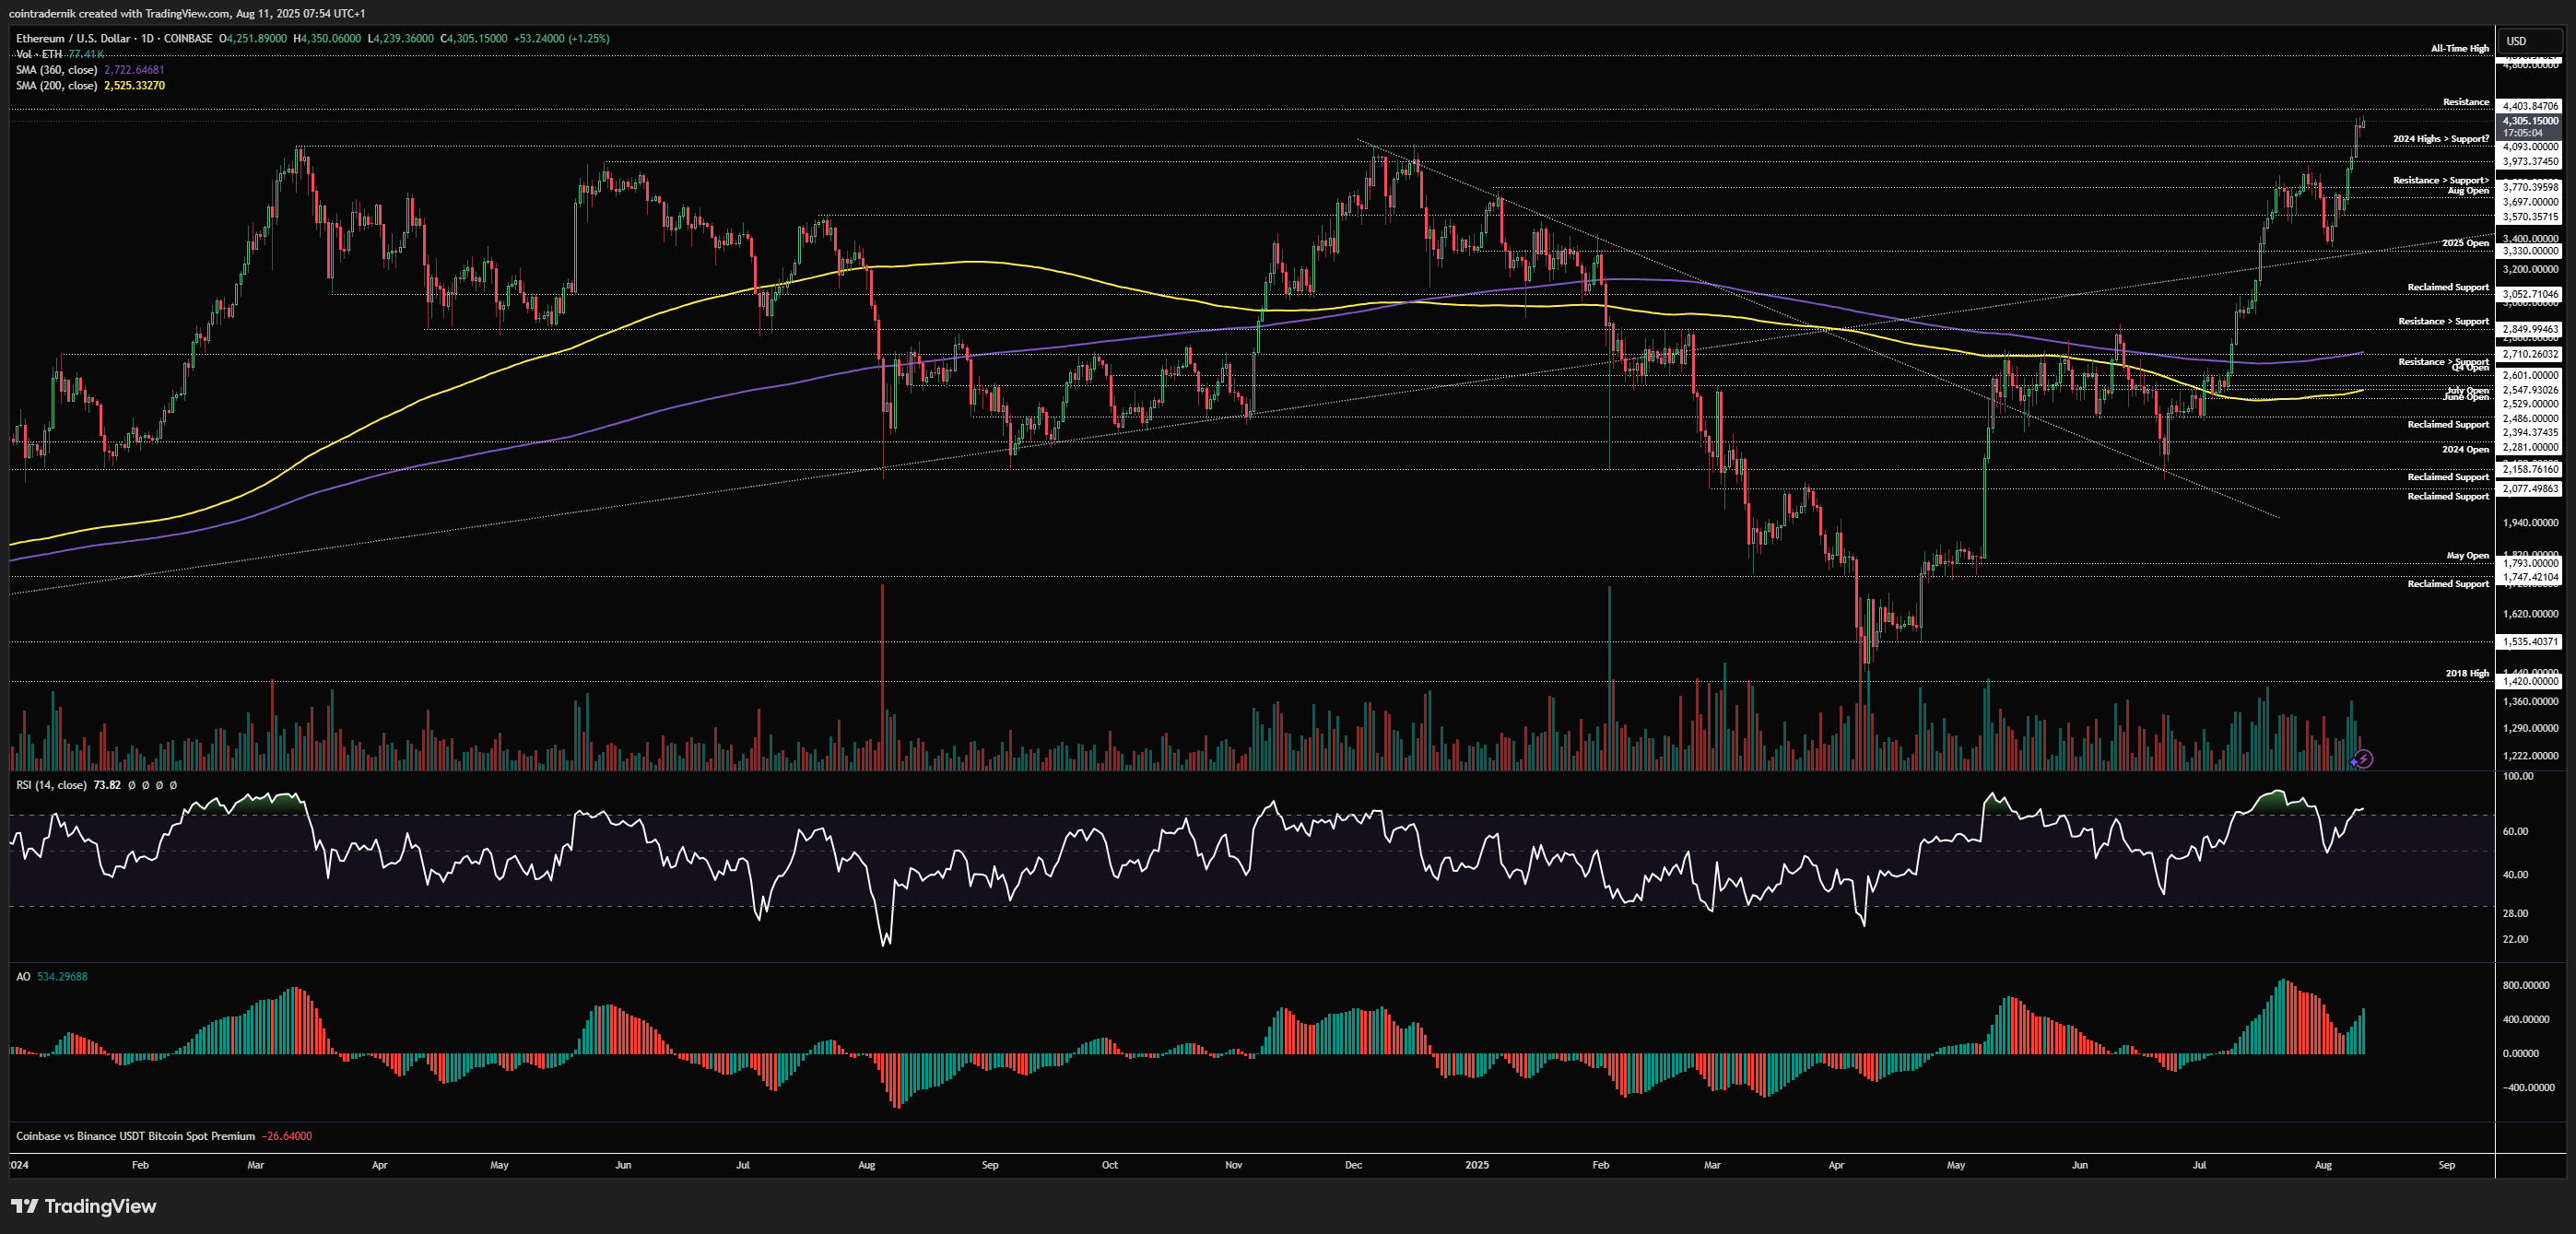
Looking now at the daily, we can see that momentum reset on that dip into the yearly open and price ripped off that level, reclaiming the August open and accepting above $3770 as resistance turned support, which then led to continuation through $3973 and $4093 into $4350, marginally shy of this final resistance level before the ATH retest. There is absolutely nothing about momentum or structure here on this timeframe which is currently bearish, so dips should be seen as opportunities for longs. If we break above $4400 this week and then form momentum divergences, you can look for opportunities to fade. If we just reject here early this week without any momentum exhaustion, I think $4093 holds as support and we push higher off that level into the weekly close.
ETH/BTC
Weekly:
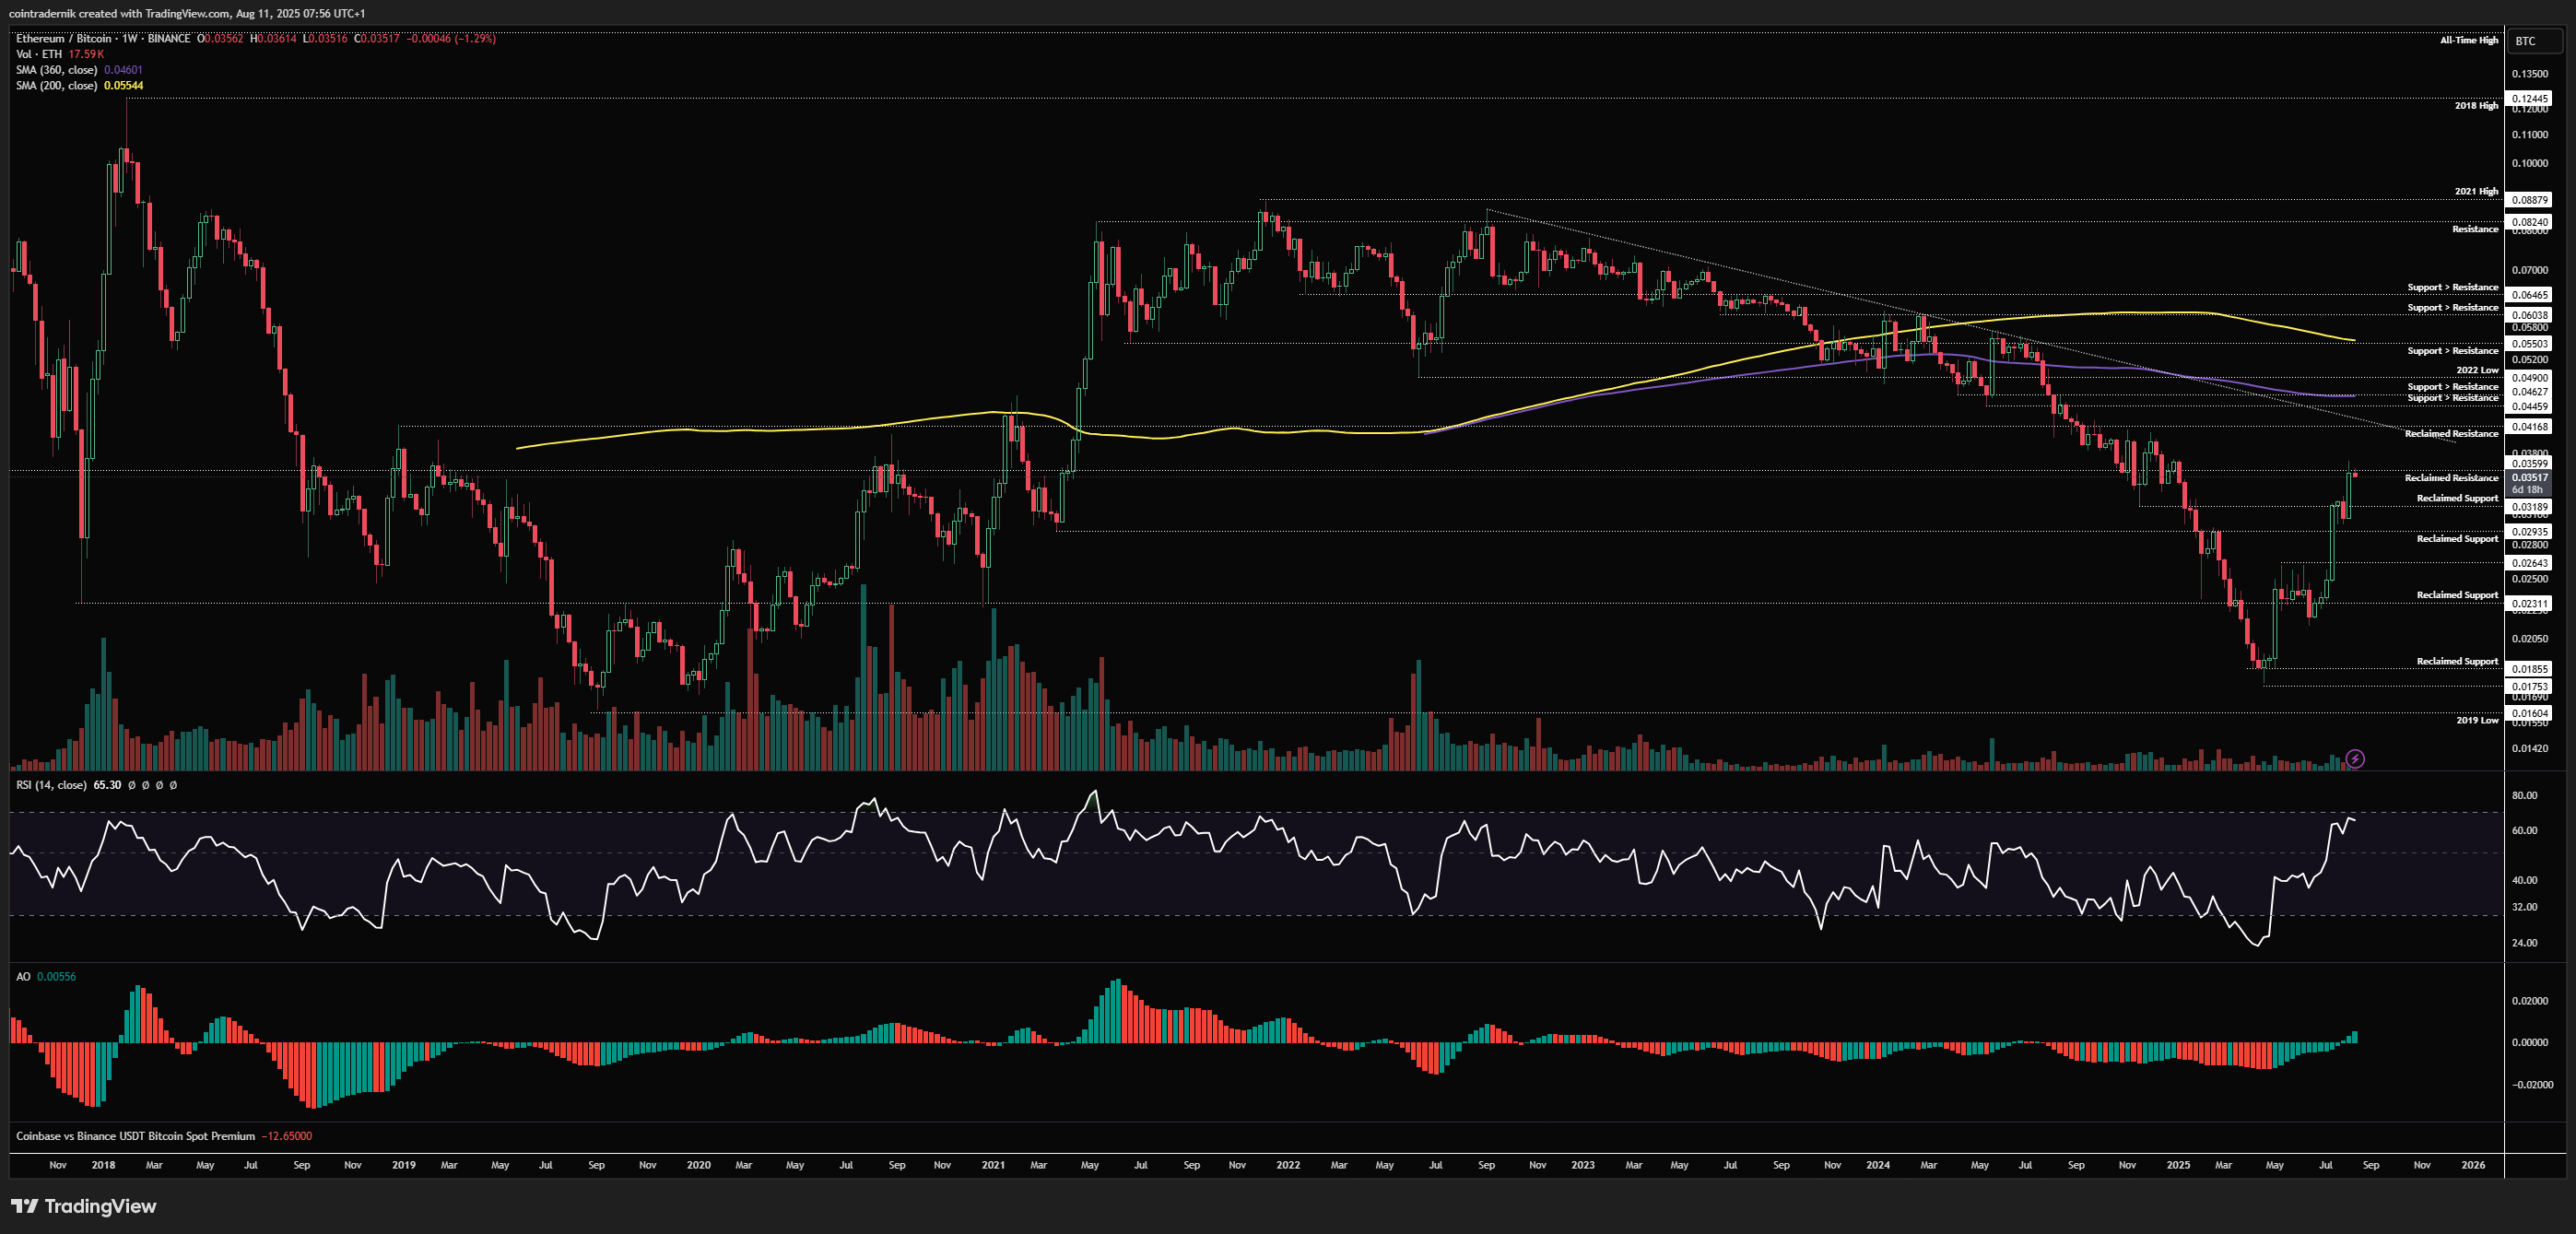
Looking at ETH/BTC on the weekly, we can see that price broke above 0.032 as anticipated and pushed into that 0.036 level we had marked out, closing the week right at that level with weekly momentum still firmly bullish. Whilst we could consolidate here for a week, I think it is more likely we break 0.036 here and push towards 0.0417 into next week, where there is significantly more resistance to overcome and where we are unlikely to break out on the first attempt, in my view. This would likely align with the all-time high retest around $4900 on the Dollar pair, providing confluence for a local top before price discovery into Q4.
Daily:
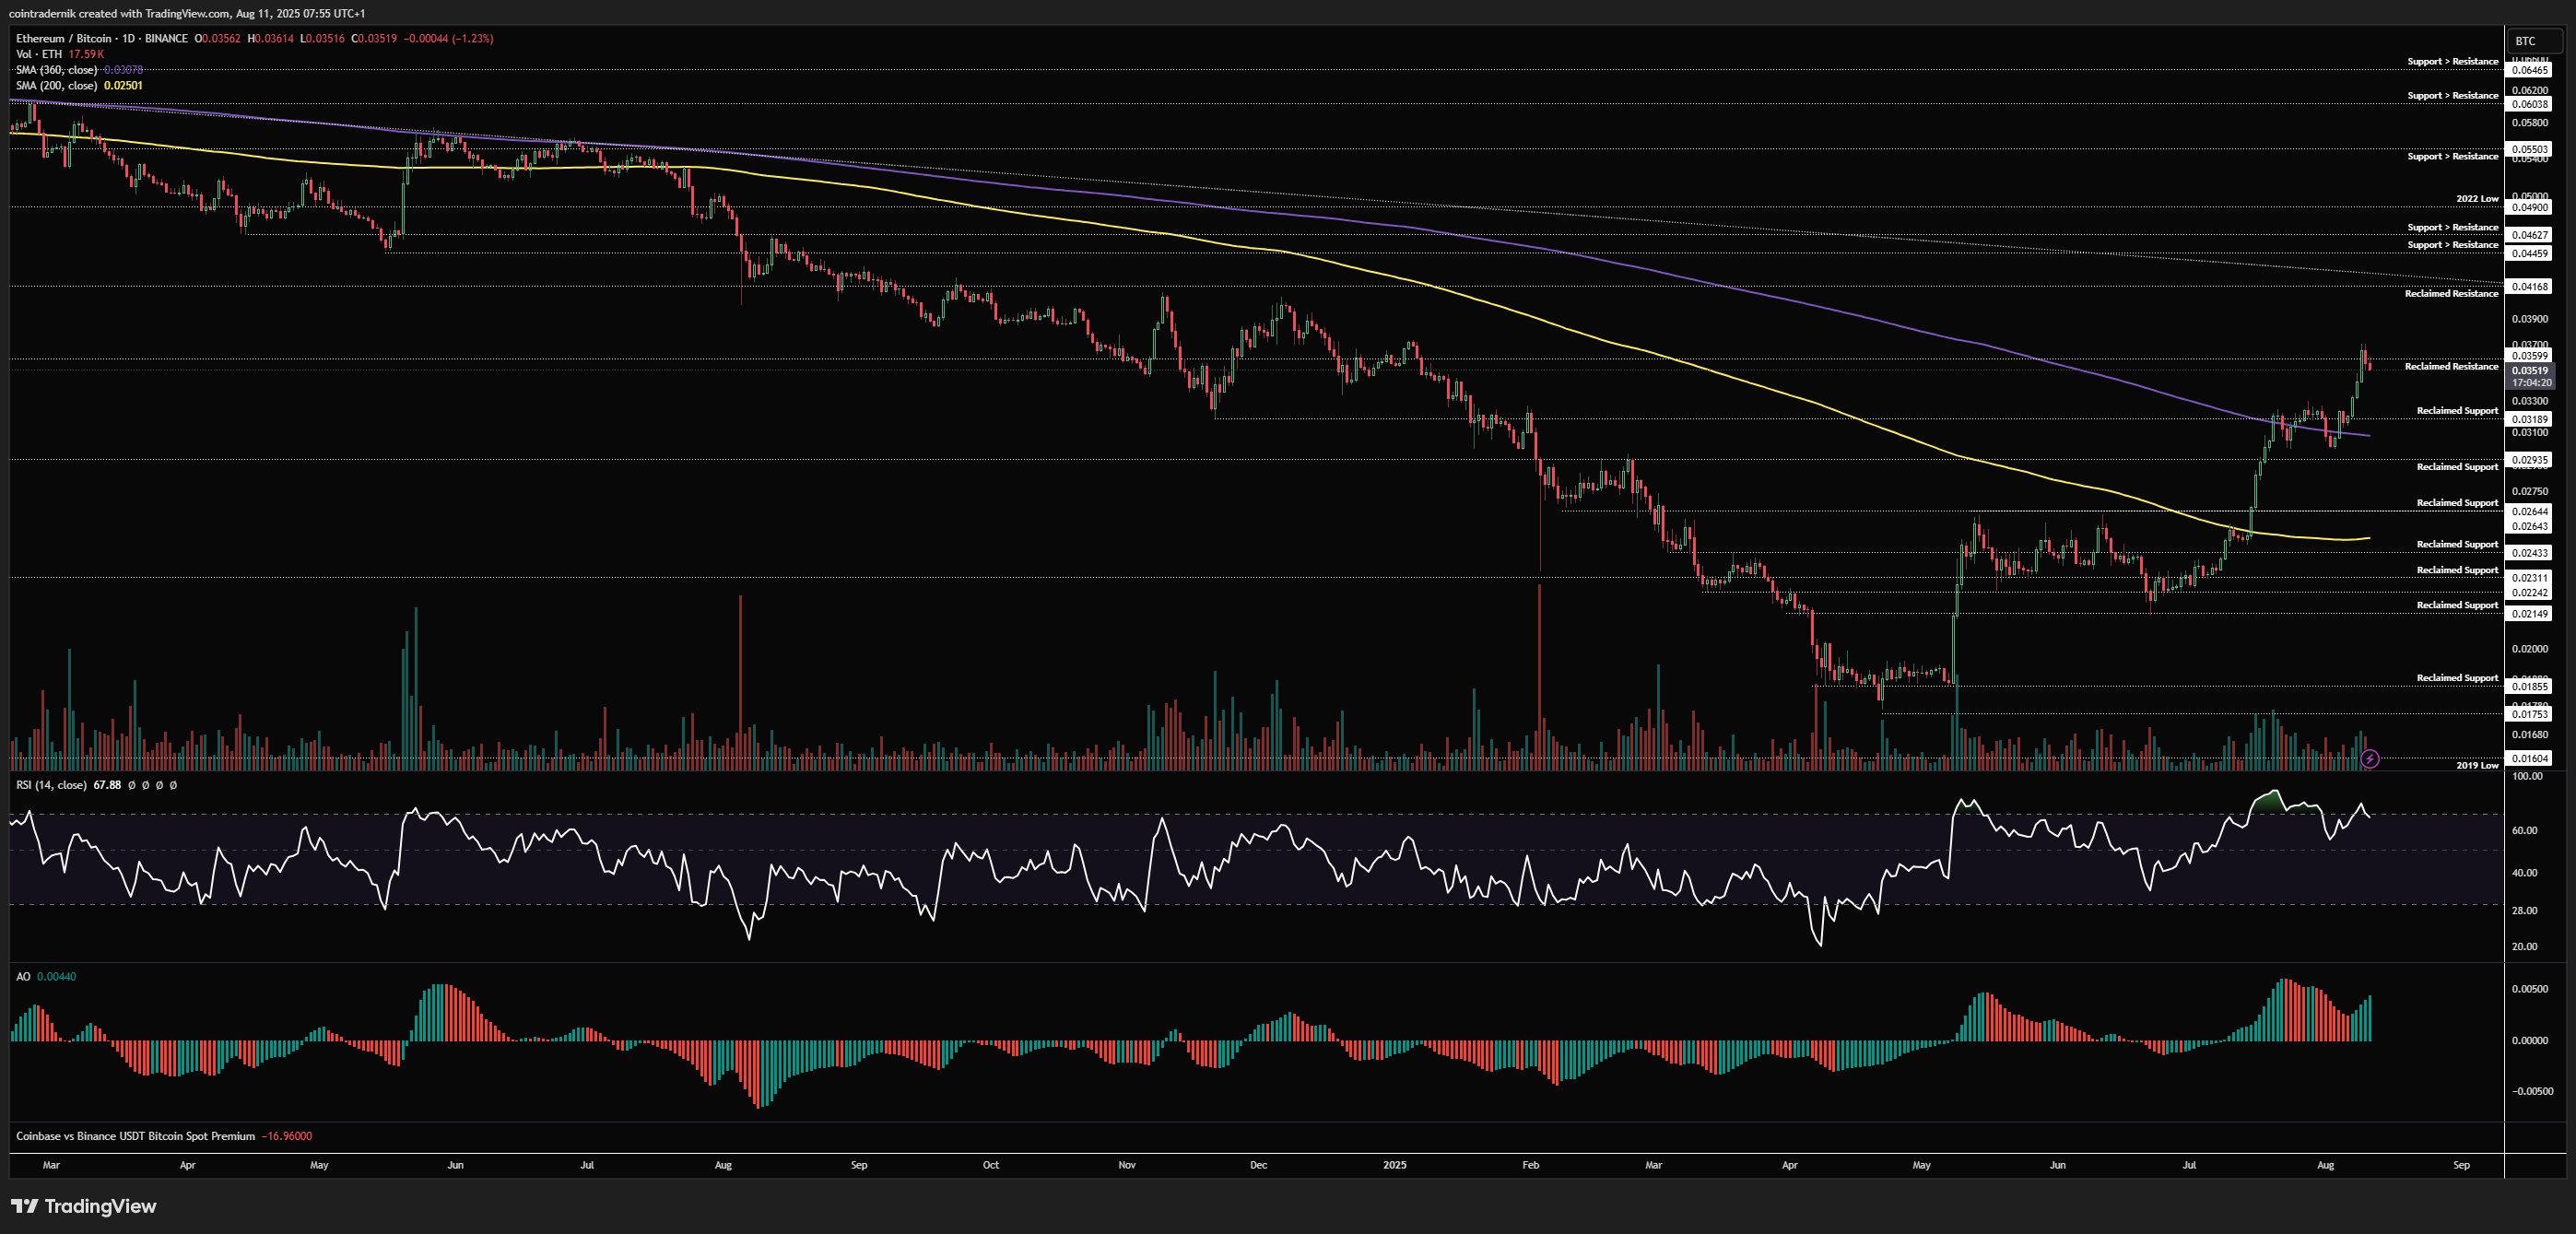
Turning now to the daily, we can see that price is sat right around reclaimed resistance at 0.036, and we should see any pullback towards 0.032 mark out another higher-low within this uptrend, especially as we have no trend exhaustion at present. Flipping 0.036 into support this week is what we need to see for what I expect will be the most explosive leg higher into that 0.0417-0.044 region for ETH/BTC, where I am currently of the view that we form a local top and consolidate for several weeks before any potential expansion beyond. Not much else to add here for now.
Receive the latest updates directly to your inbox

Price: $3366
Weekly:
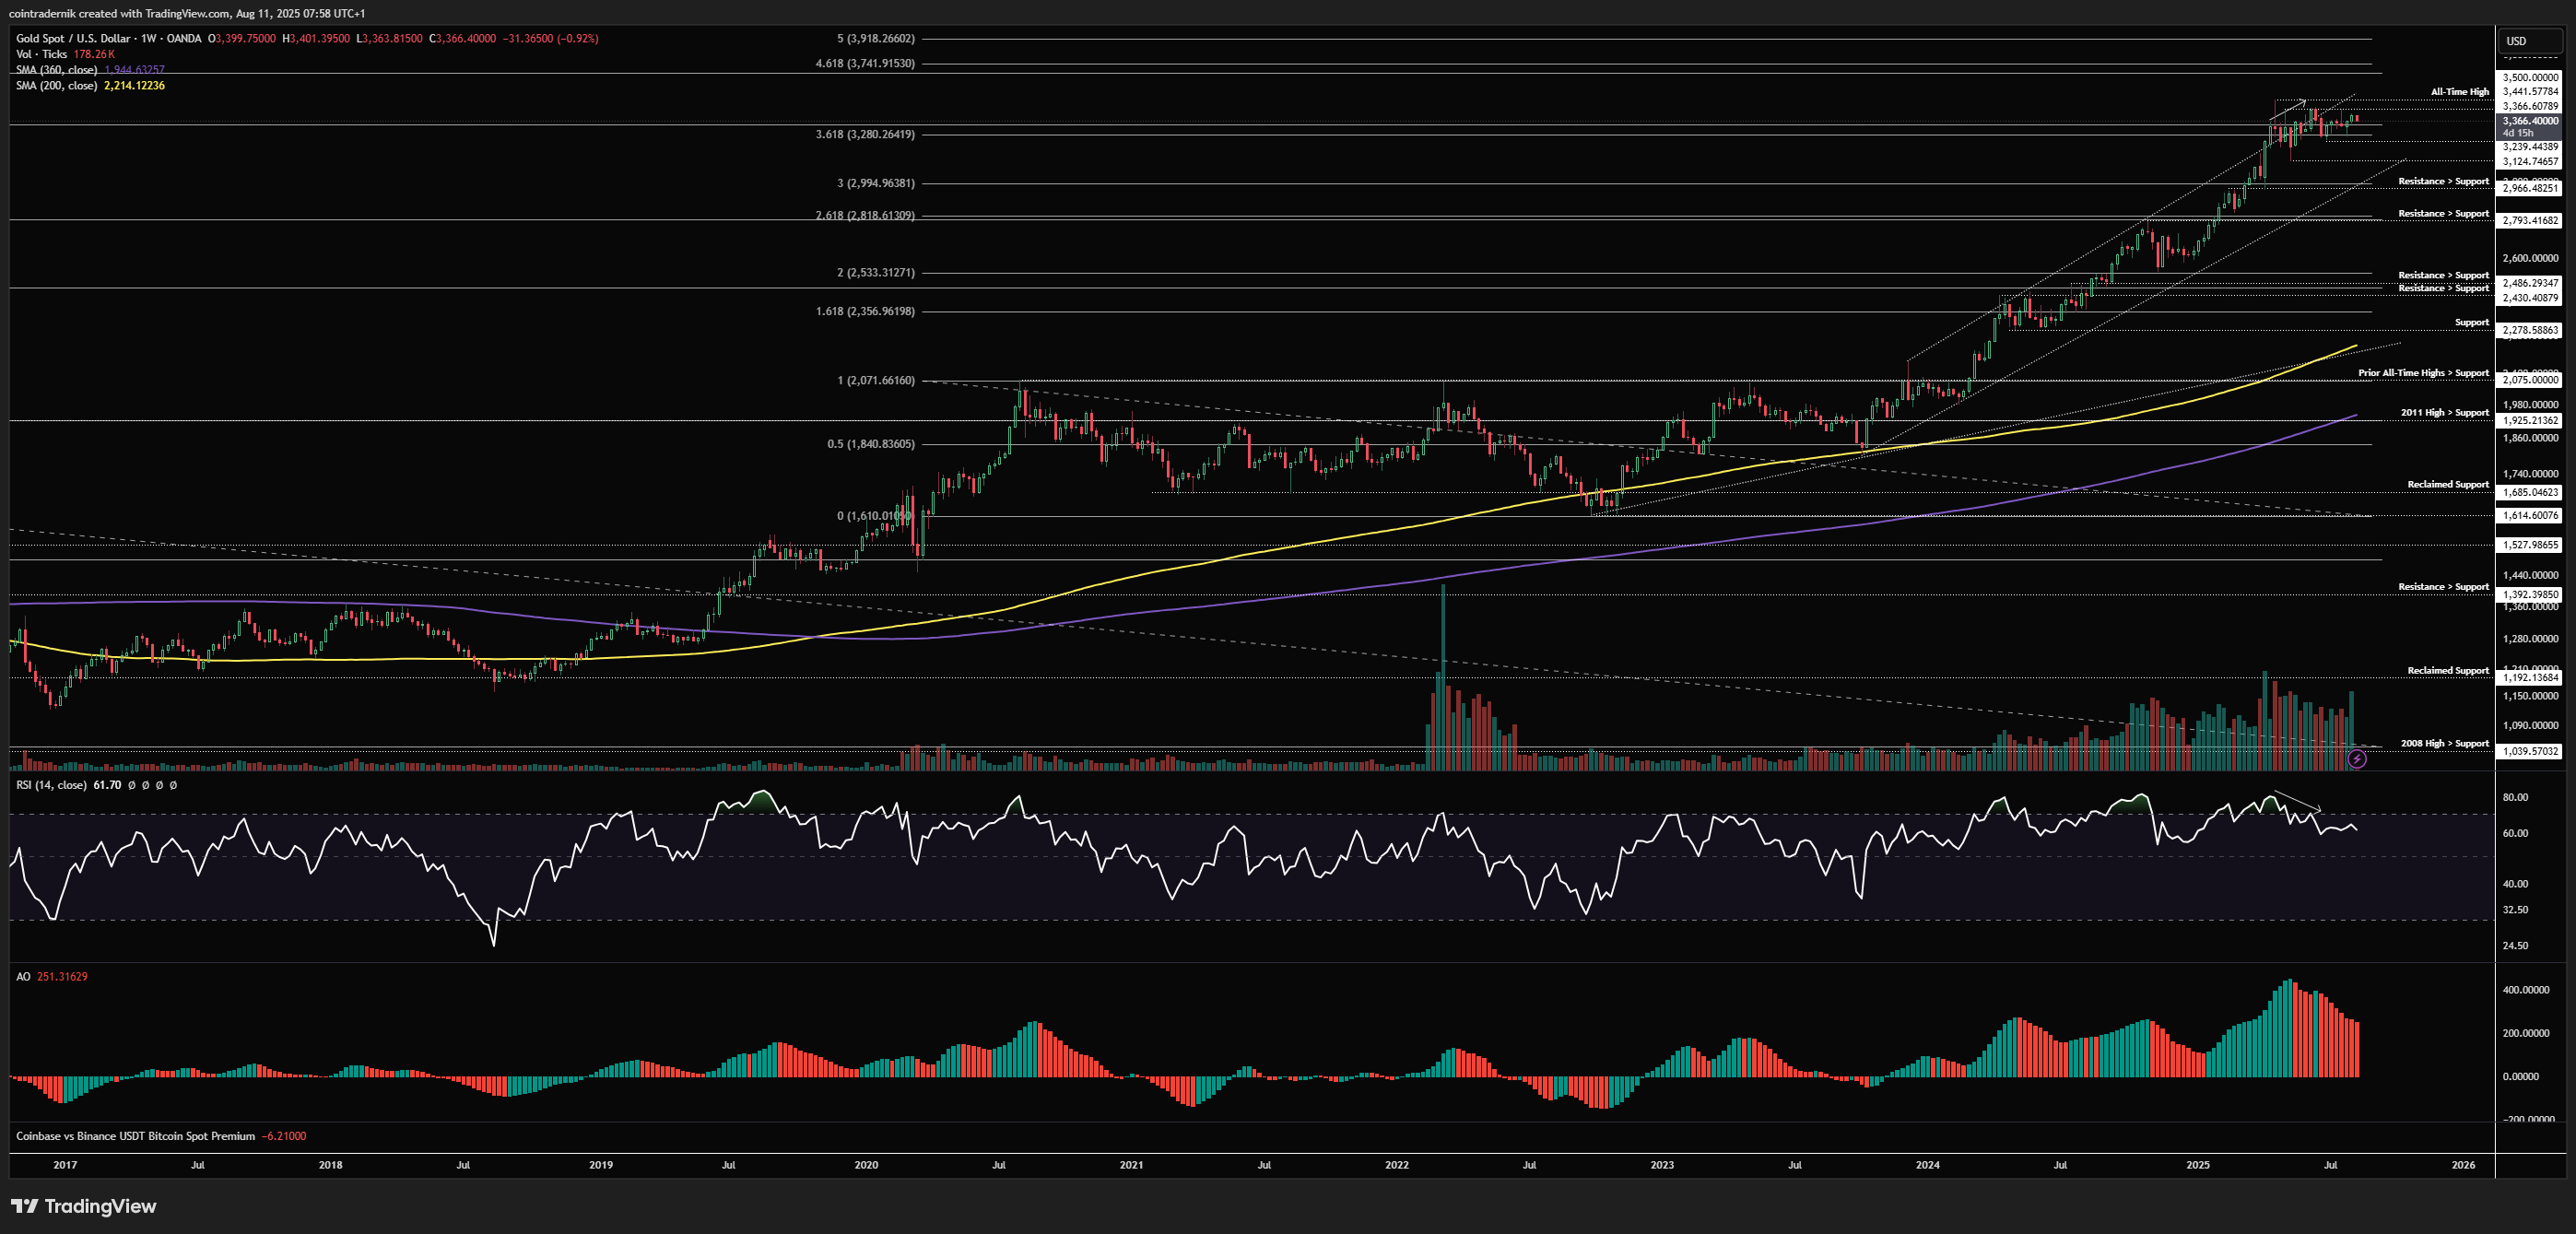
Gold has been in this sideways range for months now, continuing to be capped below $3441 but failing to break fresh lows in an ascending triangle-esque fashion. Given my renewed bearishness on the Dollar following the anticipated short squeeze (where much short positioning puked), I no longer hold a bearish bias on Gold for another leg lower into $29xx, rather expecting continued chop to be followed by expansion through $3441 later this year. This view will be invalidated if we close the weekly through $3239, making fresh lows beneath that support, thus opening up continuation lower into $2966 for the retest of major support. Close the weekly above $3441 and I think we trade towards $3700.
Daily:
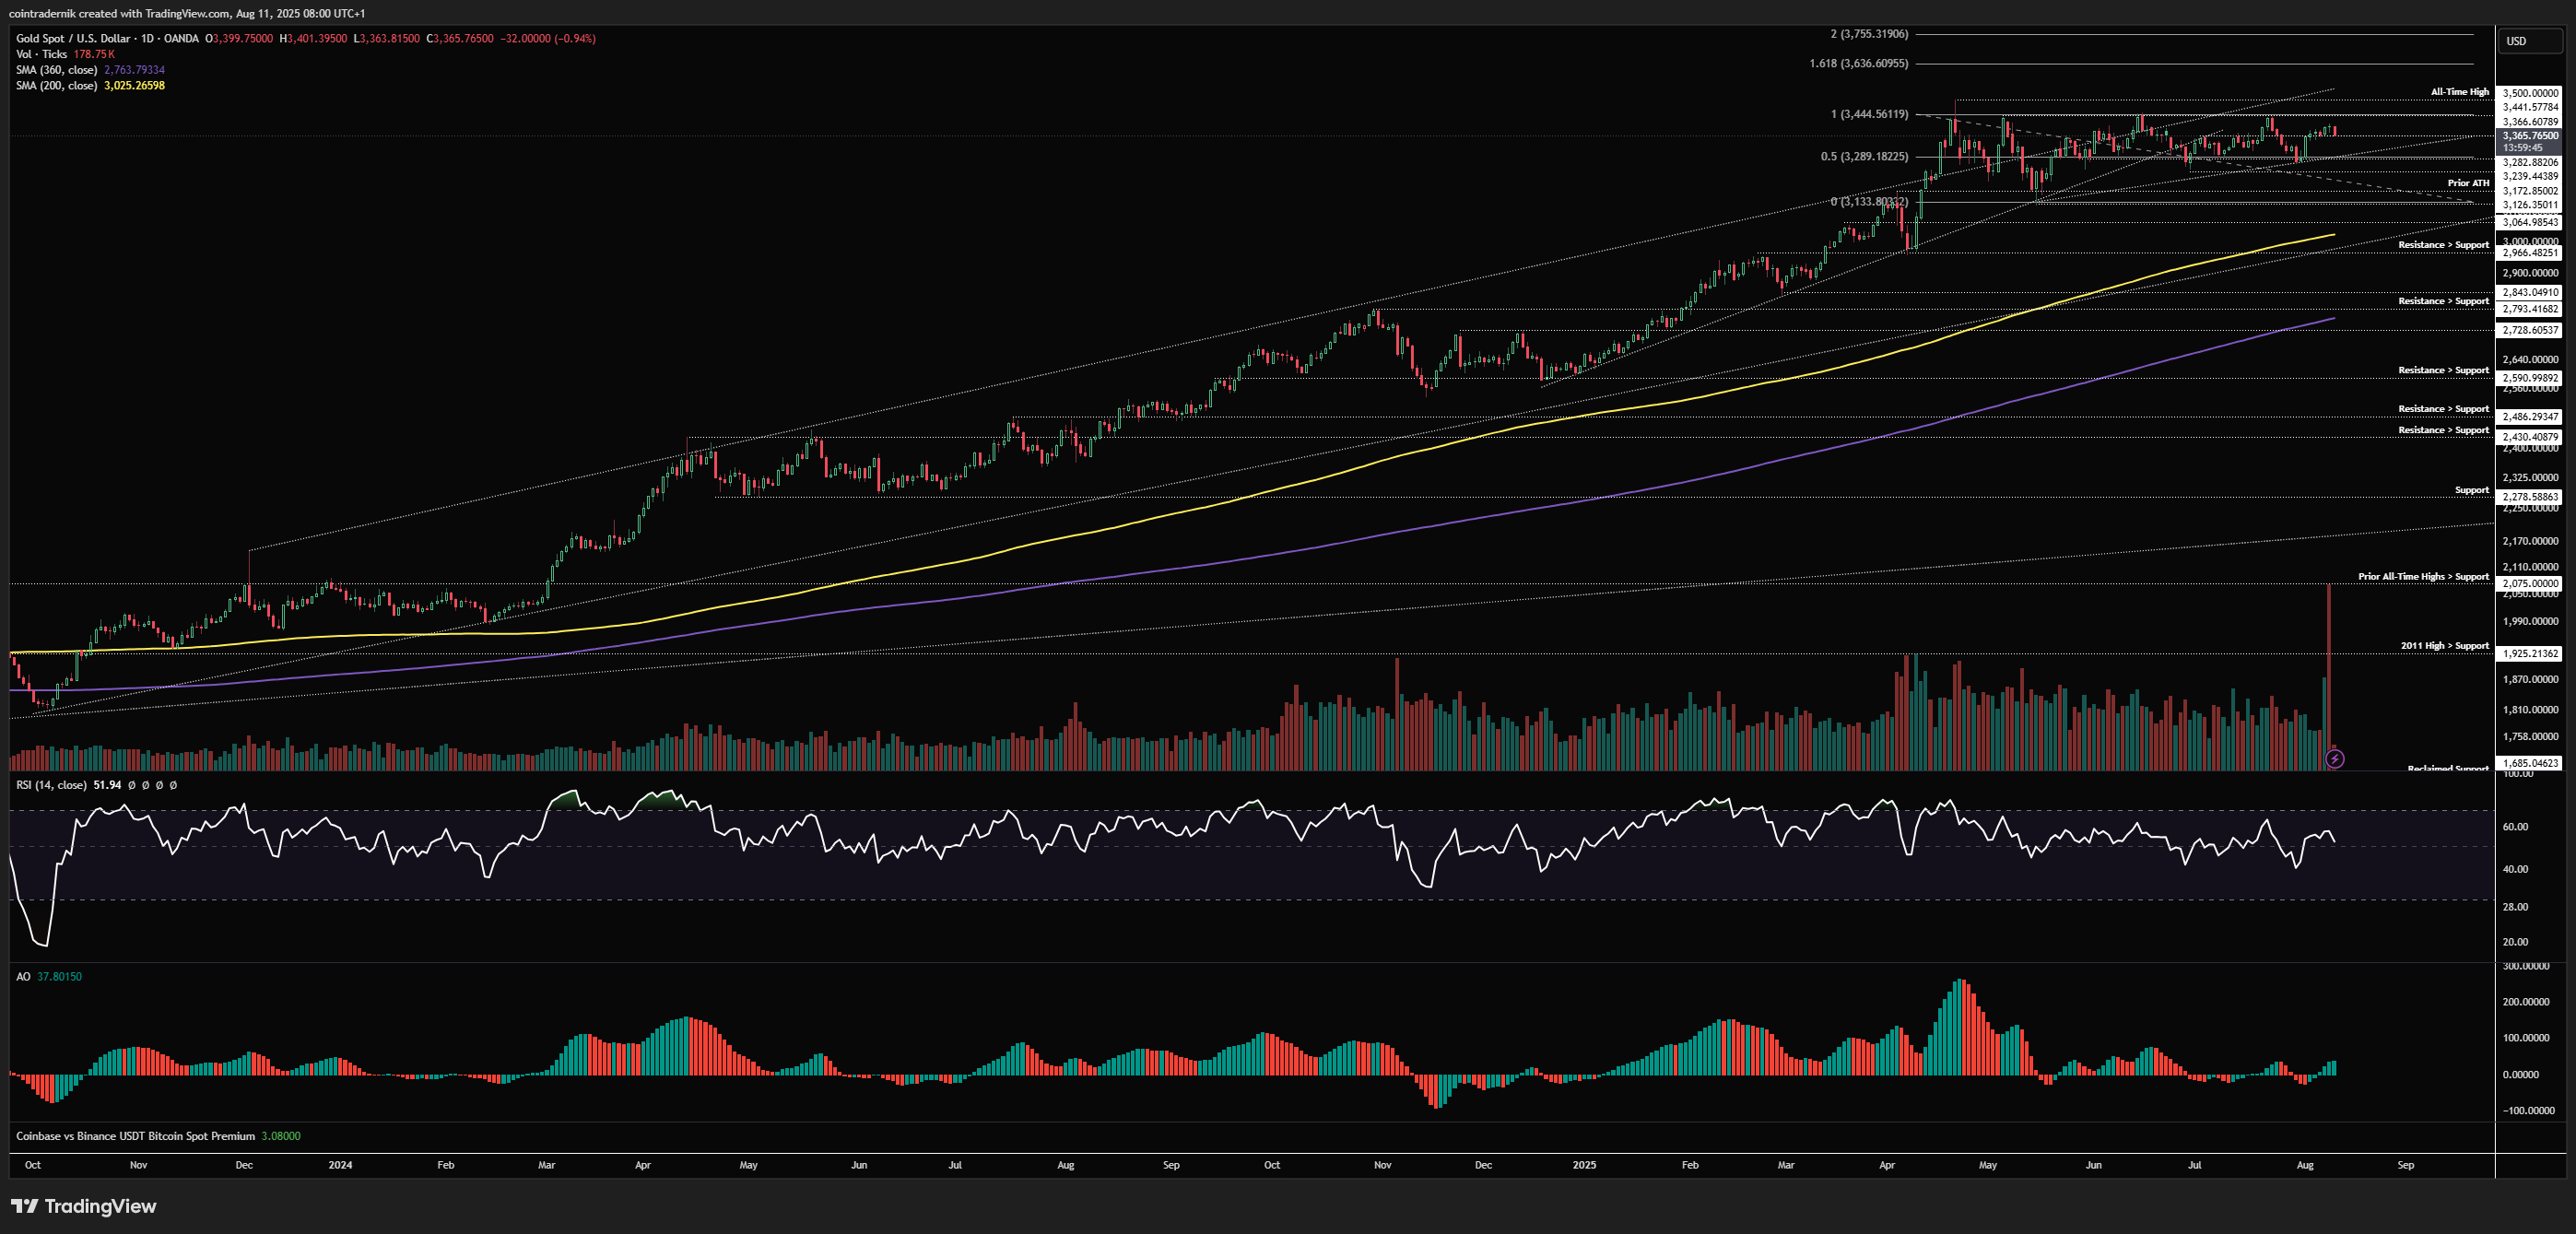
We can see this range more clearly on the daily timeframe, with much of this sideways movement occurring right around the mid-range. We are forming marginal higher-lows, with $3300 starting to act as decent support, thus if we flip that local support as resistance and break lower I don't think that move should be faded, with $3126 likely to be swept and price to at least retest the 200dMA at $3025 in that scenario. Whilst that support holds, I am neutral on Gold, with a view to flipping bullish if $3441 is turned into support, where we would then expect $3636 to trade swiftly, followed by $3750, where we could see another local top begin to form. For now, the range persists - don't get chopped up trying to trade this directionally.
Price: $6406
Weekly:
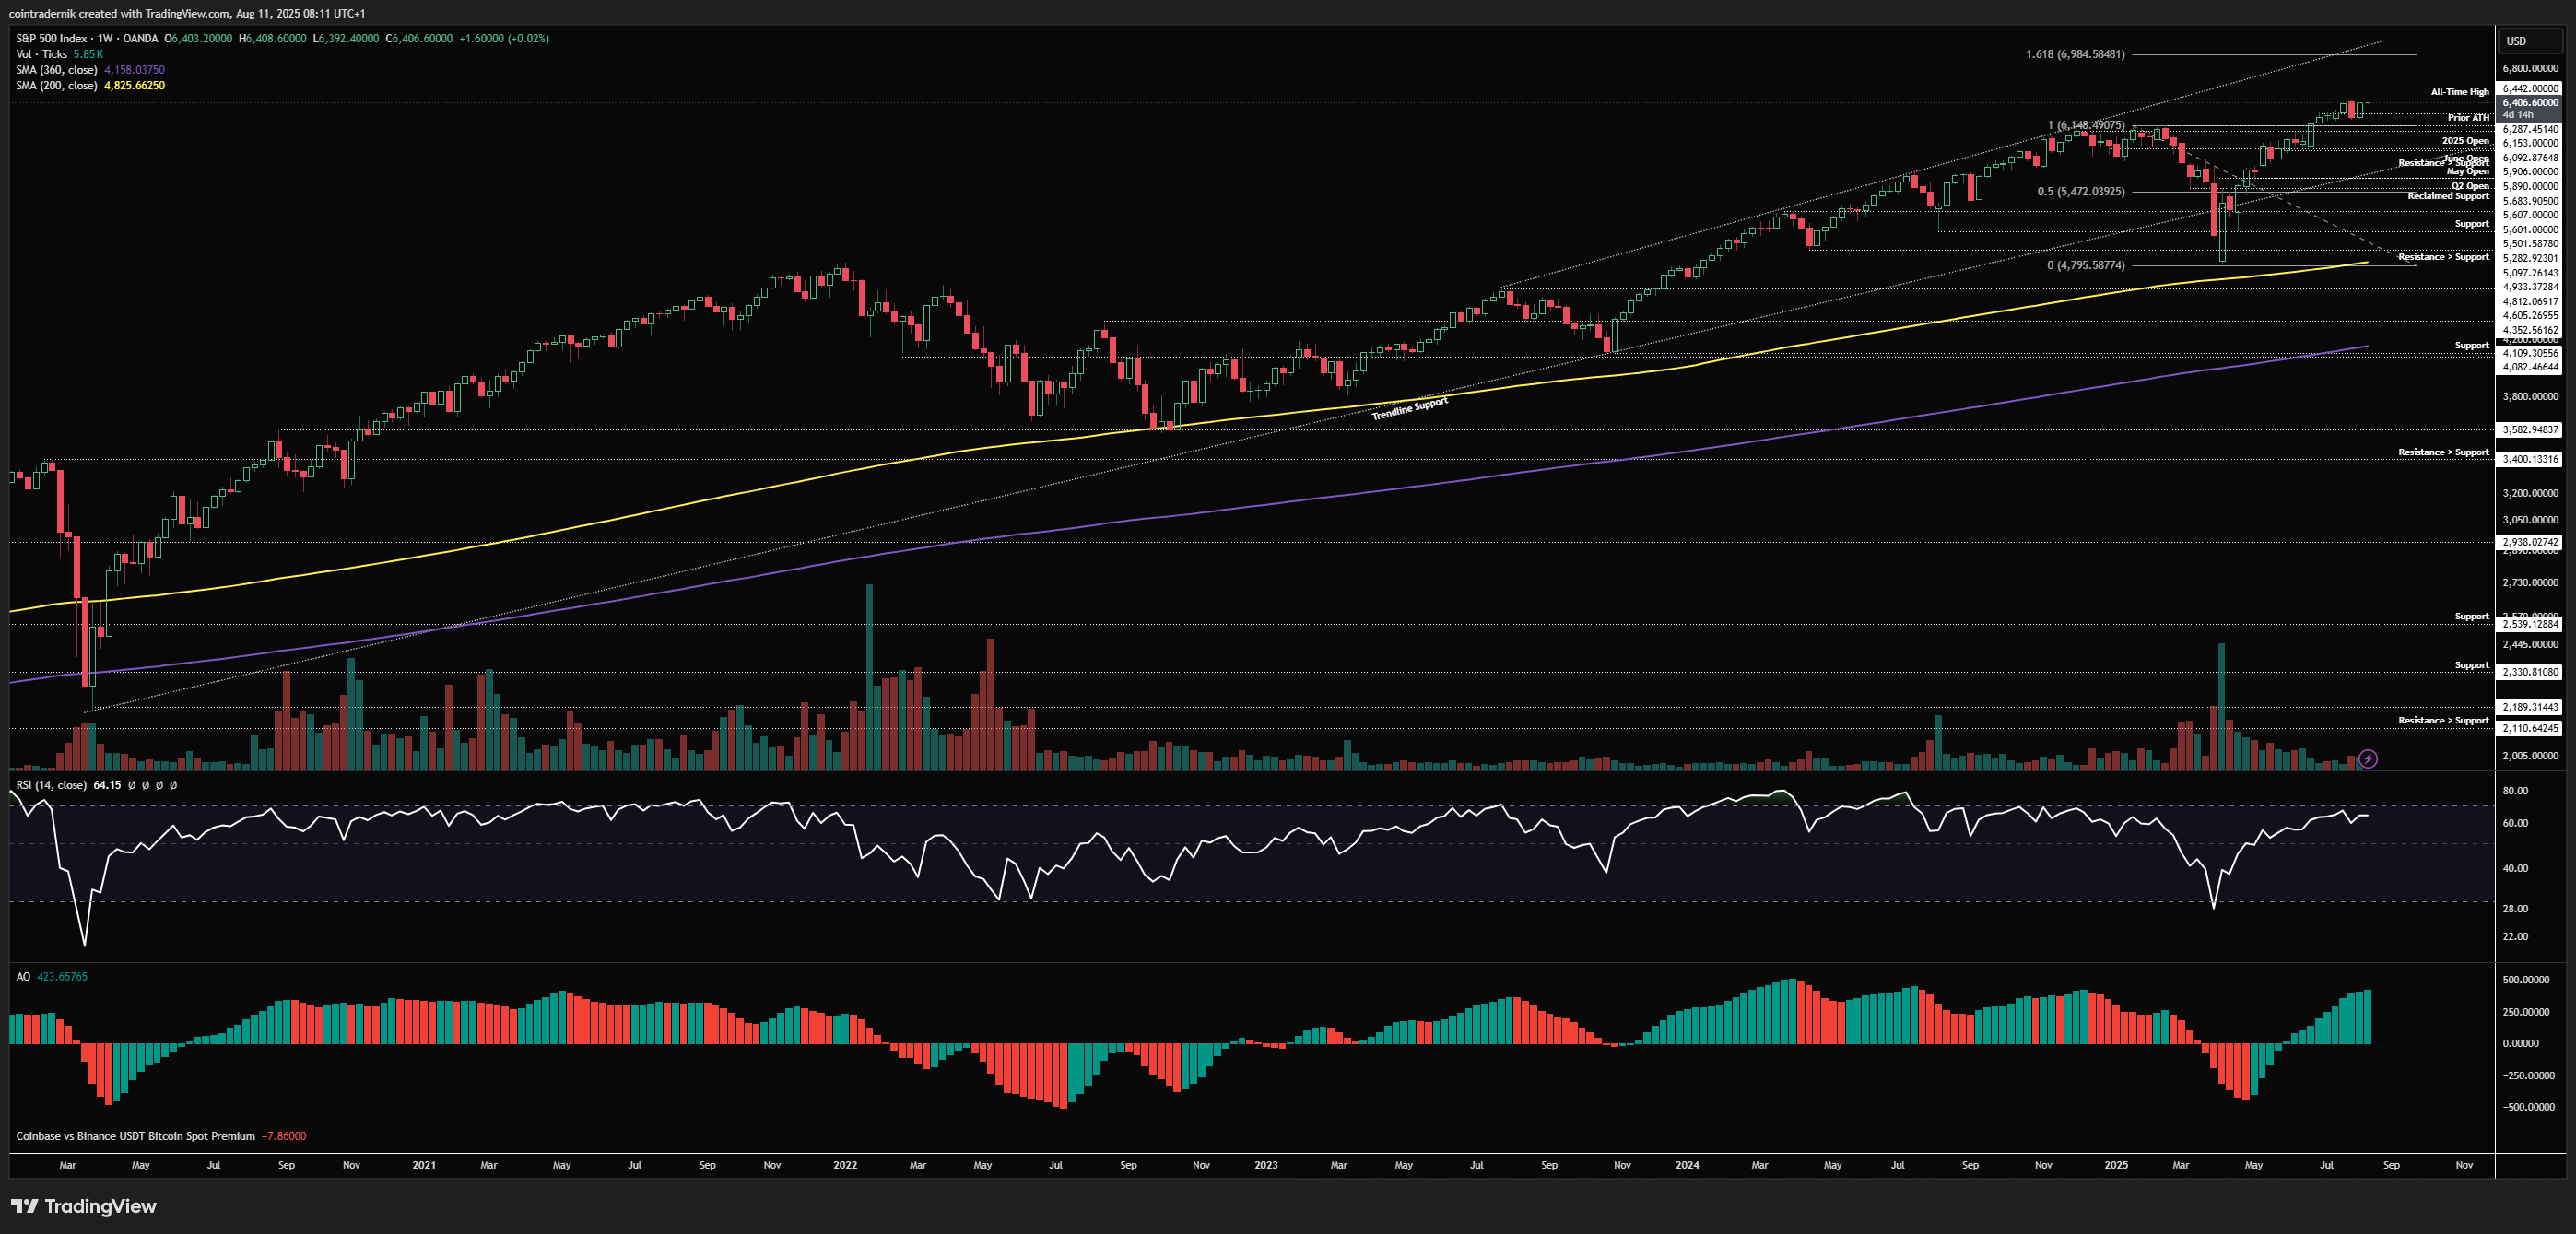
Beginning with the weekly, we can see that price found support last week right around the weekly open and rallied all the way into the close at $6403, almost engulfing the previous weekly retracement candle. This may well invalidate my short-term bearish view on equities (and render my downside protection worthless), but we need to see acceptance above $6440 this week for that to be the case. As mentioned a couple of weeks ago, I was expecting a period of moderate weakness through August that marked out a higher-low within this broader uptrend and then saw continuation higher from September; if we accept above $6440, I think we begin that next leg higher now and potentially get that minor correction in mid-Sept going into October before continuation higher into year-end. If we wick above all-time highs and then close this week below $6400, the short-term bearish view remains and I think we retest $6090 as support before bottoming out.
Daily:
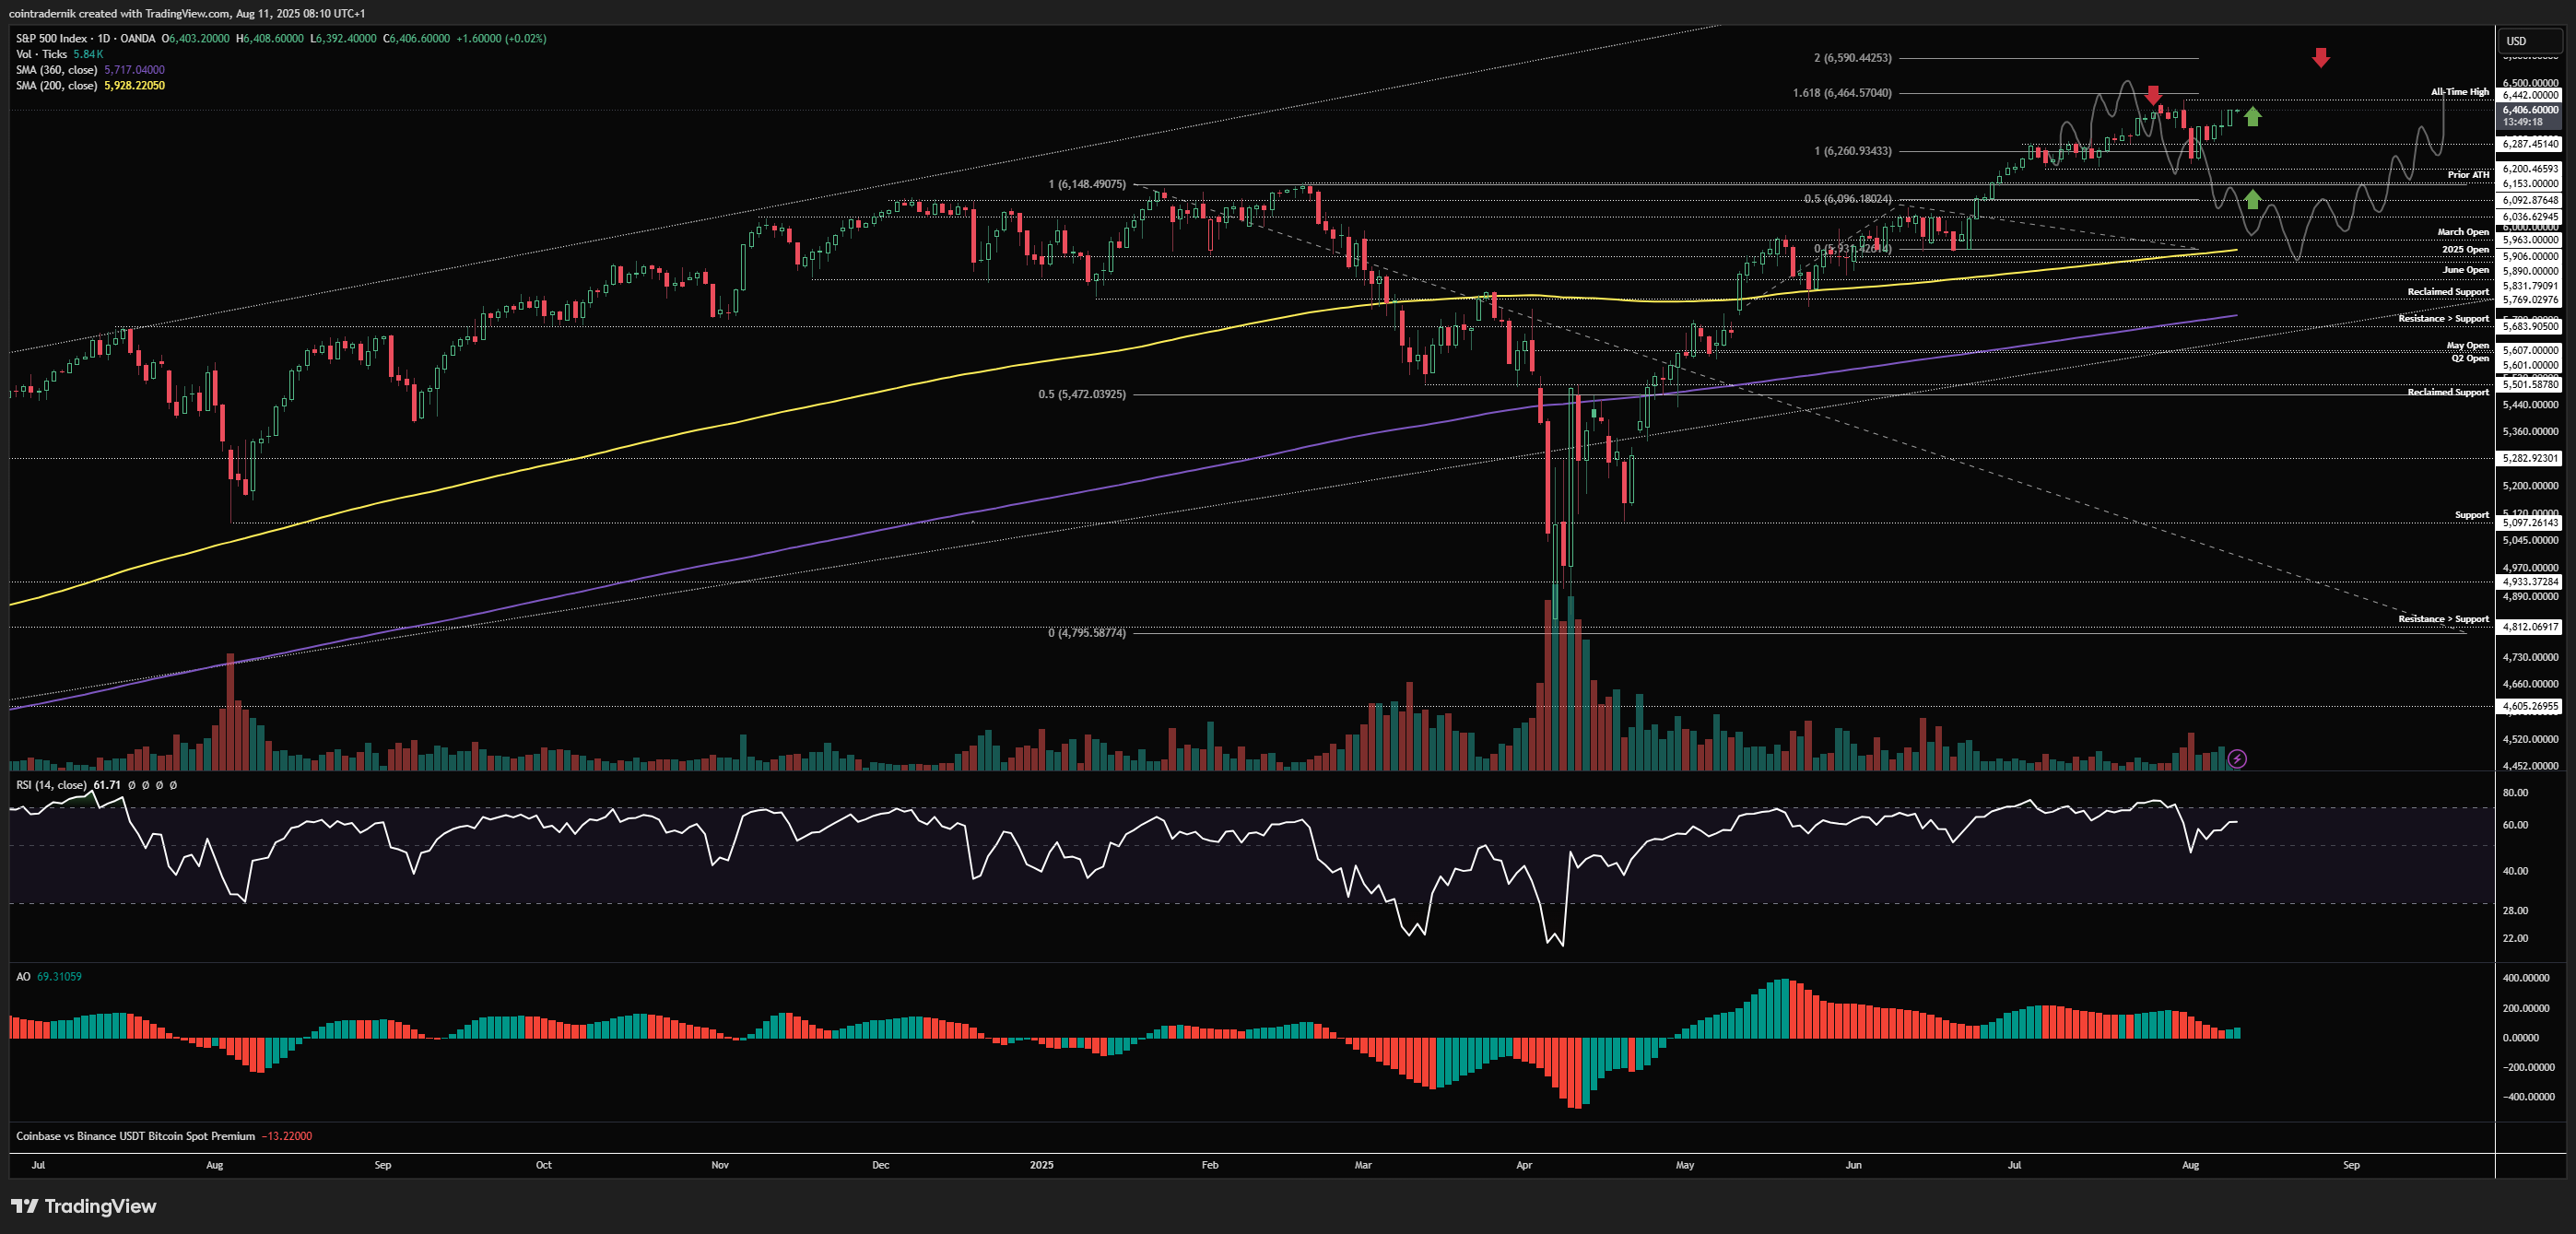
We can see this all more clearly on the daily, where price rejected at $6440, dipped into $6200 but held above that support and has v-reversed back towards those highs, where my expectation was continuation lower into $6090 and some sort of bottom formation between there and the yearly open, though I did not (nor do I now) expect that yearly open to be tagged. With this rally, we have the potential for price discovery if $6440 is flipped into support this week, where I would expect price to continue from there towards $6600 by September, with the expectation of a 5% pullback or so in September from those highs. If, instead, range resistance holds firm here, we likely trade back into $6200 and if that level gives way we get that final puke lower into $6090, where you should be buying hard. One thing that continues to favour bulls is how sentiment and positioning continue to remain relatively unstretched. My longer-term view remains that we push towards $7000 going into Q1 2026, but I do expect some volatility between now and October: whether that comes in the form of a rejection here this week and a return to range lows (and likely lower), or sometime in September from higher prices remains to be seen. In any case, don't get bear-holed.
Price: $308.7bn
OTHERS/USD
Weekly:
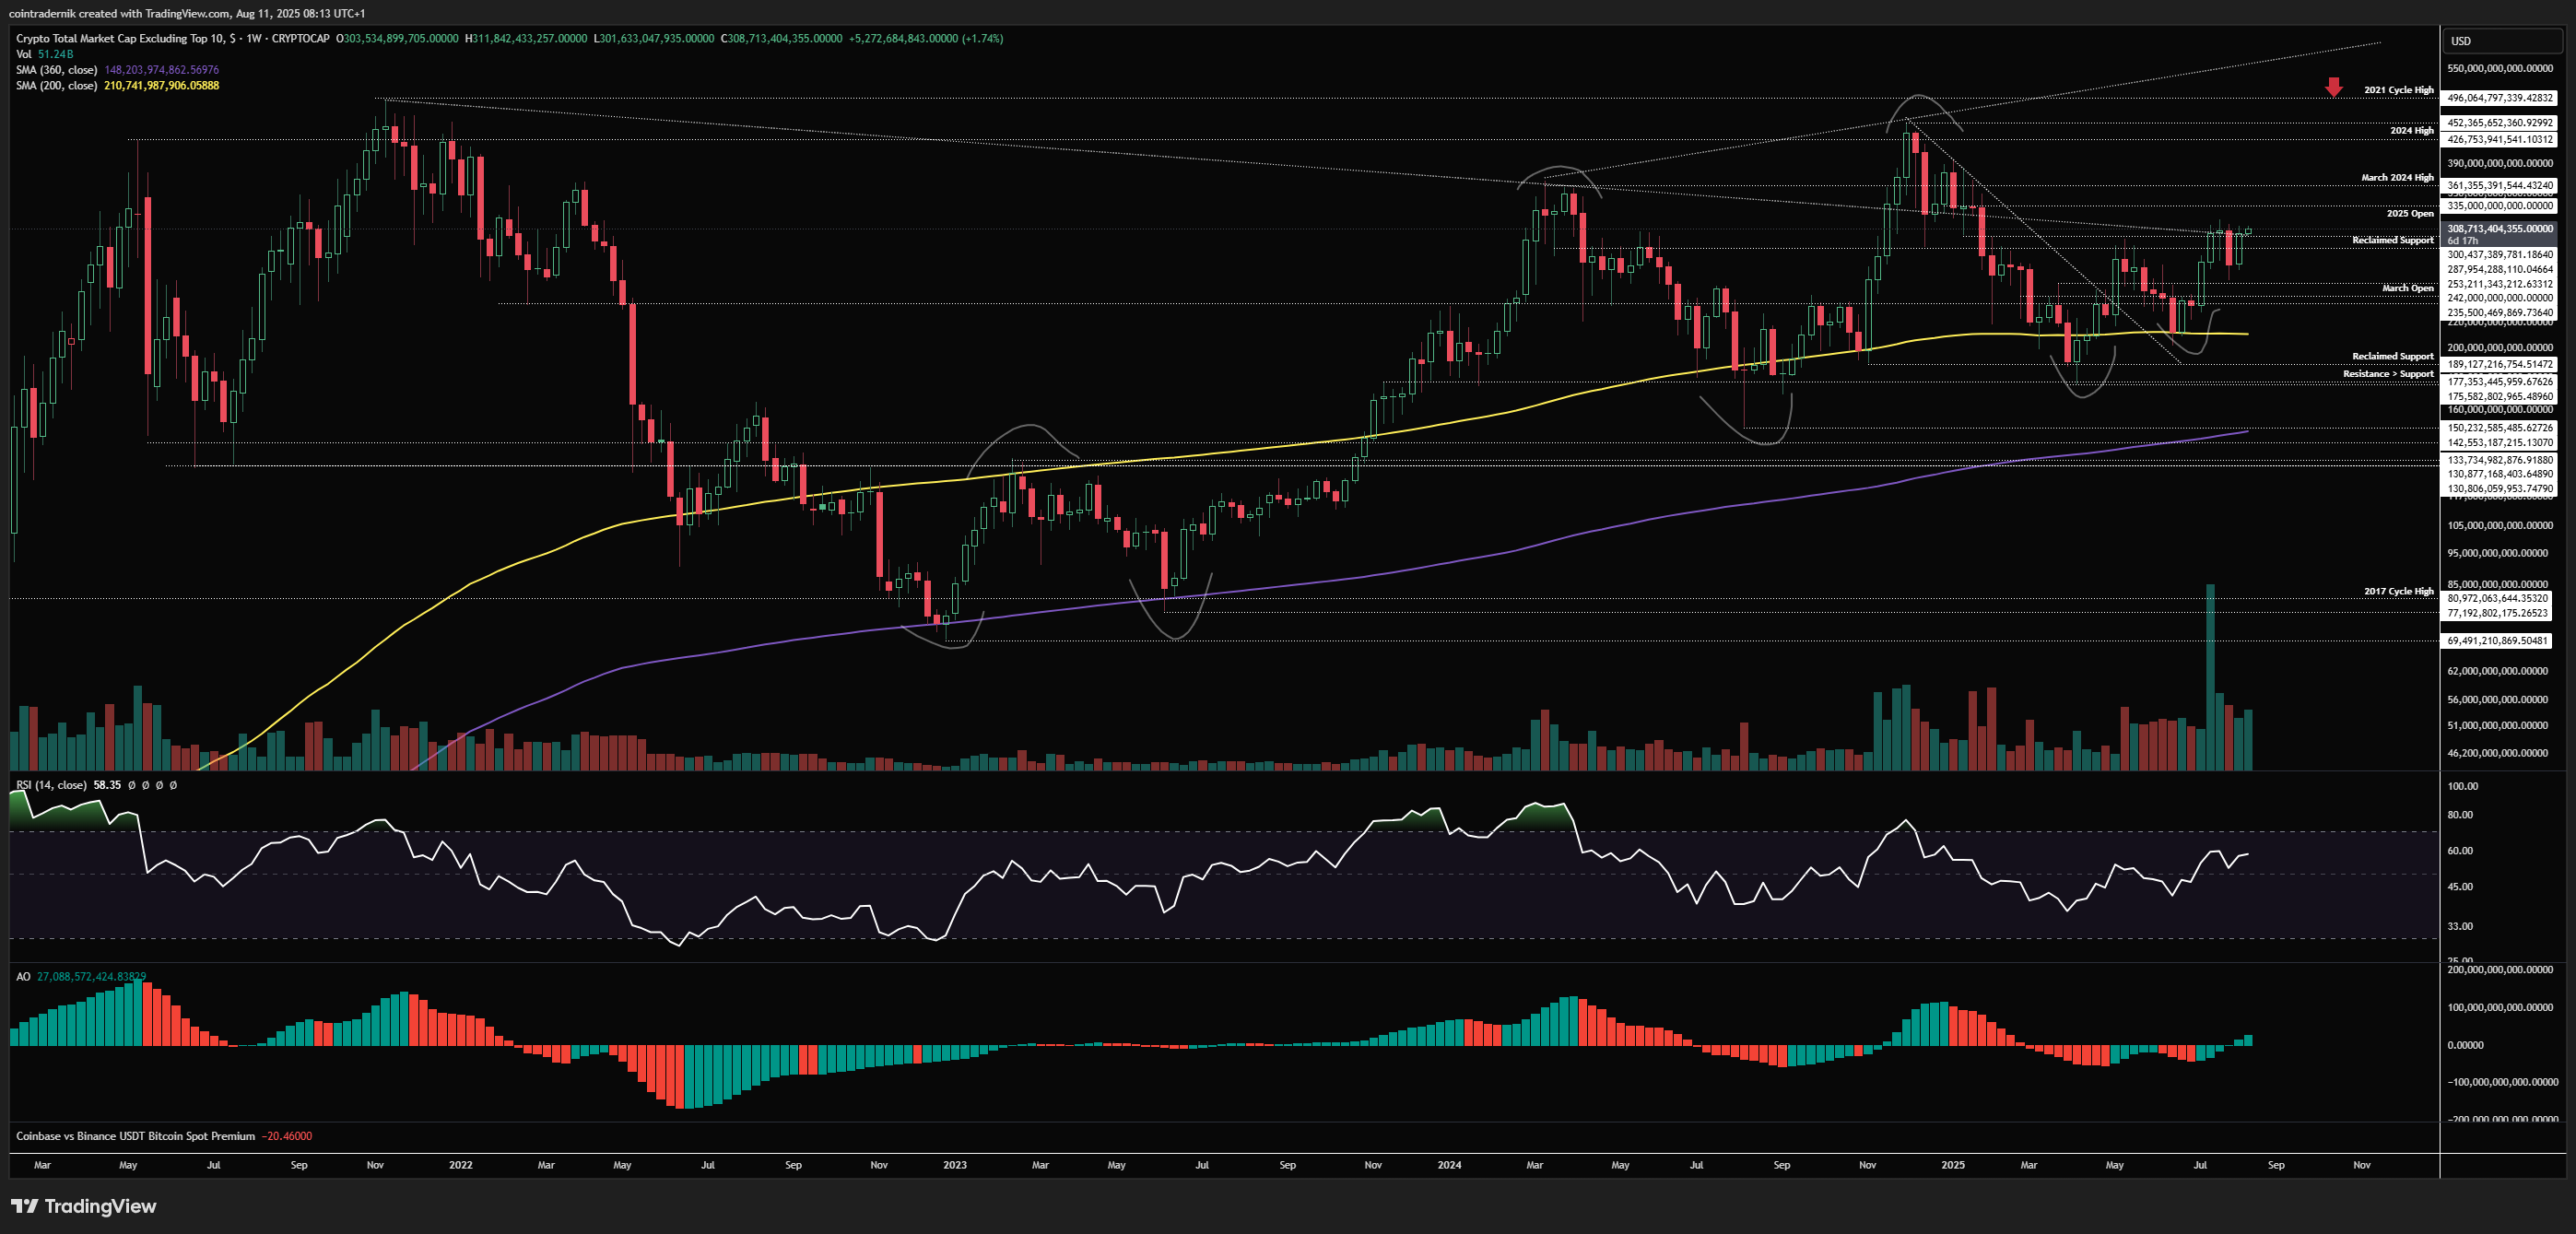
Looking firstly at the weekly for OTHERS, we can see that alts continue to mark out bullish market structure with building momentum on this timeframe, with OTHERS putting in a higher-;ow above $253bn a couple of weeks ago and then rallying off the open last week to close firmly back above $300bn. This was almost identical to the trajectory marked out late in July and we should now see this $287bn area act as strong support and alts to continue higher from here into that 2025 open at $335bn, above which we begin the ascent to the all-time highs at $496bn. Again, there is really nothing to be bearish on here when looking at momentum, market structure or price-action and this only changes if we now flip $253bn into resistance.
Daily:
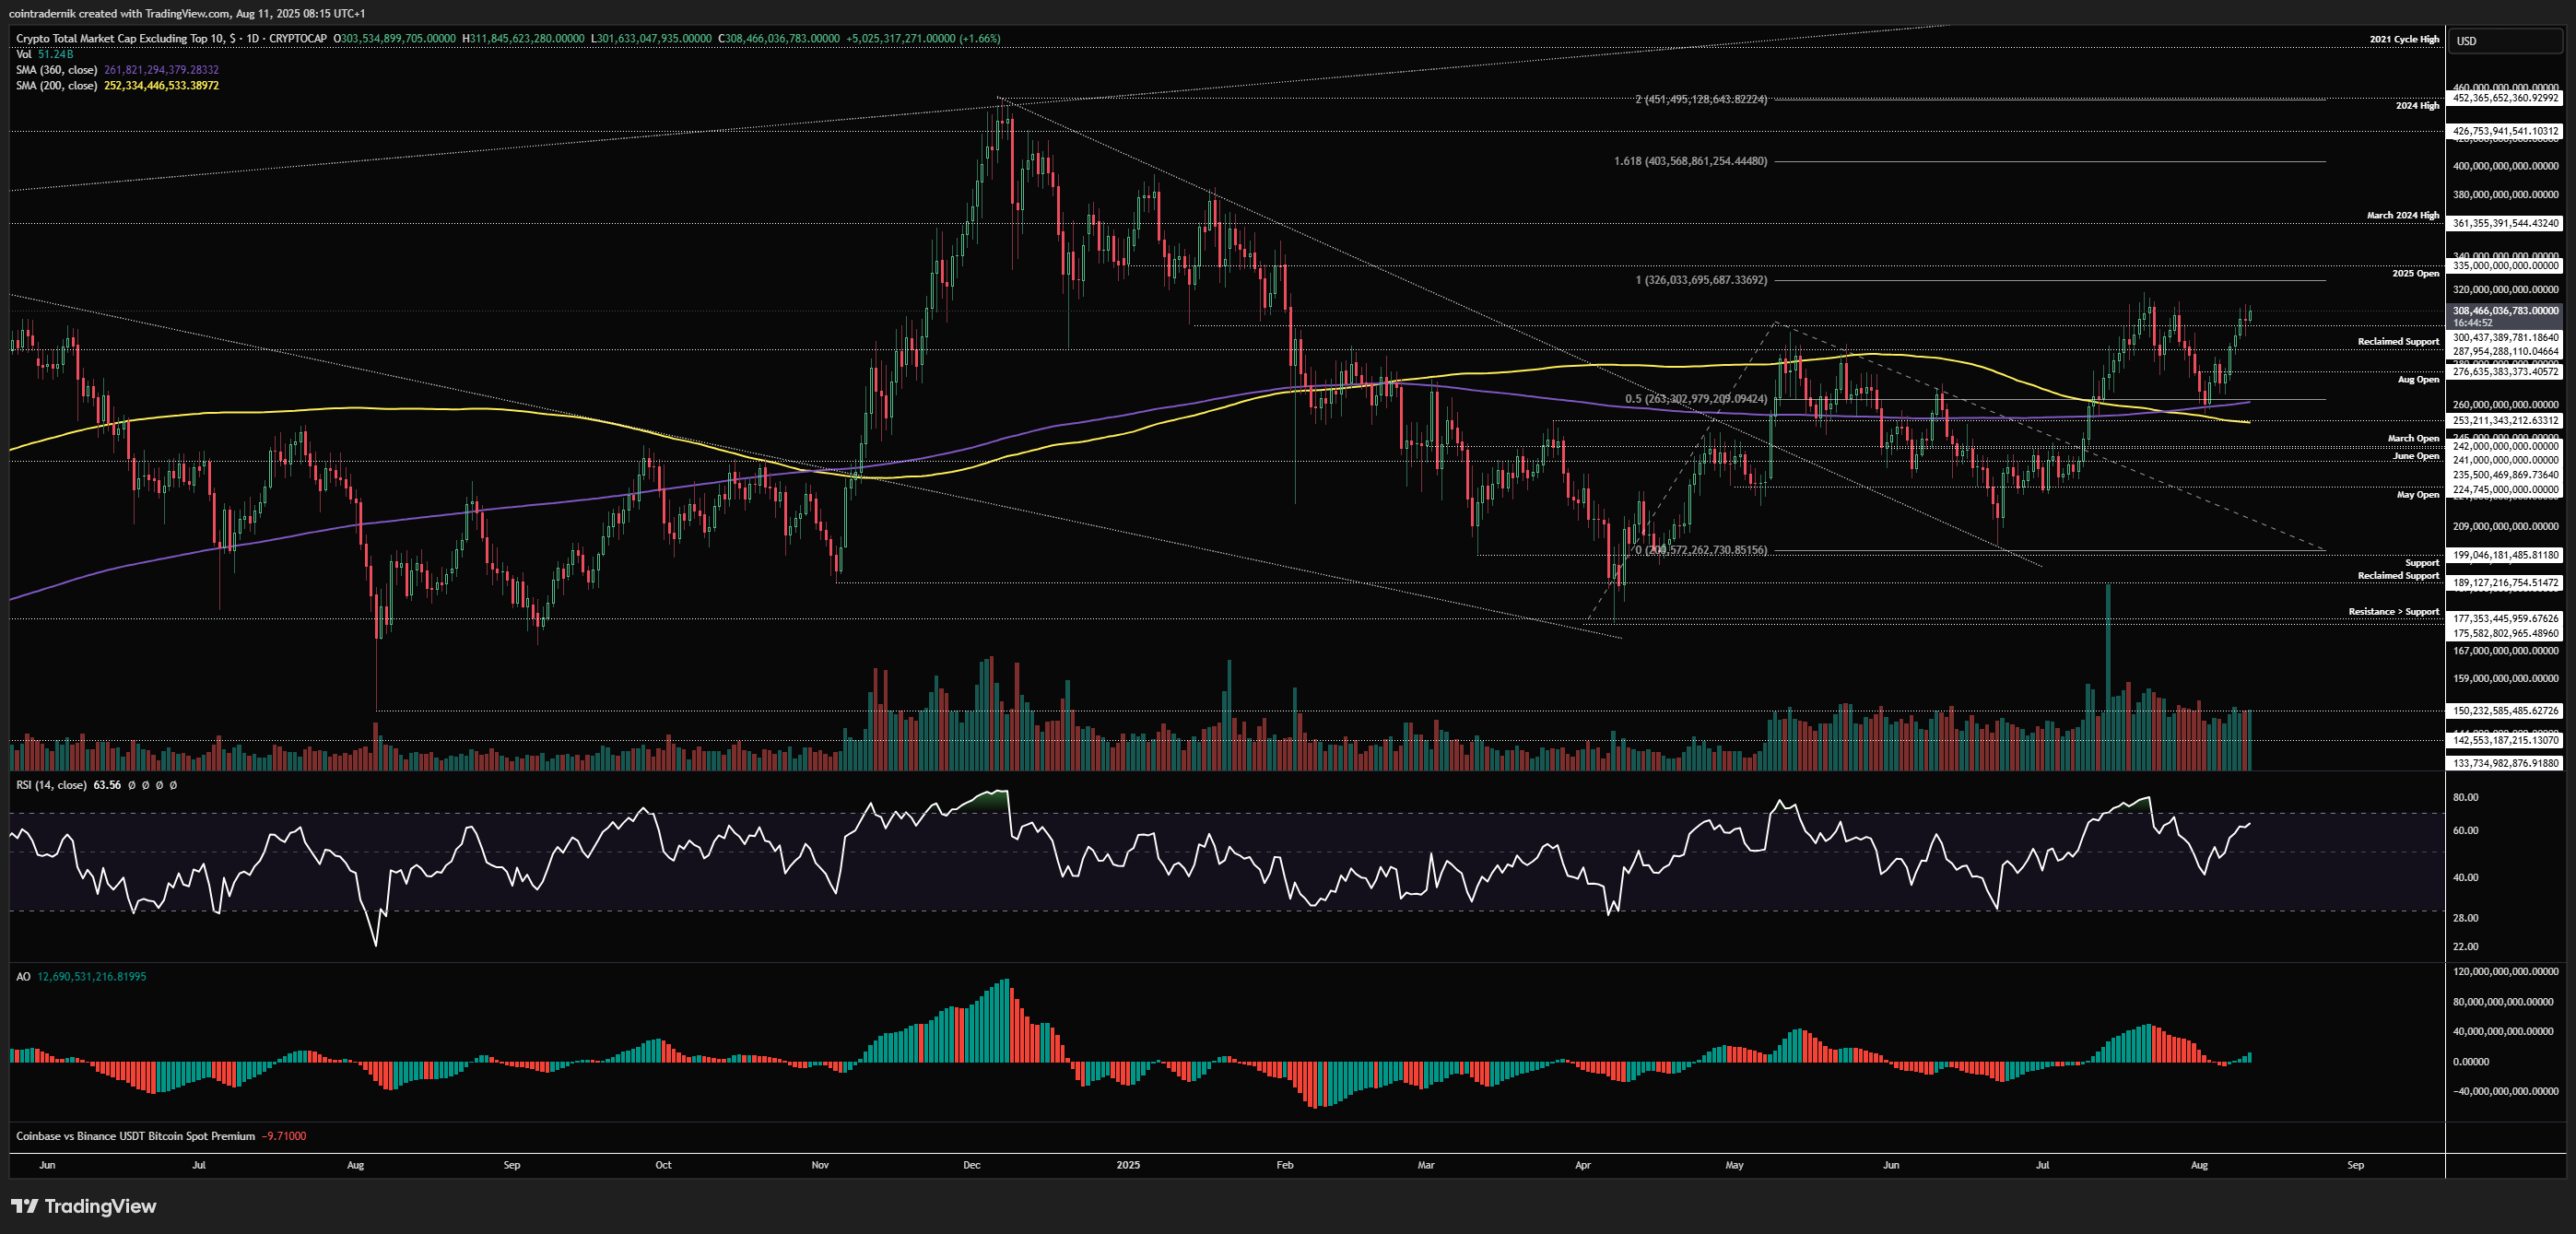
Looking at the daily, we can see that price bounced off that confluence of the 360dMA and 200dMA above $253bn and has since v-reversed back into quarterly highs, where we should now see higher-lows form above $287bn and OTHERS to continue through the yearly open at $335bn. Momentum here has reset with plenty of room for continuation higher and no signs of exhaustion. Invalidation on the bullish bias is very clean, as flipping $253bn support into resistance would turn structure bearish below the yearly open, which would open up further downside back towards the $200bn area. Looking at the trend since April, we should be pushing towards $400bn from here as the 1.618 extension, with the 200% extension aligning with the 2024 high at $450bn. I fully expect us to eclipse this level and the prior cycle high at $490bn in Q4.
OTHERS/BTC
Weekly:
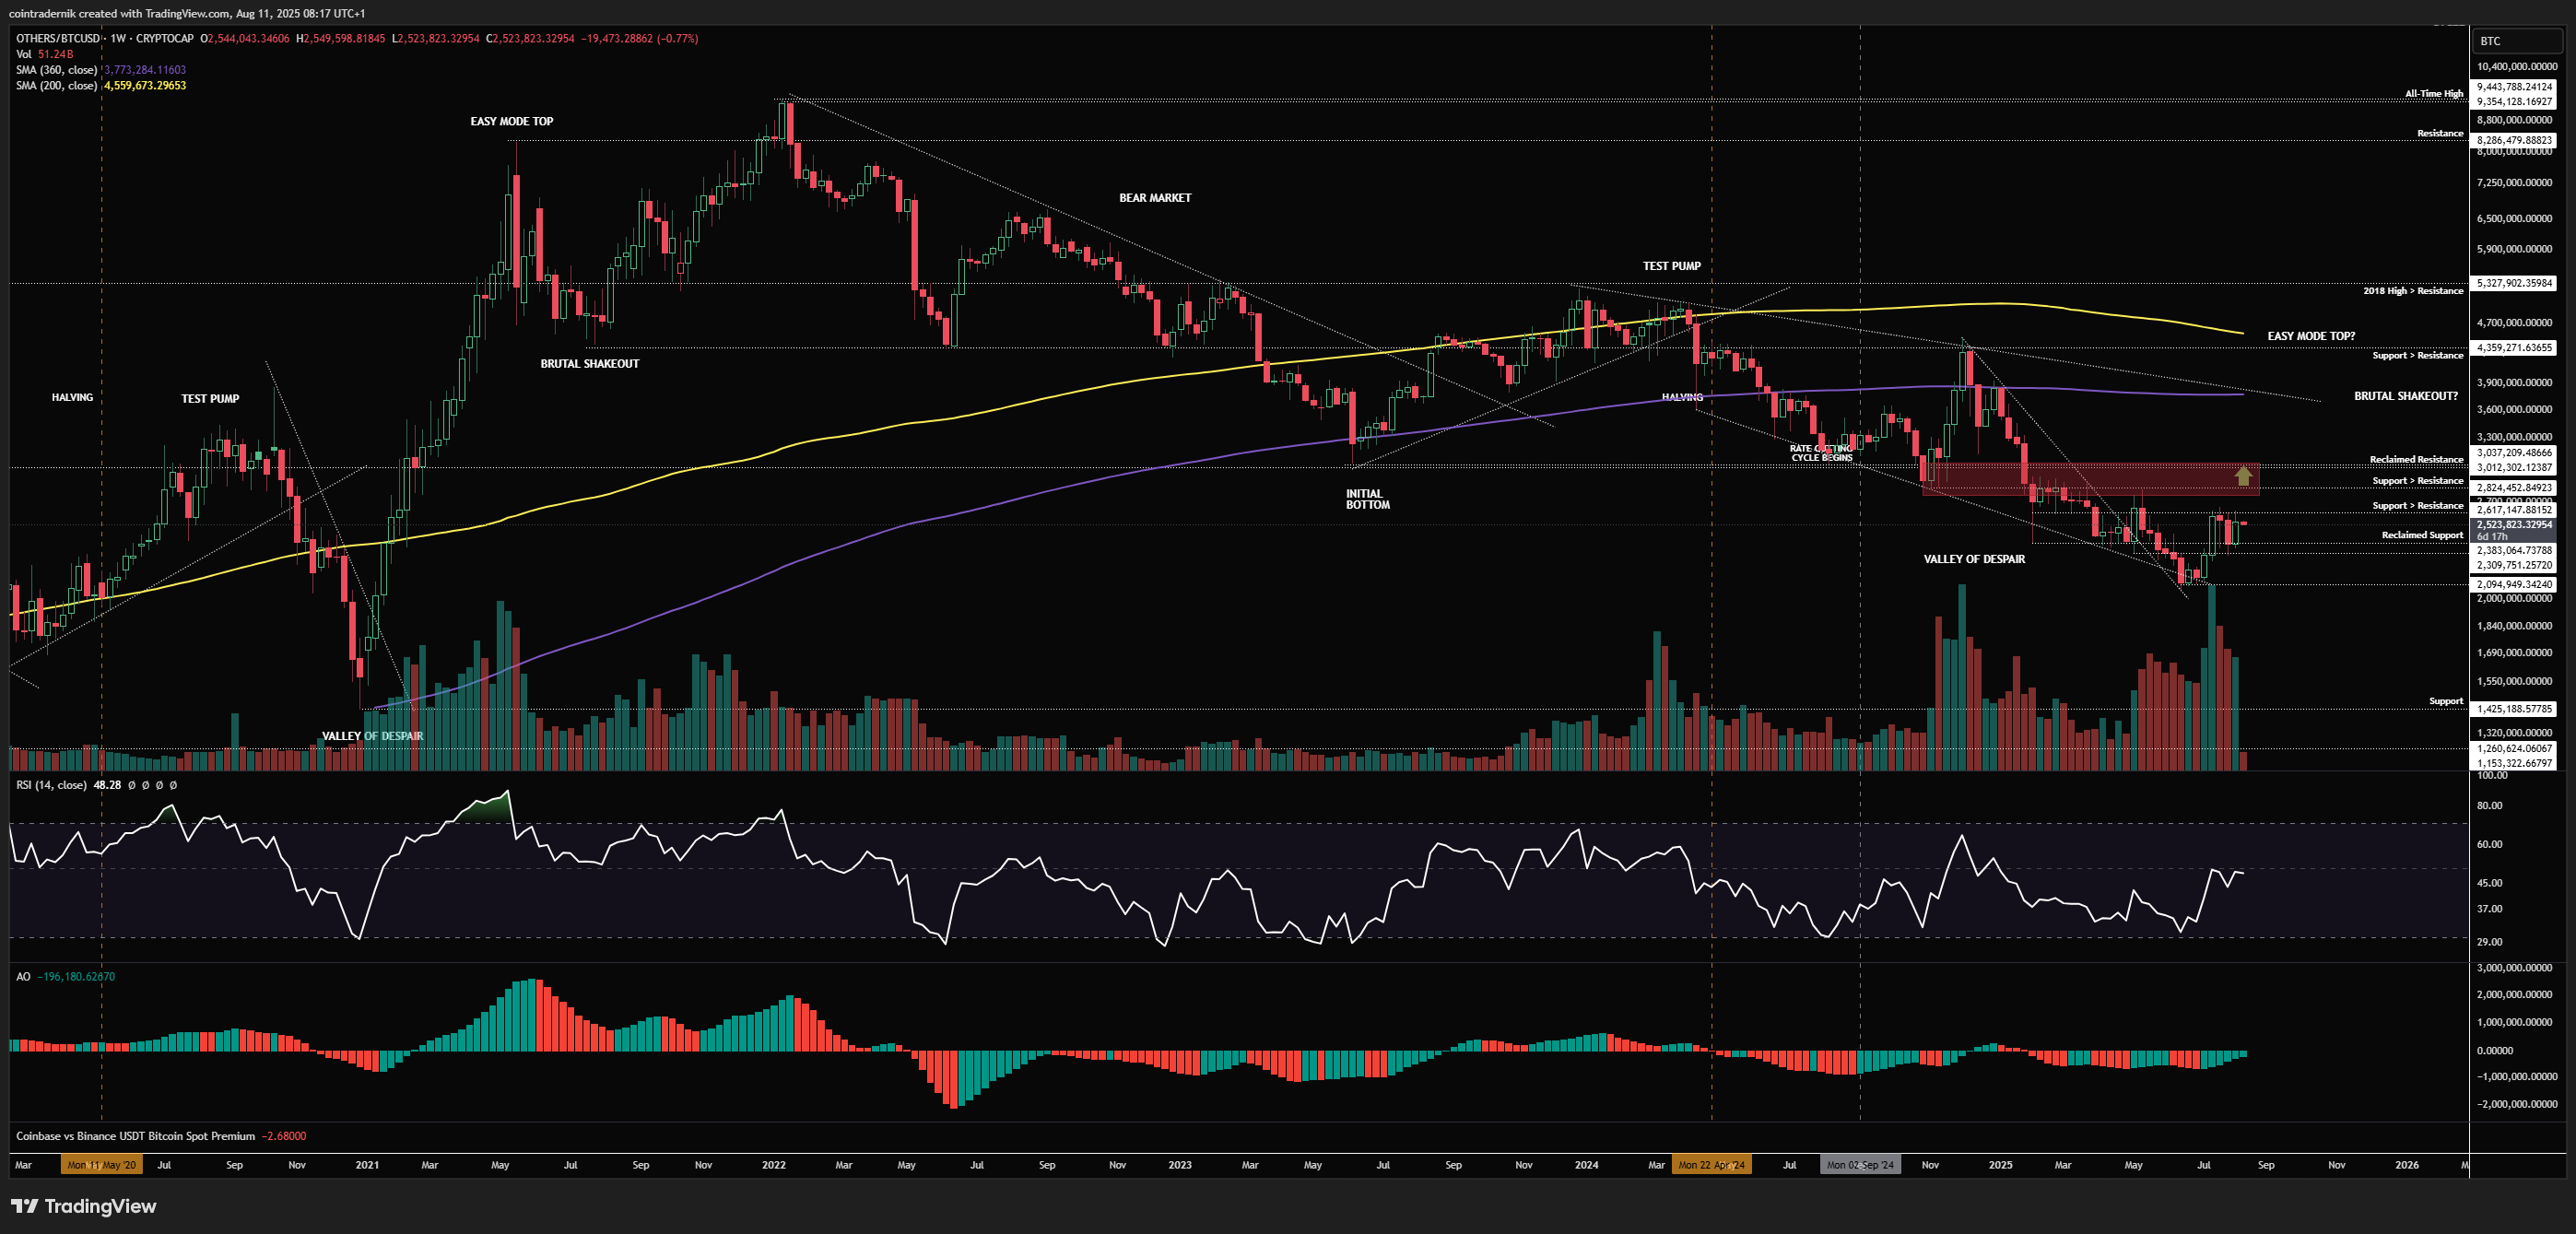
Beginning with OTHERS/BTC on the weekly, we can see that market structure is beginning to look more constructive, with higher-lows forming above 2.3mn BTC and alts now consolidating below the next level of support turned resistance. Breaking back below 2.3mn here would confirm this is a bull trap and we are likely to see further downside for alts vs BTC, but for now support is being respected after being reclaimed. A weekly close through 2.6mn BTC would open up that retest of major overhead resistance into 3mn BTC, above which we get clear skies for at least 20-25% of further upside for OTHERS/BTC.
Daily:
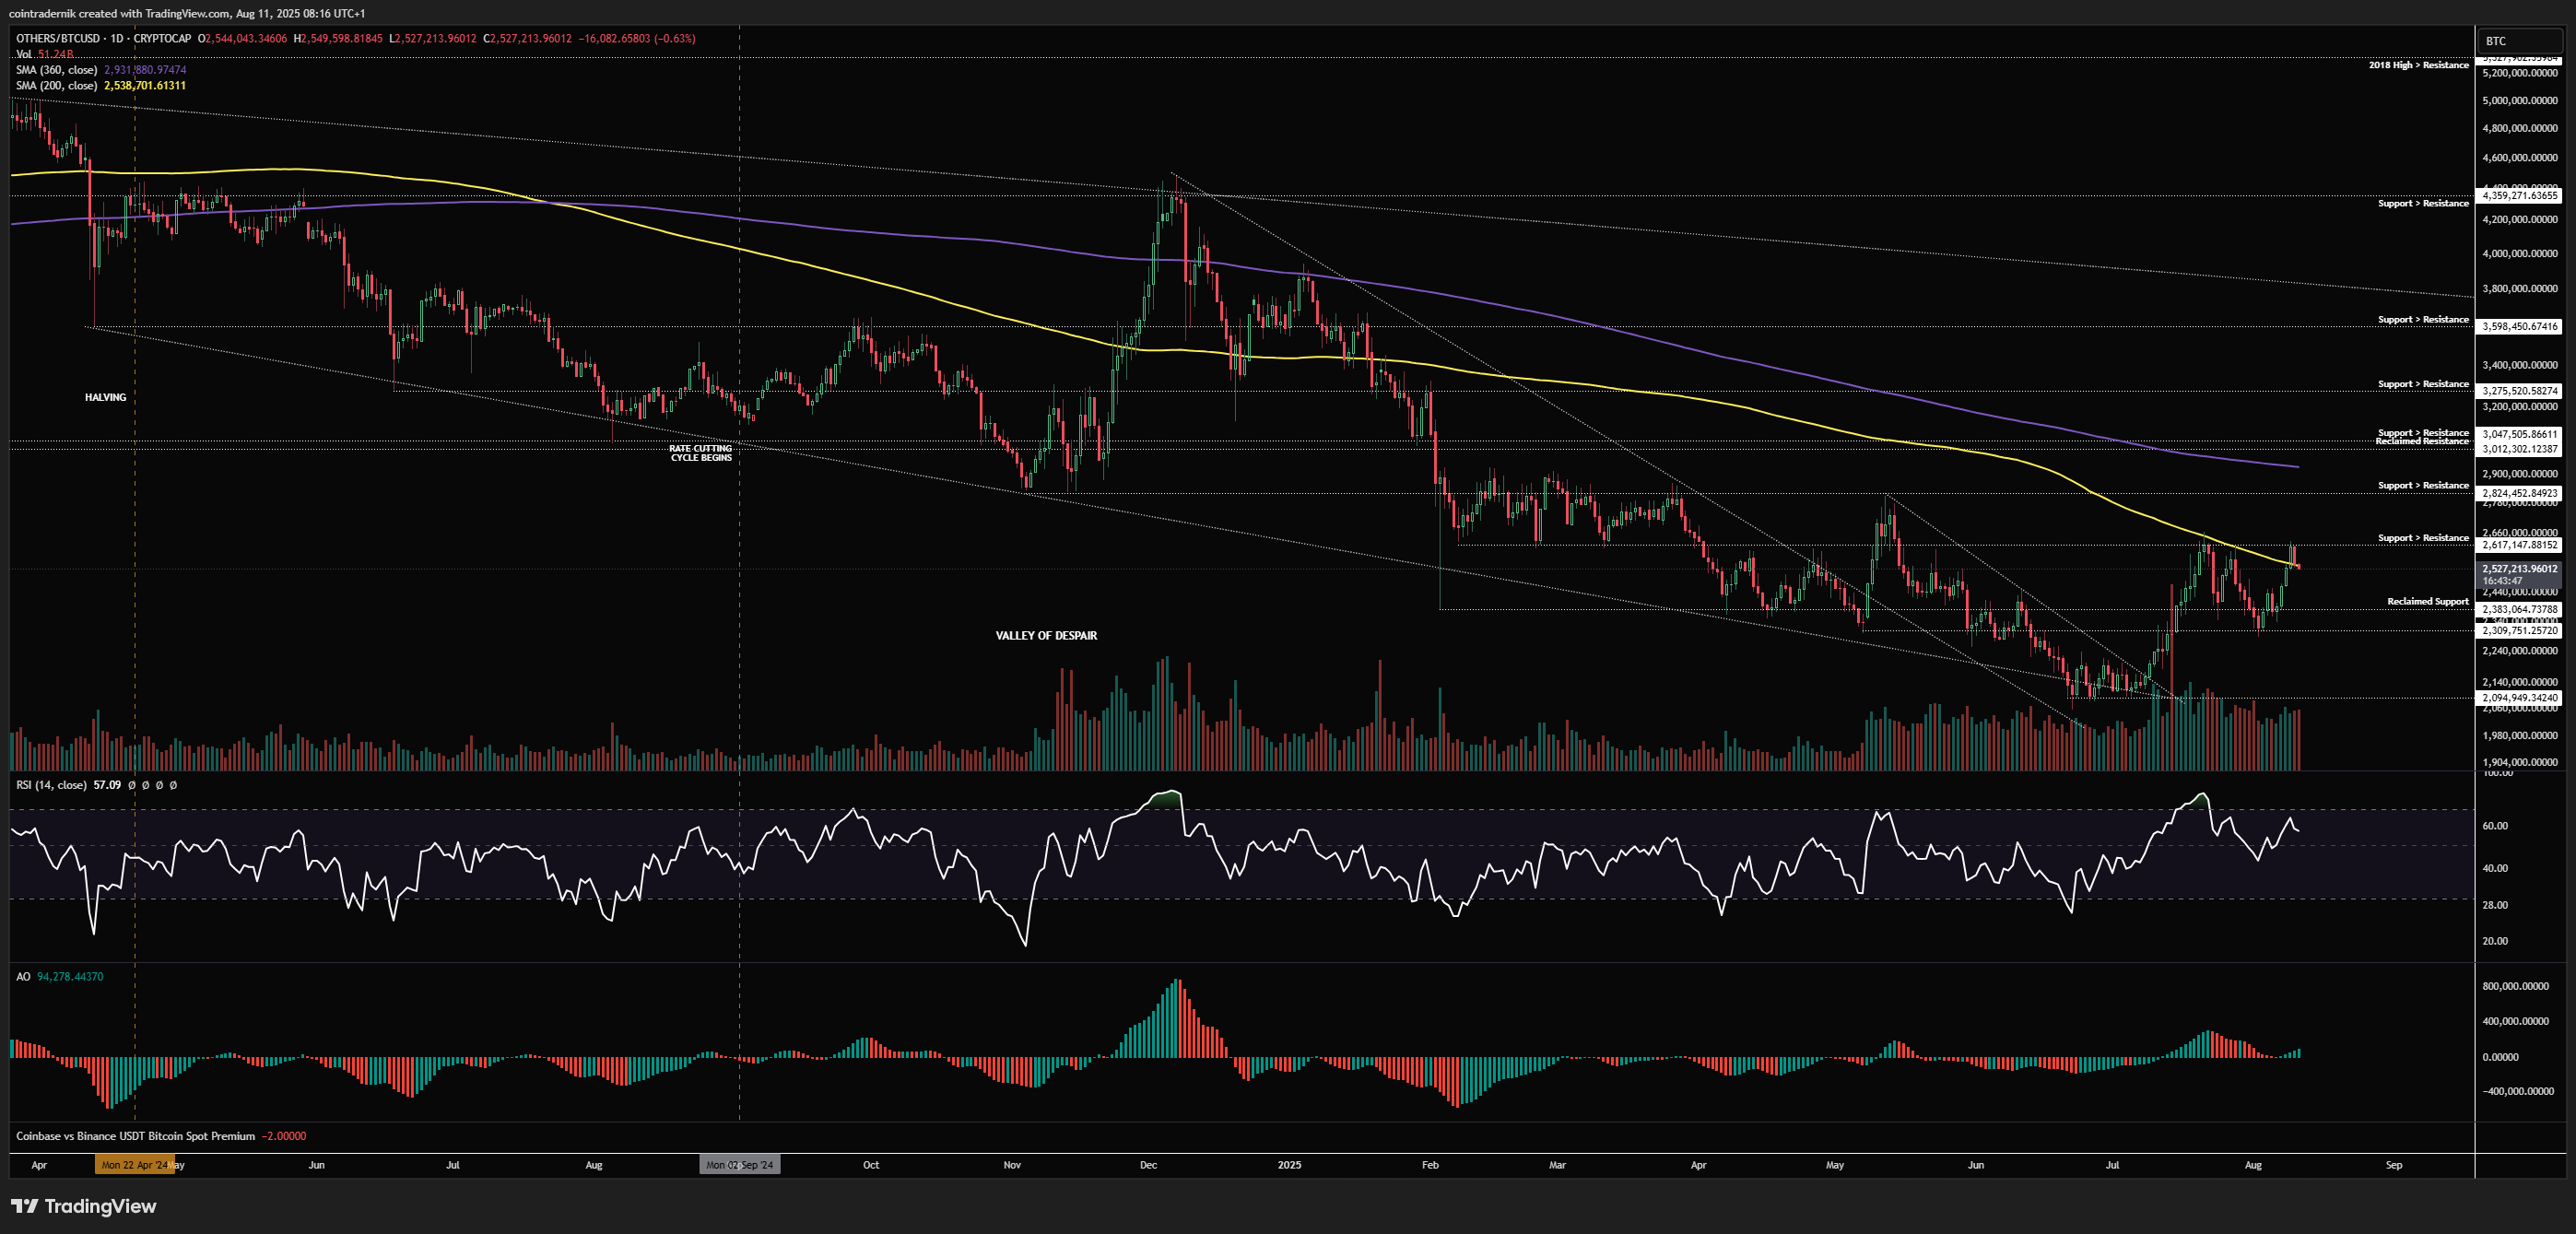
Finally, turning to the daily, we can see that alts have not broadly traded above the 200dMA vs BTC since the beginning of the year and that has just been flipped after two failed attempts, but we remain consolidating below resistance. Bulls want to see a higher-low form this week above last week's low and OTHERS/BTC to then break firmly through 2.617mn BTC, confirming bullish structure, with momentum also looking decent here. Acceptance above this resistance will lead to the 360dMA retest at 2.93mn BTC, which the market has traded below since December 2024. Flip that MA and the prior support level at 3mn BTC and we can shout 'altszn' from the rooftops, in my view.
I hope you've found some value in the read this week!
And if you've not already signed up for Ostium, please do so and test out some of the recent updates, including:
Sign up here (you don't have to use my ref link, of course): https://ostium.app/trade?from=CL&to=USD&ref=PRIRP

.avif)