

Market Outlook #65 - Oct NFP & Nov CPI
December 15, 2025
-
12
min read


This blog references an opinion and is for entertainment and informational purposes only. It is not intended to be investment advice. Seek a duly licensed professional for investment advice.
In this 65th Market Outlook here at Ostium Research, we'll be taking a look at the week ahead in markets, focusing specifically on price-action, positioning and event risk for Bitcoin, Ethereum, SPX and altcoins via OTHERS.
In next week's pre-Christmas Outlook, I'll be focusing on a mixture of single stocks and commodities for what I currently expect to be a strong Q1 for the latter, followed by the final Outlook of 2025 on Dec 29th, where I'll also be publishing a more comprehensive overview of what I am expecting of 2026.
Firstly, let's take a look at this week's very busy calendar that includes 3 interest rate decisions, alongside a huge amount of growth, inflation and labour market data, with the focus being on Tuesday's NFP report:
MONDAY: US NY EMPIRE STATE MANUFACTURING INDEX (DEC): (CONSENSUS 10.6 VS PREVIOUS 18.7)
MONDAY: VARIOUS FED SPEECHES
TUESDAY: US NONFARM PAYROLLS (OCT): (CONSENSUS 35K VS PREVIOUS N/A)
TUESDAY: US RETAIL SALES (MOM) (OCT): (CONSENSUS 0.2% VS PREVIOUS 0.2%)
TUESDAY: US S&P GLOBAL MANUFACTURING PMI (DEC): (CONSENSUS N/A VS PREVIOUS 52.2)
TUESDAY: US S&P GLOBAL SERVICES PMI (DEC): (CONSENSUS N/A VS PREVIOUS 54.1)
WEDNESDAY: VARIOUS FED SPEECHES
THURSDAY: BOE INTEREST RATE DECISION: (CONSENSUS 3.75% VS PREVIOUS 4%)
THURSDAY: ECB INTEREST RATE DECISION: (CONSENSUS 2% VS PREVIOUS 2%)
THURSDAY: US CONSUMER PRICE INDEX (YOY) (NOV): (CONSENSUS 3.2% VS PREVIOUS 3%)
THURSDAY: US INITIAL JOBLESS CLAIMS: (CONSENSUS 230K VS PREVIOUS 236K)
THURSDAY: US PHILLY FED MANUFACTURING SURVEY (DEC): (CONSENSUS 2.2 VS PREVIOUS -1.7)
FRIDAY: BOJ INTEREST RATE DECISION: (CONSENSUS 0.75% VS PREVIOUS 0.5%)
Now, let's dig into asset-specific price-action for the week ahead, looking firstly at Bitcoin:
Price: $89,834
Weekly:
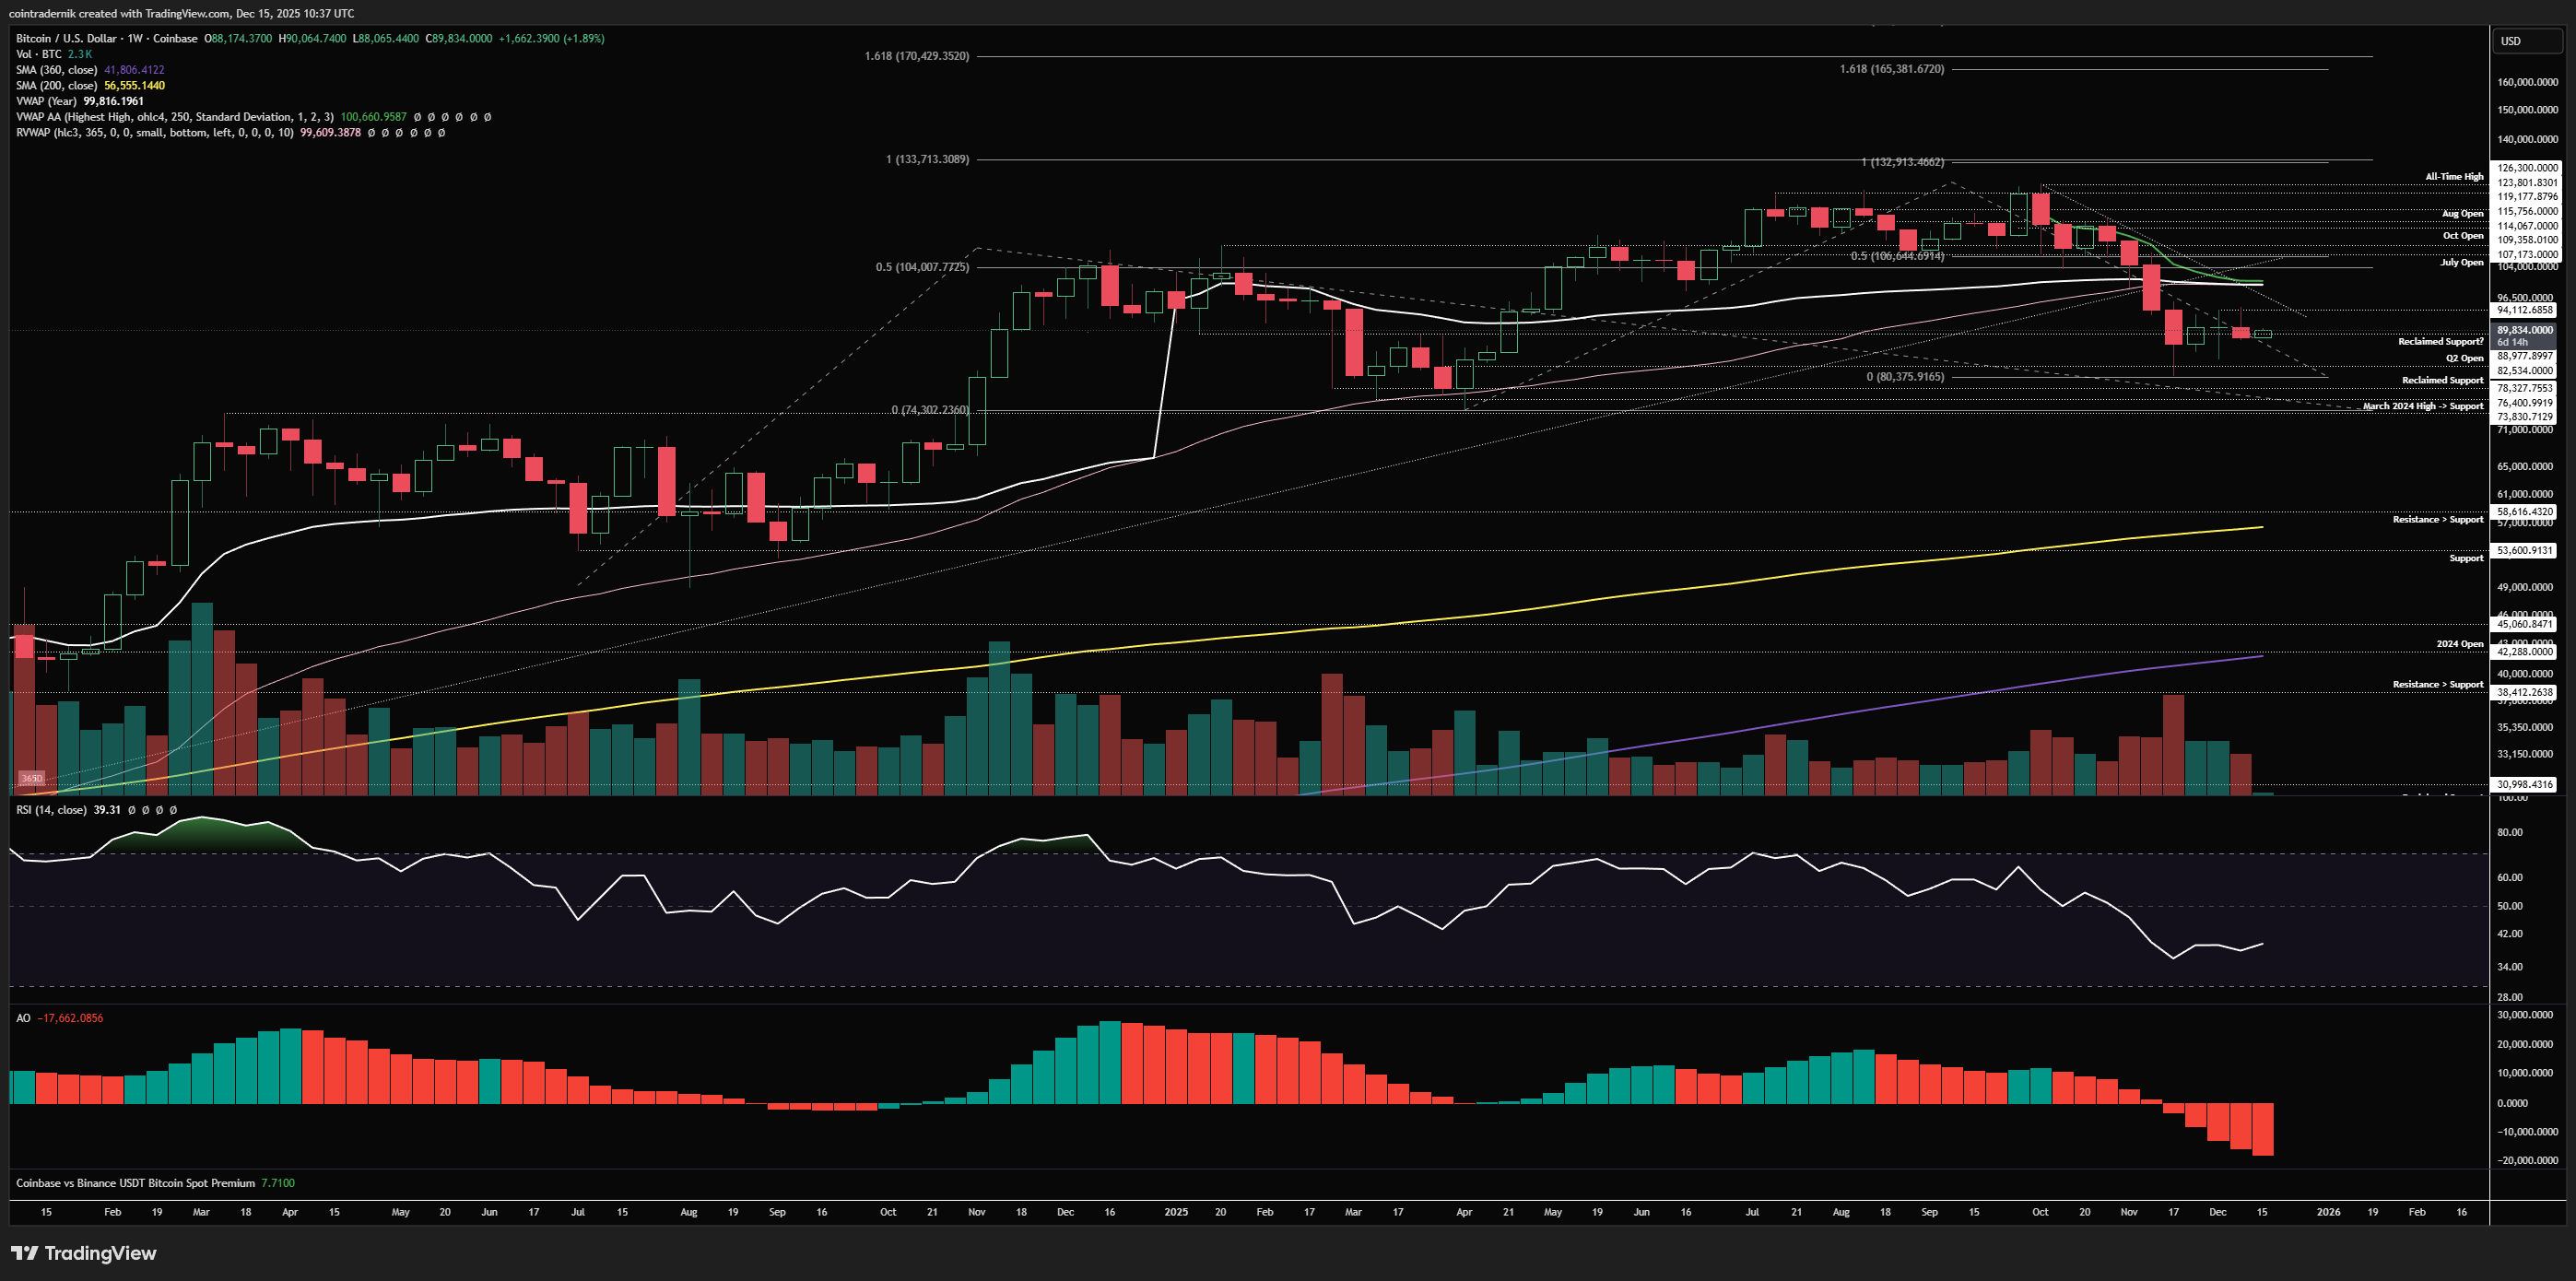
If we begin by looking at BTC/USD on the weekly timeframe, we can see that price continues to chop sideways after the Novembers lows formed, with last week taking out the prior weekly high, rejecting and closing at $88.2k, marginally below prior support. What we are looking for this week for the short-term bullish view to play out into year-end is for price to flip $89k into support and accept above last week's high at $94k, above which I think it becomes very likely we retest that major resistance zone between $99k-$101k later this month. Another rejection at last week's high and subsequent close below $89k would invalidate this view short-term, where I would then expect the bottom end of the range to be cleaned up first into $80k before a durable bottom is marked out, from which we move higher. In both cases, I will reiterate my view, which is that we remain in a 'higher for longer' market regime into H1 2026 and Bitcoin is currently in the bottoming out phase of another major correction within this multi-year bull market, and that we see new all-time highs above $125k rather than price accept below $74k. Obviously, a weekly close below $74k would be the first time this series of higher-highs and higher-lows from the 2022 bottom is invalidated by a lower-low, but, as contrarian and stupid as it might sound when sentiment is this poor and everyone is talking about an October 2026 4-year cycle low, I just don't think we're in that market regime, and much now points towards an above consensus H1 2026 for growth, inflation and liquidity that is not currently priced. Looking ahead, if and when we do trade $100k, I think that's where the noise will grow deafening around a complacency shoulder and, as price marks out a higher-low and then flips $100k into support, the disbelief will be palpable. That's just how I'm seeing things at present and my spot positioning in crypto reflects this. I still have no levered exposure to Bitcoin outside of the intraday/intraweek setups I take, but I'm getting close to a long Bitcoin / short Silver pair trade for the coming months.
Daily:
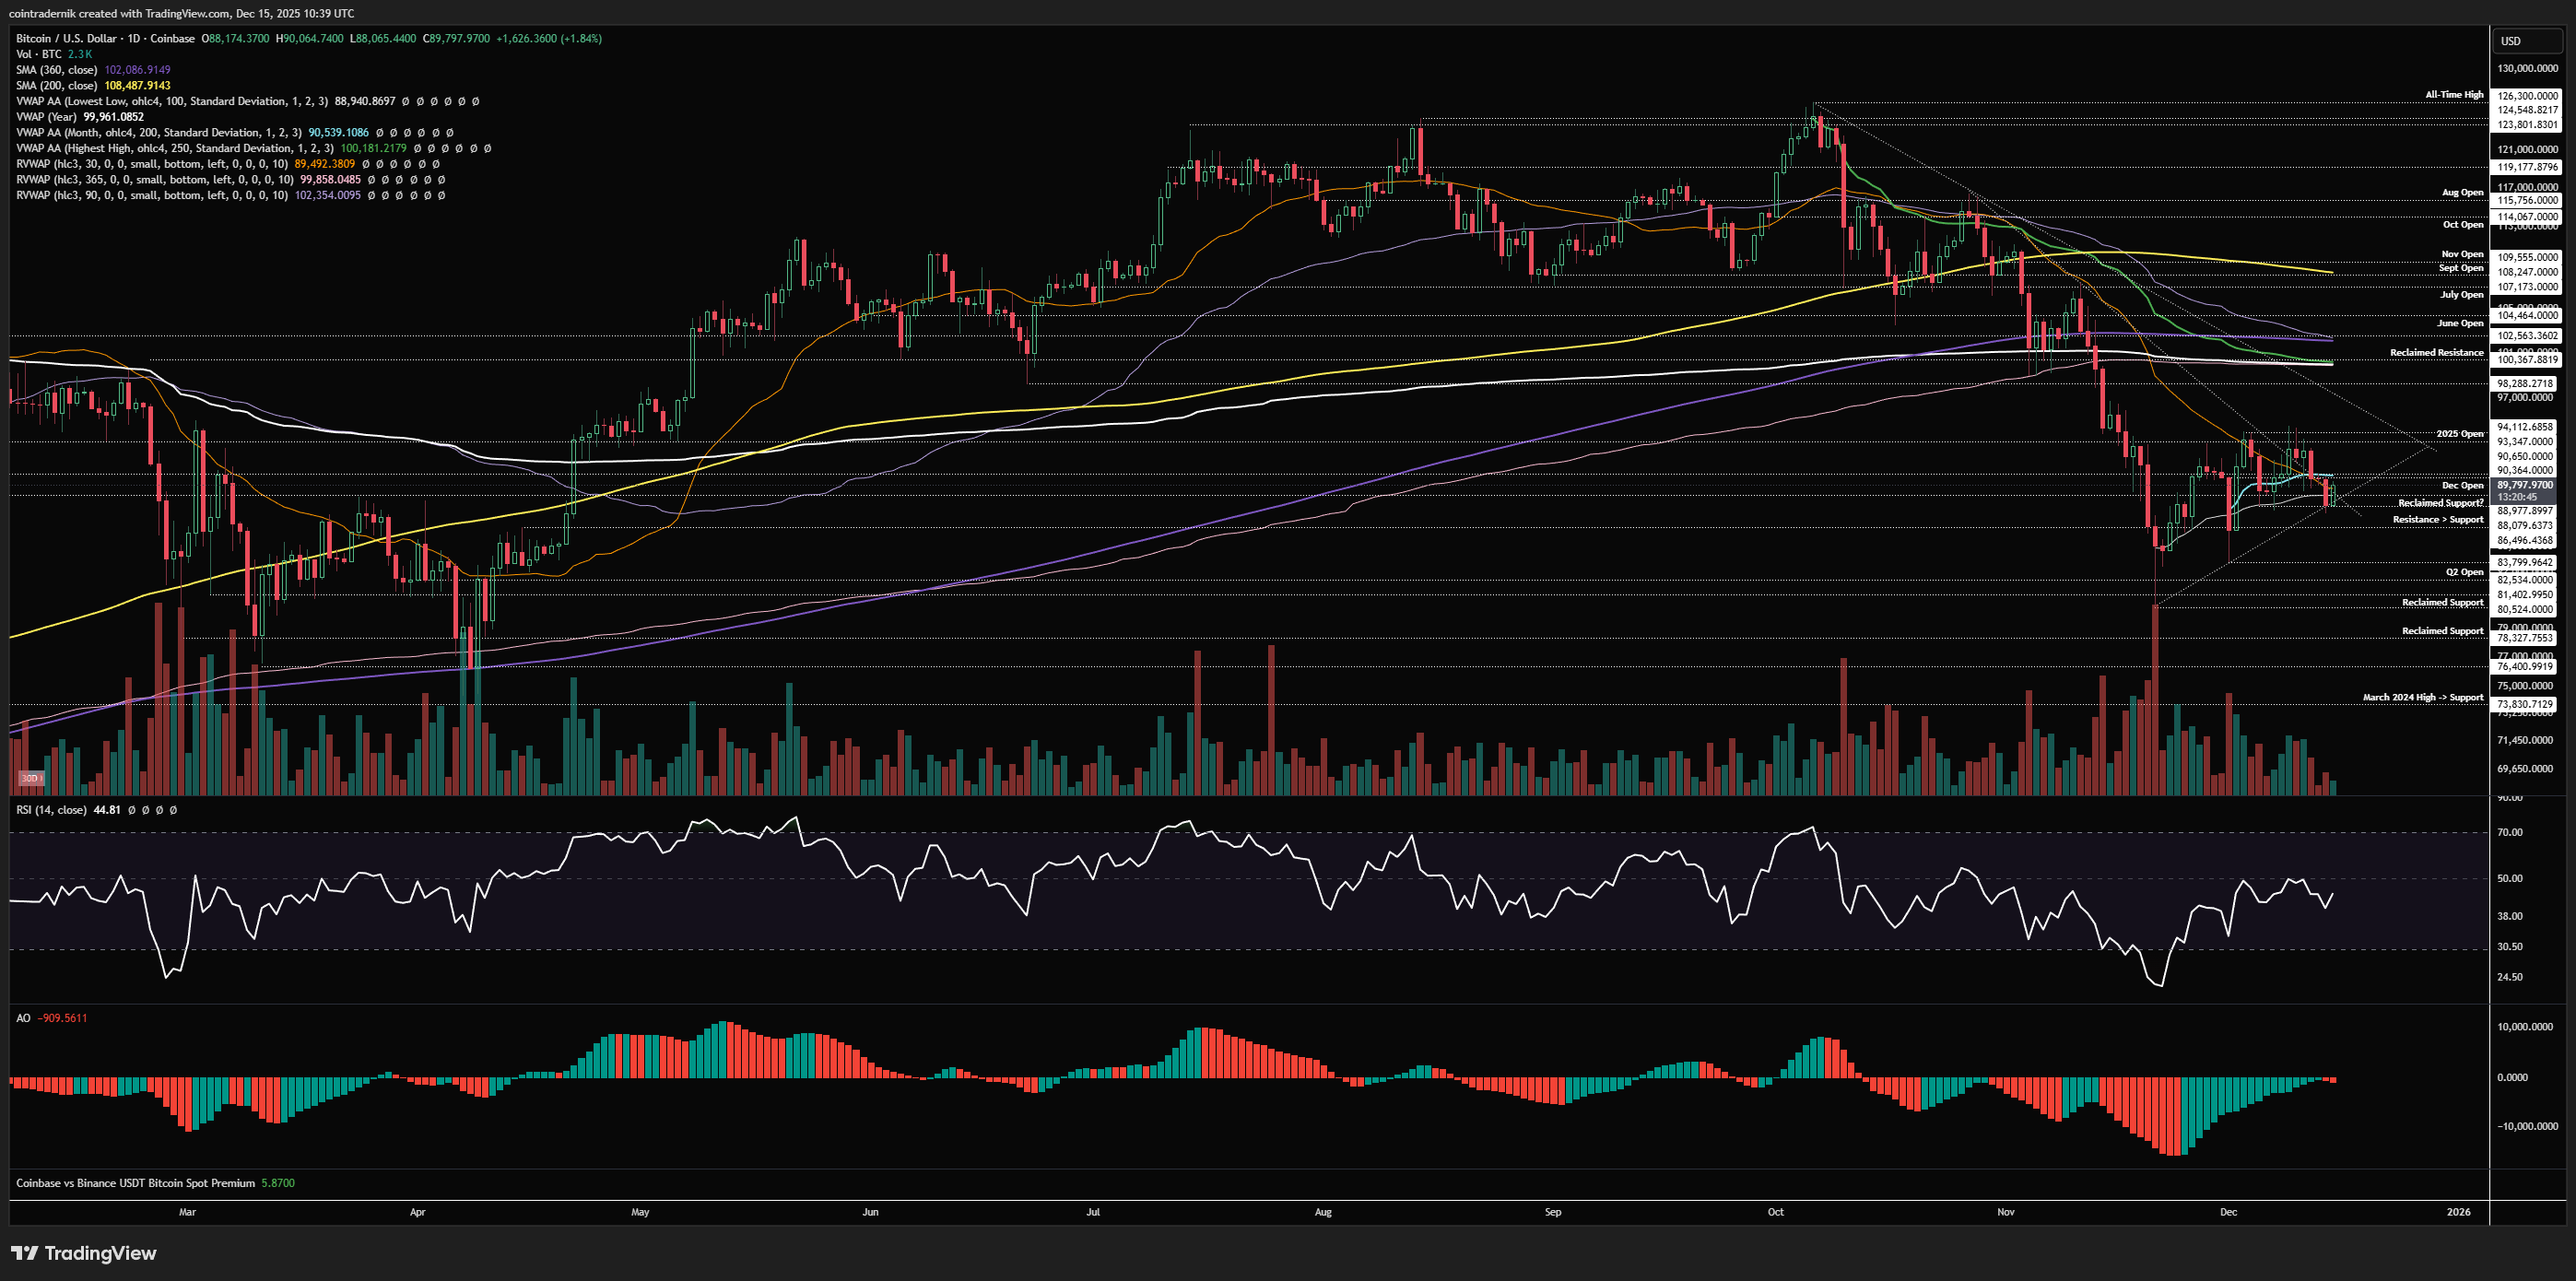
Turning to the daily, we can see the sort of bear flag / ascending triangle that every man and his dog are watching, with emphasis on the former if you are bear-biased and emphasis on the latter if you are bull-biased. To be honest, I think neither is compelling and rather I want to see how price trades this week given the huge amount of key data around the labour market and inflation. A goldilocks scenario this week for risk would be marginally below consensus labour data (especially since it is an October report, so very much backwards-looking) and a below consensus CPI number, making last week's FOMC that re-cemented an emphasis on the labour market over inflation as prescient and thus allowing for more easing to be priced into the forward curve, where I currently believe we are probably two cuts shy of what actually needs to be priced for 2026. I think this would also allow long-end yields to fall again, as well as further downside in the Dollar, and we likely see risk bid into end of year. That's the bullish outcome for this week. The bearish outcome is a very hot NFP print that blows out the long end (although I think this is less likely to be a massive issue as Powell already framed the reports as overstating jobs gained), or a negative print that stokes recession fears, but coupled with an above consensus Nov CPI report that then causes a knee-jerk risk-off move as the market feels the Fed has their priorities all wrong and the forward outlook grows more uncertain. I do think the CPI report will be weighted more heavily than NFP, primarily because of its recency vs the October jobs report, but also because inflation that is 'under control' just allows for smoother sailing into Q1 across the board, from forward guidance to risk appetite. Now, with all that said, looking at Bitcoin's price-action, we have higher-lows forming with the anchored VWAP from the Nov low acting as support, as price breaks below it and immediately breaks back above. We are below the monthly VWAP and the Dec open again, so flipping that at $90.4k into support this week would be a good start, and if we do test that yearly open for a third consecutive week I don't think it holds as resistance and I think we rip through it and run for $99k. As mentioned above, if we do reject up there again, I think we take out all of these lows towards $80k again before any further upside attempts. If we reject at $90.5k this week and can't even flip that level, a move below $87k then opens up that next leg of downside into $80k and likely lower into $78.3k, where I would very much be looking for levered longs.
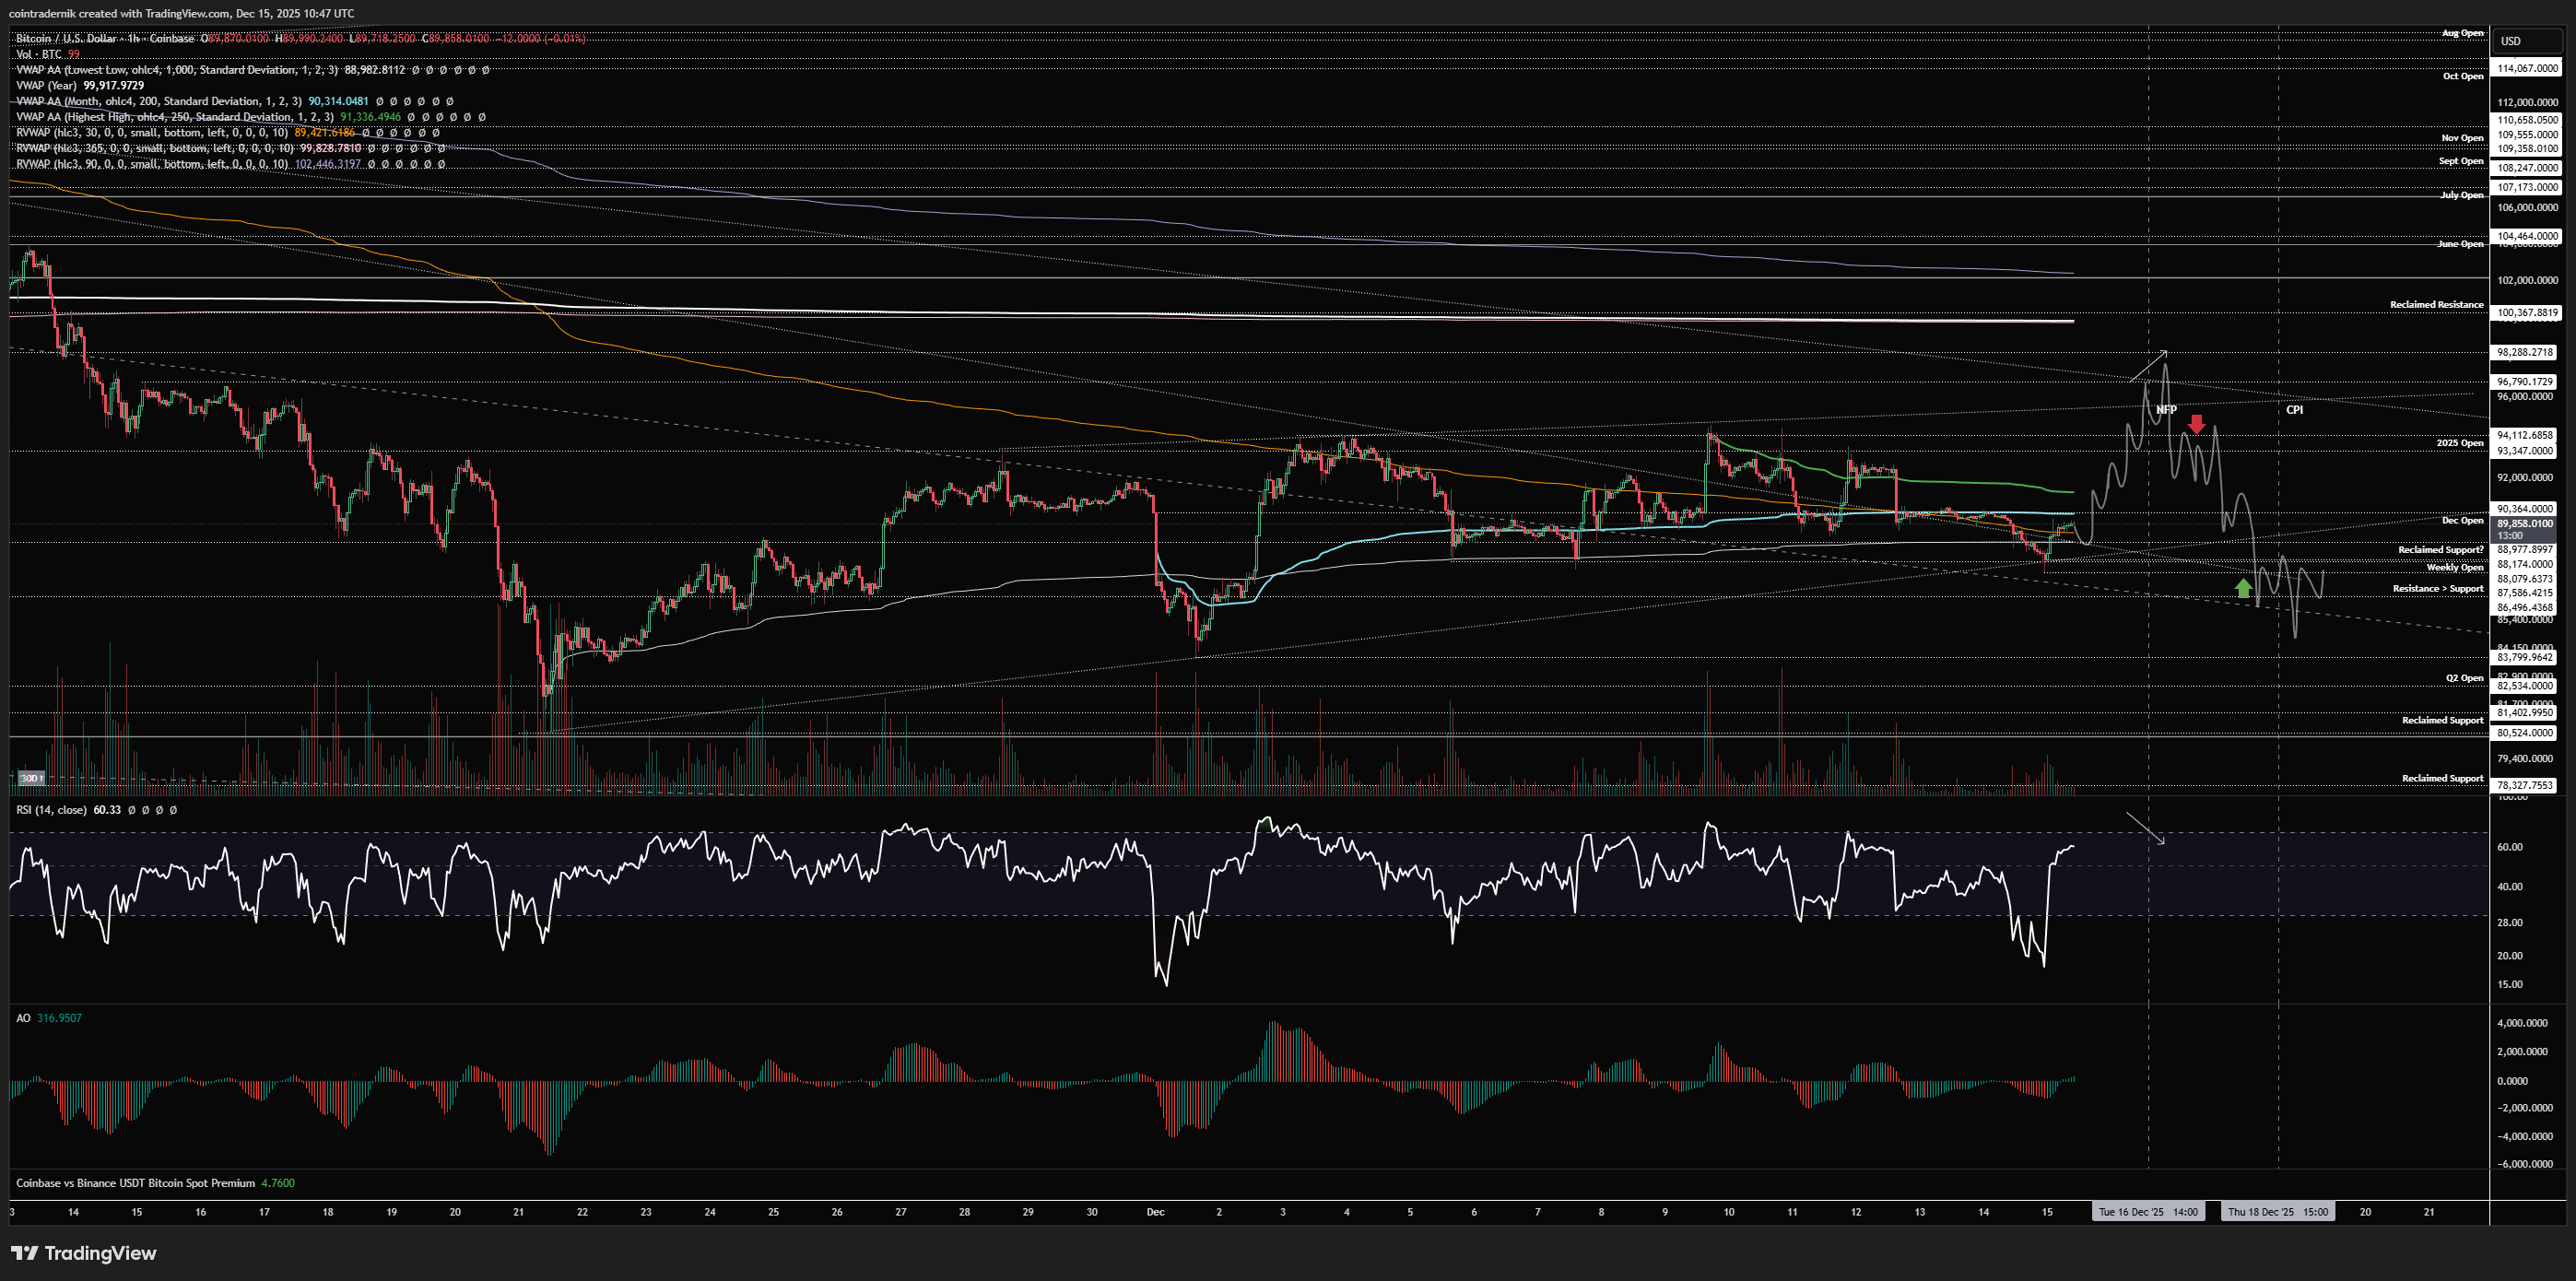
Now, looking for intraweek setups with all the volatility that we could have this week is not ideal, but if we push above the monthly VWAP but reject and then rug pull fast post-NFP, I would bid a sweep of the weekly open and subsequent reclaim before CPI:

On the short side, I would prefer to see us take out last week's high and the form some trend exhaustion, then fade if we close back below the yearly open, looking a weekly open retest. This doesn't have to occur right around the jobs report - it's just the trajectory and the reaction with momentum divergence that I am looking for:
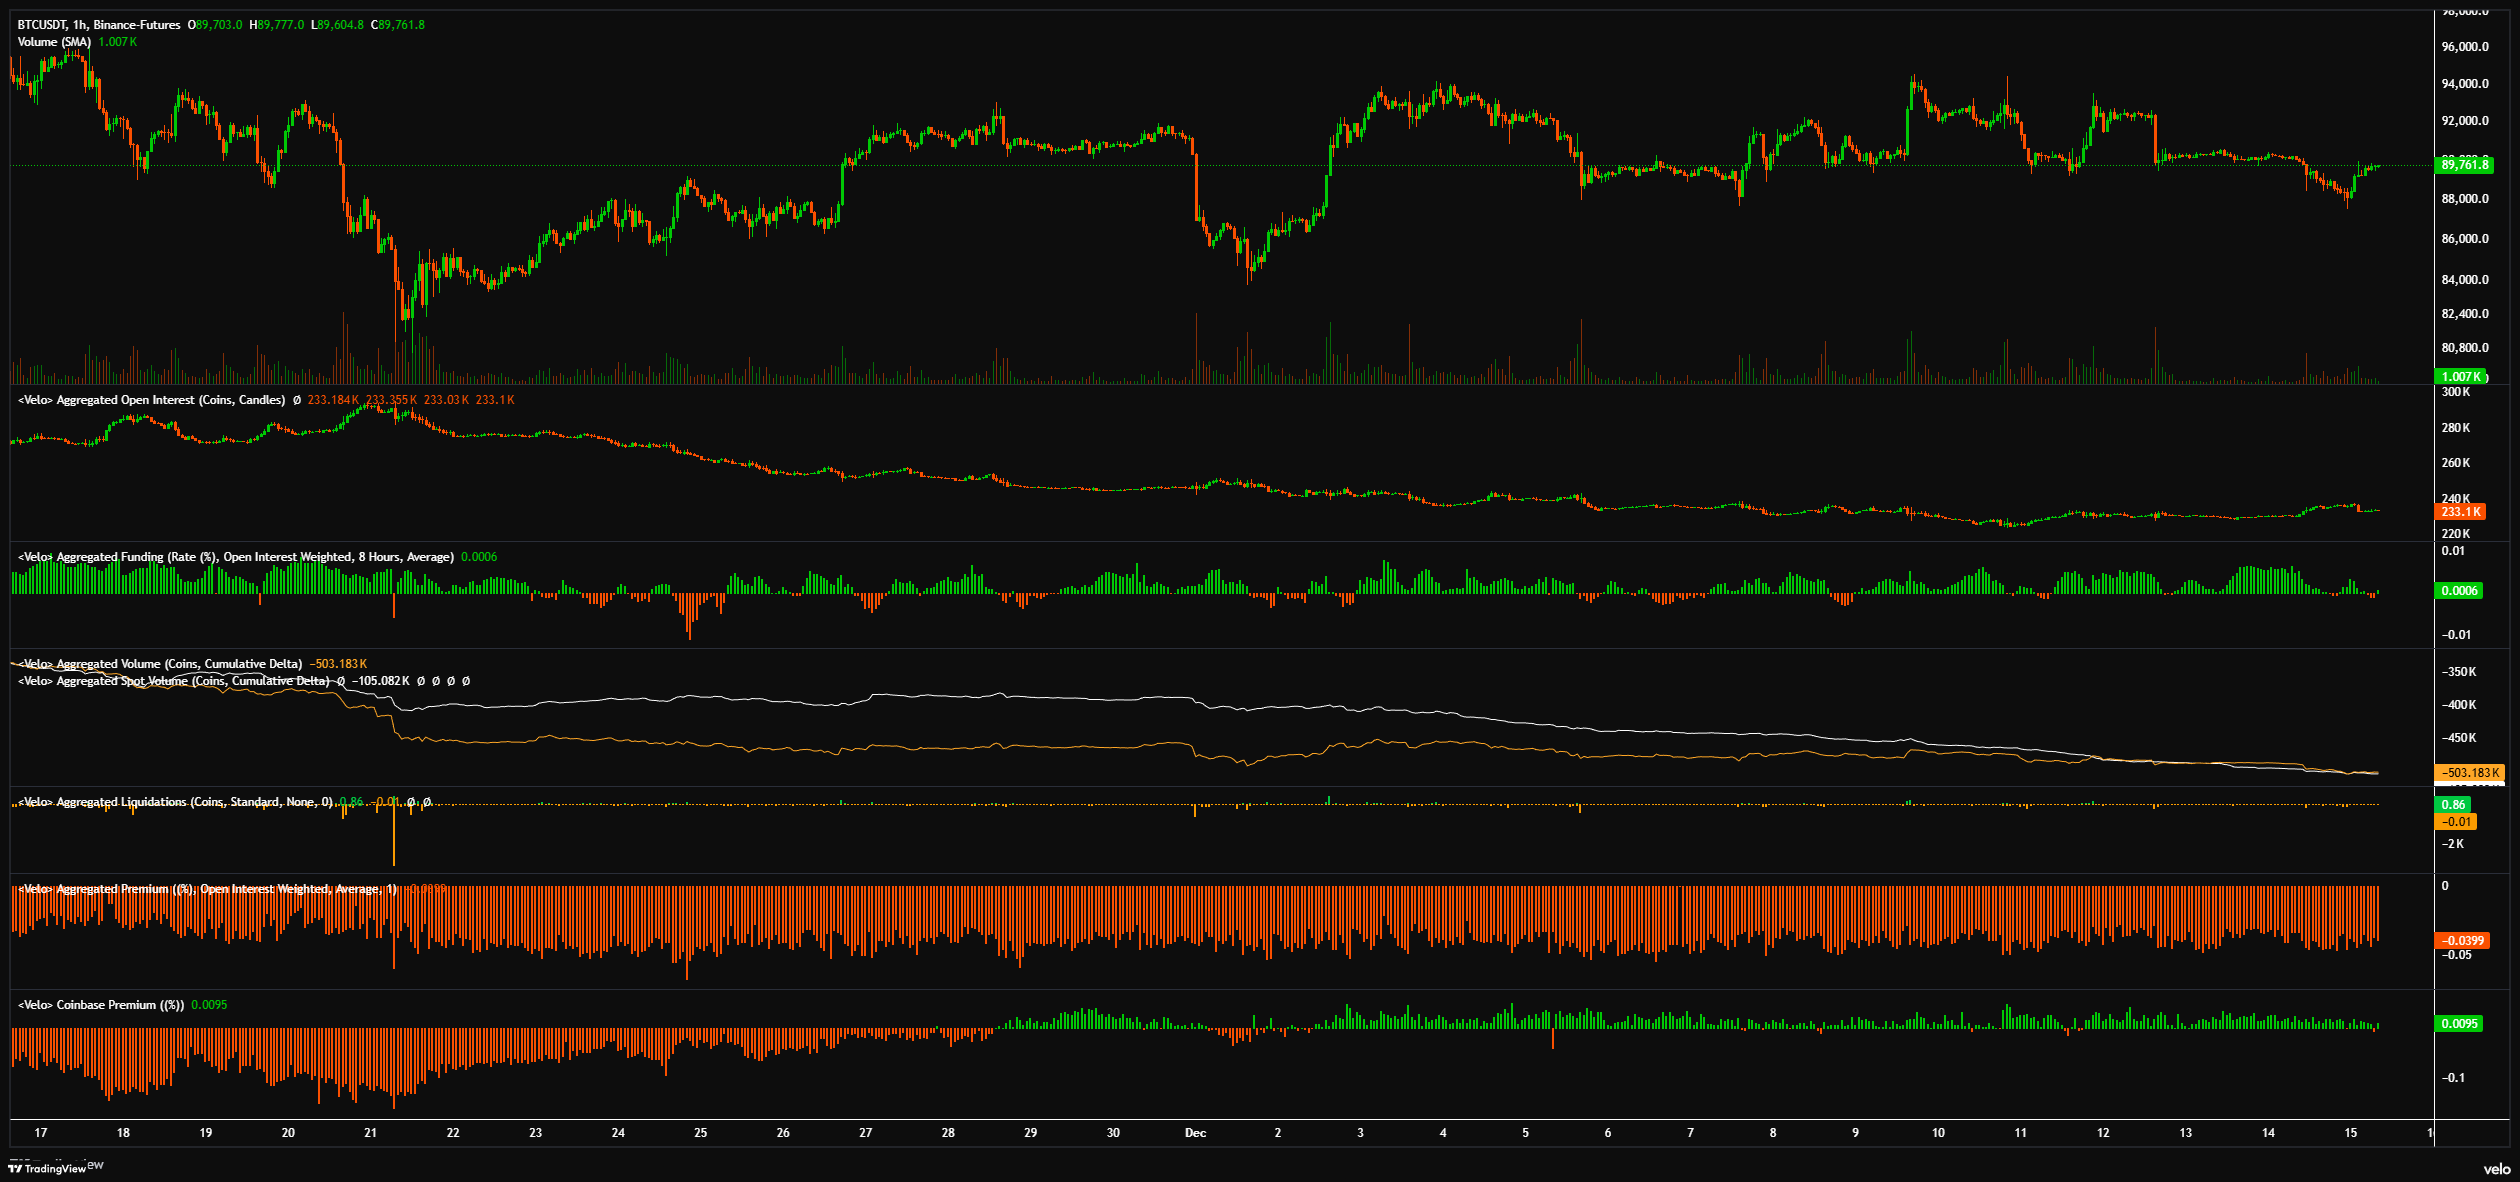
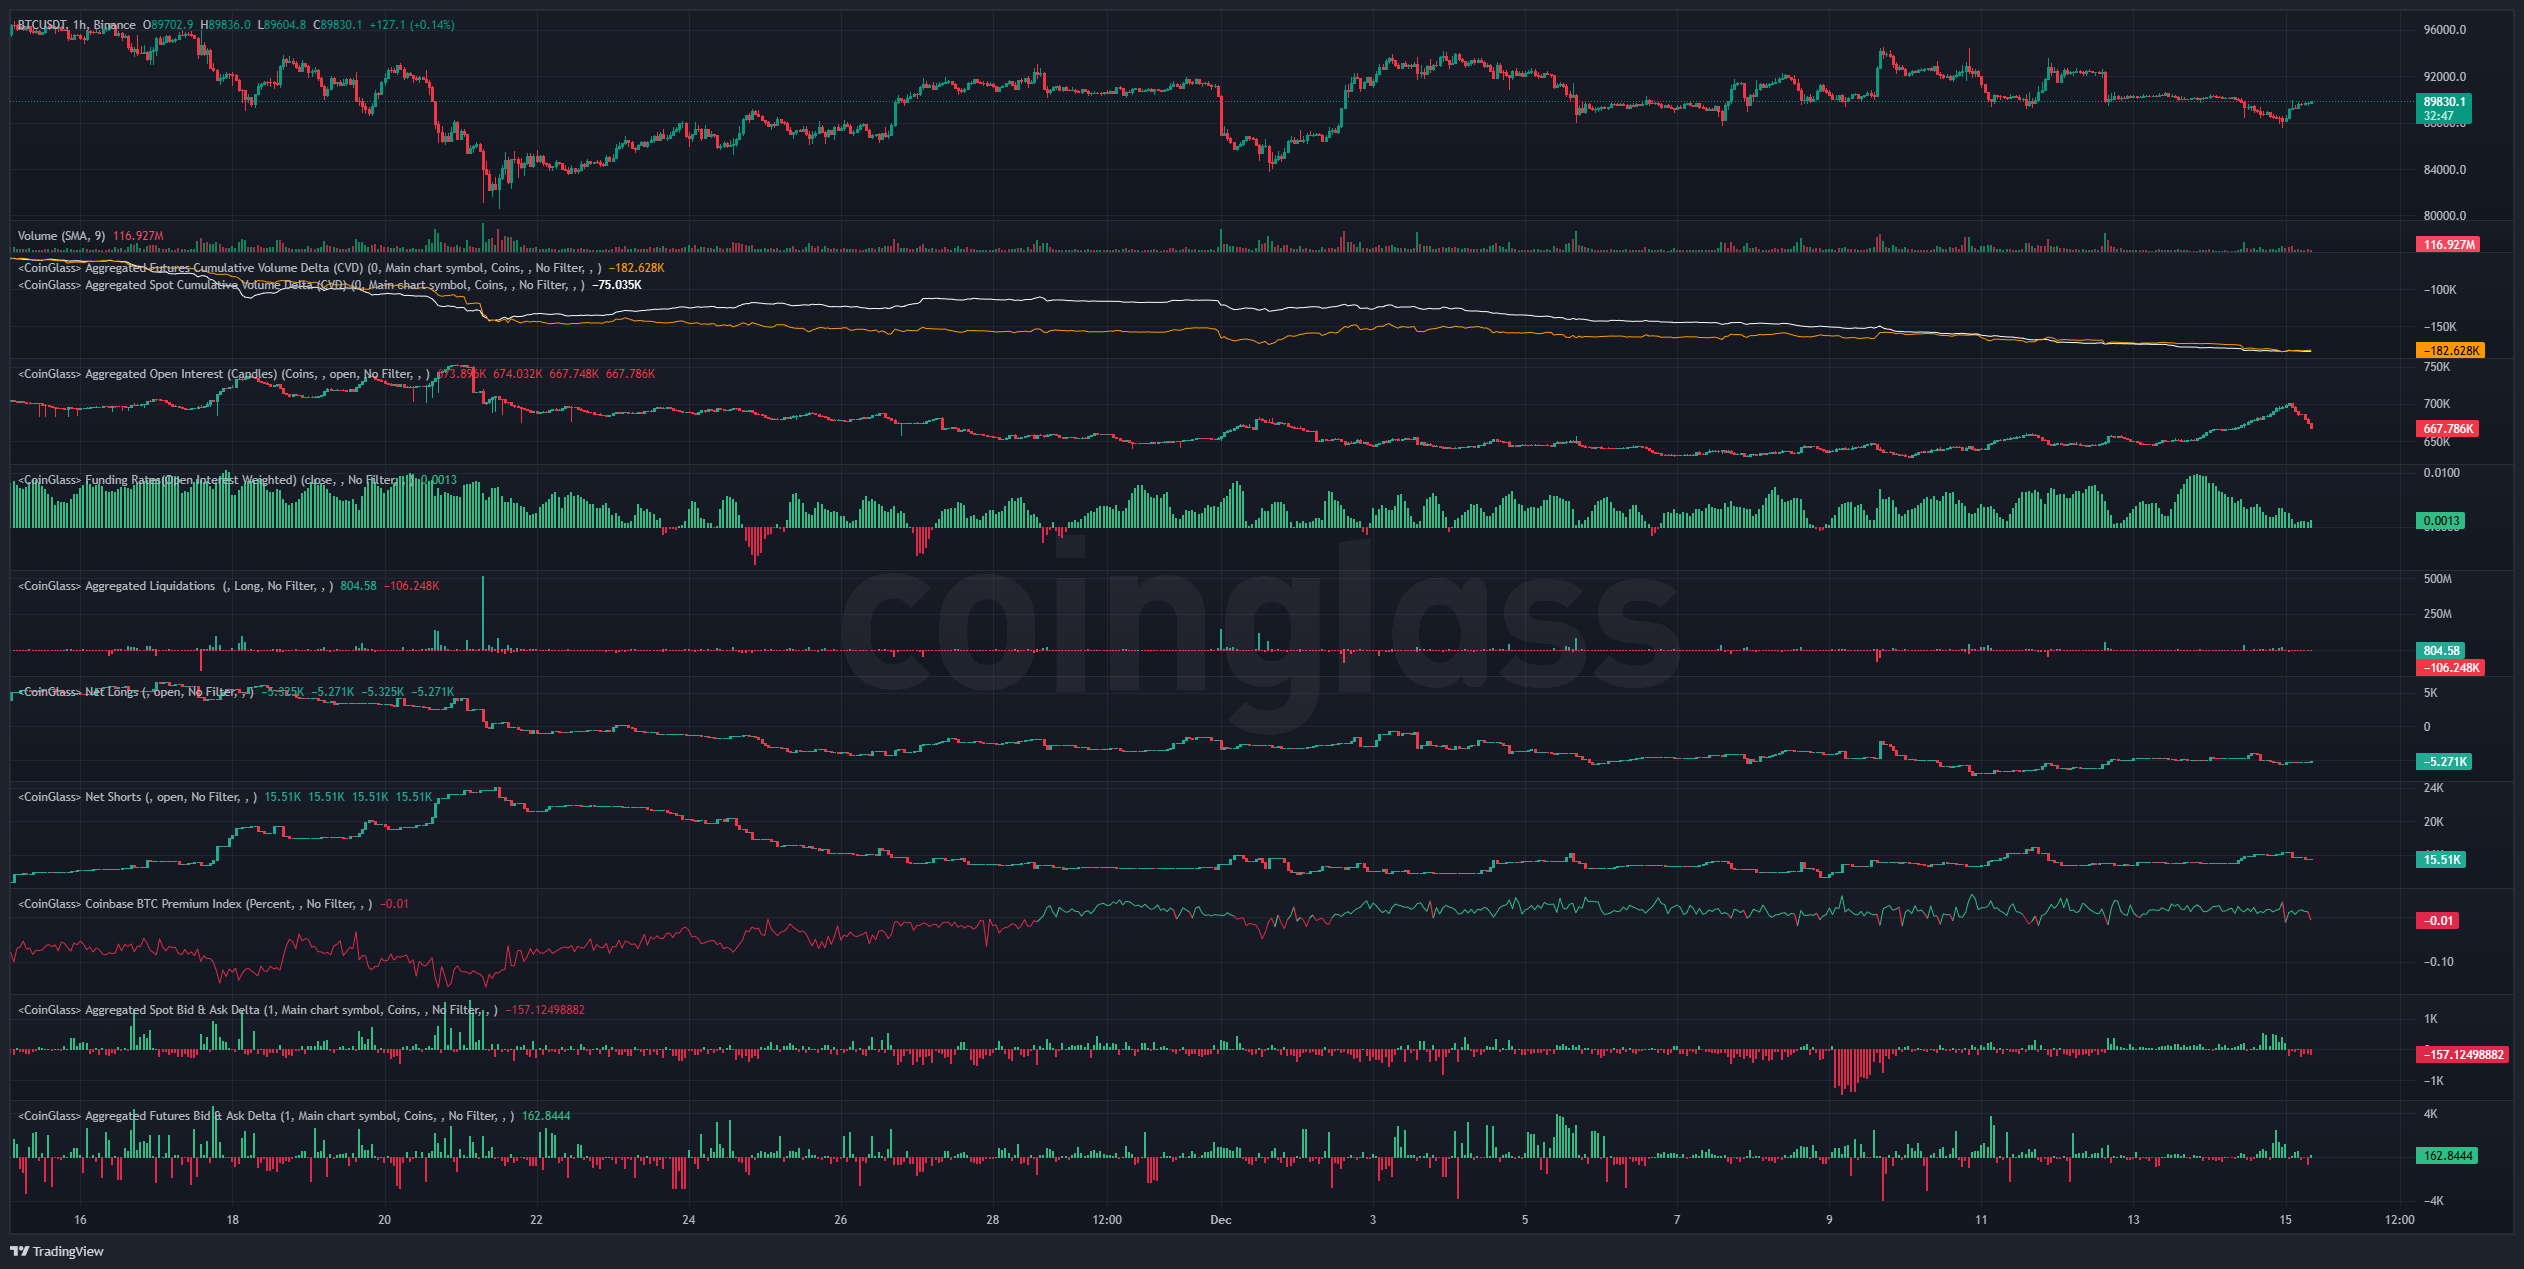
And here's a snapshot of positioning across Velo and CoinGlass:
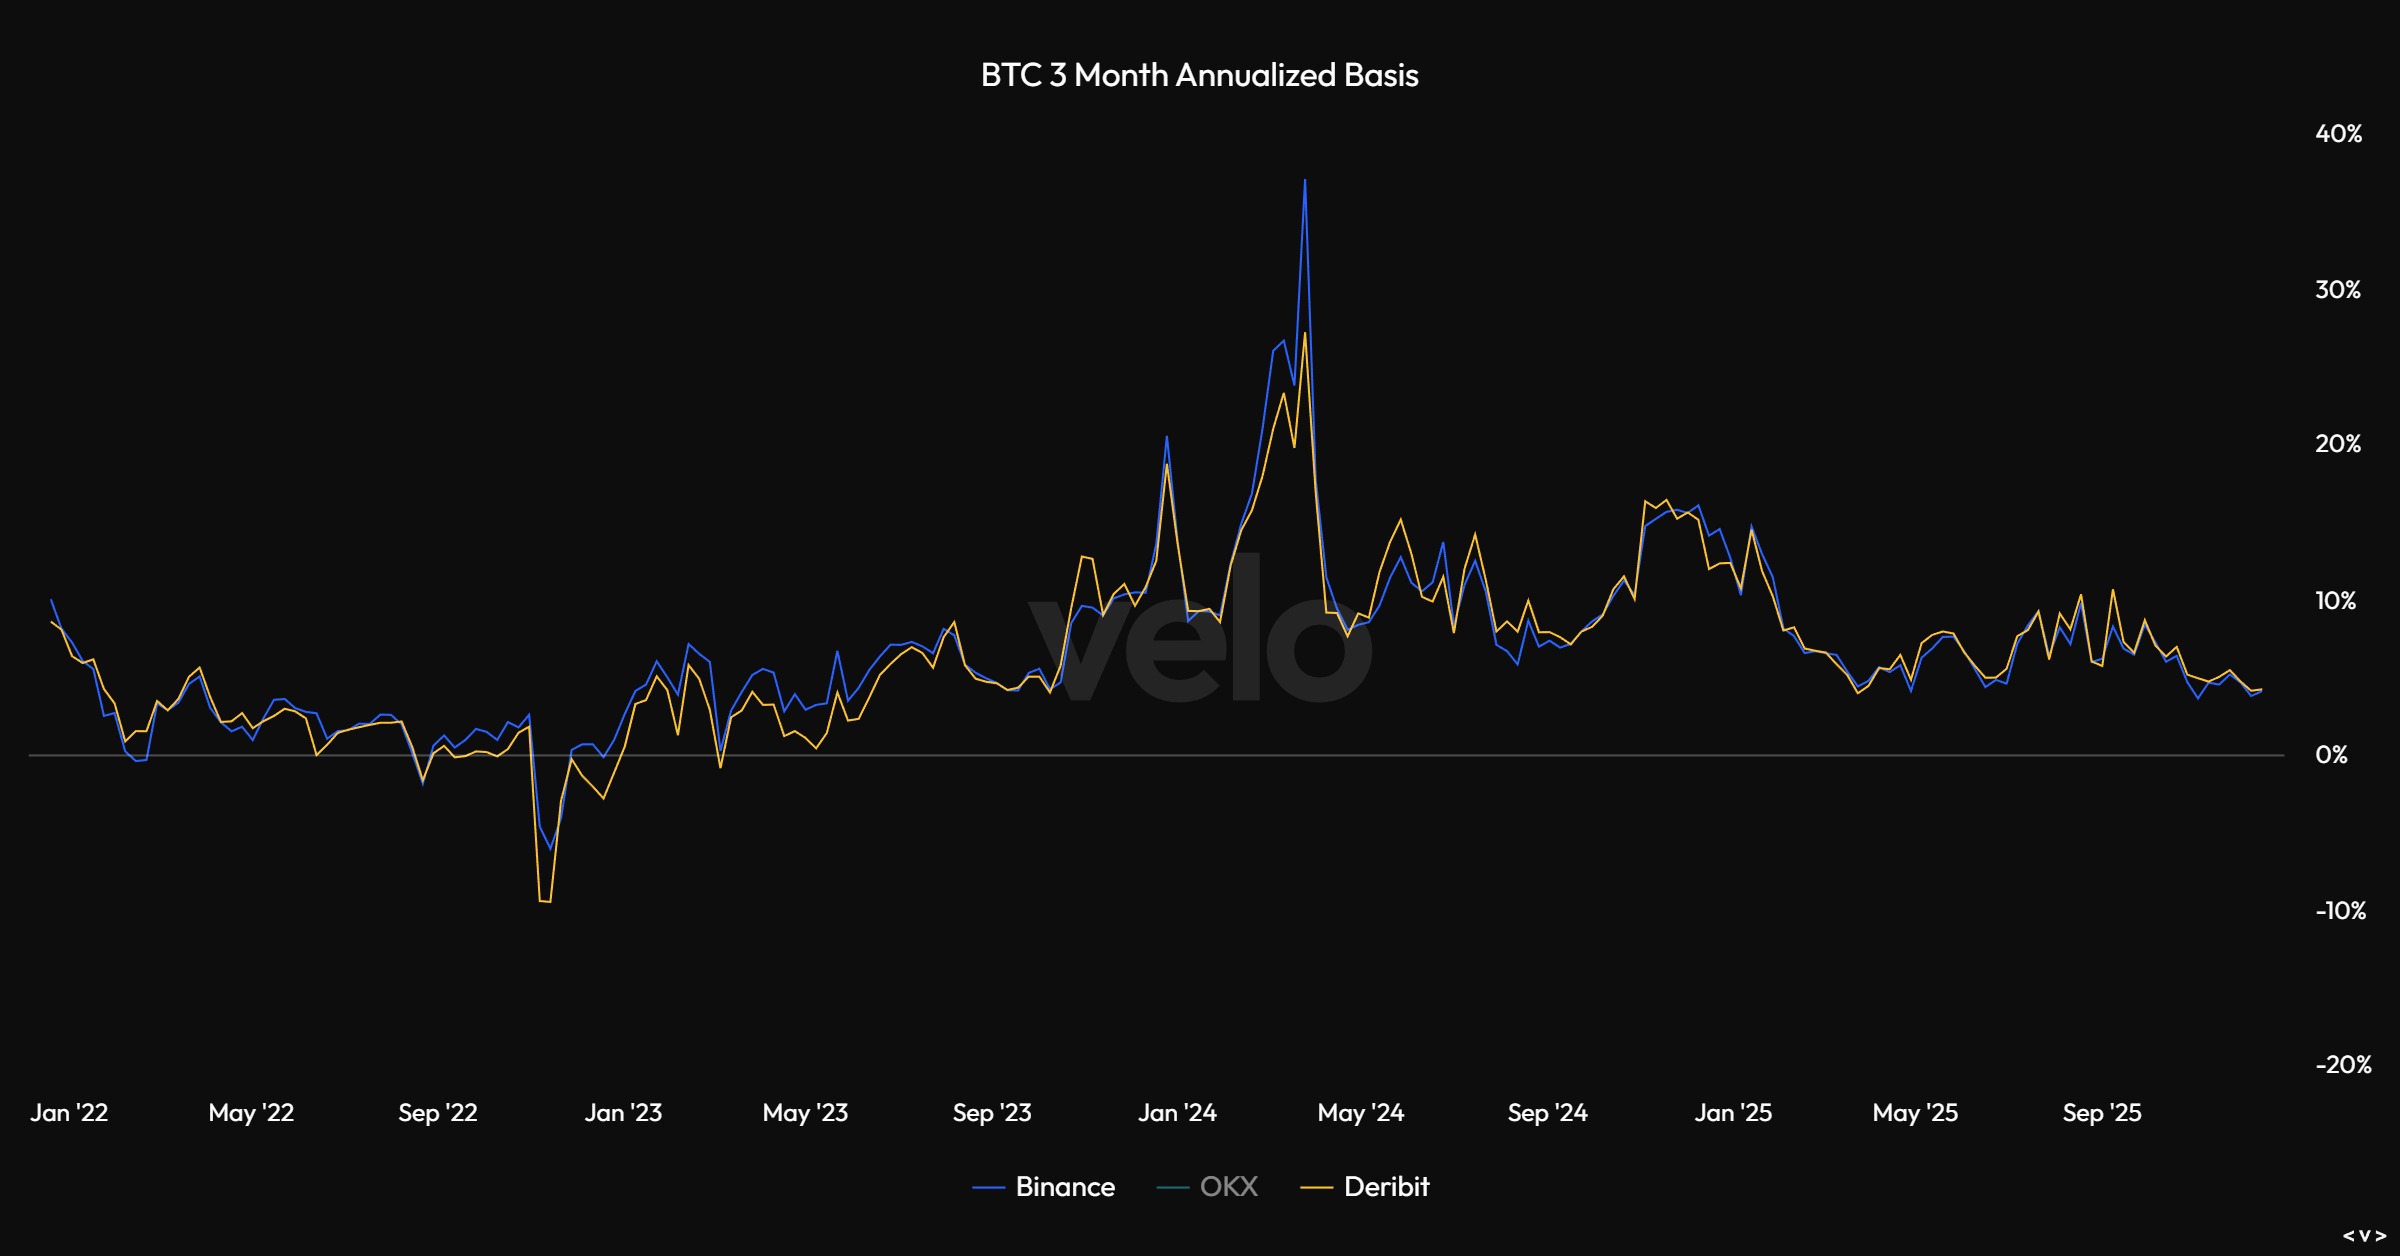
And here's 3-month annualized basis:
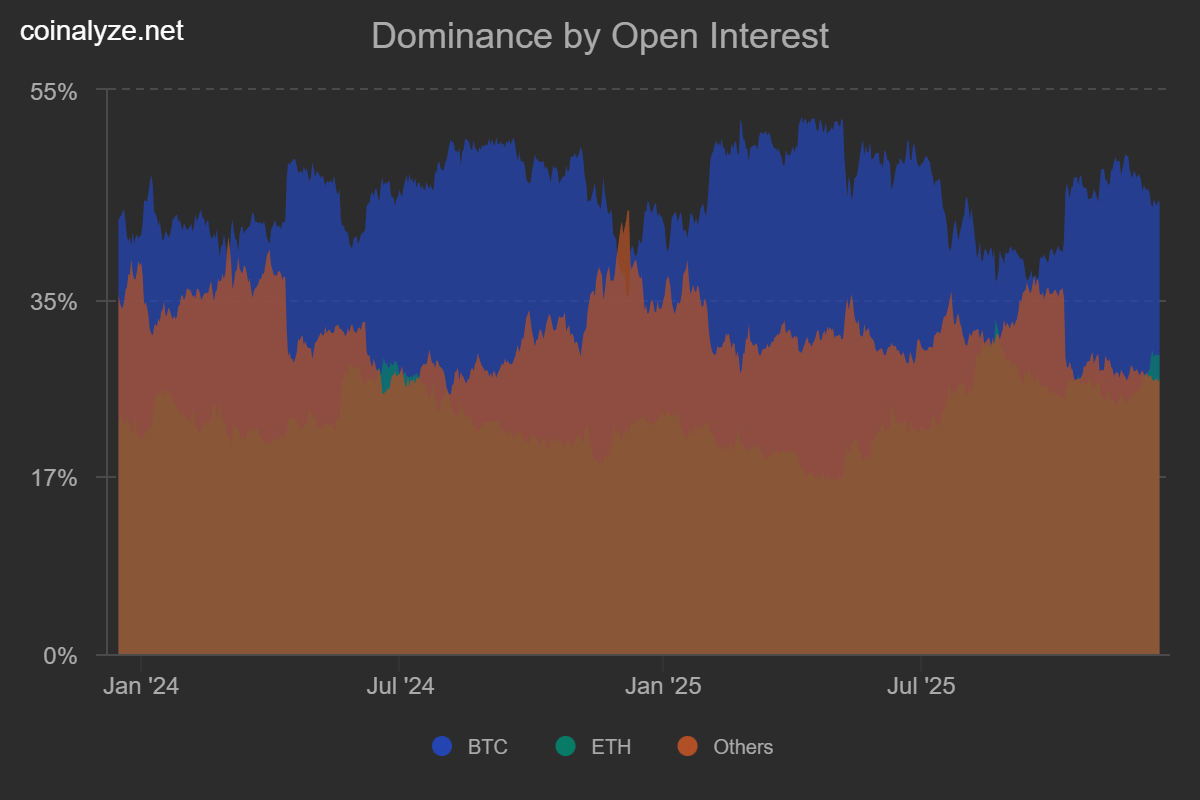
And Bitcoin OI vs Altcoin OI:
And finally some of the expected 1-week and 1-month liquidation levels:
-2025-12-15_08_24_58.png)
-2025-12-15_08_25_06.png)
Price: $3156
ETH/USD
Weekly:
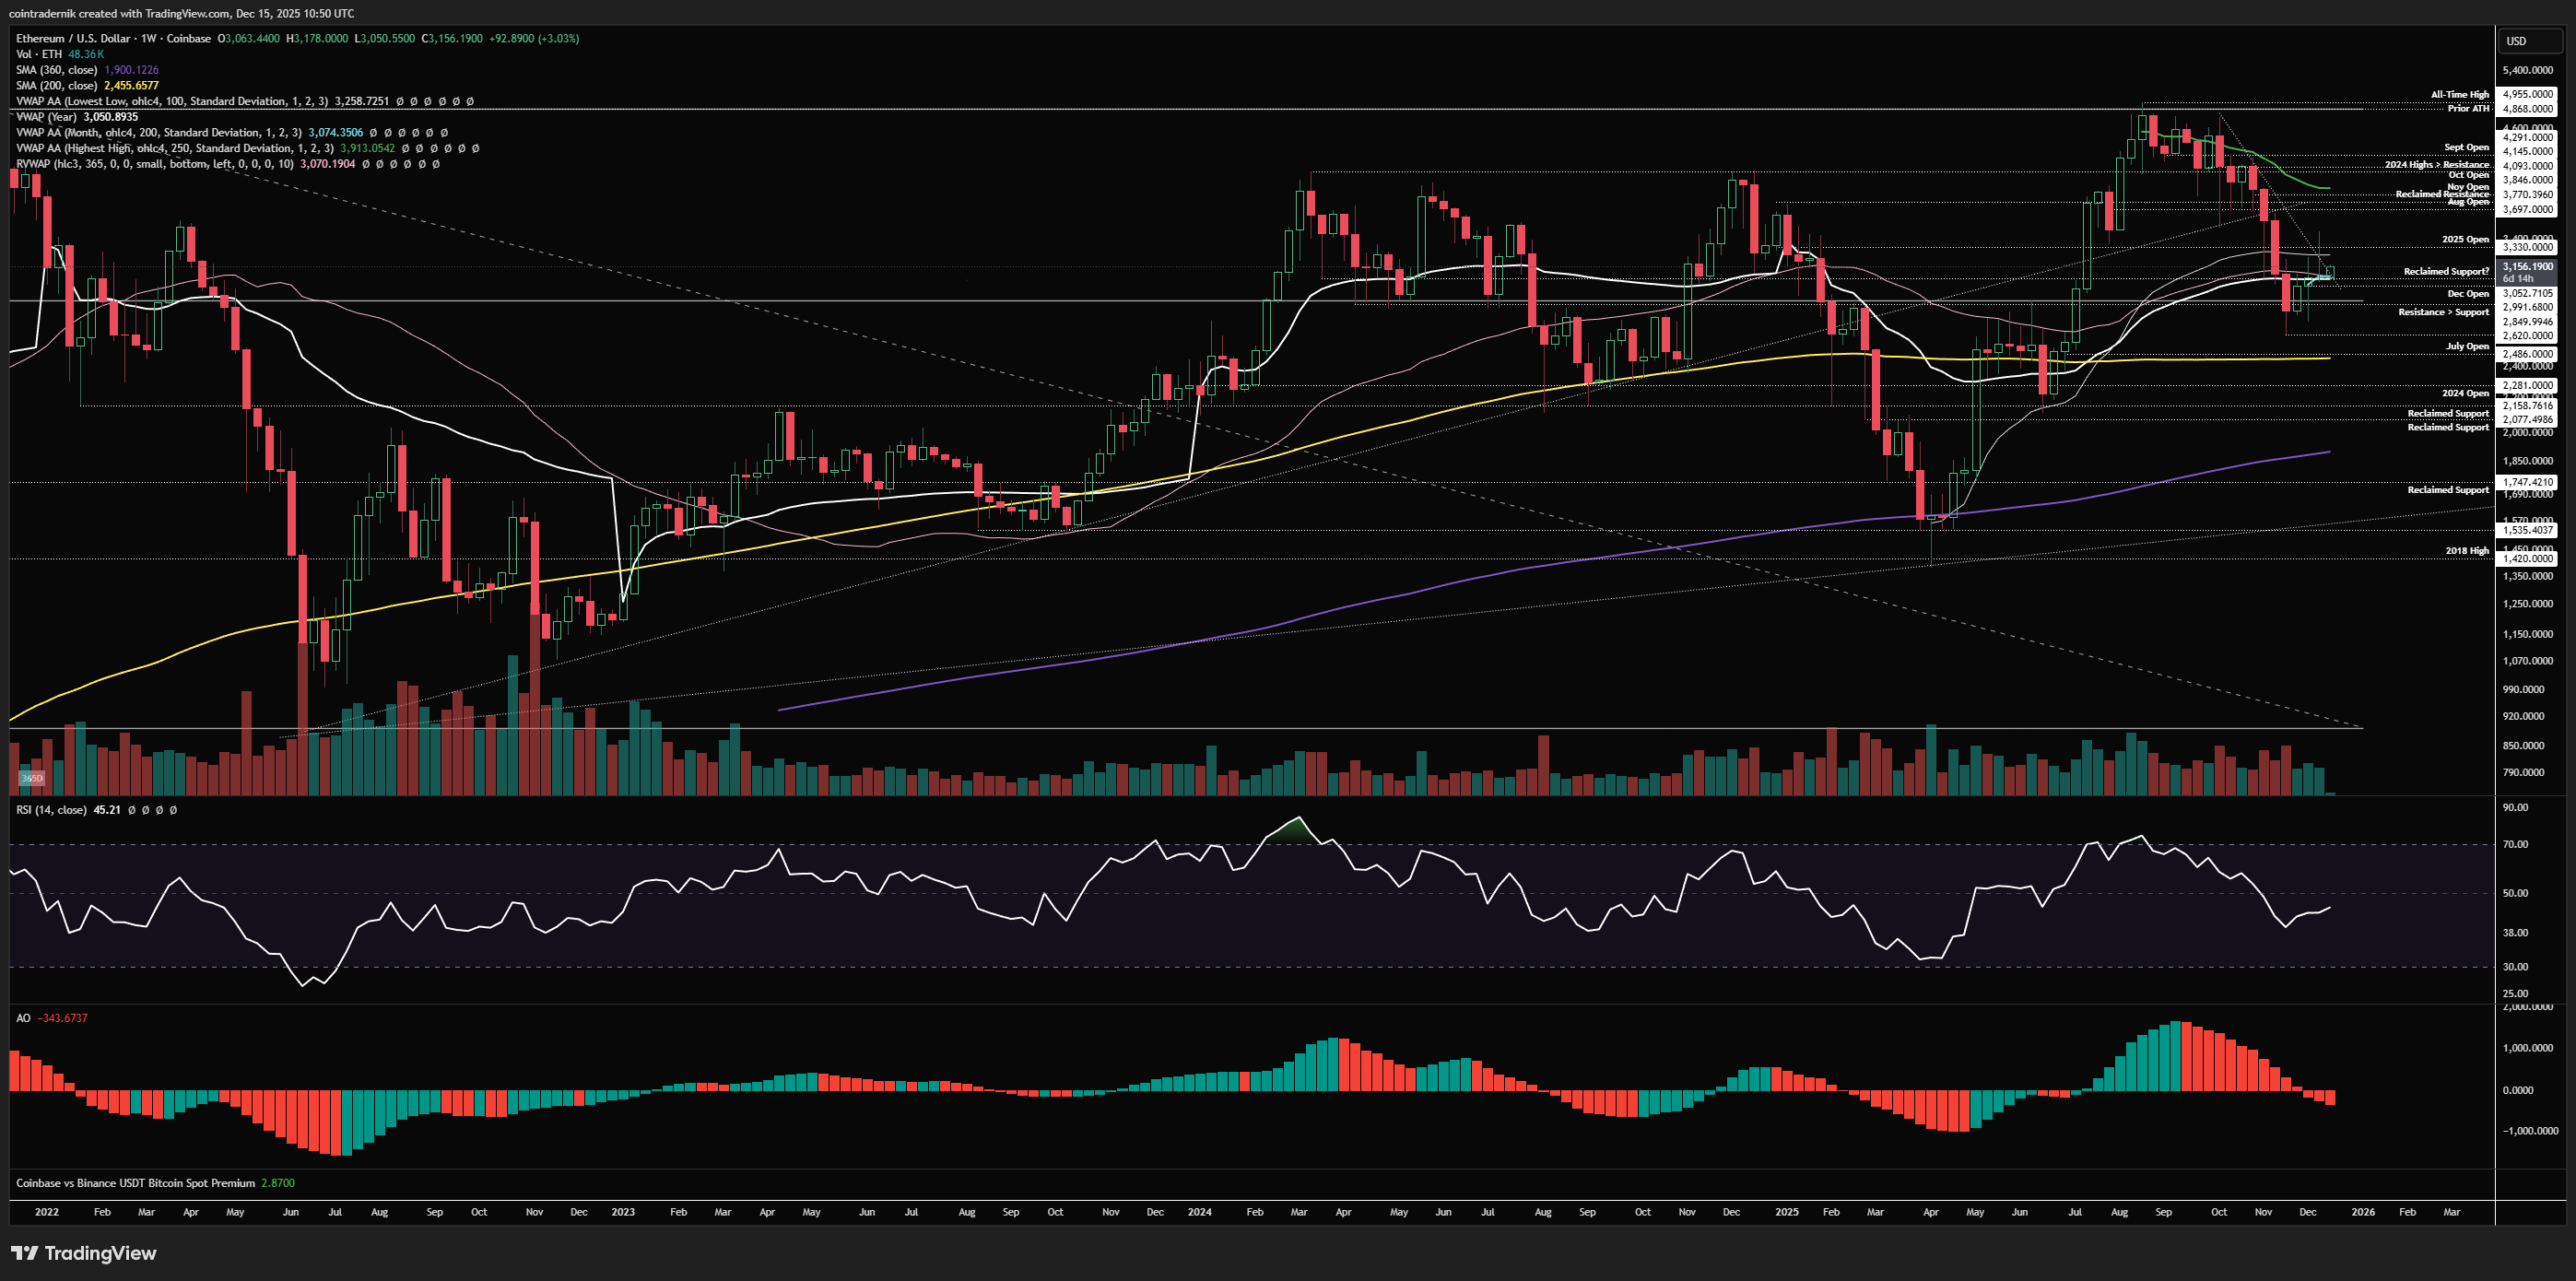
Beginning with the weekly view for ETH/USD, we can see that price wicked well above trendline resistance and the 2025 open last week but rejected to close the week right back near the open at $3063. We are still above this key support and bouncing early this week and as long as we can hold $3050 I think we continue to trade higher from here, back above the yearly open and last week's high, squeezing up towards $3700 into year-end. If we turn $3050 back into resistance this week, perhaps that's the short squeeze over for Dec and we move lower to retest that Nov low at $2620, but given how ETH/BTC looks I do currently expect that low on ETH/USD to hold. Not much else to add here for now...
Daily:
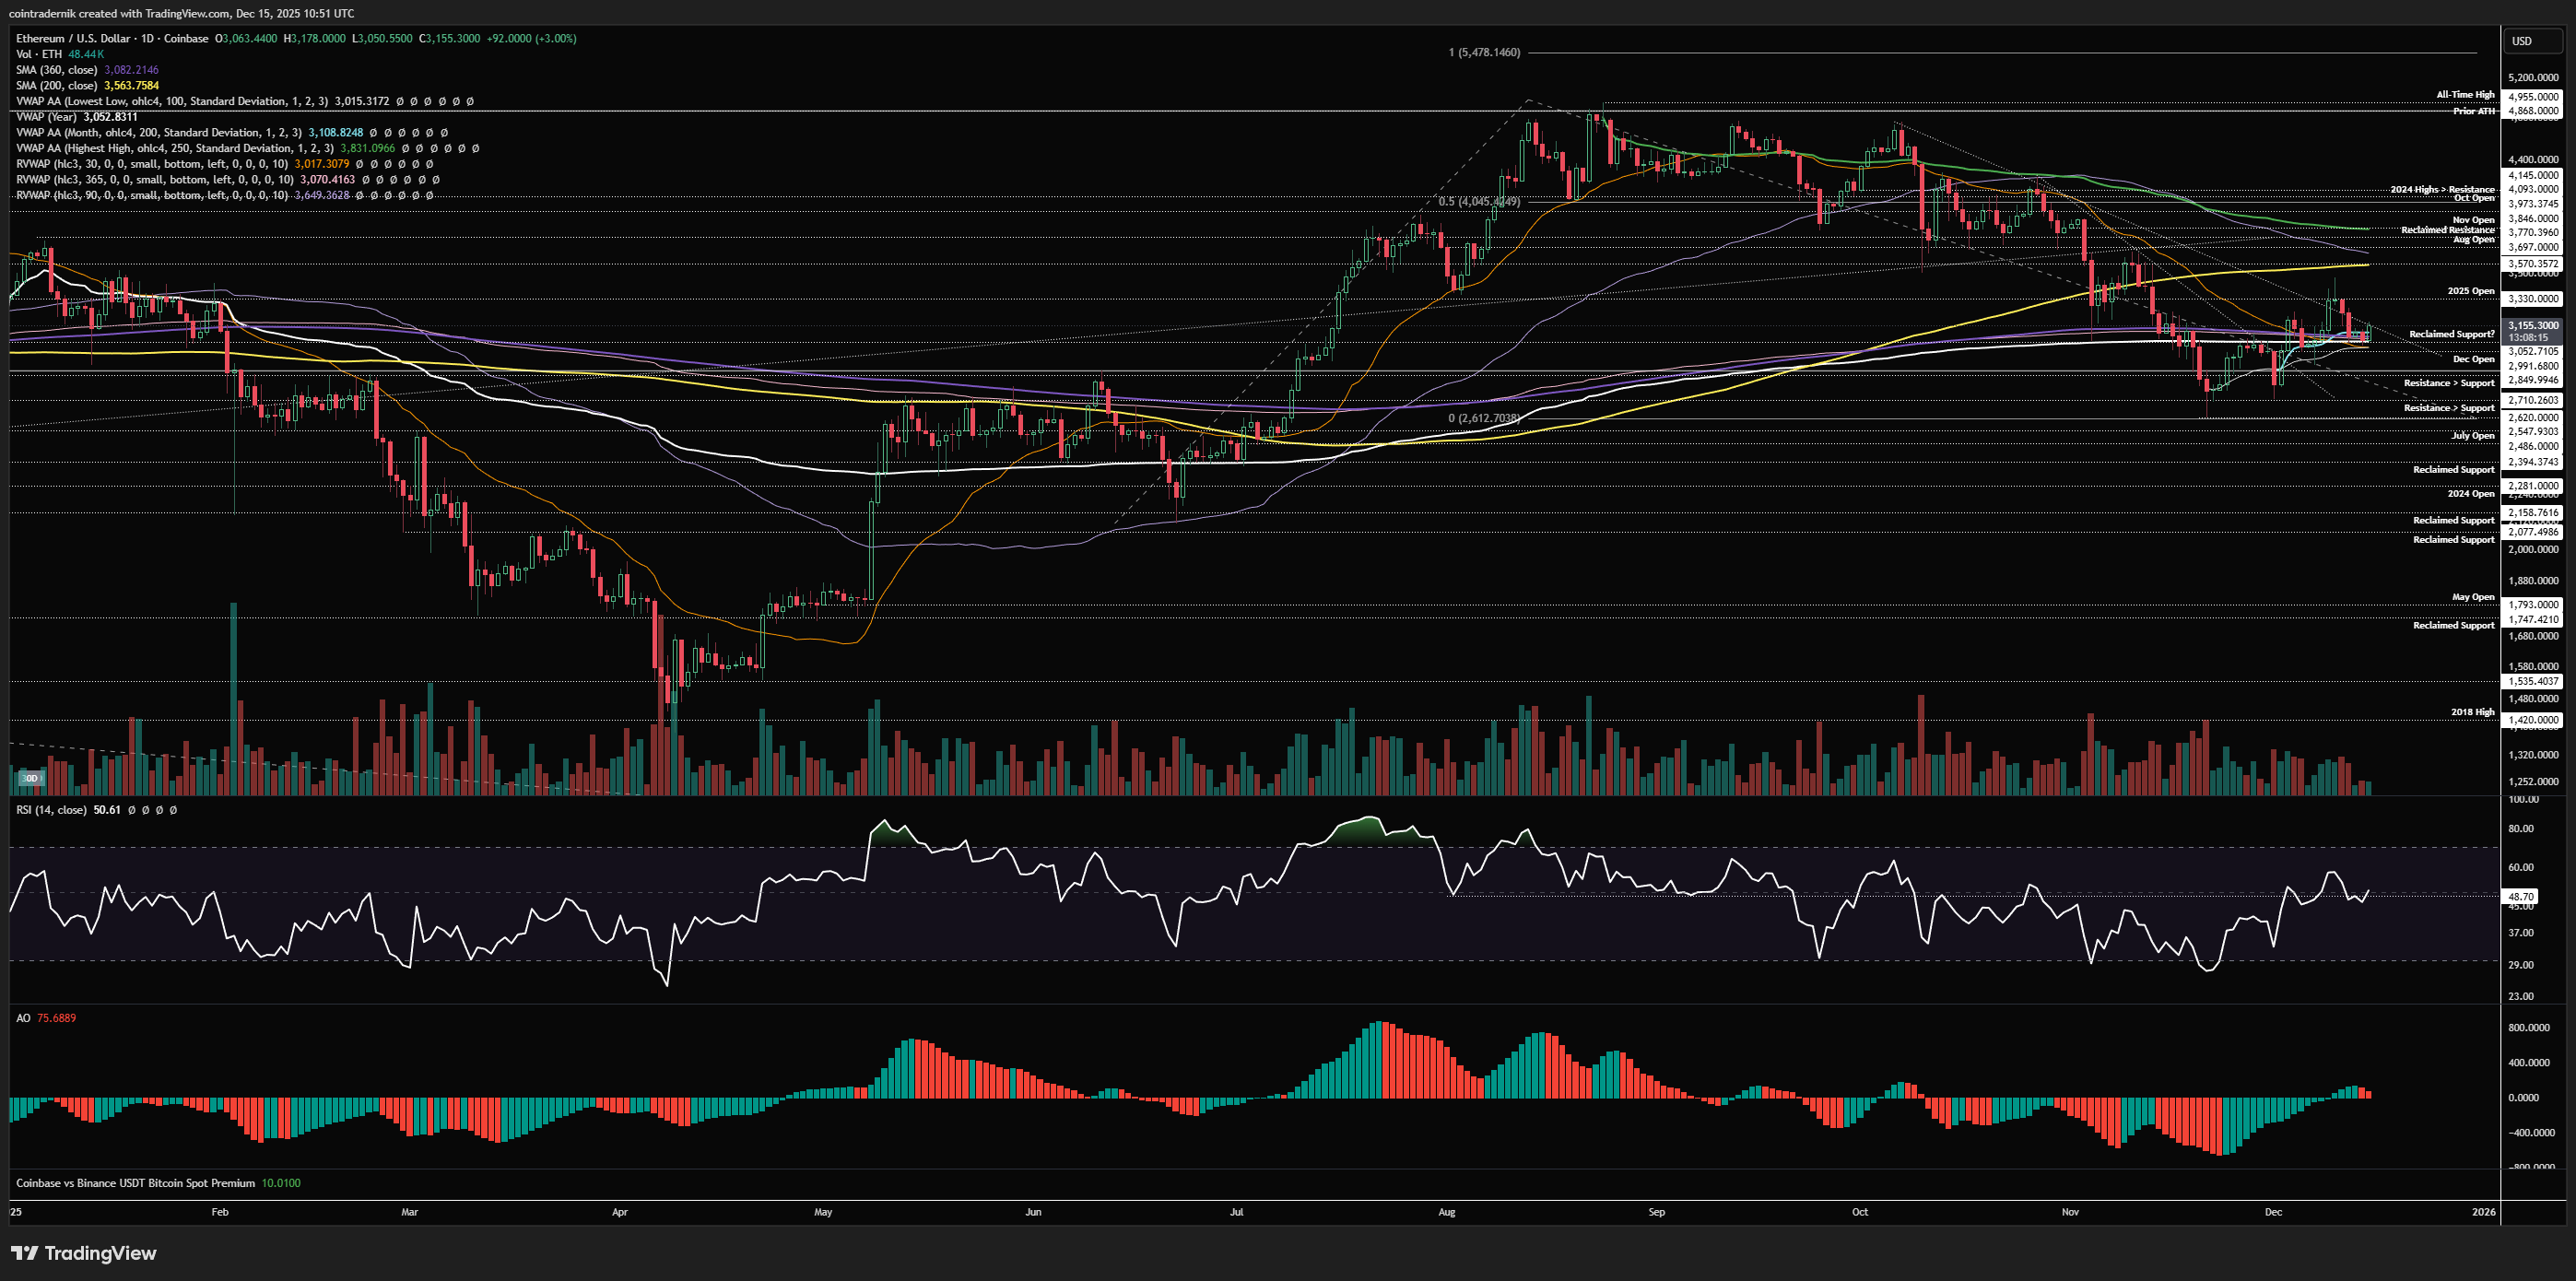
Looking at the daily, we can see that daily structure is now bullish, with higher-highs and higher-lows, and with the monthly VWAP, yearly VWAP and anchored VWAP from the Nov low all acting as support here, as daily RSI breaks back above 50 and is suggestive of a momentum shift. Last week saw price reject below the 200dMA and fail to close above the yearly open at $3330, which preceded this move back into support, but whilst the structure is bullish we should expect this to be another higher-low formation, where a daily close up above $3200ish would also be a second breakout beyond trendline resistance from the October high - and the second is less likely to be a failed breakout, in my view. So, if we can start pushing higher this week, I think the setup is great for price to flip $3330 into support into next week and then rally into $3700+ from there by year-end, where I do expect much more sell pressure to step in between there and $3830 (the anchored VWAP from the all-time high). Again, my longer-term view here is that ETH remains in a multi-year bull market and will make new highs again in Q1, so I expect a higher-low formation from any rejection in that zone. Invalidation of this expectation would be flipping the Nov low into resistance, because I would then expect $2077 to be taken out, which in turn makes it more probable we return to the bottom of the multi-year channel, likely nearer $1750 before a major bottom is found. Price-action into January is likely to be very telling for that Jan-May period for ETH.
ETH/BTC
Weekly:
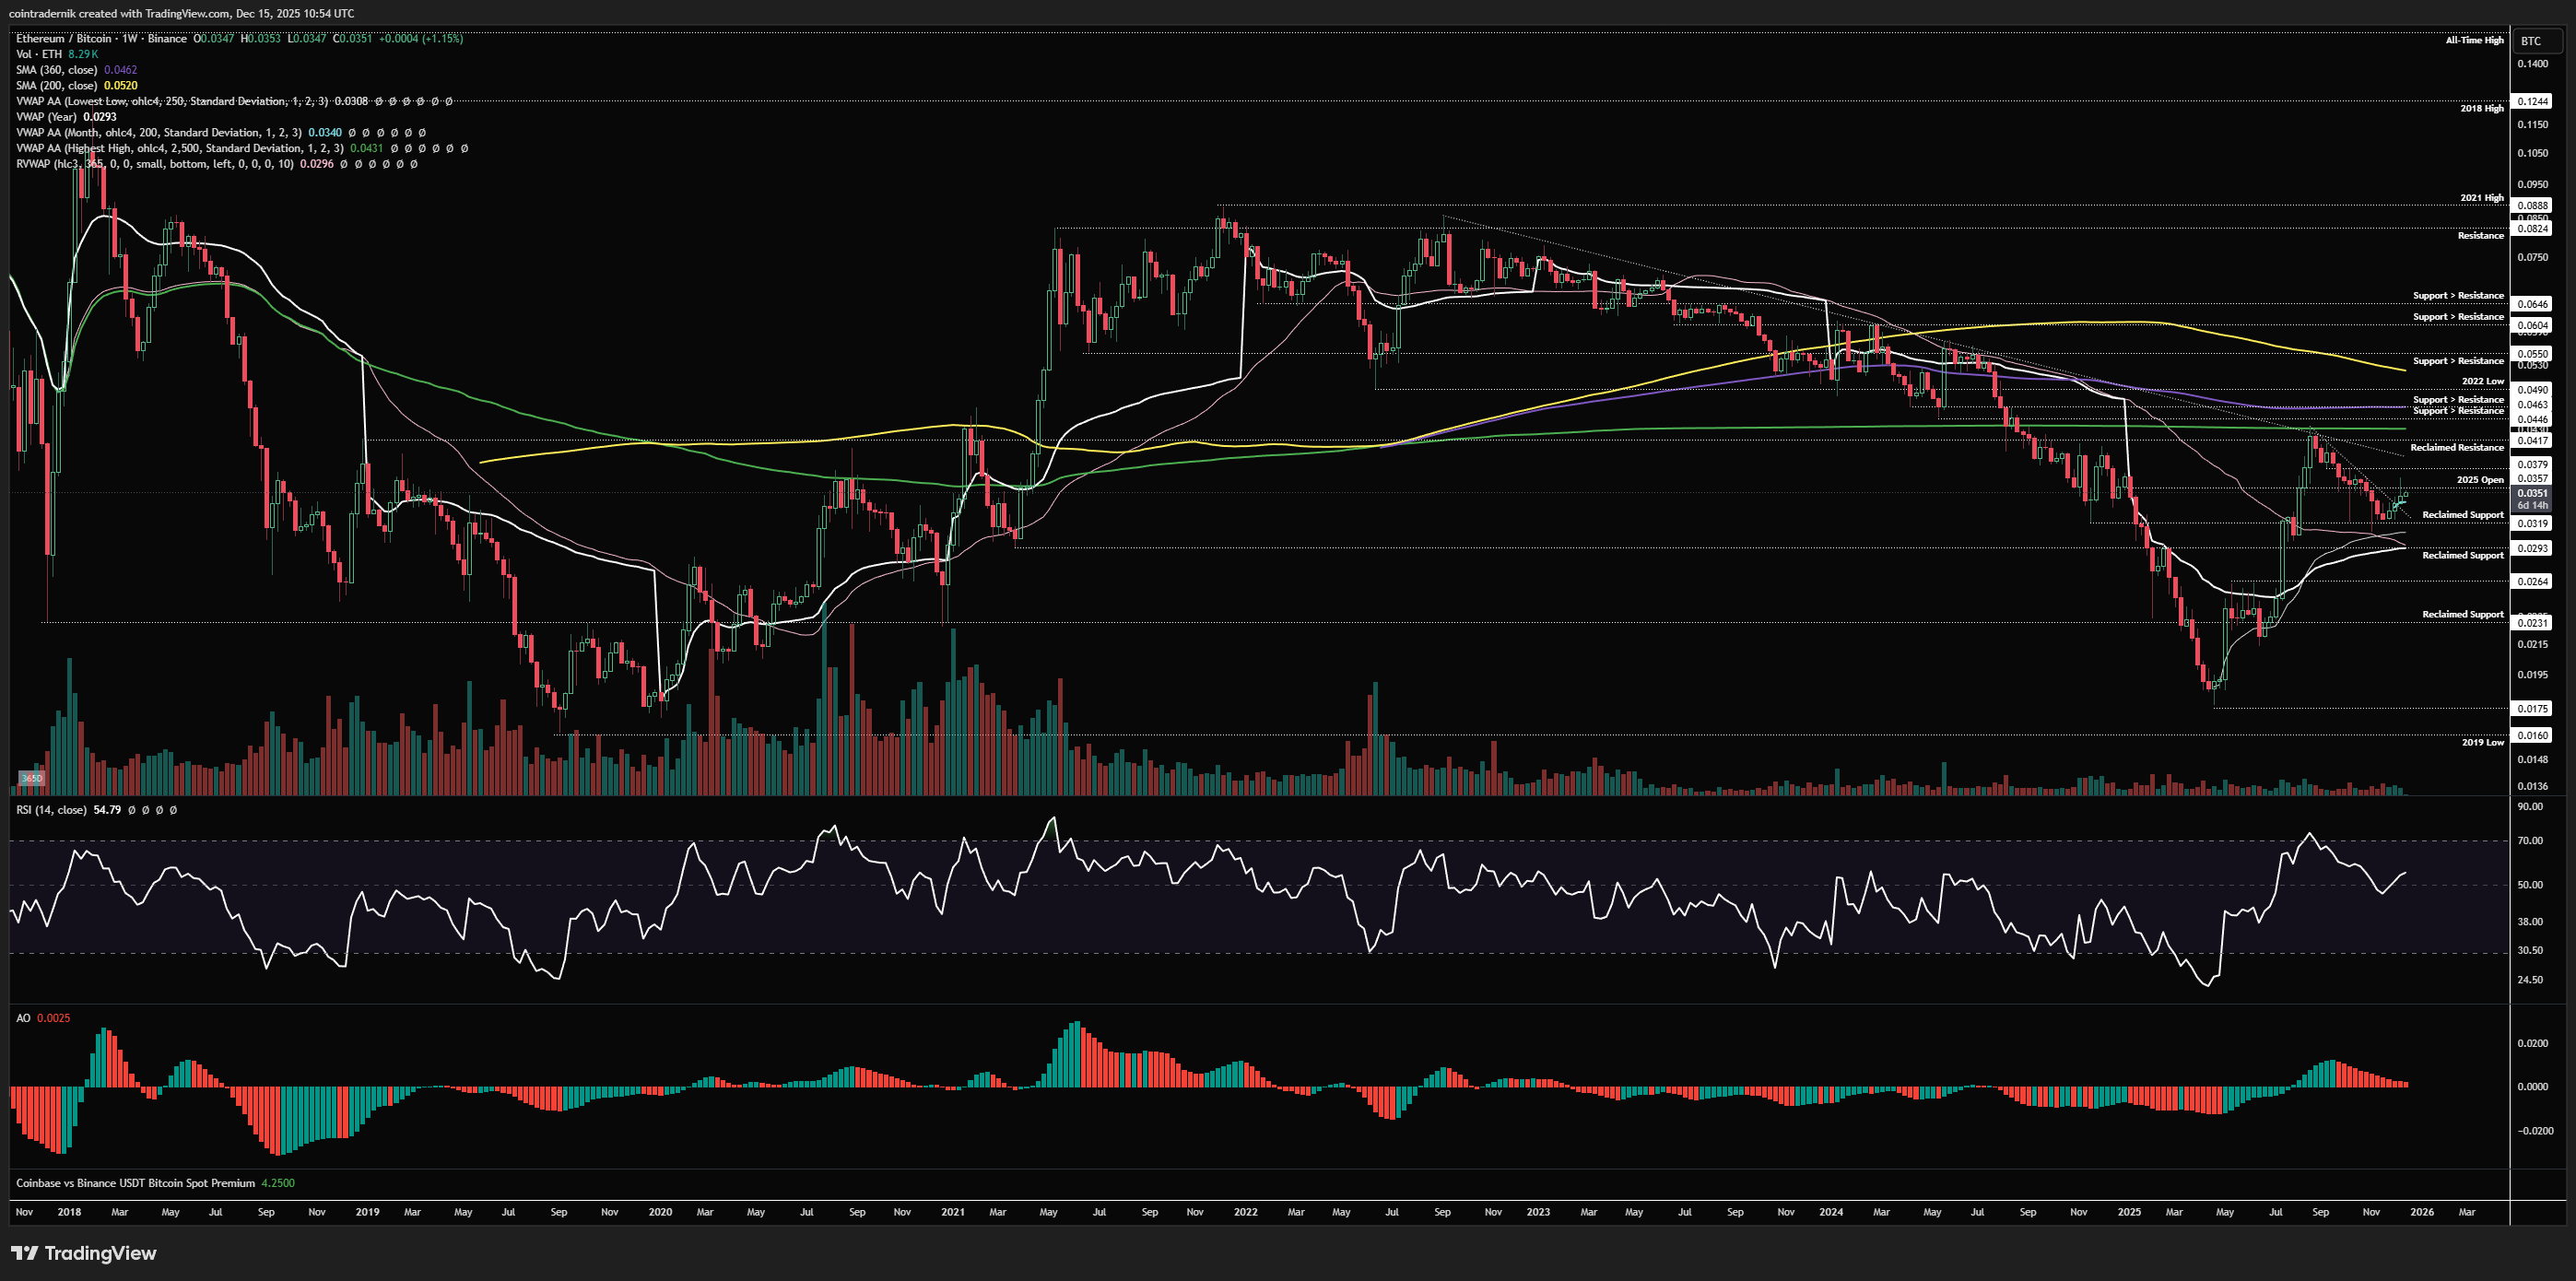
ETH/BTC is a pretty clear signal for me as to why this market does not feel like Q1 2022 at the beginning of a multi-year bear market. ON the weekly timeframe, we have bullish structure and bullish momentum, and we have just retraced into higher-timeframe support, marked out a higher-low and now closed the weekly above trendline resistance from the yearly high. As I said on X, if the ticker didn't include 'ETH' and this was any other asset in any other market, you'd be screaming for it to run higher, but people have massive PTSD that they cannot detach from the actual price-action here. Now, if we form a lower-high here, and then close the weekly below 0.0293, you got me - this then looks very bearish for the foreseeable future and I would expect a near-full retracement of the rally off the April low. However, until that occurs and whilst we have bullish structure and momentum on the higher timeframes, I am going to expect higher prices, where any acceptance above the yearly open here will lead to a move to the yearly high and a retest of that 0.0417 area that is very strong resistance. Flip that level into support into Q1 and we get another leg higher towards 0.055.
Daily:
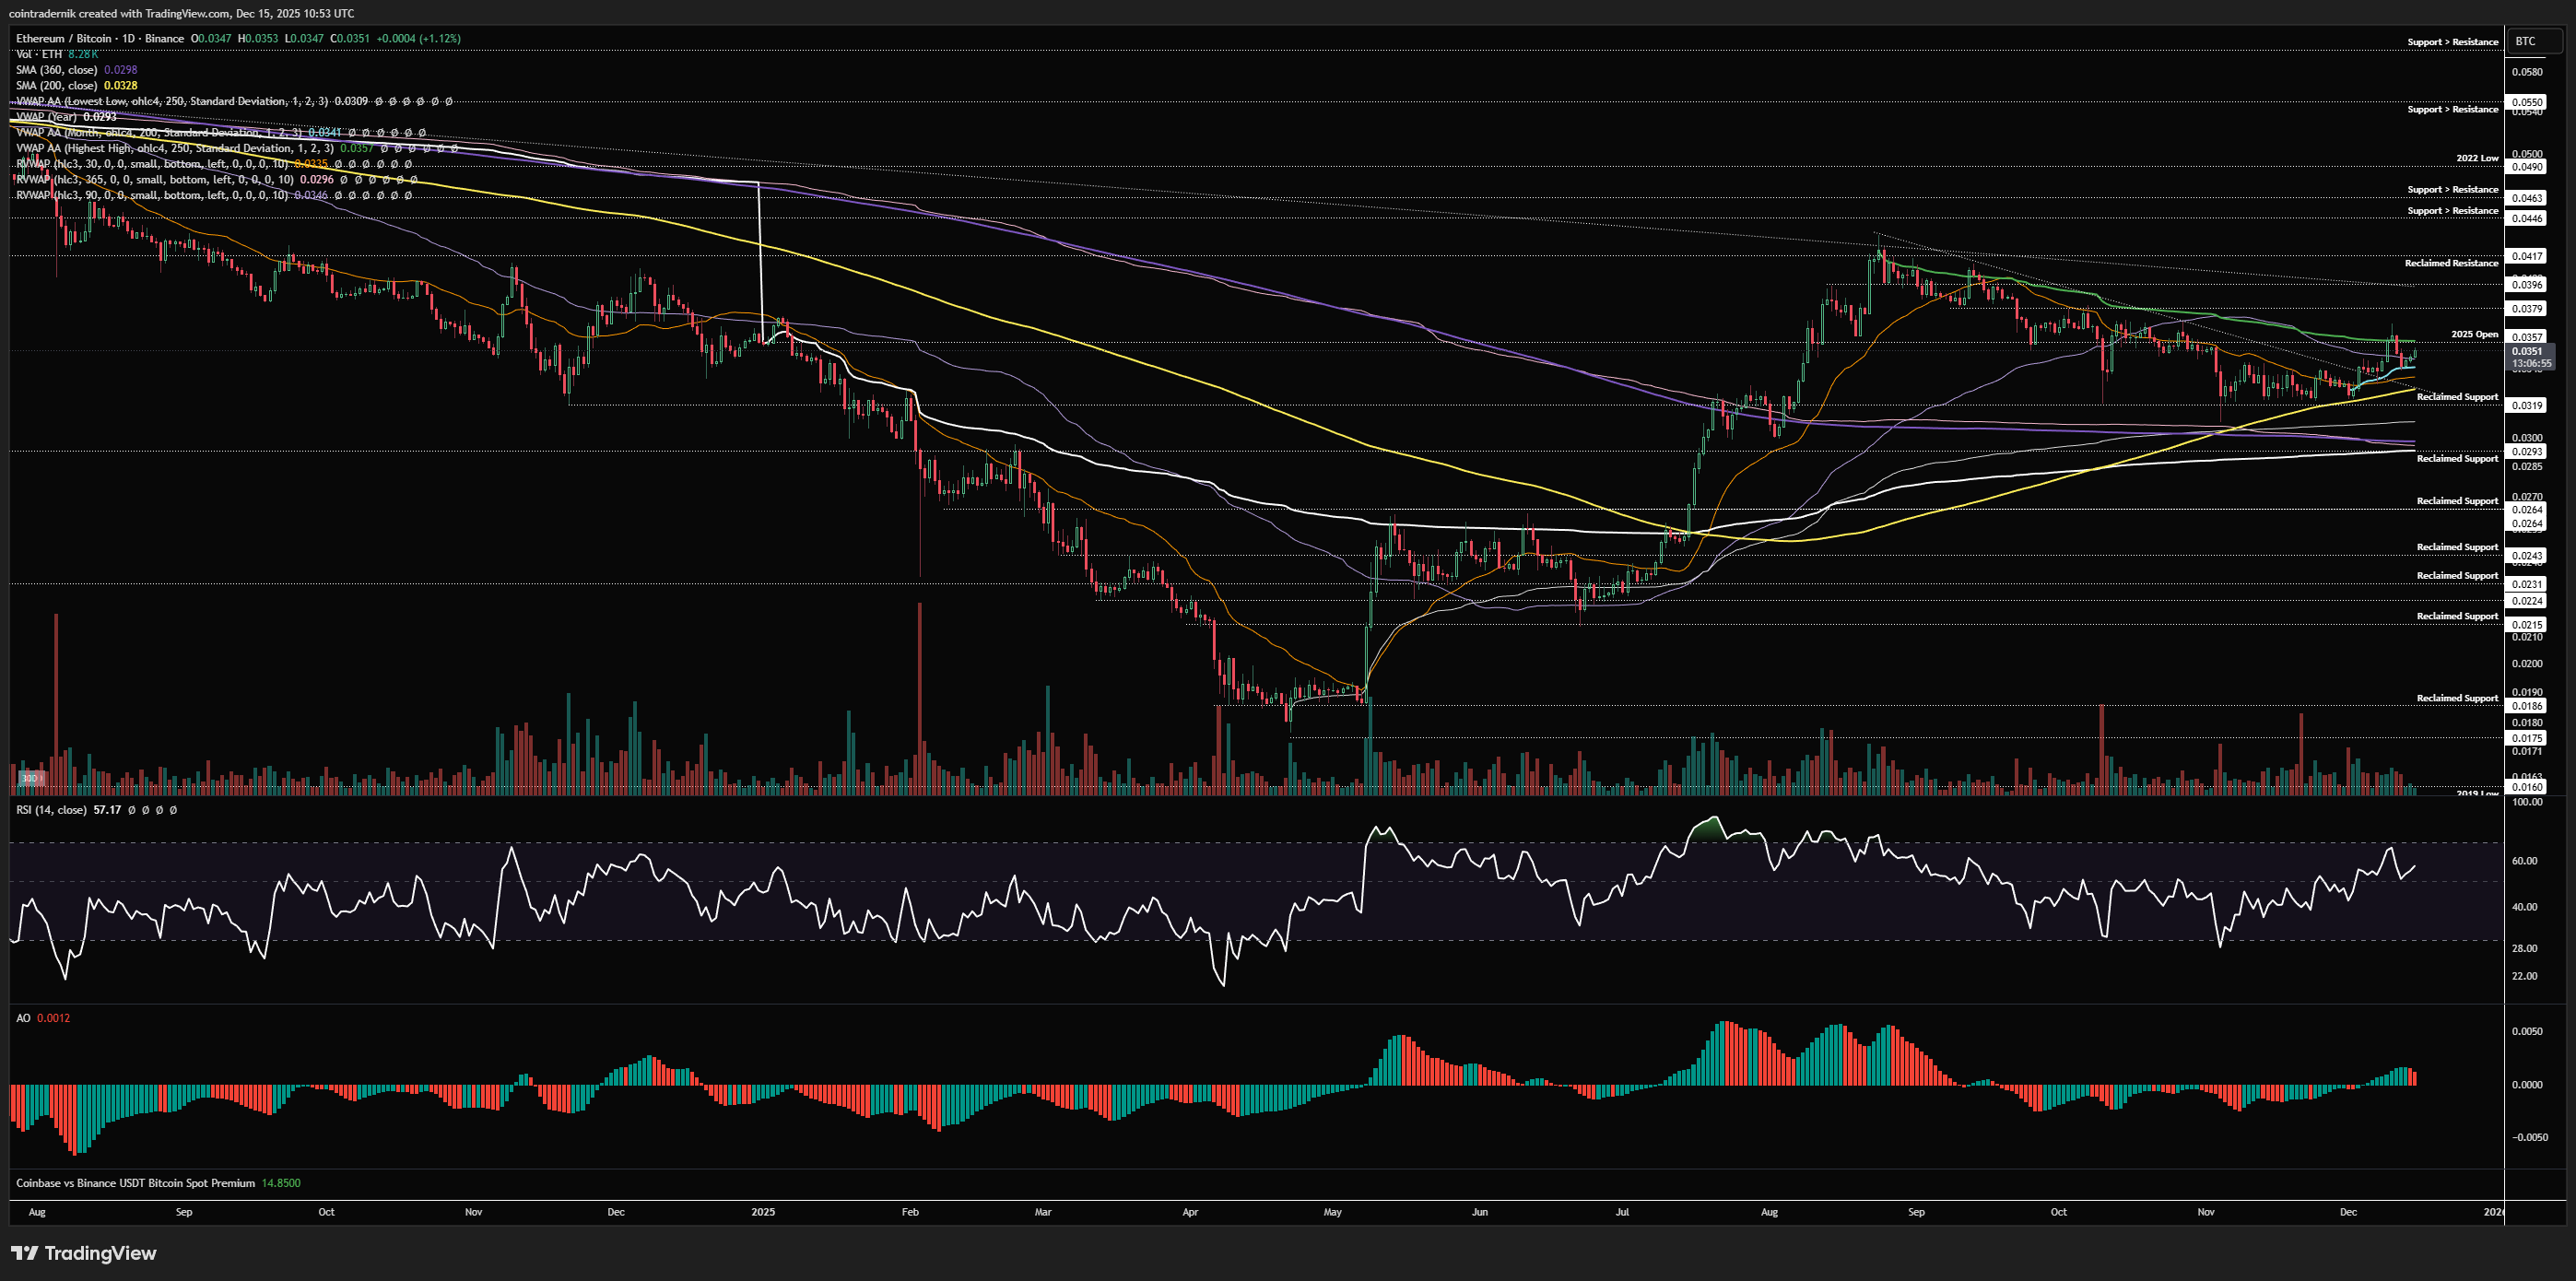
Dropping into the daily, we can see that price has turned daily structure bullish and is now forming higher-lows above key MAs and VWAPs, whilst flipping local resistance into support. We tested the anchored VWAP from the yearly high last week, confluent with the 2025 open at 0.0357, and rejected, but have now formed a higher-low with price attempting another breakout. If we do break and close above last week's high, I think the disbelief will be palpable as ETH/BTC pushes towards fresh yearly highs. Everything is trading very cleanly here and I think the woeful sentiment around ETH only benefits the continuation of this trend higher.
Receive the latest updates directly to your inbox

Price: $6860
Weekly:
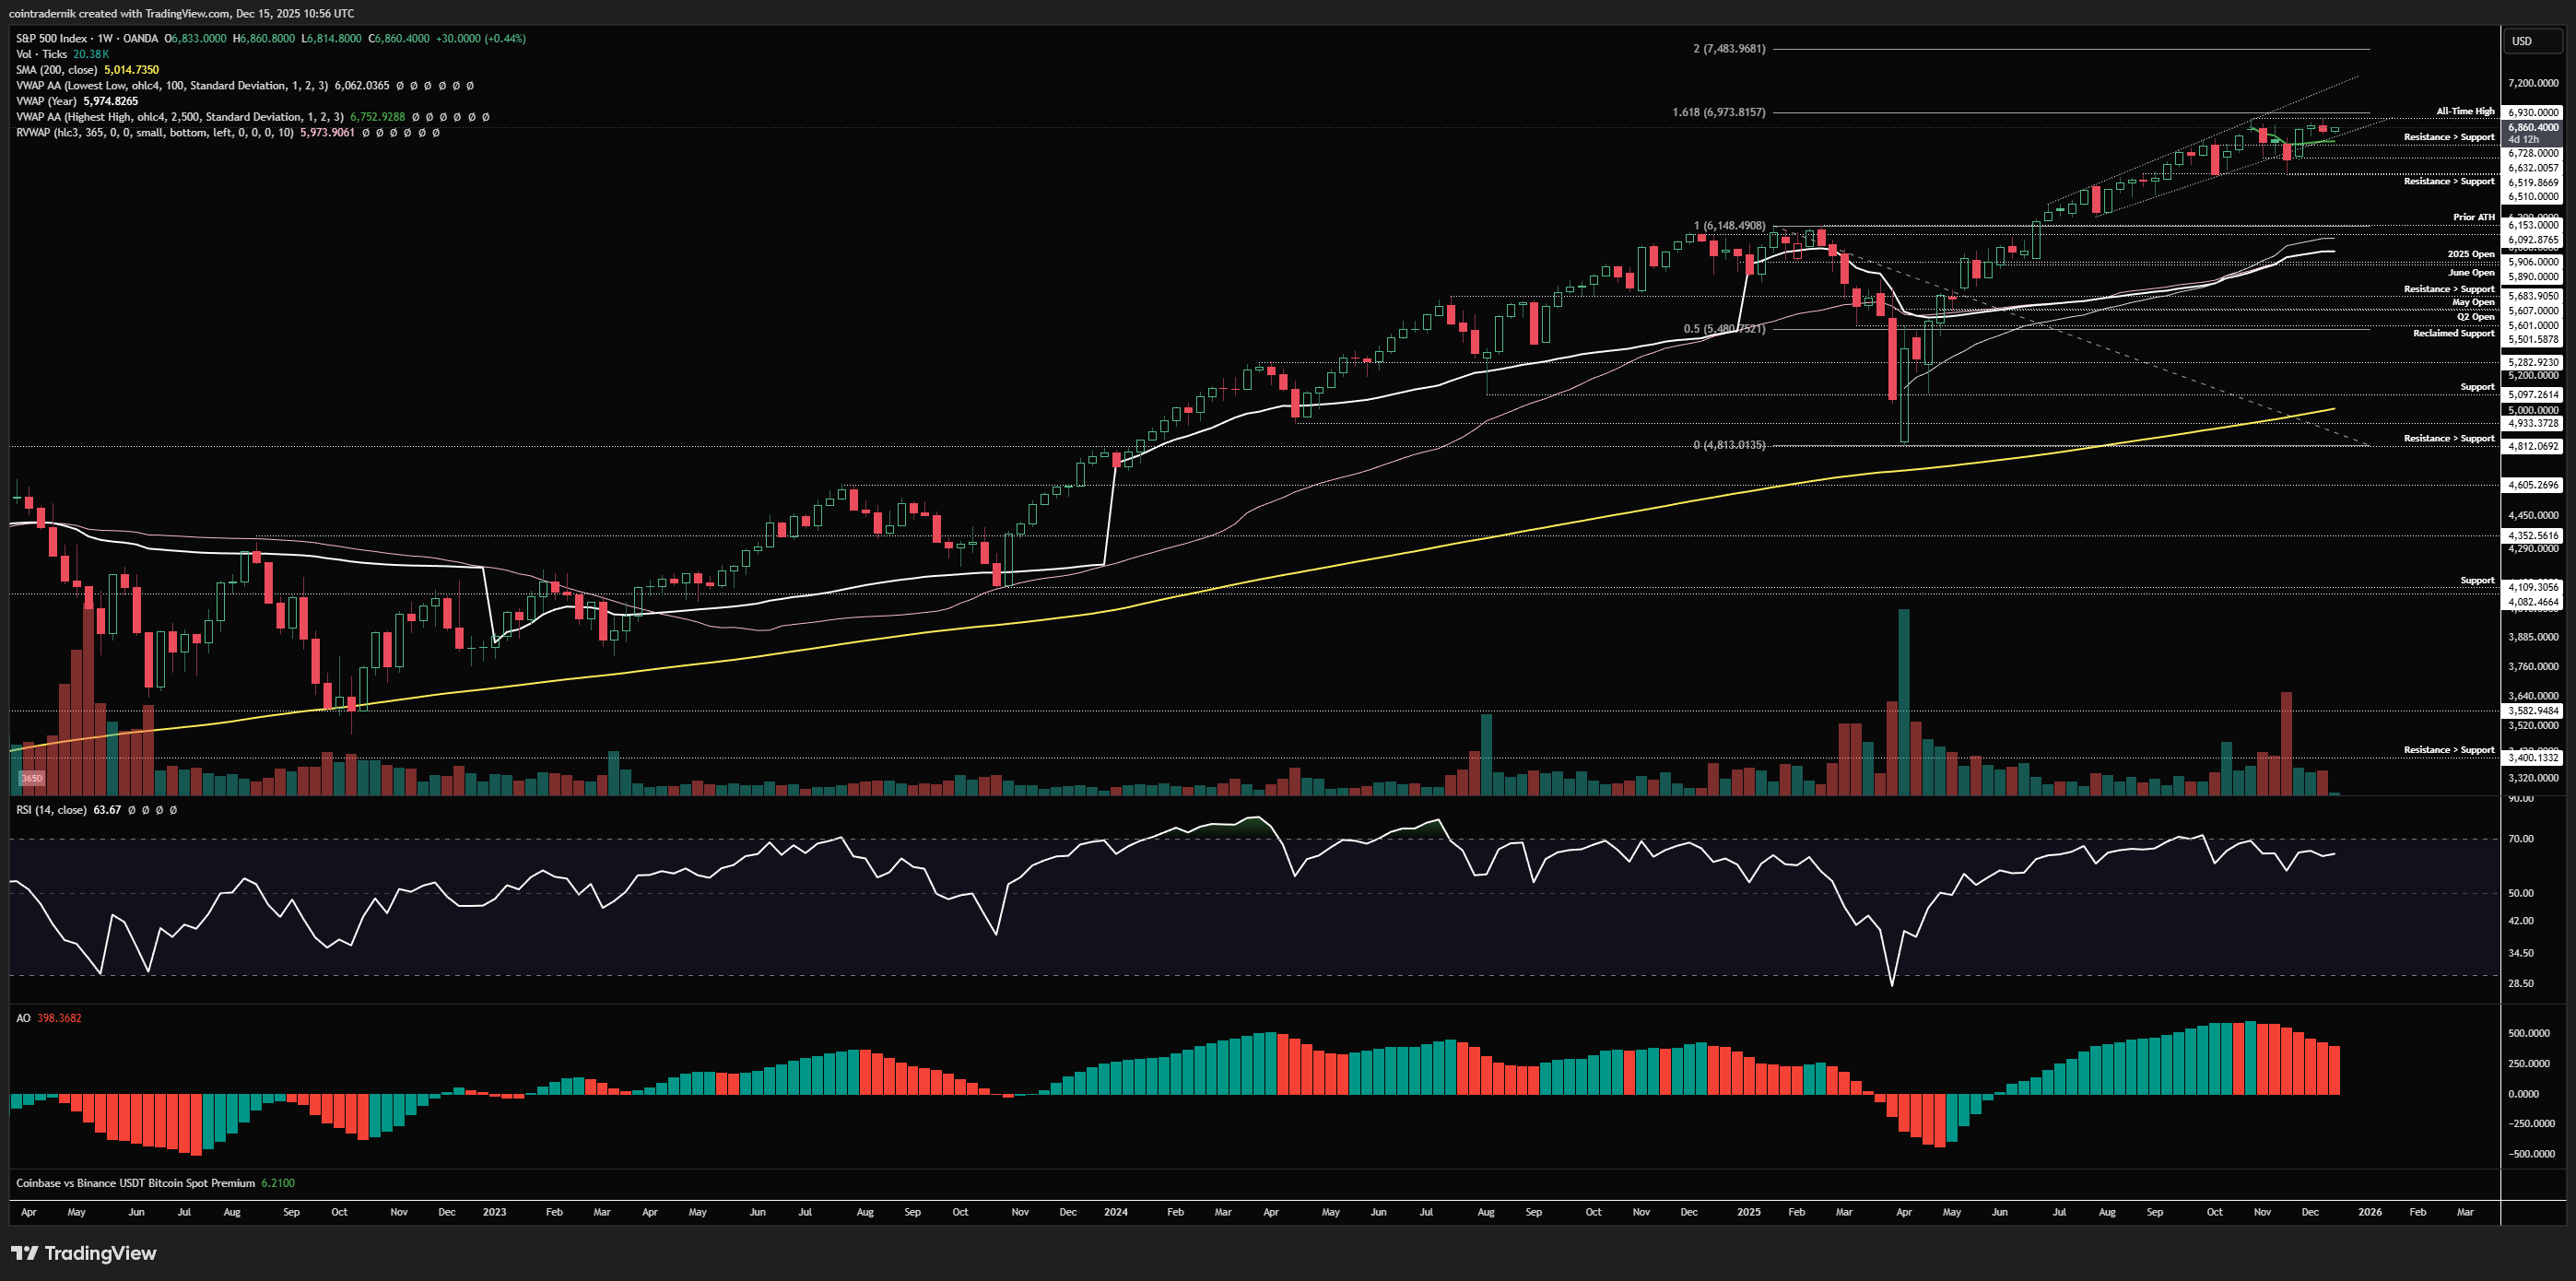
Beginning with the weekly for SPX, we retested all-time highs last week but rejected marginally below to close the week red, but the past couple of weeks has really just been consolidation above the anchored VWAP from all-time highs as support and below that $6930 high. We are back above channel support, and I know everyone is looking at the weekly divs and going 'right told you we're topping out', but these divs have not been validated yet - and in strong uptrends divergences get invalidated. I think it is much more probable that we see an upside breakout beyond $6930 and that leads to RSI invalidating these divergences with a higher-high, which in turn strengthens the trend and leads to another leg higher into Q1. If we do reject here, flipping $6730 back into resistance will be my first sign that all is not well and I would exit my levered equity exposure in that scenario and await a clearer picture or lower prices. If we turn $6730 into resistance with weekly RSI at fresh quarterly lows, that looks more like a breakdown is likely below the $6510 support. Until that starts to play out, your default should be to expect continuation of the trend here, in my opinion, where a weekly close above $6930 with weekly RSI back above 70 = melt up mode.
Daily:
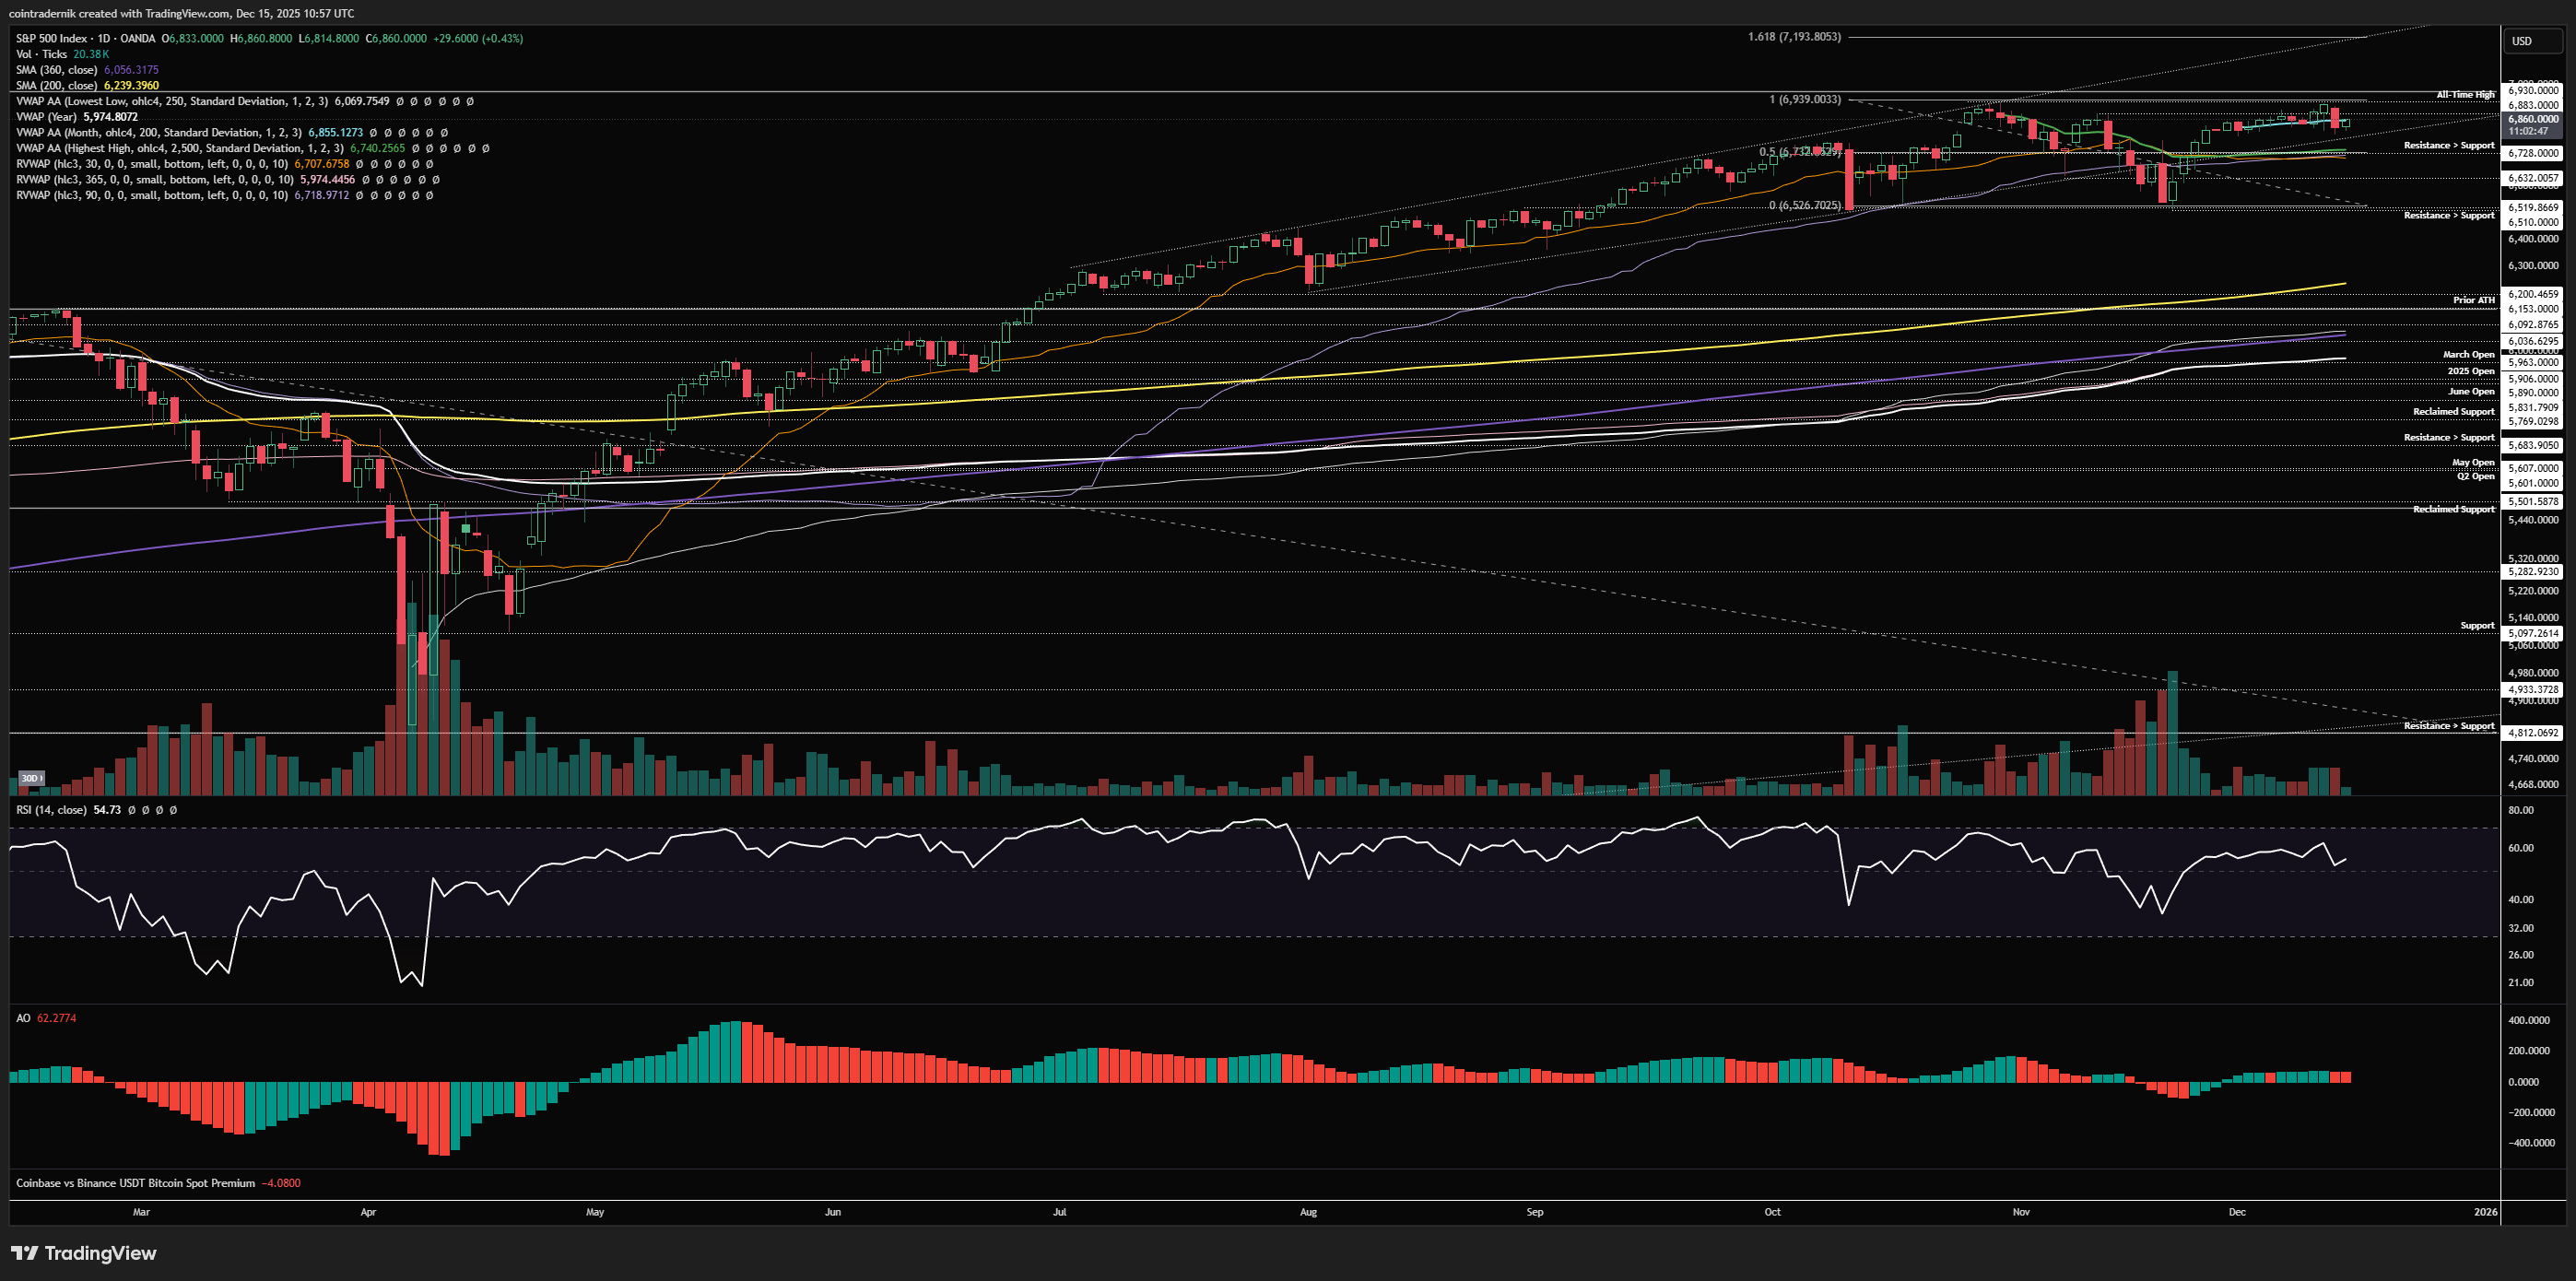
Turning to the daily, we can see that price really is just consolidating around the monthly VWAP, range-bound between massive support below and the all-time high above. If we can close the daily above the all-time high, I think we keep ripping from that point. In some ways it kind of feels like we're in that May period of price-action post-April crash, having just played out a mini-version of this as a massive bear trap in November. We're in a lower liquidity environment now with exacerbated chop in both directions, and I think as long as we are holding above that confluence of support at $6730 the market is much more likely to resolve higher and then just grind out fresh highs into January.
Price: $205.8bn
OTHERS/USD
Weekly:
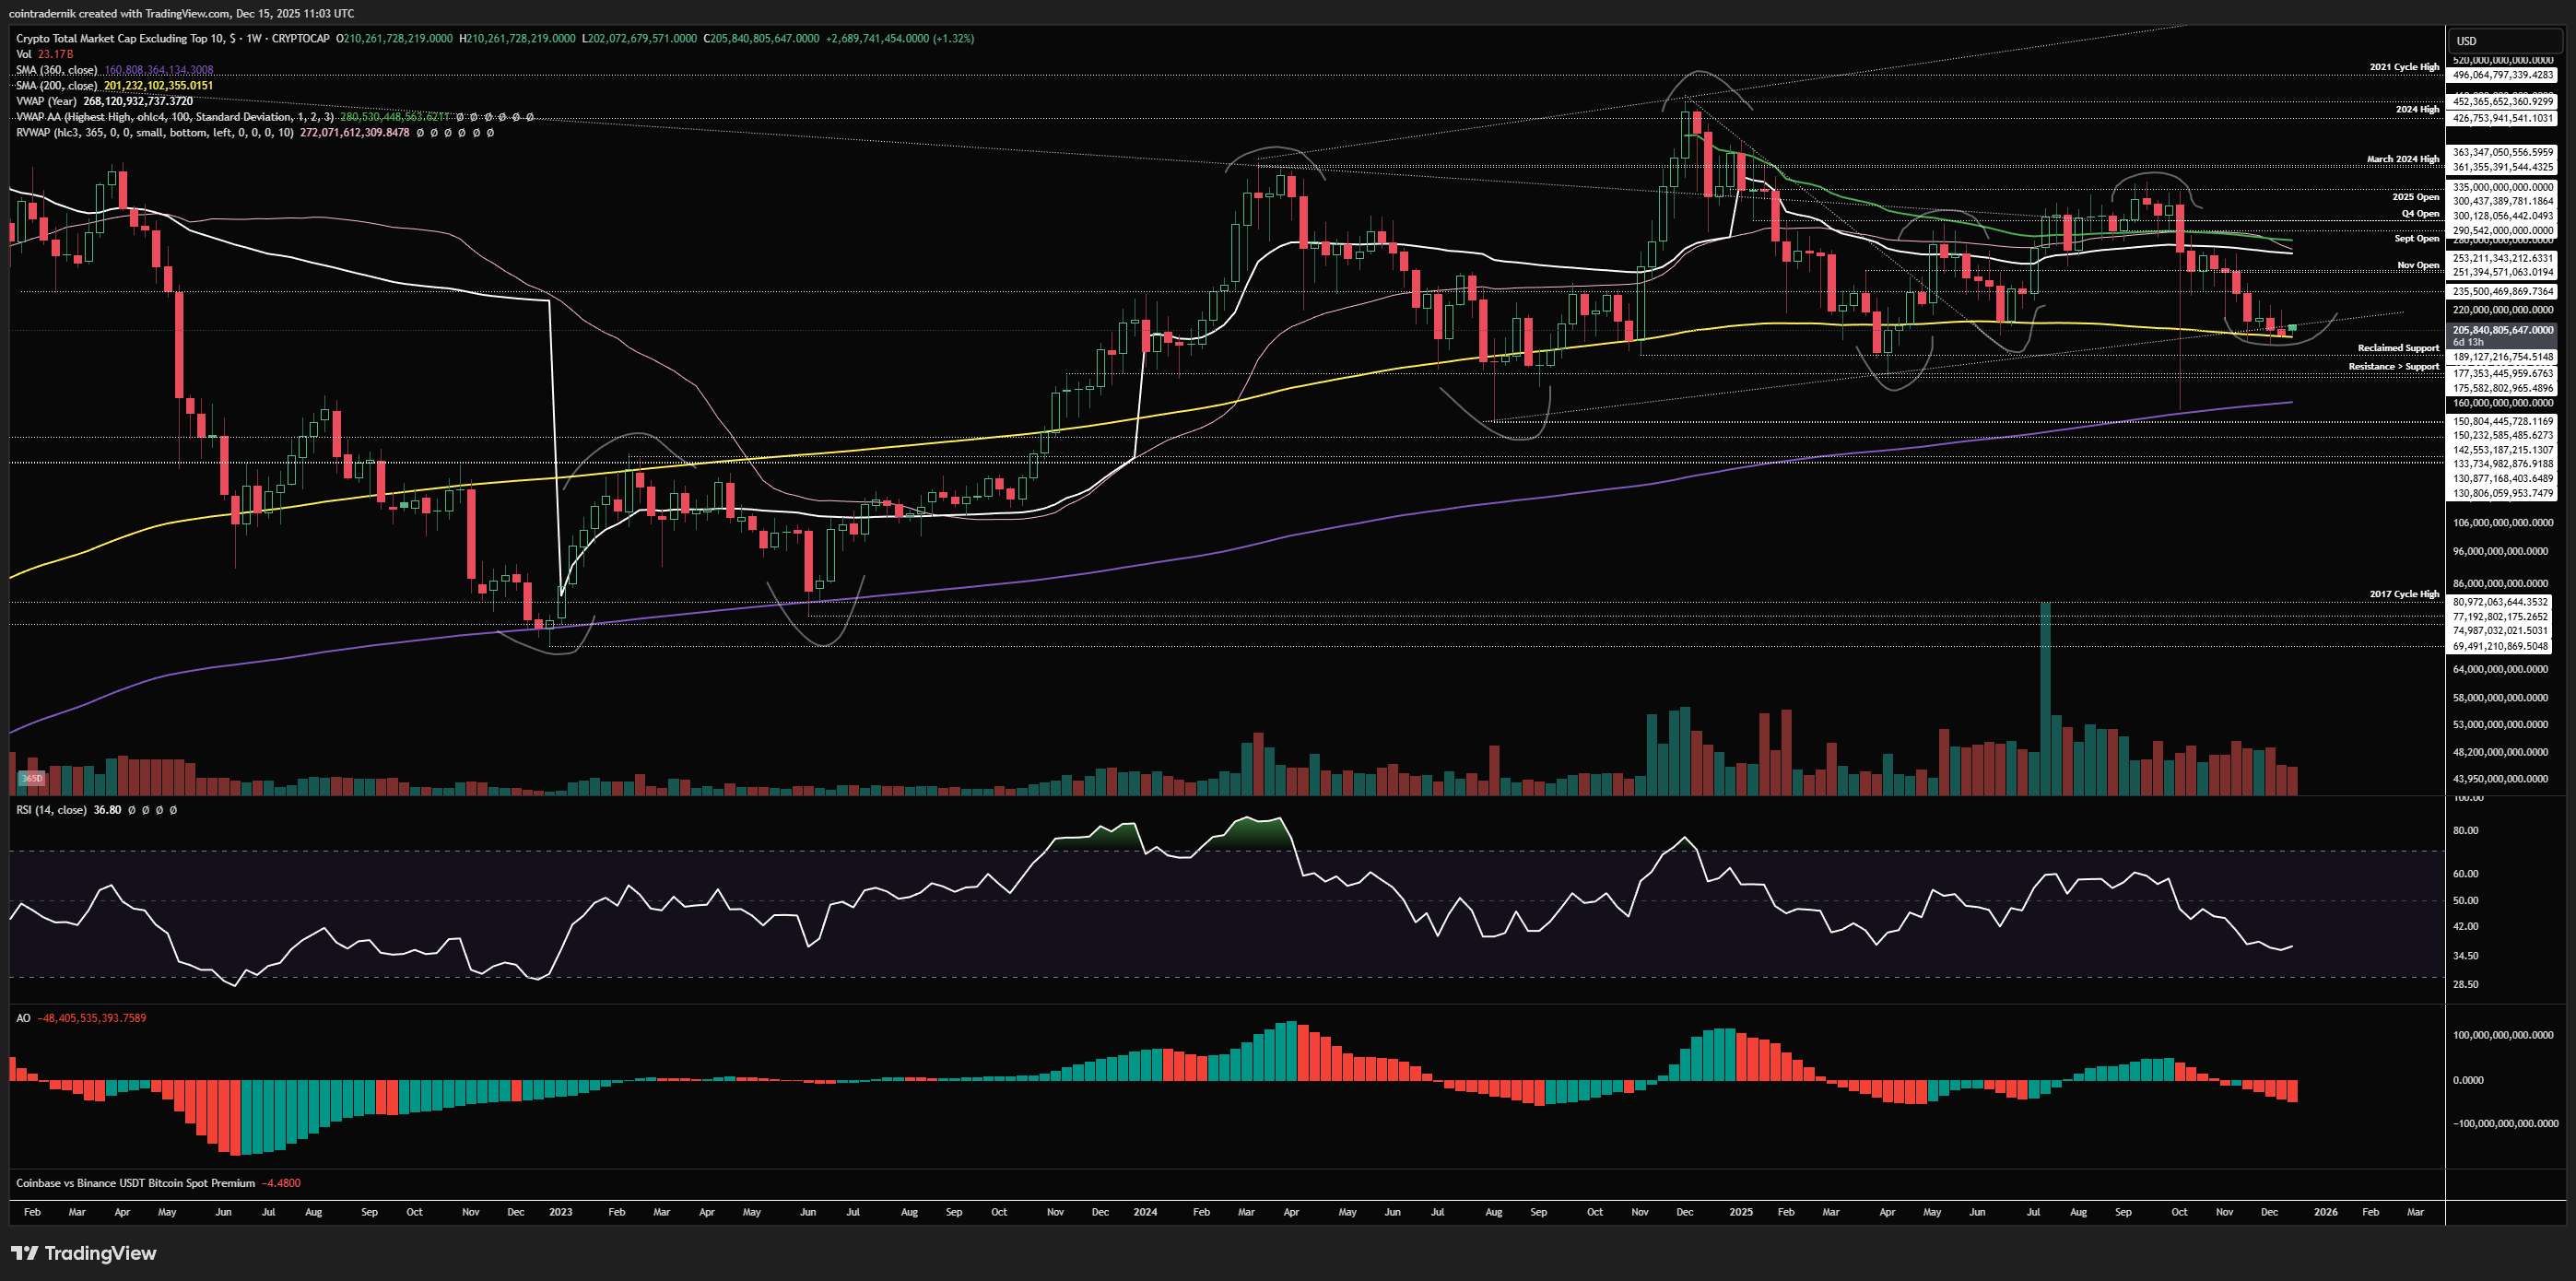
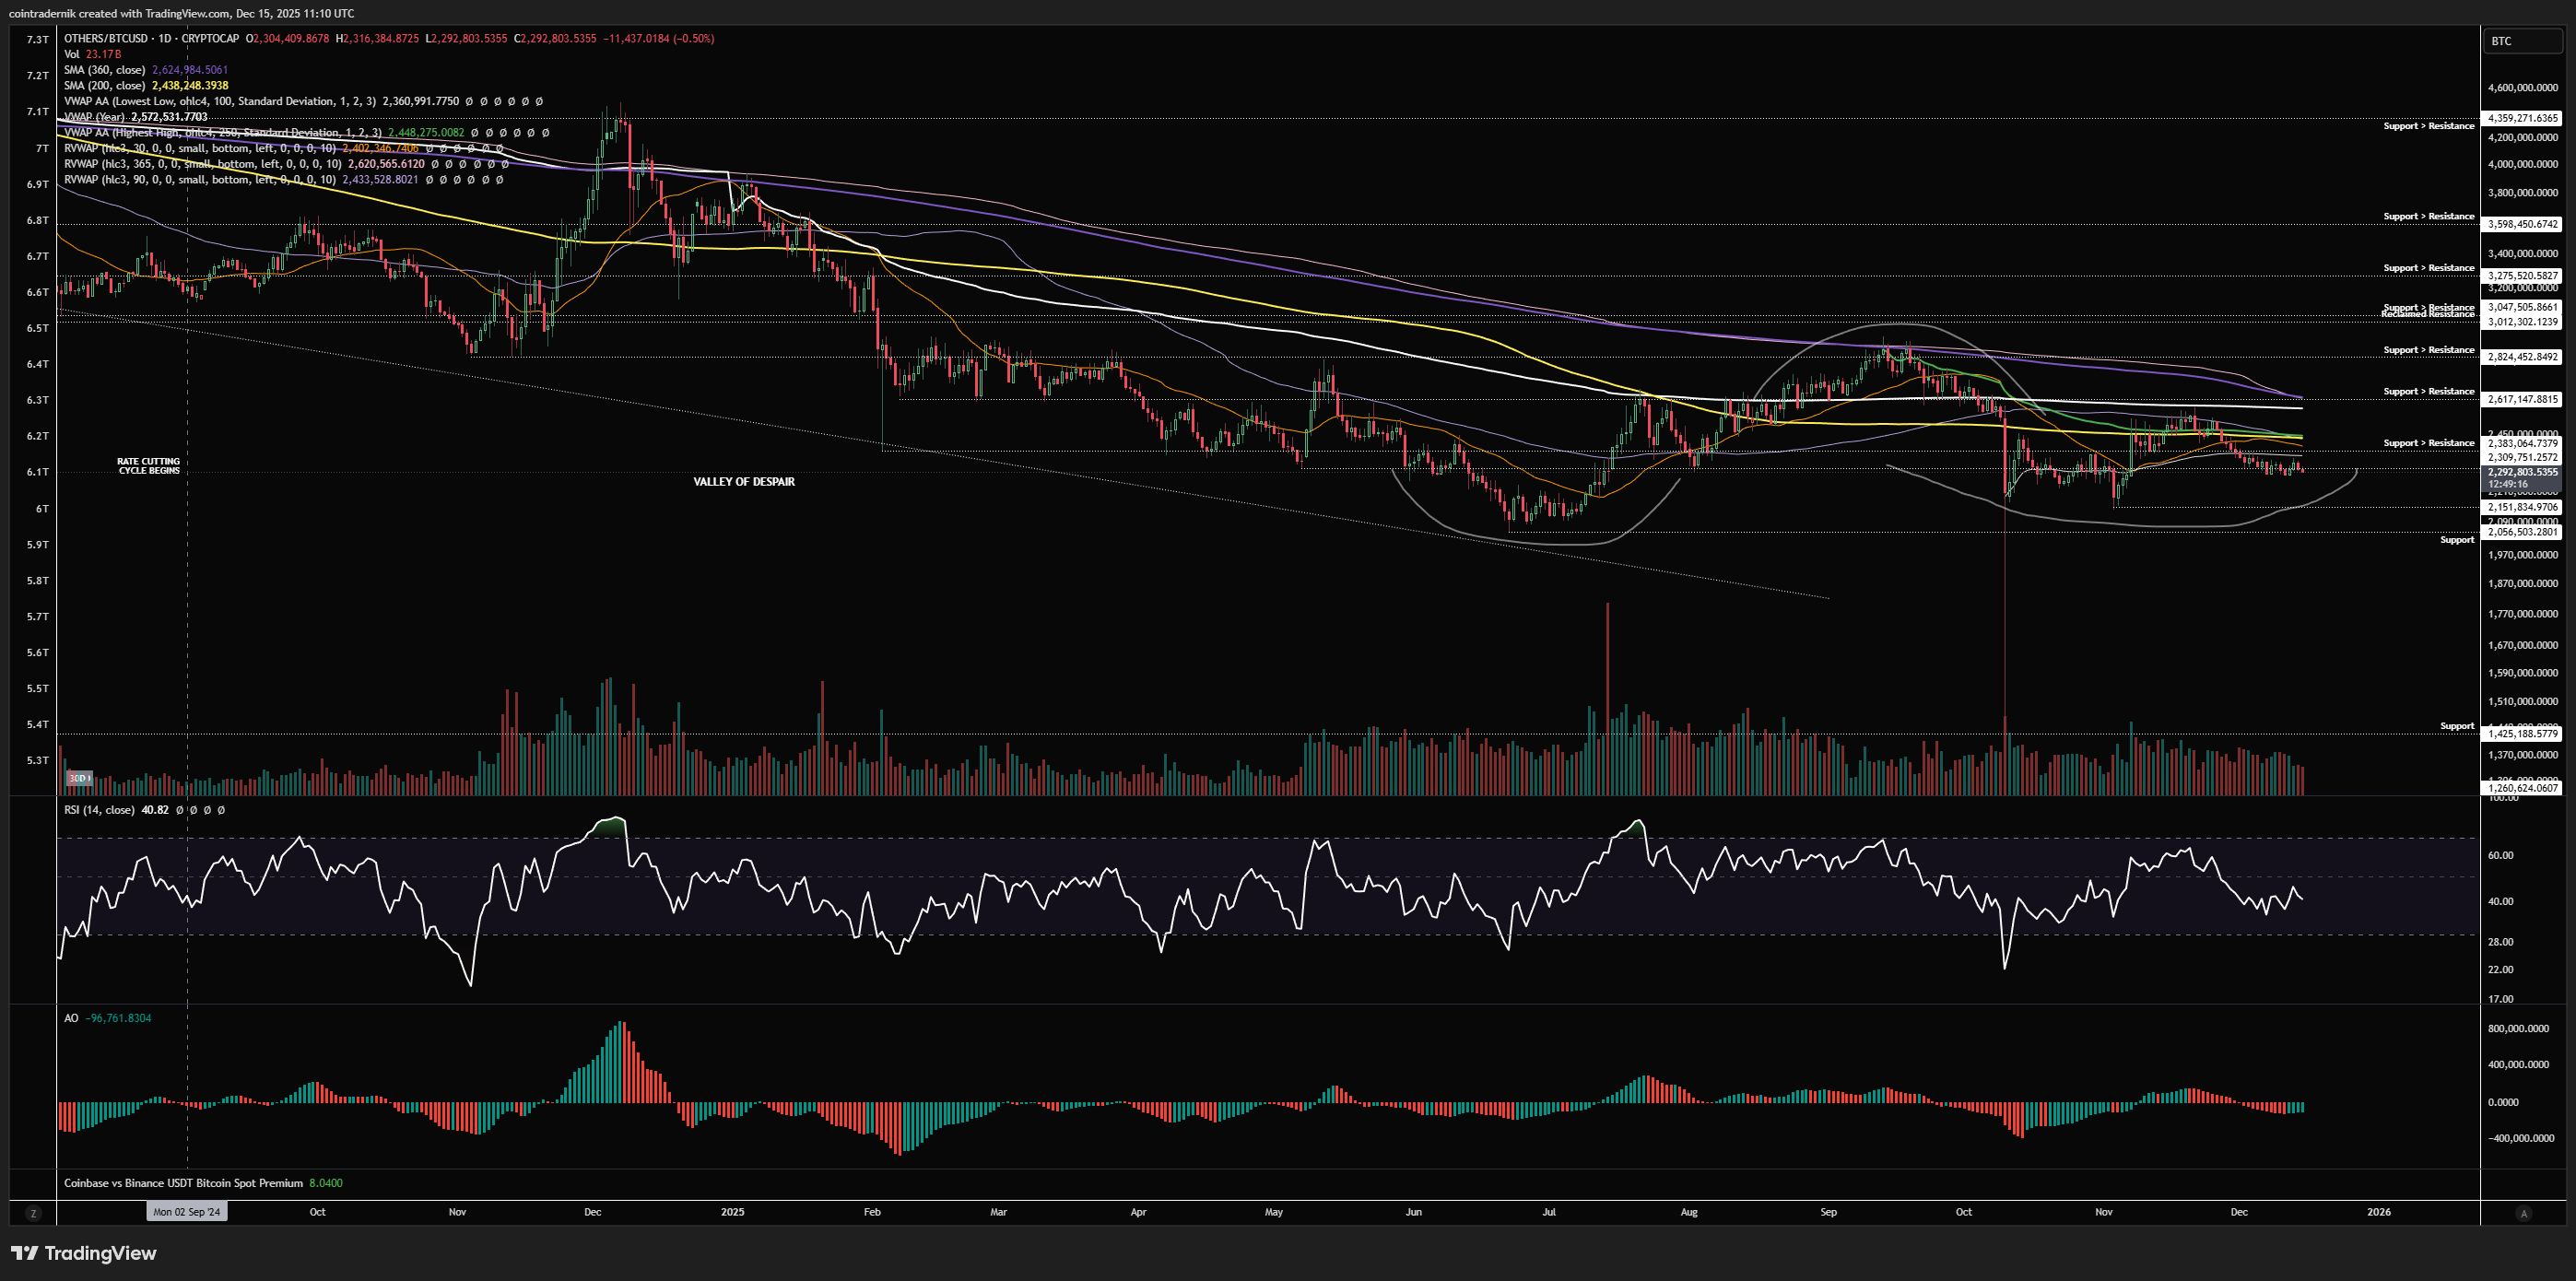
Beginning with the weekly view for OTHERS, we can see that alts have been chopping around the 200wMA for several weeks now with no real respite following 10/10's liquidation event. We are still in a multi-year uptrend, but the more recent uptrend from the April 2025 low is not quite so confidence-inspiring here, as price is sat eight at channel support and marginally below the summer lows. I think it is pretty important for OTHERS to mark out a low around this area, as it would look quite shit for alts if we lose this support and break and close below that April low around $177bn, where I would then expect another 20% of downside into the $150bn area, below which we have the bear market range resistance turned support into $130bn. Now, if we assume that support can hold here, then I would expect OTHERS to retest the confluence of resistance around the yearly VWAP, 365d rolling VWAP and anchored VWAP from the Dec 2024 high, all in that $270bn-$280bn range, over the coming weeks. That is where I would expect more sell pressure to step in on alts, but if my 'higher for longer' view is correct we should then form a higher-low above this current low and then flip that overhead resistance into support and run towards the top of the channel, into and above the Dec 24 highs. Rejection around $270bn as a lower-high followed by a lower-low below $175bn would be very bearish for 2026.
Daily:
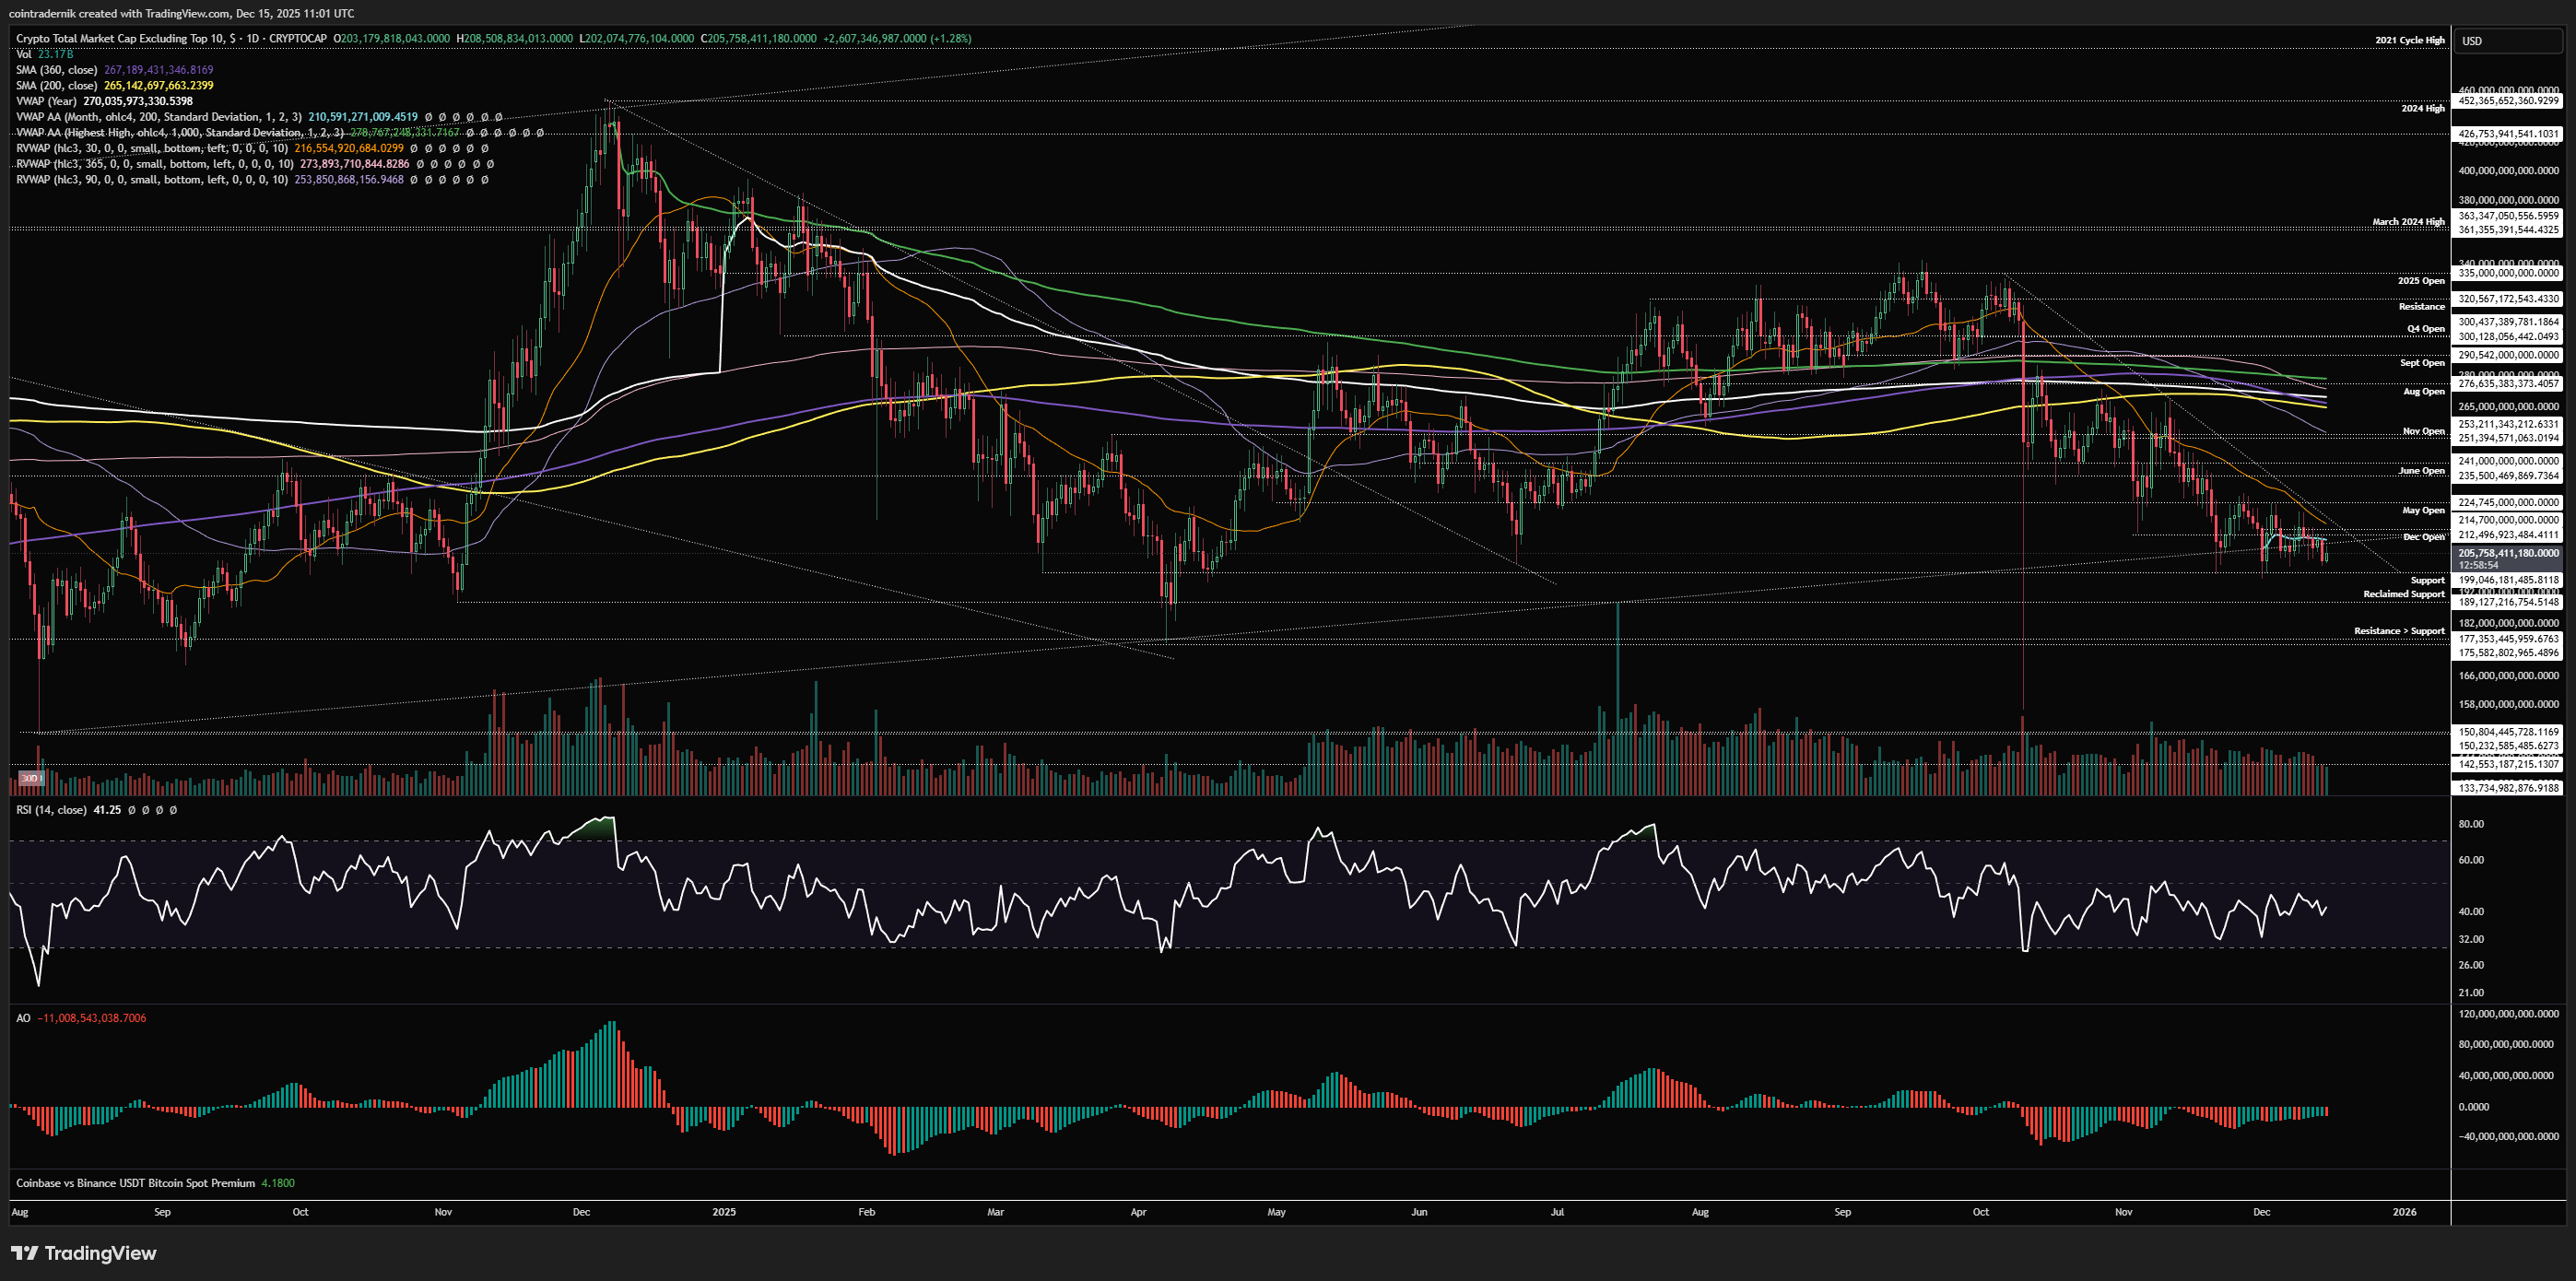
Looking at the daily, we can see that price has been compressing into a tighter range below the 30d rolling VWAP, with rallies capped by trendline resistance from the October high. Momentum is doing what you would expect in such a range - nothing. For a move to the upside here, we would want to see the $225bn prior support turned resistance reclaimed, with daily RSI back above 50 to confirm a momentum shift. In that scenario, I think we continue to see upside for alts towards that $275bn area on OTHERS over the subsequent weeks. If we pop above that trendline and reject, then flipping $200bn into resistance, I think there's a lot more near-term pain to come for alts as we retest the April low at $175bn.
OTHERS/BTC
Weekly:
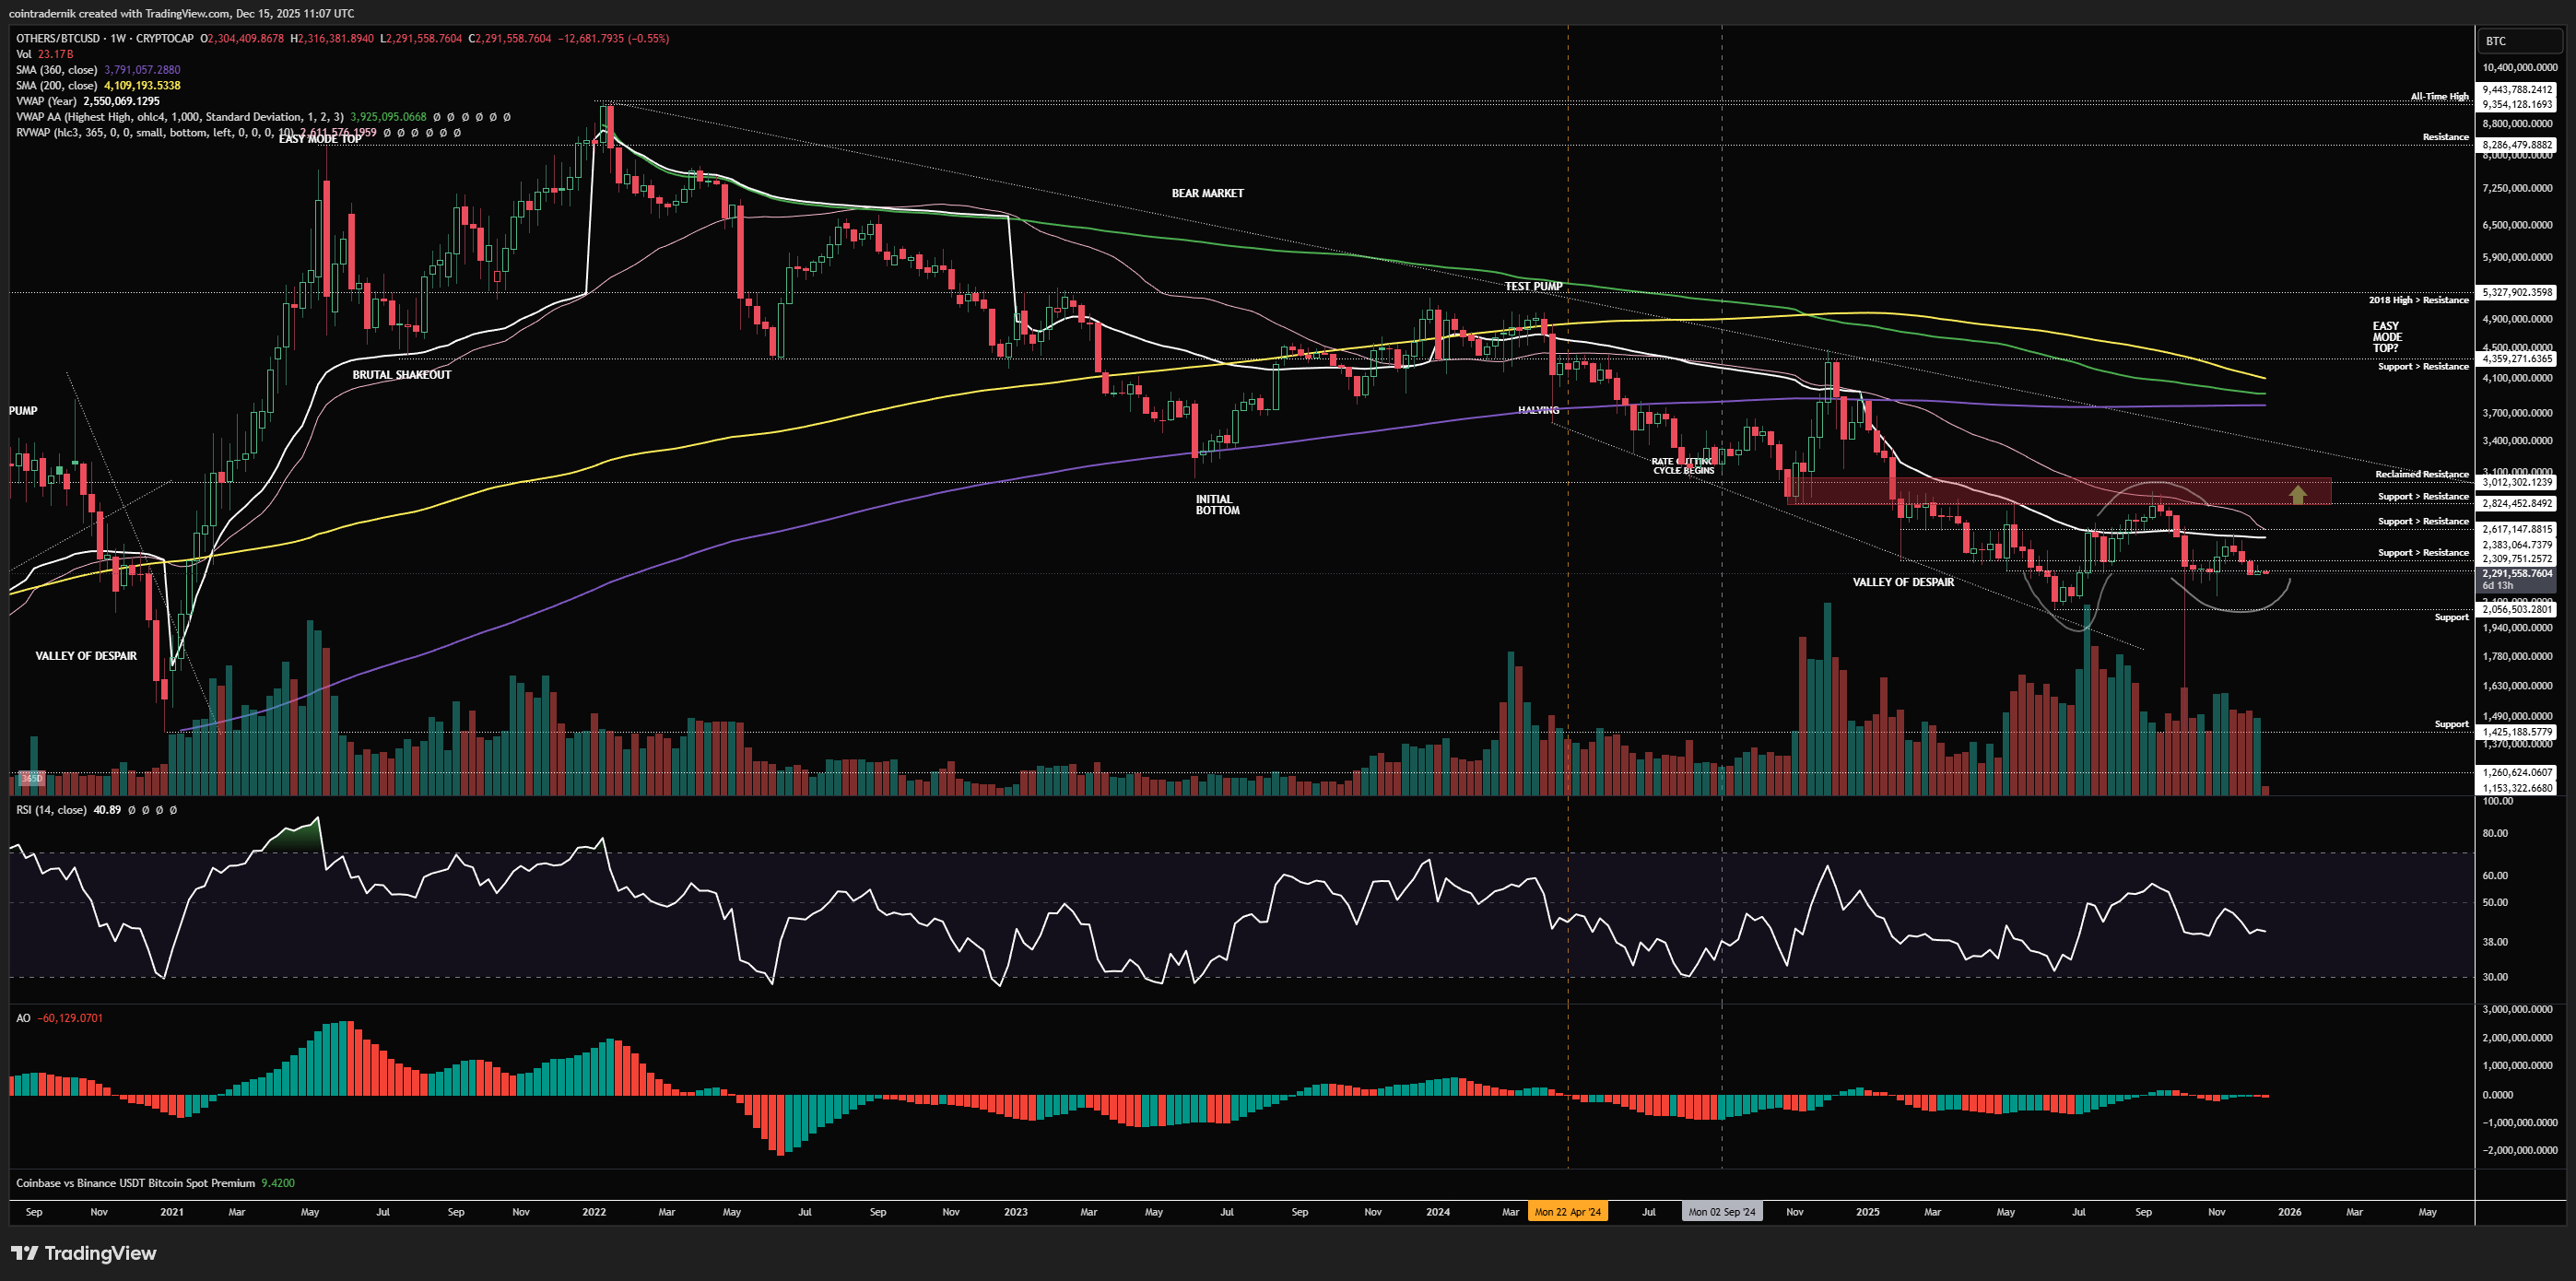
Turning now to the weekly timeframe for OTHERS/BTC, we can see that alts are still holding higher-lows vs BTC here after the 10/10 liquidation event, and are holding well above the summer lows at ~2mn BTC. This remains the key downside level for me, where a weekly close below that support opens up a much deeper retracement to fill in more of the capitulation wick, whereas flipping the yearly VWAP and 365d rolling VWAP overhead at 2.6mn BTC makes this chart look much more constructive. We have not seen OTHERS/BTC trade above that 365d rolling VWAP since Dec 2024, so if we flip that into support I think it's nailed on that we flip the major historical pivot at 3mn BTC, turning weekly structure bullish (again for the first time since Dec 2024). I think this is more probable than losing that 2mn BTC level into Q1, given how resilient alts have been vs BTC following such a huge capitulation event - and if we do turn weekly structure bullish above that September high I think OTHERS/BTC trades towards 4.4mn BTC.
Daily:
Finally, looking at the daily, we can see that there isn't a huge amount to add here: we have daily bullish structure whilst we are above that 2.15mn BTC swing-low, but we do need to see all that overhead resistance flipped into support at 2.6mn BTC to be more confident in the outlook for Q1. Right now, we're just seeing alts chop sideways vs BTC right around support, so no conclusions to be drawn here. If we trade lower, closing below 2mn BTC leaves zero levels of support below all the way into the bottom of the capitulation wick, so you absolutely would not want to be holding spot alts ex. top 10 in that scenario expecting outperformance of BTC. Whilst those support levels are holding, however, I think the bulk of the sell pressure is behind us and acceptance above the Nov high is what I want to see for a more durable period of outperformance to follow.
I hope you've found some value in the read this week!
And if you've not already signed up for Ostium, please do so and test out some of the recent updates, including:
Sign up here (you don't have to use my ref link, of course): https://ostium.app/trade?from=CL&to=USD&ref=CTNIK

.avif)