

Market Outlook #58
November 3, 2025
-
12
min read


This blog references an opinion and is for entertainment and informational purposes only. It is not intended to be investment advice. Seek a duly licensed professional for investment advice.
In this 58th Market Outlook here at Ostium Research, we'll be taking a look at the week ahead in markets, focusing specifically on price-action, positioning and event risk for Bitcoin, Ethereum, DXY, Copper and SPX.
Firstly, let's take a look at the calendar:
MONDAY: US ISM MANUFACTURING PMI (OCT): (CONSENSUS 49.2 VS PREVIOUS 49.1)
MONDAY: LOAN OFFICER SURVEY
TUESDAY: RBA INTEREST RATE DECISION: (CONSENSUS 3.6% VS PREVIOUS 3.6%)
TUESDAY: ECB PRESIDENT LAGARDE SPEECH
TUESDAY: US JOLTS JOB OPENINGS (SEP): (CONSENSUS N/A VS PREVIOUS 7.227M)
WEDNESDAY: US ADP EMPLOYMENT CHANGE (OCT): (CONSENSUS 25K VS PREVIOUS -32K)
WEDNESDAY: US ISM SERVICES PMI (OCT): (CONSENSUS 51 VS PREVIOUS 50)
THURSDAY: BOE INTEREST RATE DECISION: (CONSENSUS 4% VS PREVIOUS 4%)
THURSDAY: BOE GOVERNOR BAILEY SPEECH
THURSDAY: US INITIAL JOBLESS CLAIMS: (CONSENSUS 227K VS PREVIOUS 218K)
THURSDAY: VARIOUS FED SPEECHES
FRIDAY: US NONFARM PAYROLLS (OCT): (CONSENSUS 50K VS PREVIOUS 22K)
FRIDAY: VARIOUS FED SPEECHES
Now, let's dig into asset-specific price-action for the week ahead, looking firstly at Bitcoin:
Price: $107,105
Weekly:
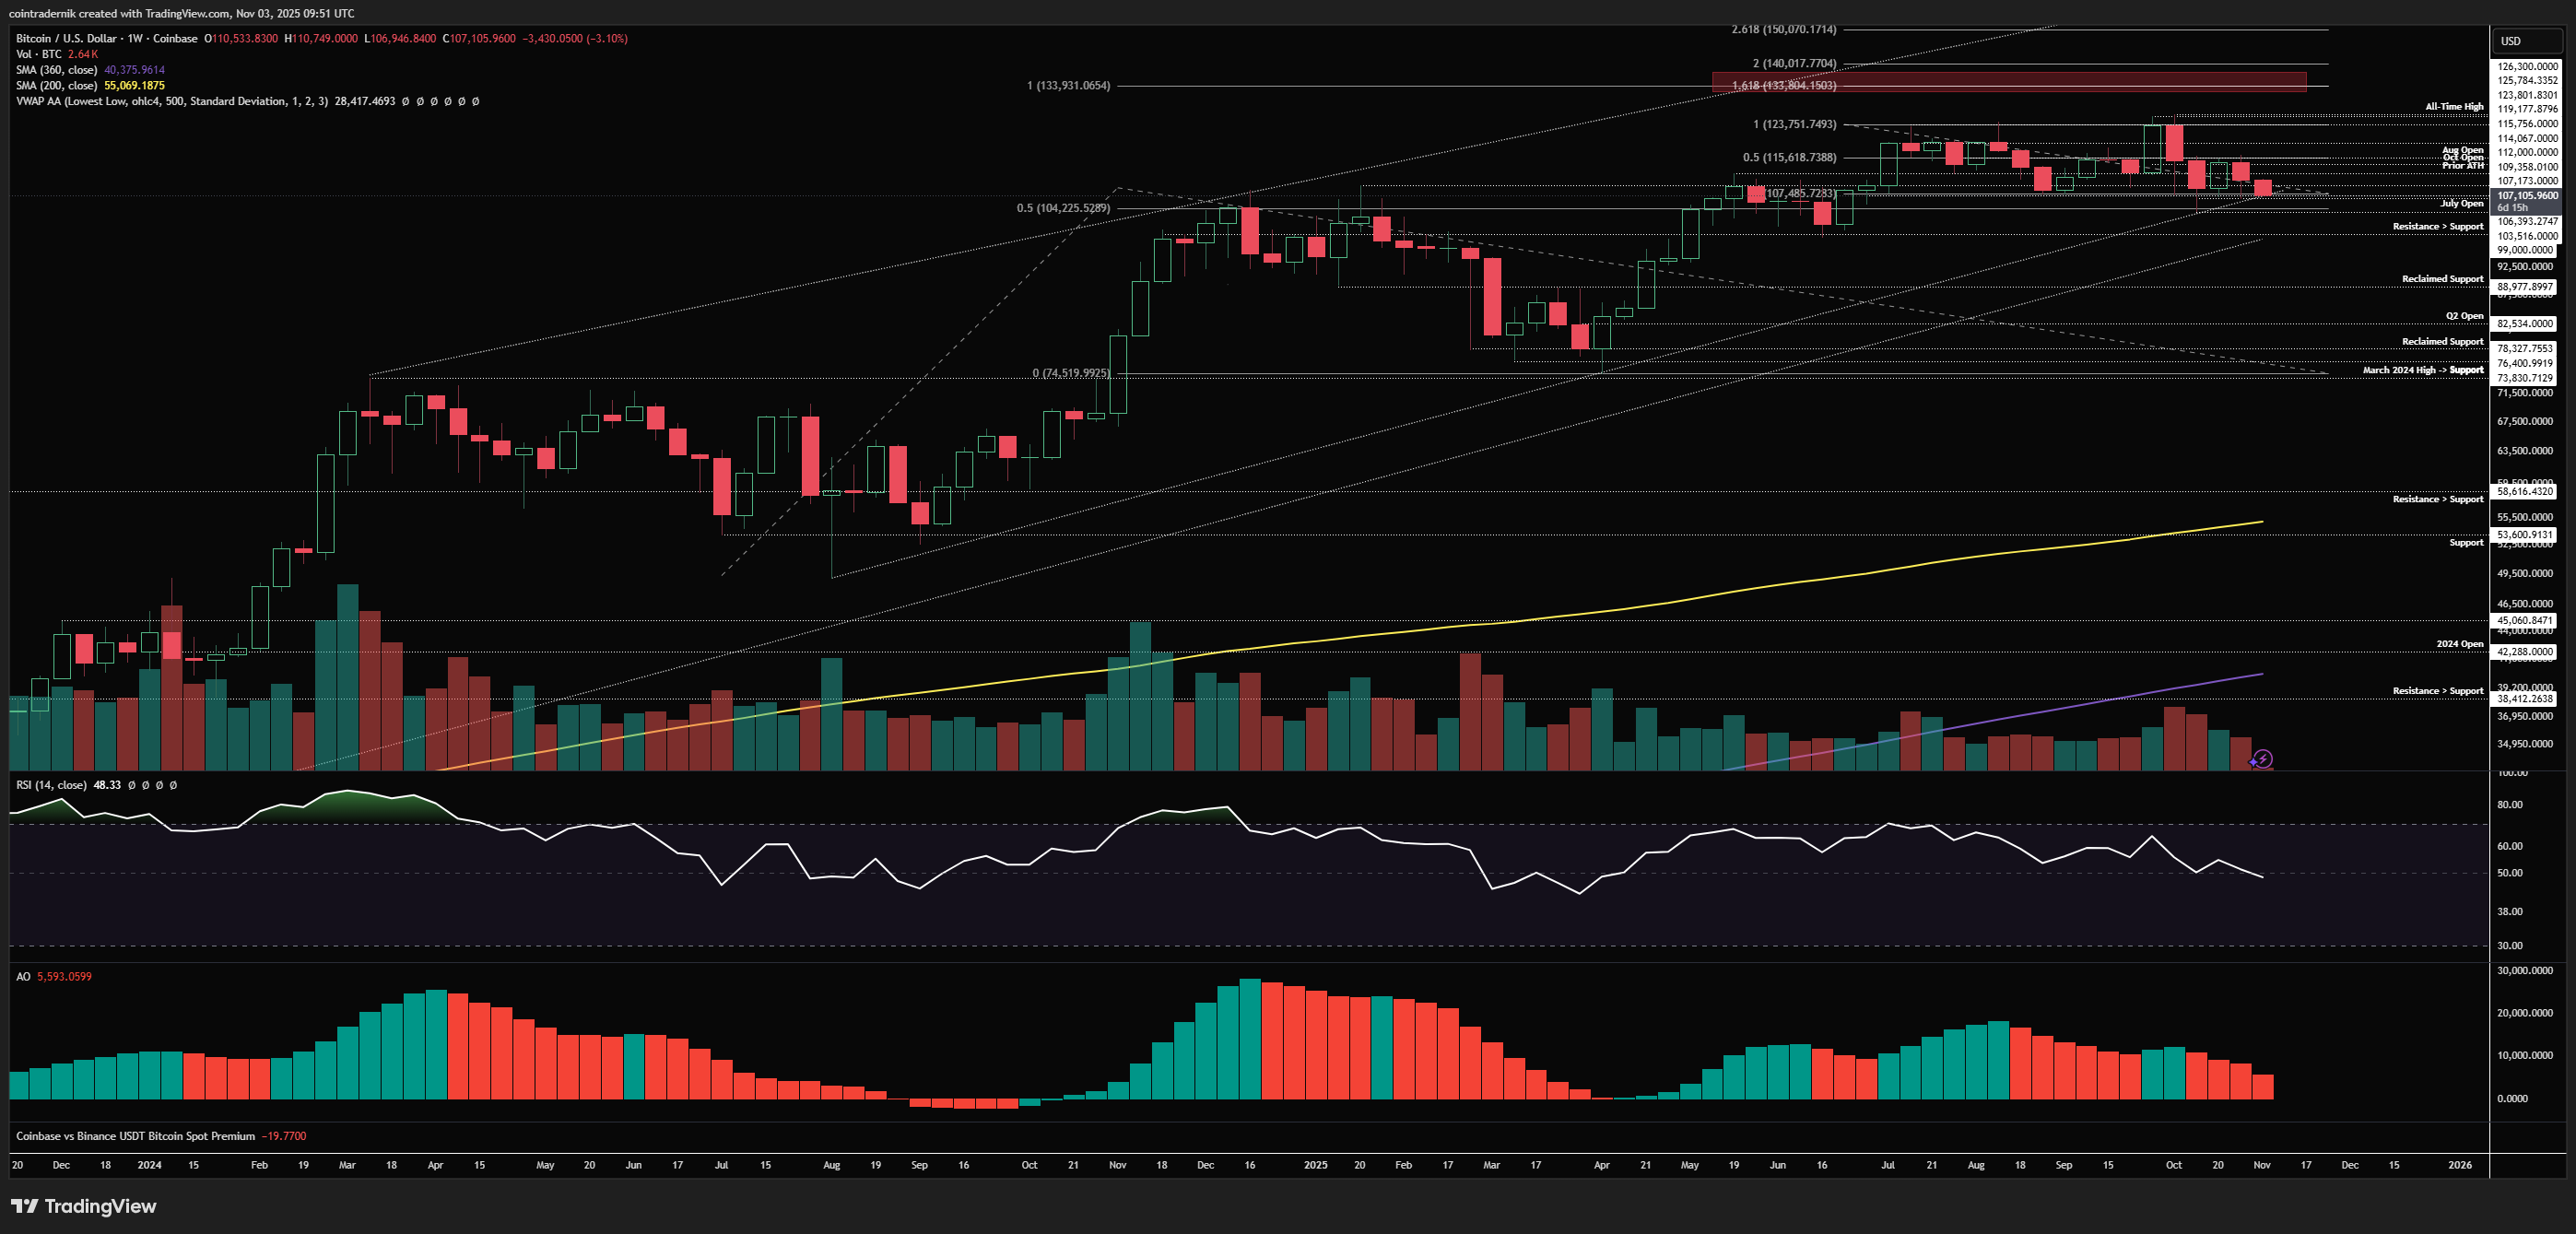
Beginning with the weekly view for BTC, we can see that price struggled last week at key resistance, selling off from the weekly open below $116k into the previous weekly low, sweeping that $107.5k support into trendline support and then bouncing to close at $110.5k. Volume continues to decline whilst weekly RSI is still hovering around 50, still a little higher than where momentum marked out a bottom during the two prior major lows (August 2024 and April 2025). Early trading this week has seen price sell off right from the midnight weekly open at $110.5k into $107k, above which it sits now. As mentioned last week, I do not want to see $107k flipped into resistance on the weekly timeframe here, as that would make it more probable we trade into that $100k short-term, where there is significant support but where I would not be surprised to see a wick through that swing-low at $99k. If we do flip $107k into resistance this week and close below it, I will be cutting my swing long on BTC for a partial loss and reassessing on a reclaim or down near that $98k-$100k zone. If this is instead marking out the weekly and monthly low, as I currently suspect is the case, we should see price trading back into and above the weekly open by mid-week, but importantly holding above it into the weekly close, where a close above $116k remains the strongest and clearest signal for a return to all-time highs.
Daily:
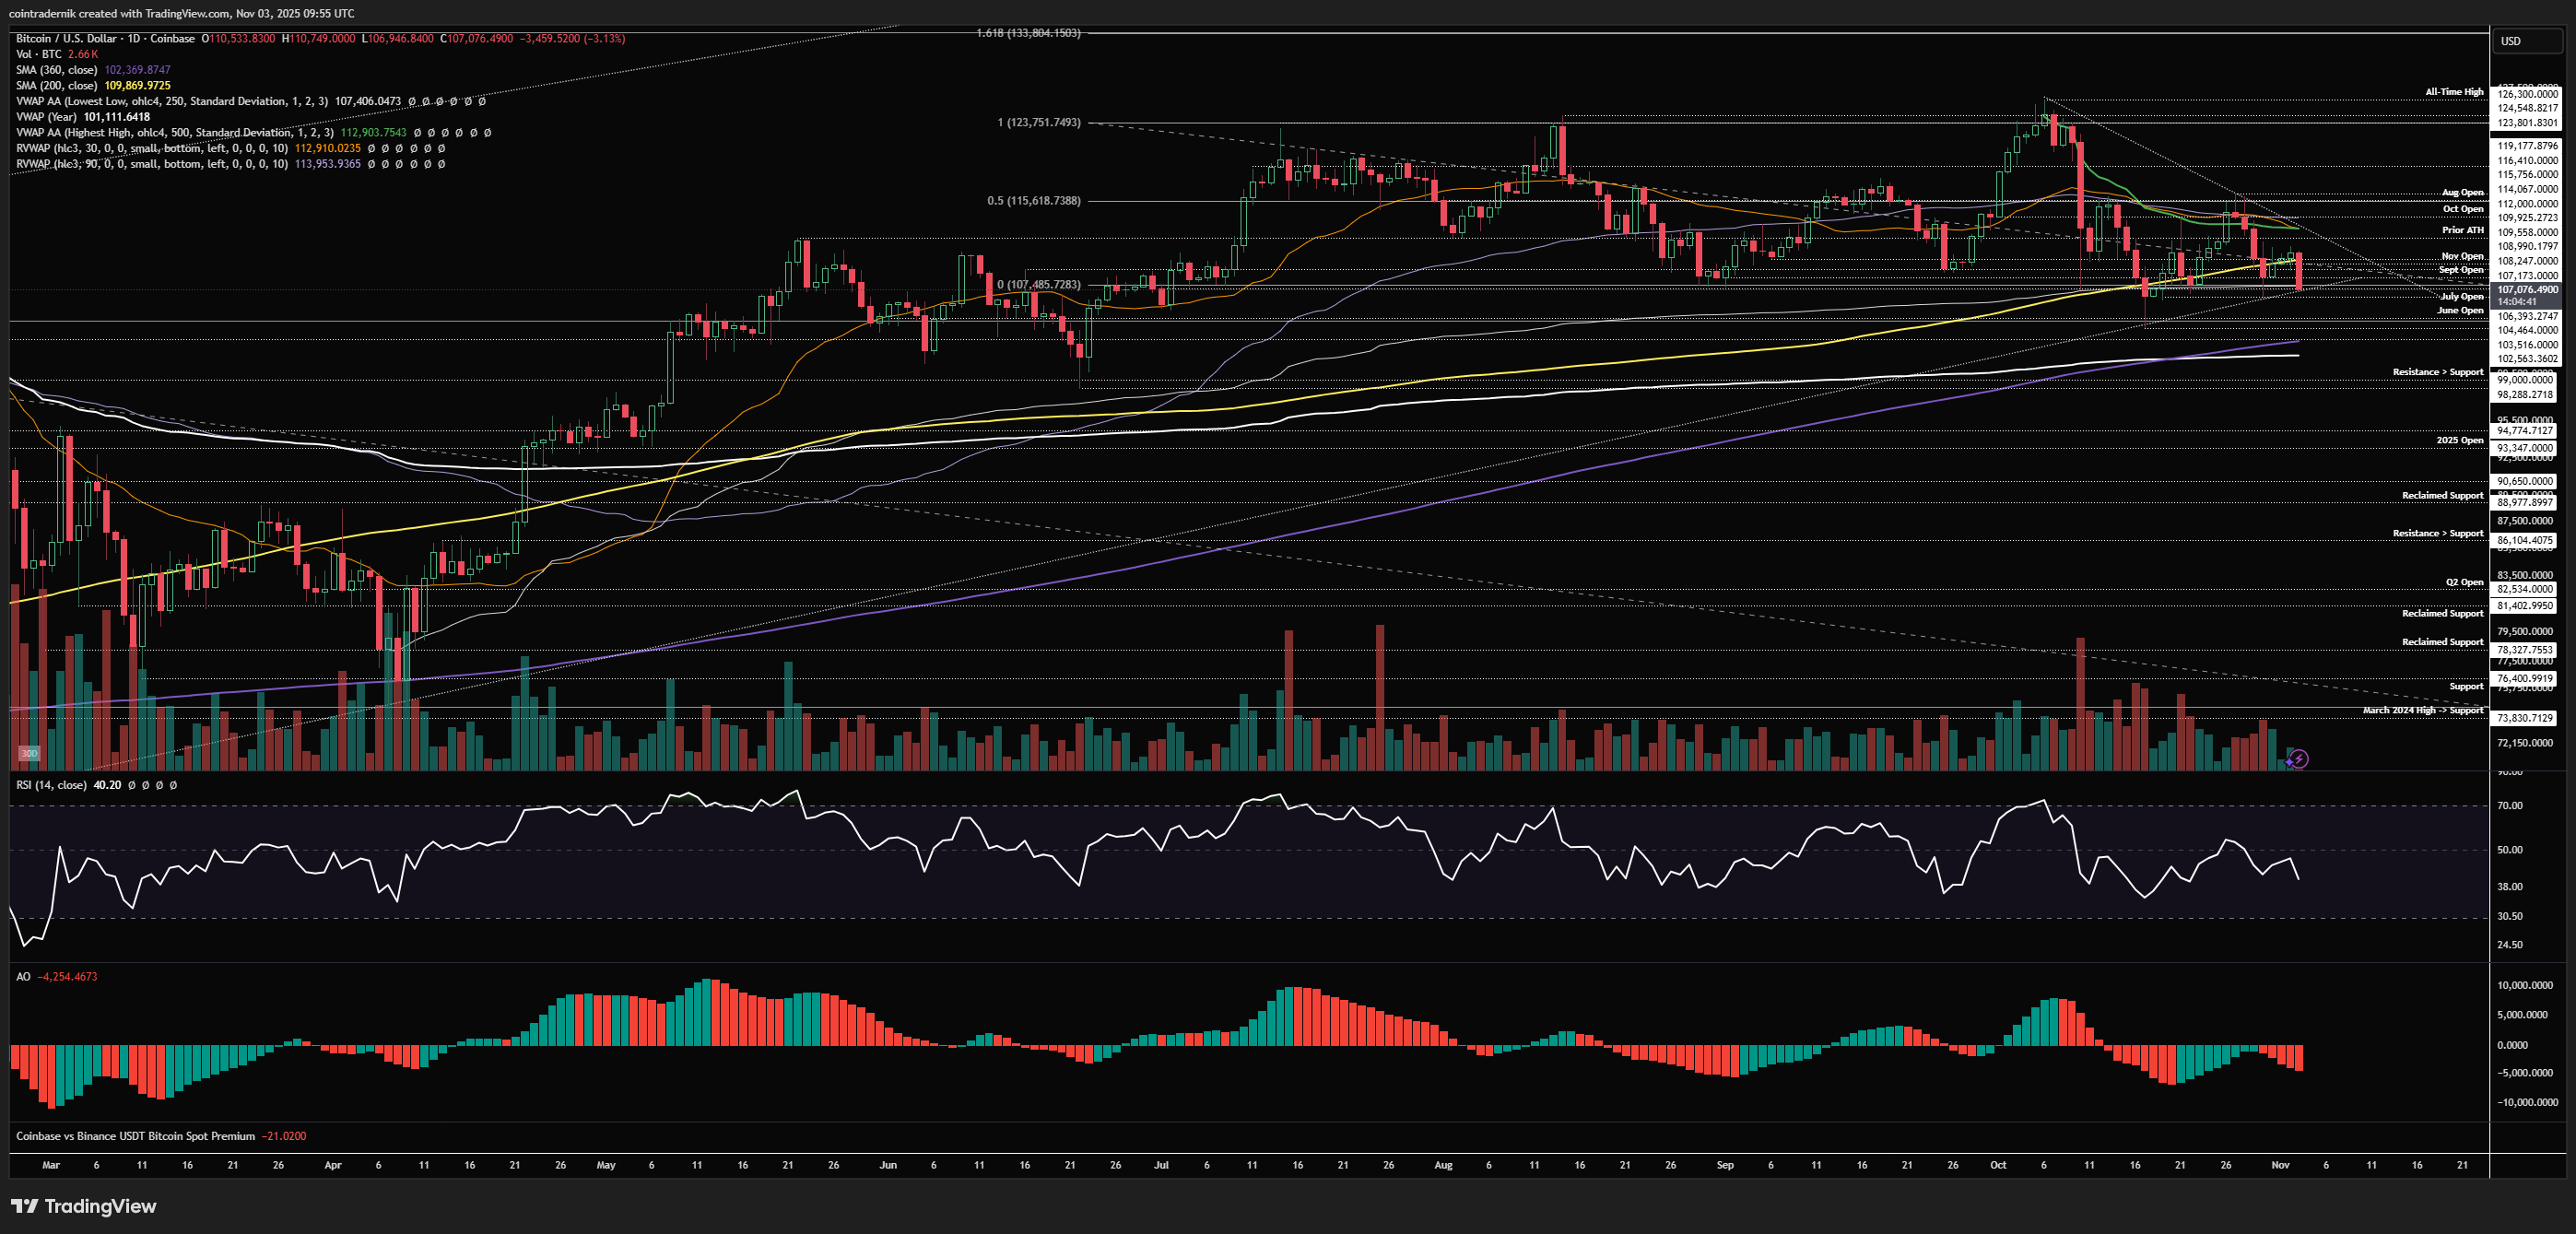
Turning to the daily, we can see how price sold off from the open today, taking out the weekend lows into this range support, but daily structure is technically bullish until we close the day below $106.4kish. That being said, as highlighted last week, structure here is a little iffy as whilst we do have the higher-highs and lows off the $103.5k swing-low a couple of weeks ago, we were capped by the swing-high that preceded that low at $116k, which we failed to close above last week and instead flipped into resistance. What has followed has been the rejection from that key level. Nonetheless, I would view this as bullish structure until we close below $106.4k, after which we would be bearish again on the daily timeframe and it would be very probable we take out the $103.5k lows into the major cluster of support below that, which I maintain as my bullish line in the sand for my year-end bullish outlook. Close below $98k and I think the bears have won for the next couple of months at least - until then, I am still bullish but will look to close my swing long from $111k below $106k if we flip it into resistance. As to what we might expect of this week, if a bullish bias is to be maintained we should be flipping today's open at $110.5k into support back above the 200dMA into mid-week and then breaking out above trendline resistance into the weekly close, where we still have that massive zone of resistance overhead.
Now, looking at weekly setups, there is actually a high probability but short-dated long here, which is simply to expect a retracement and retest of the weekly open and weekly high given how the high formed within the first 10 minutes of the open. You could look for longs anywhere in this area between $106k-$107k and add back above the session VWAP and Sept open at $108.3k, looking for a run of $110.5kish, where hedging or TPing makes sense short-term until you get a clear reaction off that resistance zone (where you could look for fresh longs back above $112k on a trendline breakout, potentially):
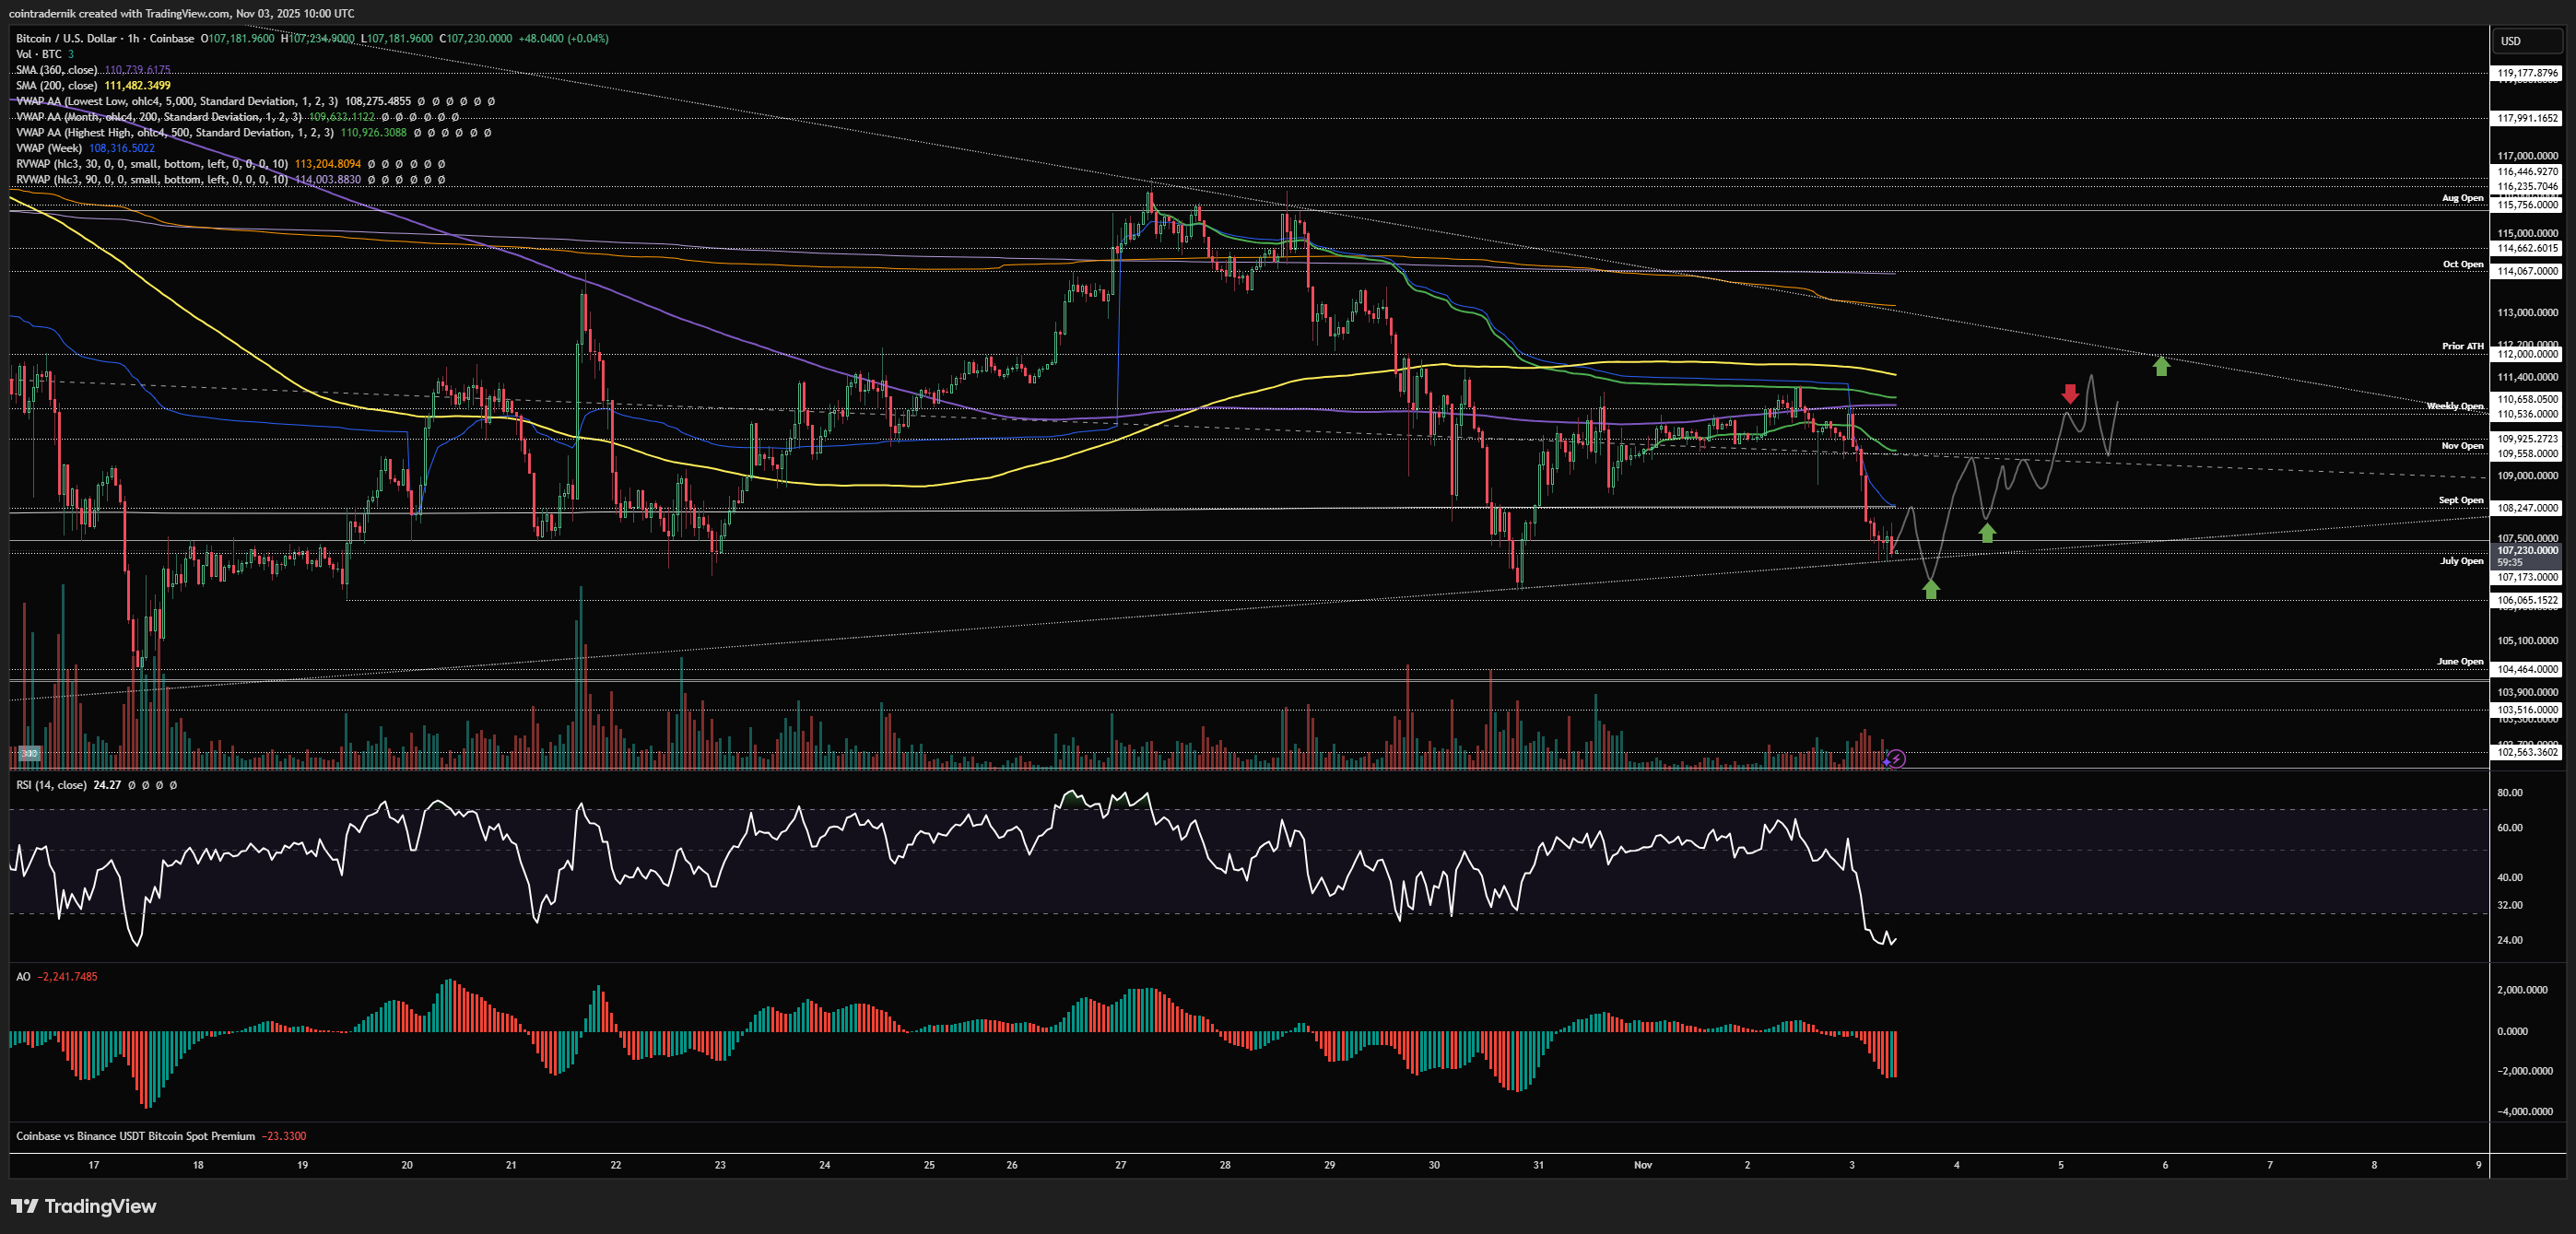
On the short side, I would just wait for that run of the weekly high into resistance (if it comes), ideally occurring mid-week, where you'd look for trend exhaustion above the weekly high and then enter shorts back below $110.5k and add below the Nov open for a full retrace of the move into $103.5k (and obviously if I start seeing this develop later this week I will be exiting my long and potentially entering this short depending on how it shapes up):

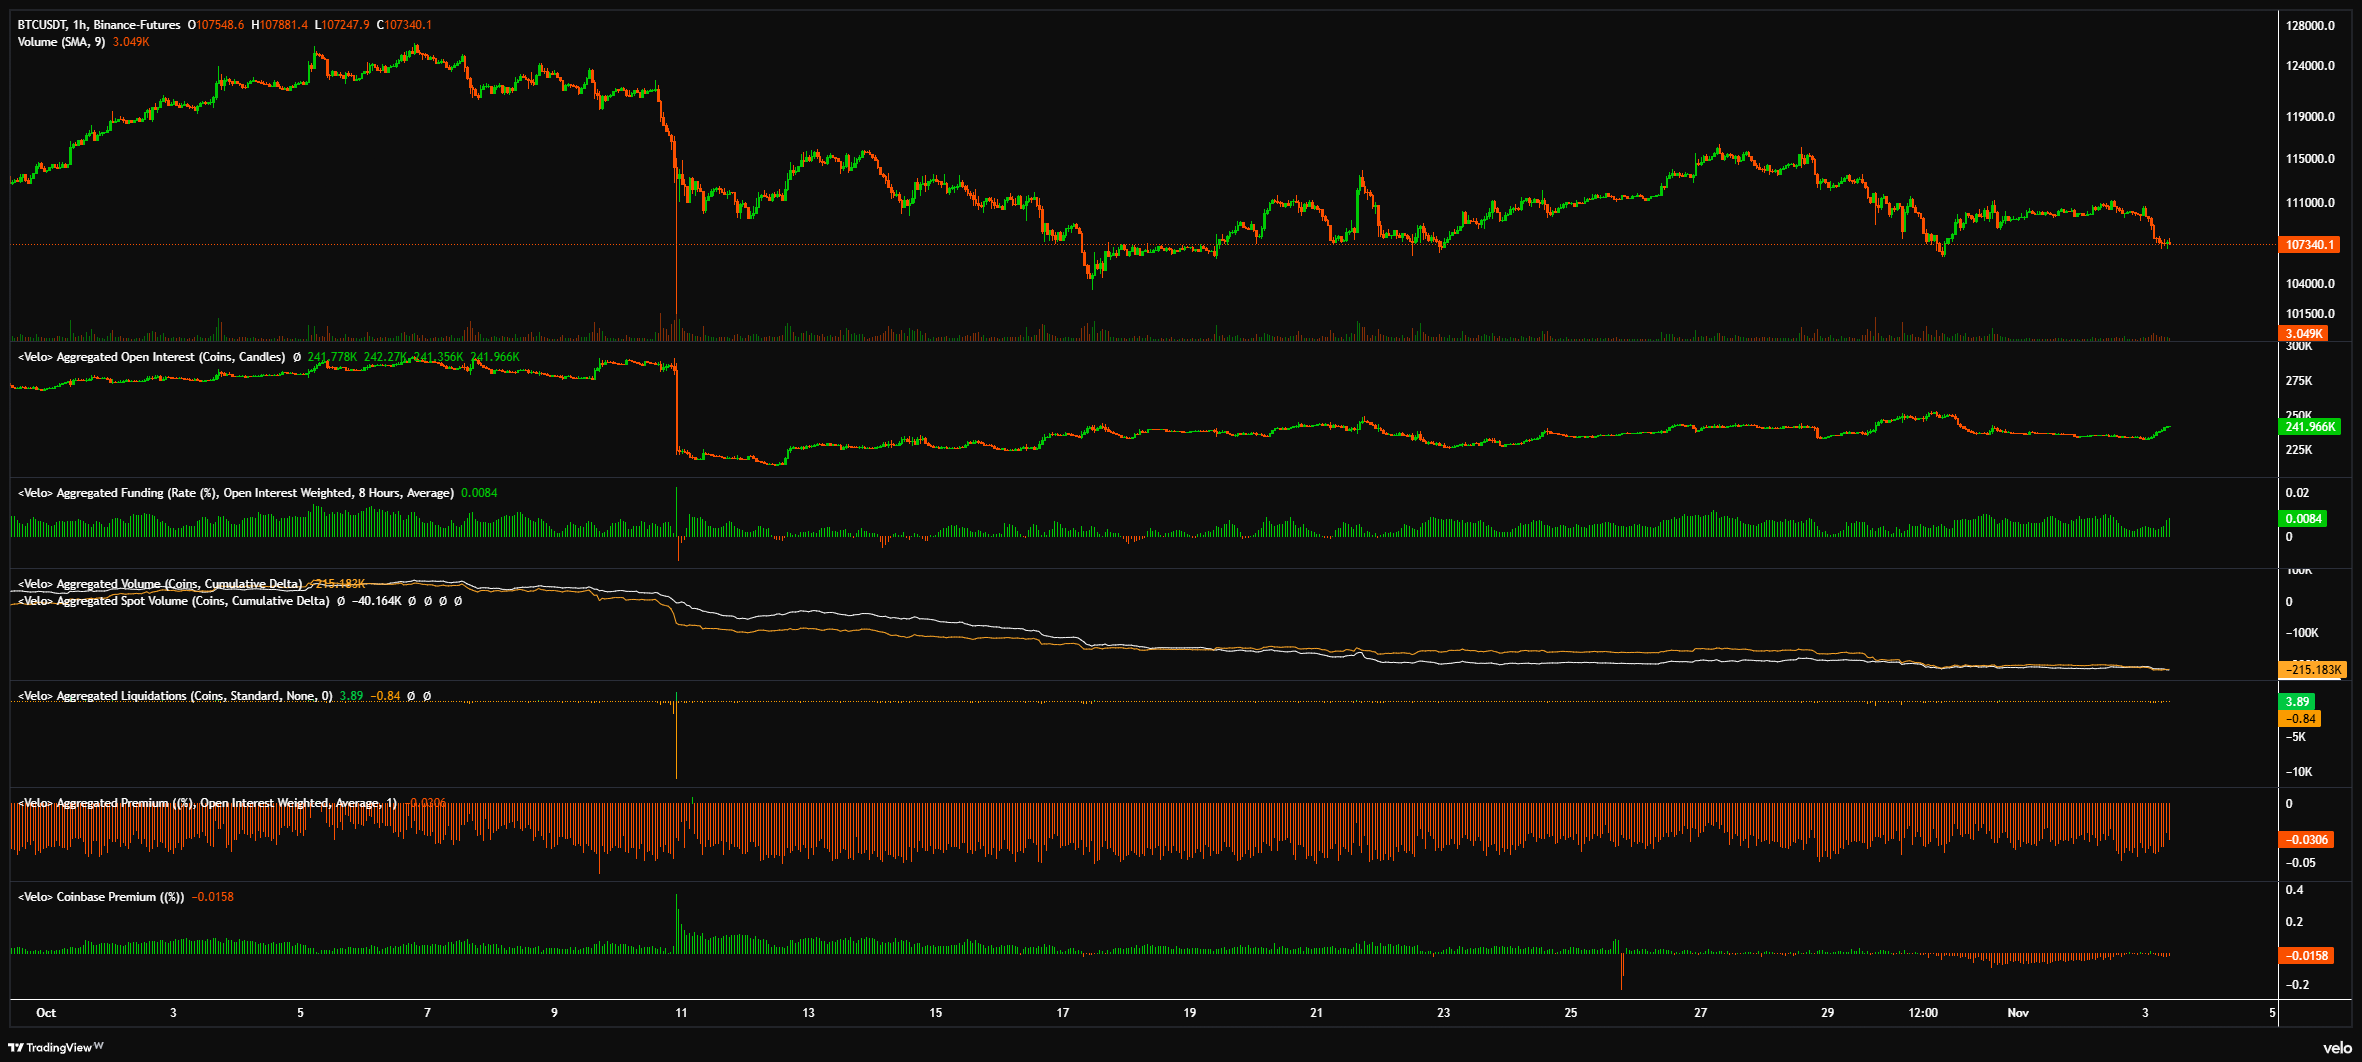
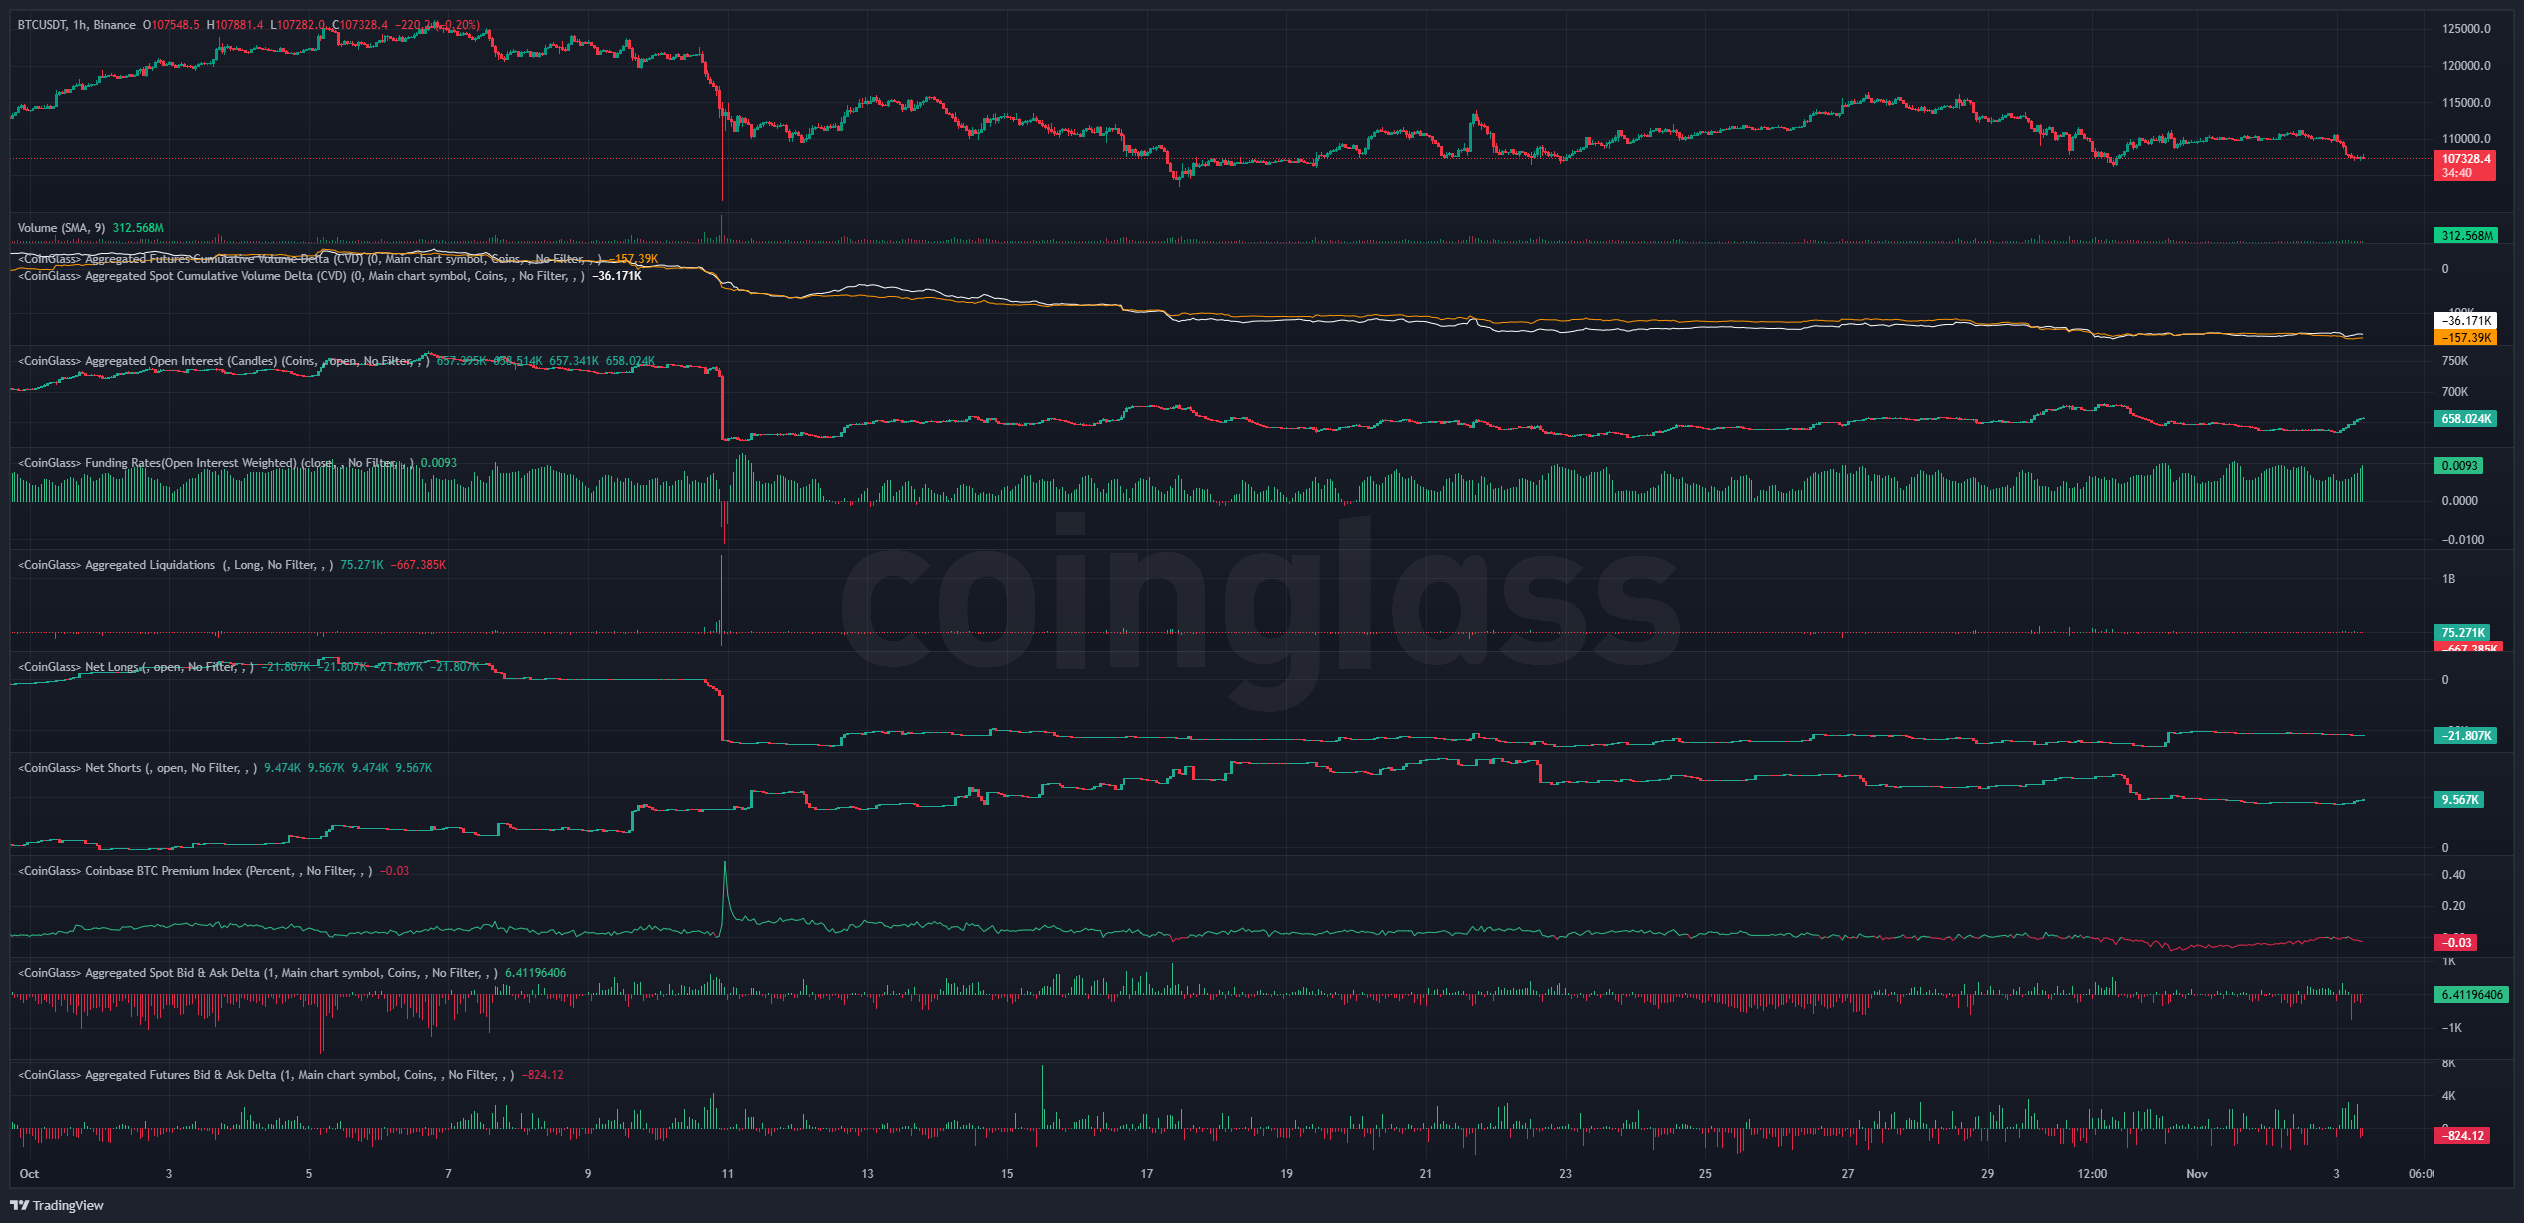
And here's a snapshot of positioning across Velo and CoinGlass:
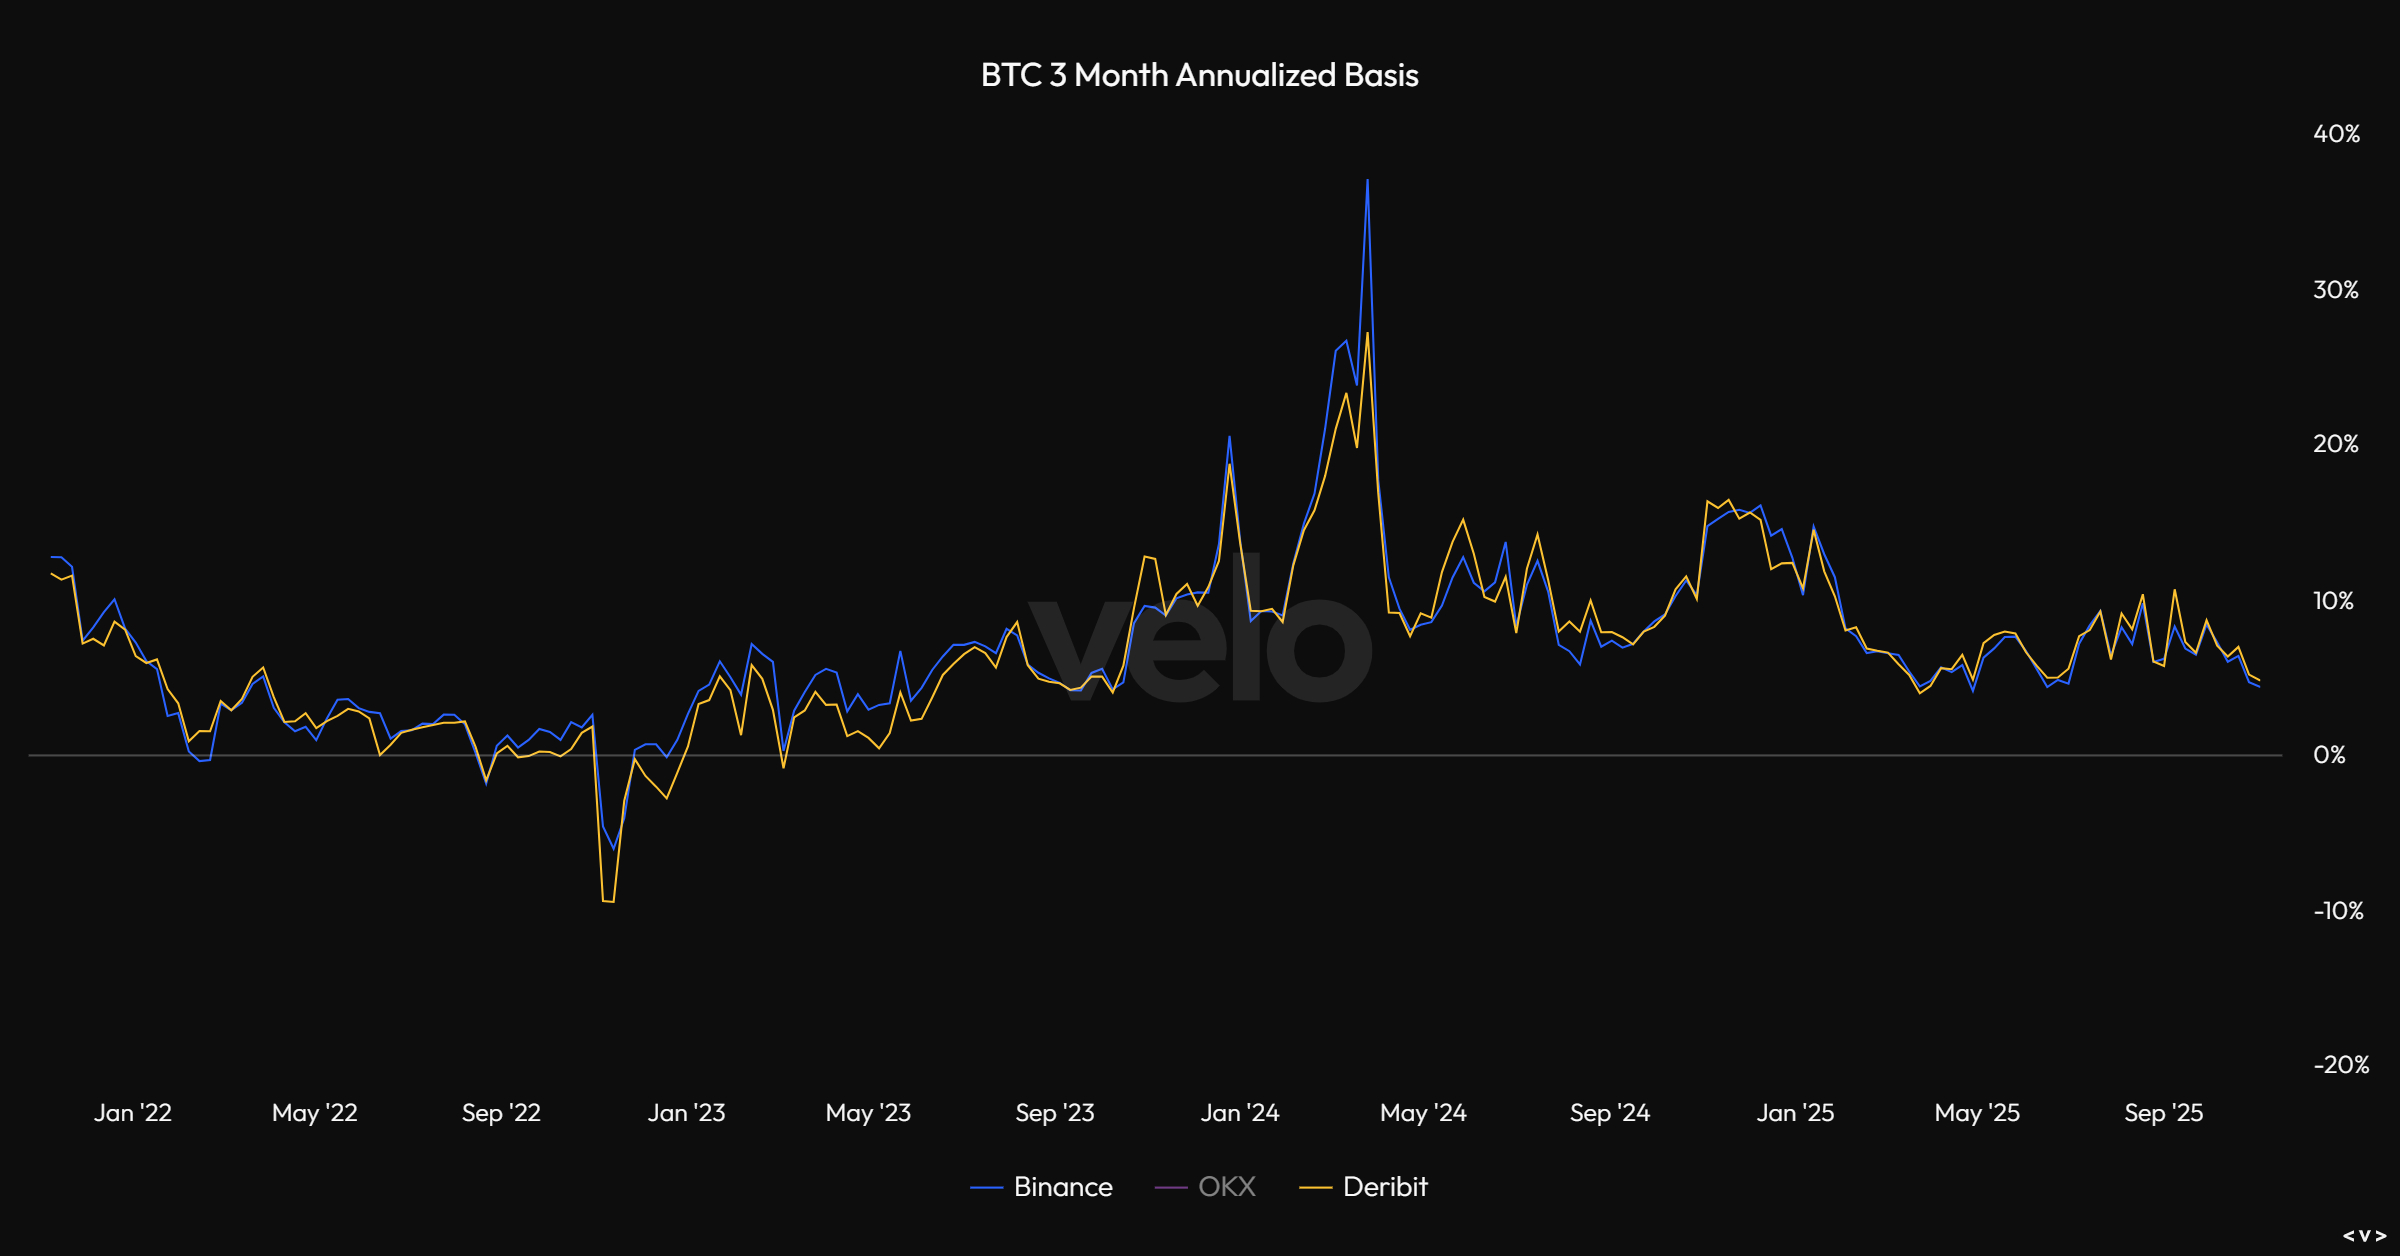
And here's 3-month annualized basis:
And Bitcoin OI vs Altcoin OI:

And finally some of the expected 1-week and 1-month liquidation levels:
-2025-11-03_08_45_04.png)
-2025-11-03_08_46_15.png)
Price: $3708
ETH/USD
Weekly:
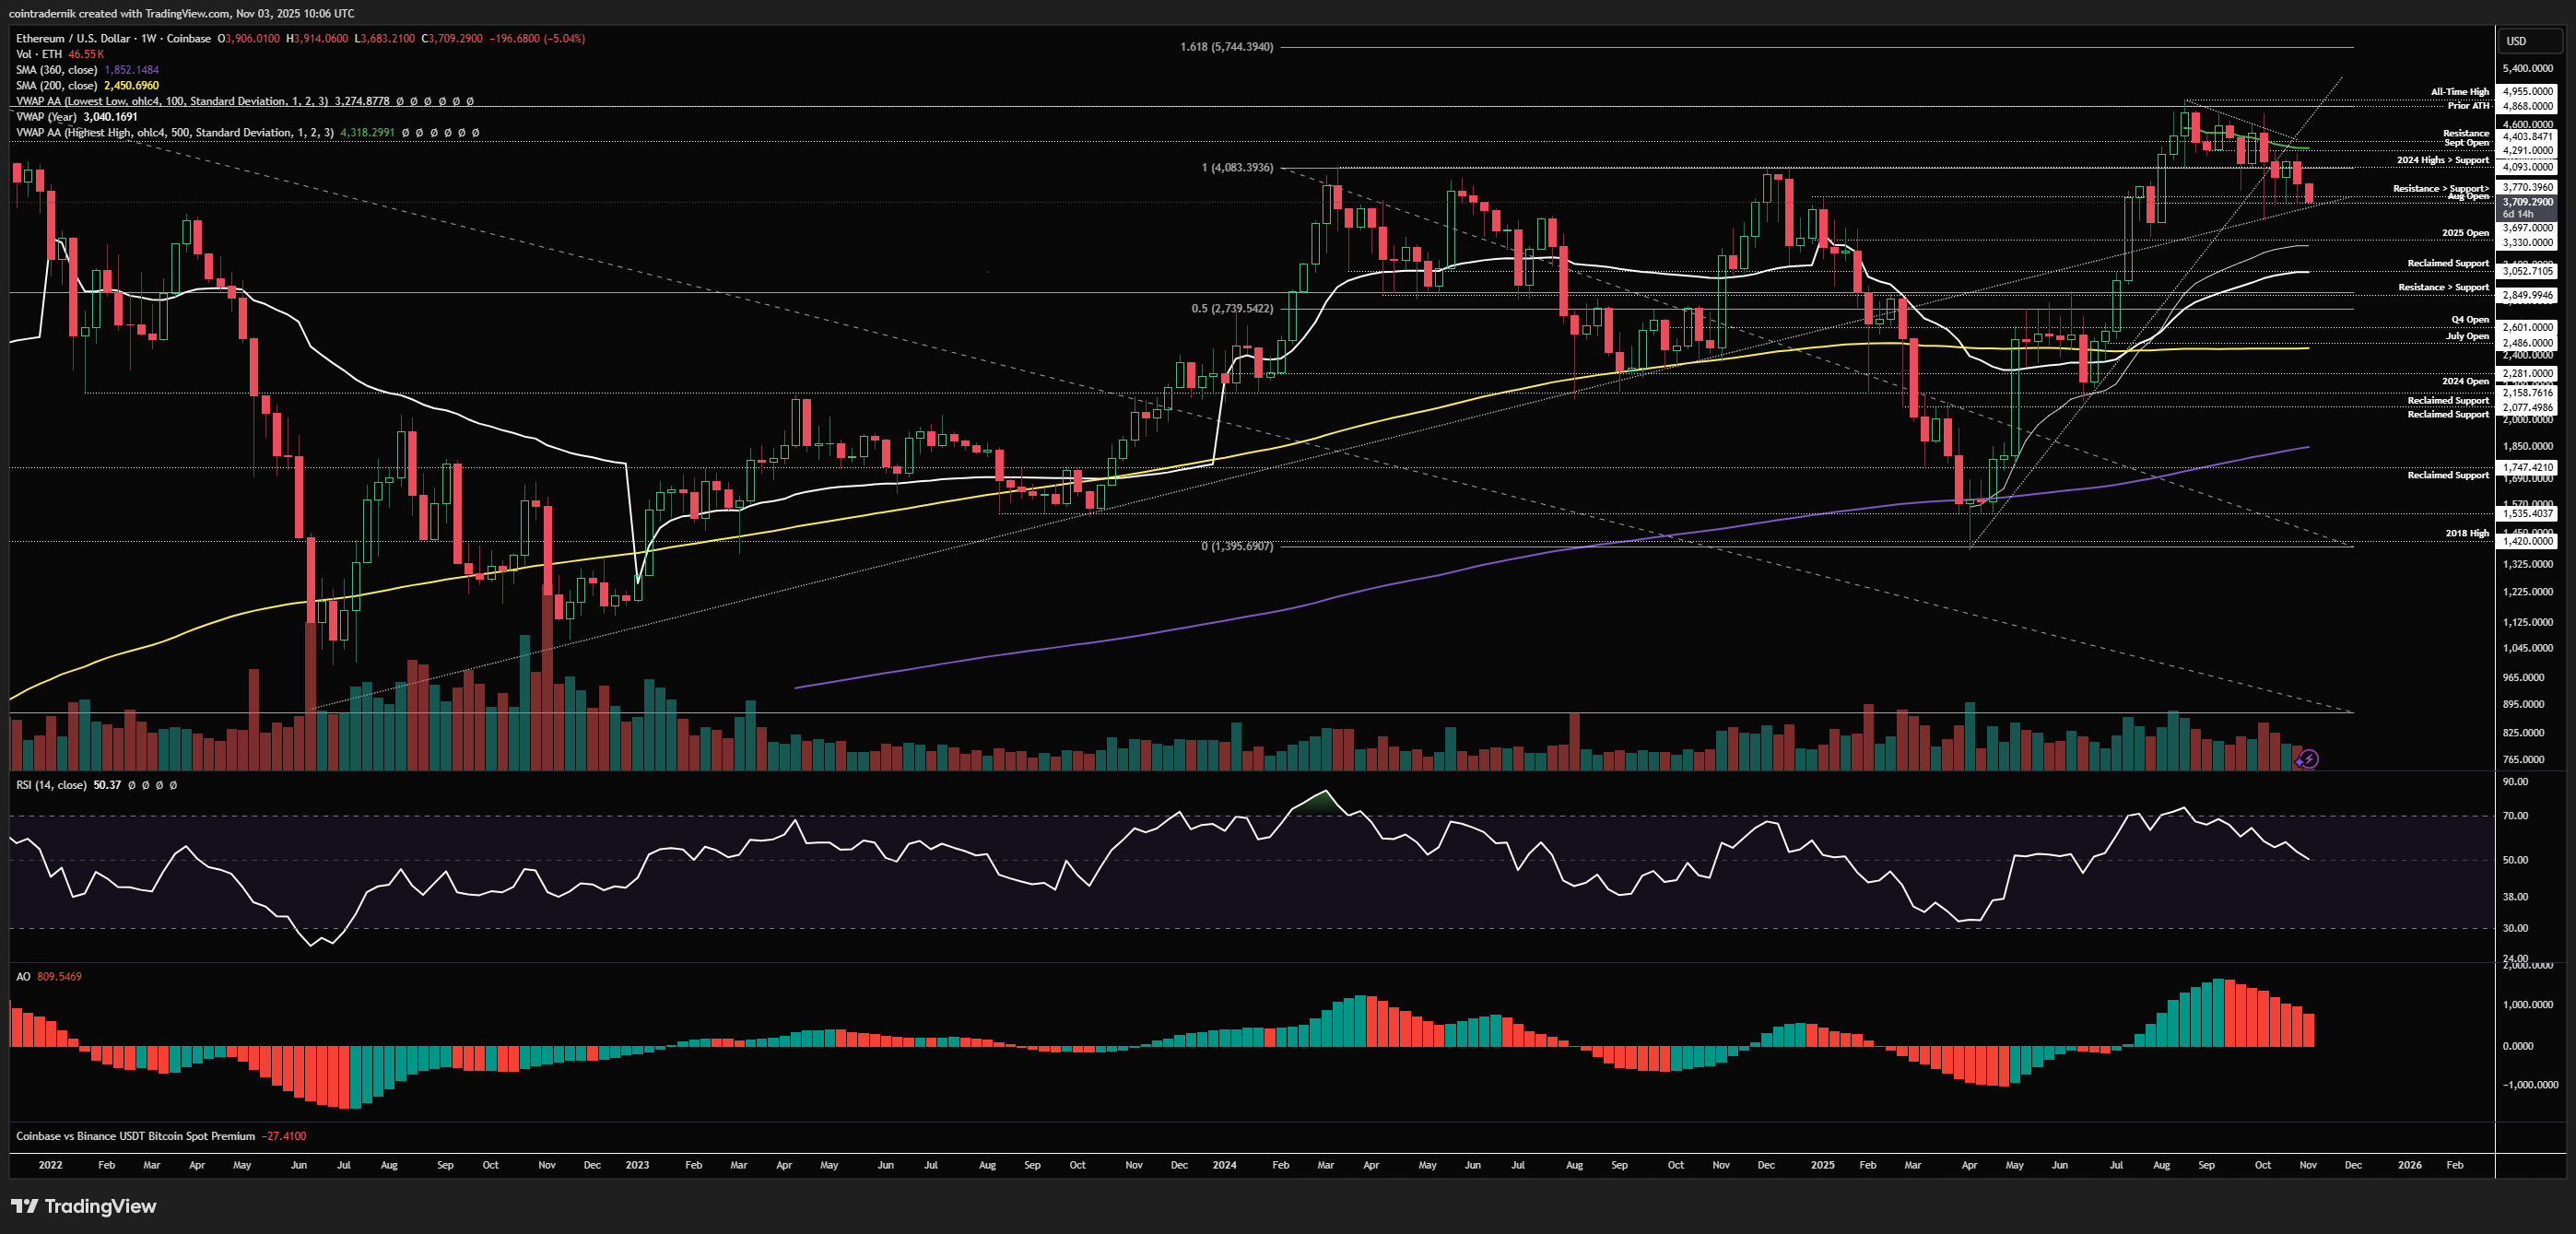
Beginning with ETH/USD on the weekly, last week was not what we wanted to see for bullishness short-term, as price rejected the reclaim of $4093 and close back below that level, leading to the early push lower this week into $3700, retesting the August open and reclaimed trendline support. I would say if we close below $3700 this week, ETH is nailed on for a sweep of the yearly open at $3330, into that support cluster below, which would make the next area of interest for any longs. If this is a bear trap into early November, we should see price rally off this support area into mid-week and be trading back above $4093 into the weekly close, after which I think price has chopped up pretty much every market participant that exists. In all seriousness, if we do close the week green and firmly back above $4093 after this move early in Nov, I would be expecting the next test of $4300 to lead to a breakout above the local trendline and anchored VWAP and then a test of the highs to follow. I think a lot is dependent on BTC here - Bitcoin back above the weekly open into the weekly close is a green light for this being a bear trap scenario.
Daily:

Looking at the daily, I have marked out the next area I think price would be looking towards should I be wrong here on expecting strength in November, where if we flip $3700 into resistance into the weekly close I would then expect a move below $3330 into that range between $3000-$3300. Daily RSI rejected above 50 and momentum turned lower, so we would want to see that momentum return to the upside with price closing back above $4093 if this is to not lead to another huge leg lower. A clean breakout above that trendline and anchored VWAP from the all-time high is what you're looking for to be more confident in a move back to $5k+, and if we do close this week back above $4093 I think that is the most probable outcome for the next couple of weeks.
ETH/BTC
Weekly:
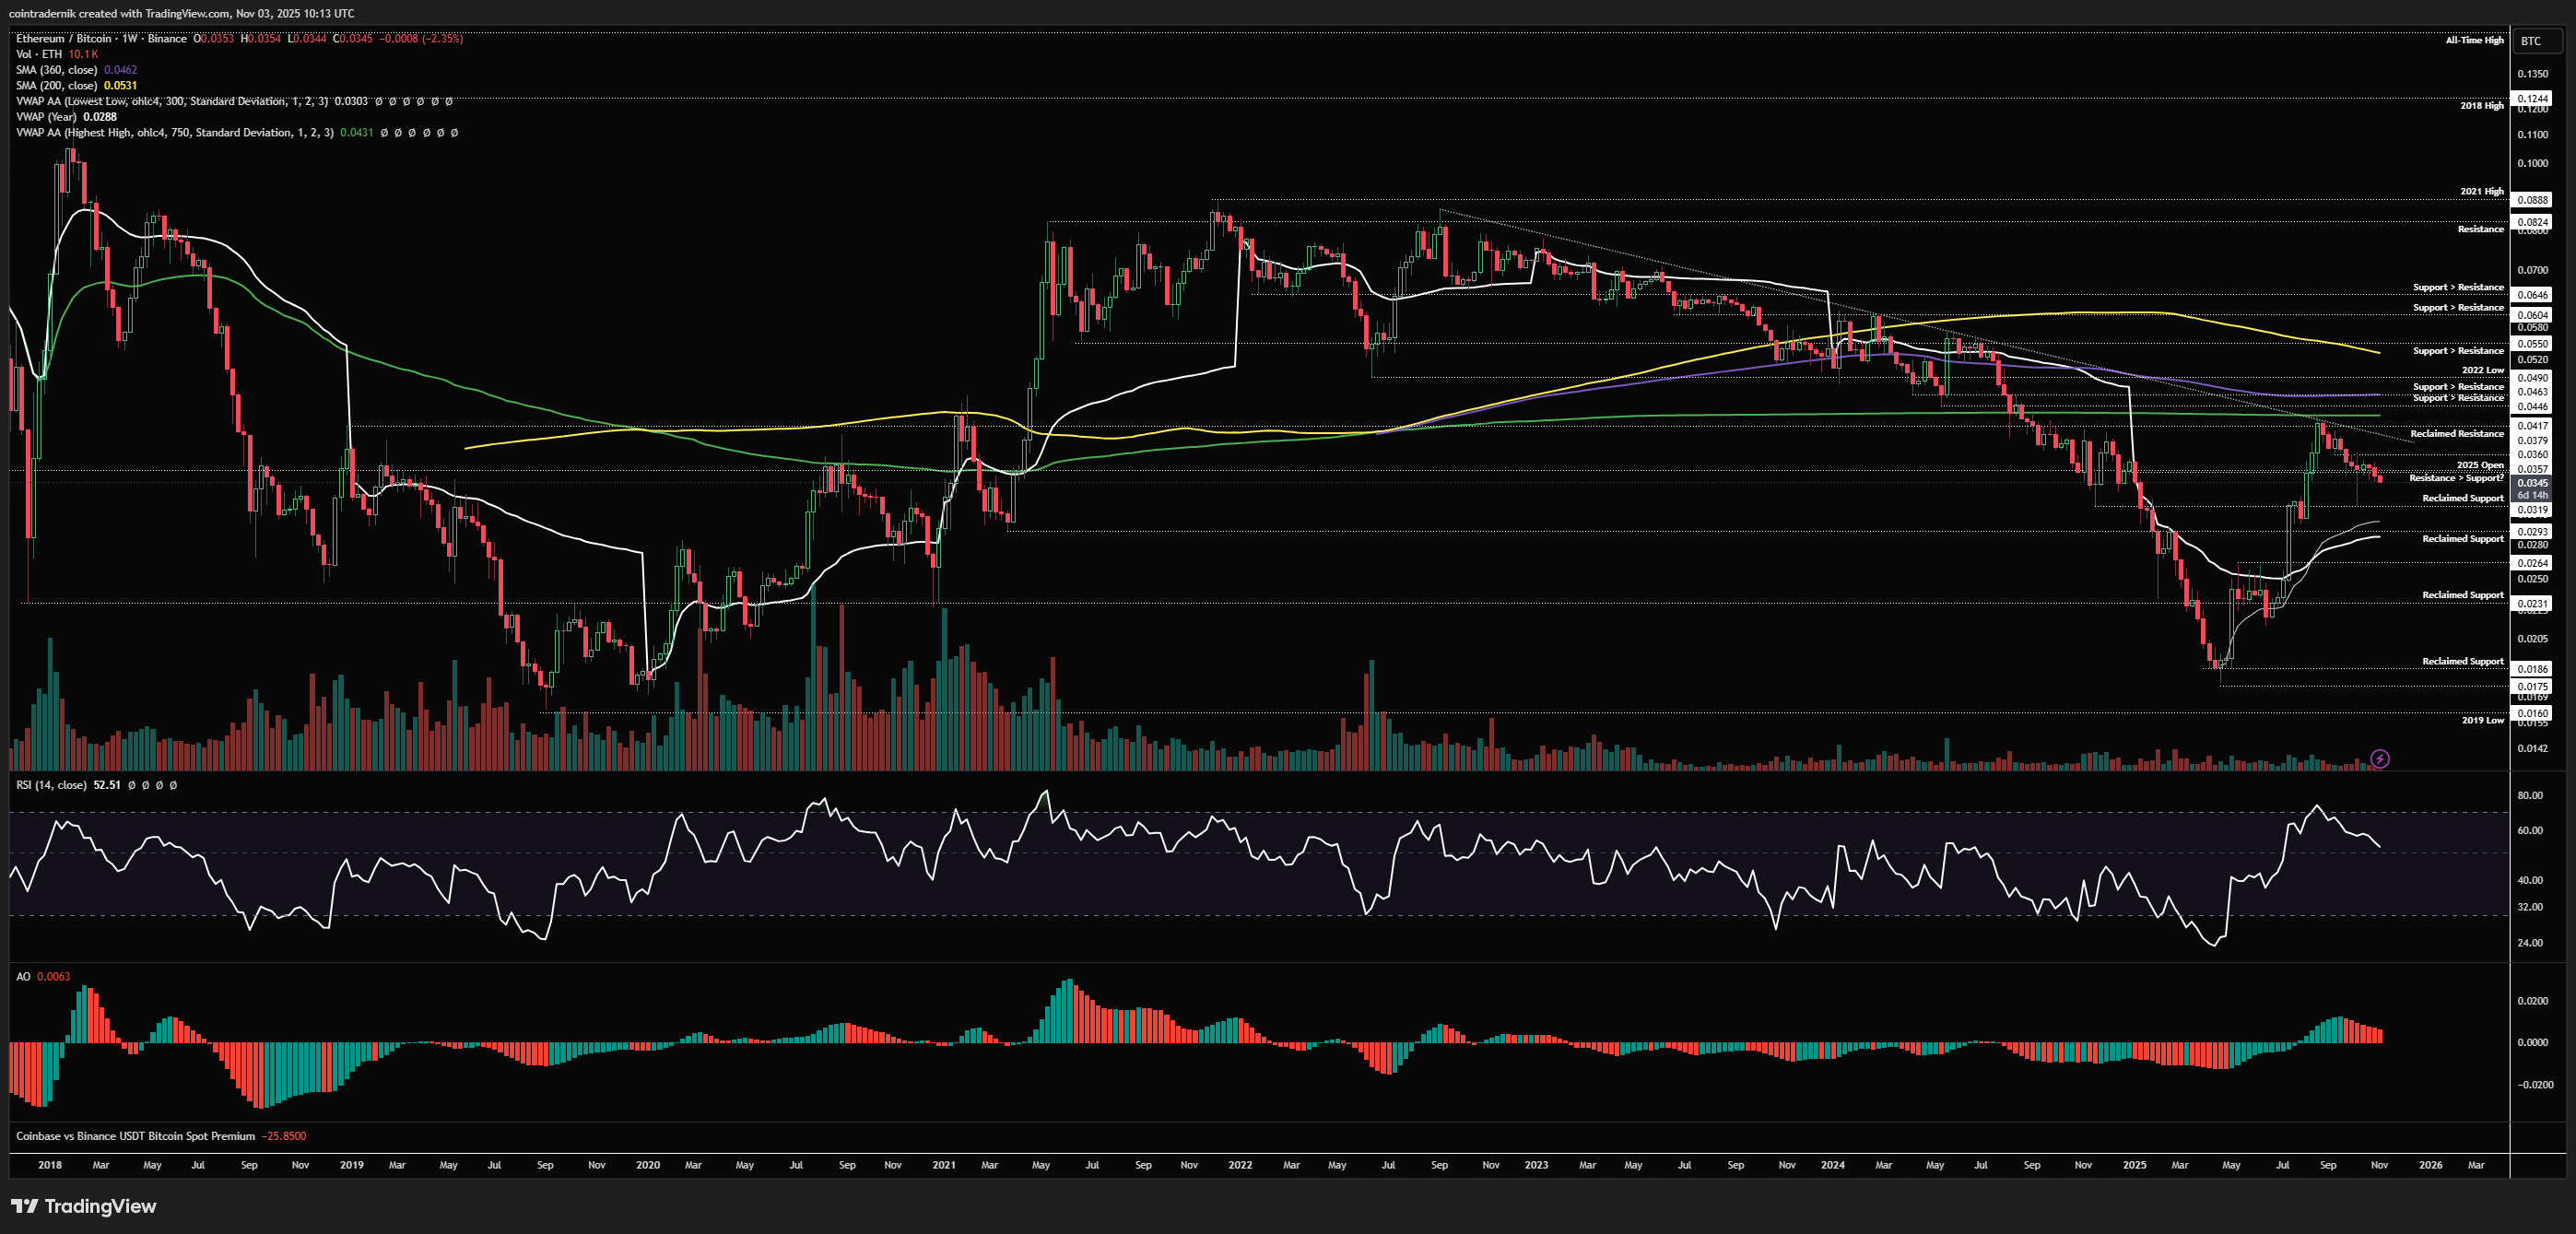
Turning to ETH/BTC, to be honest there really isn't much to discuss here as the pair just continues to to chop around after that capitulation candle a few weeks ago. What we have seen as of last week is a close back below the yearly open, which I expect to lead to the formation of a higher-low above 0.0329. As mentioned before, on this timeframe, as long as price is holding that support cluster above 0.0293, this is all basically just a momentum reset and marking out the next major swing-low; if we close below that support, it looks vastly different and we can entertain something as drastic as a full retracement of the move off the April lows, but we are nowhere near that point yet for the pair.
Daily:
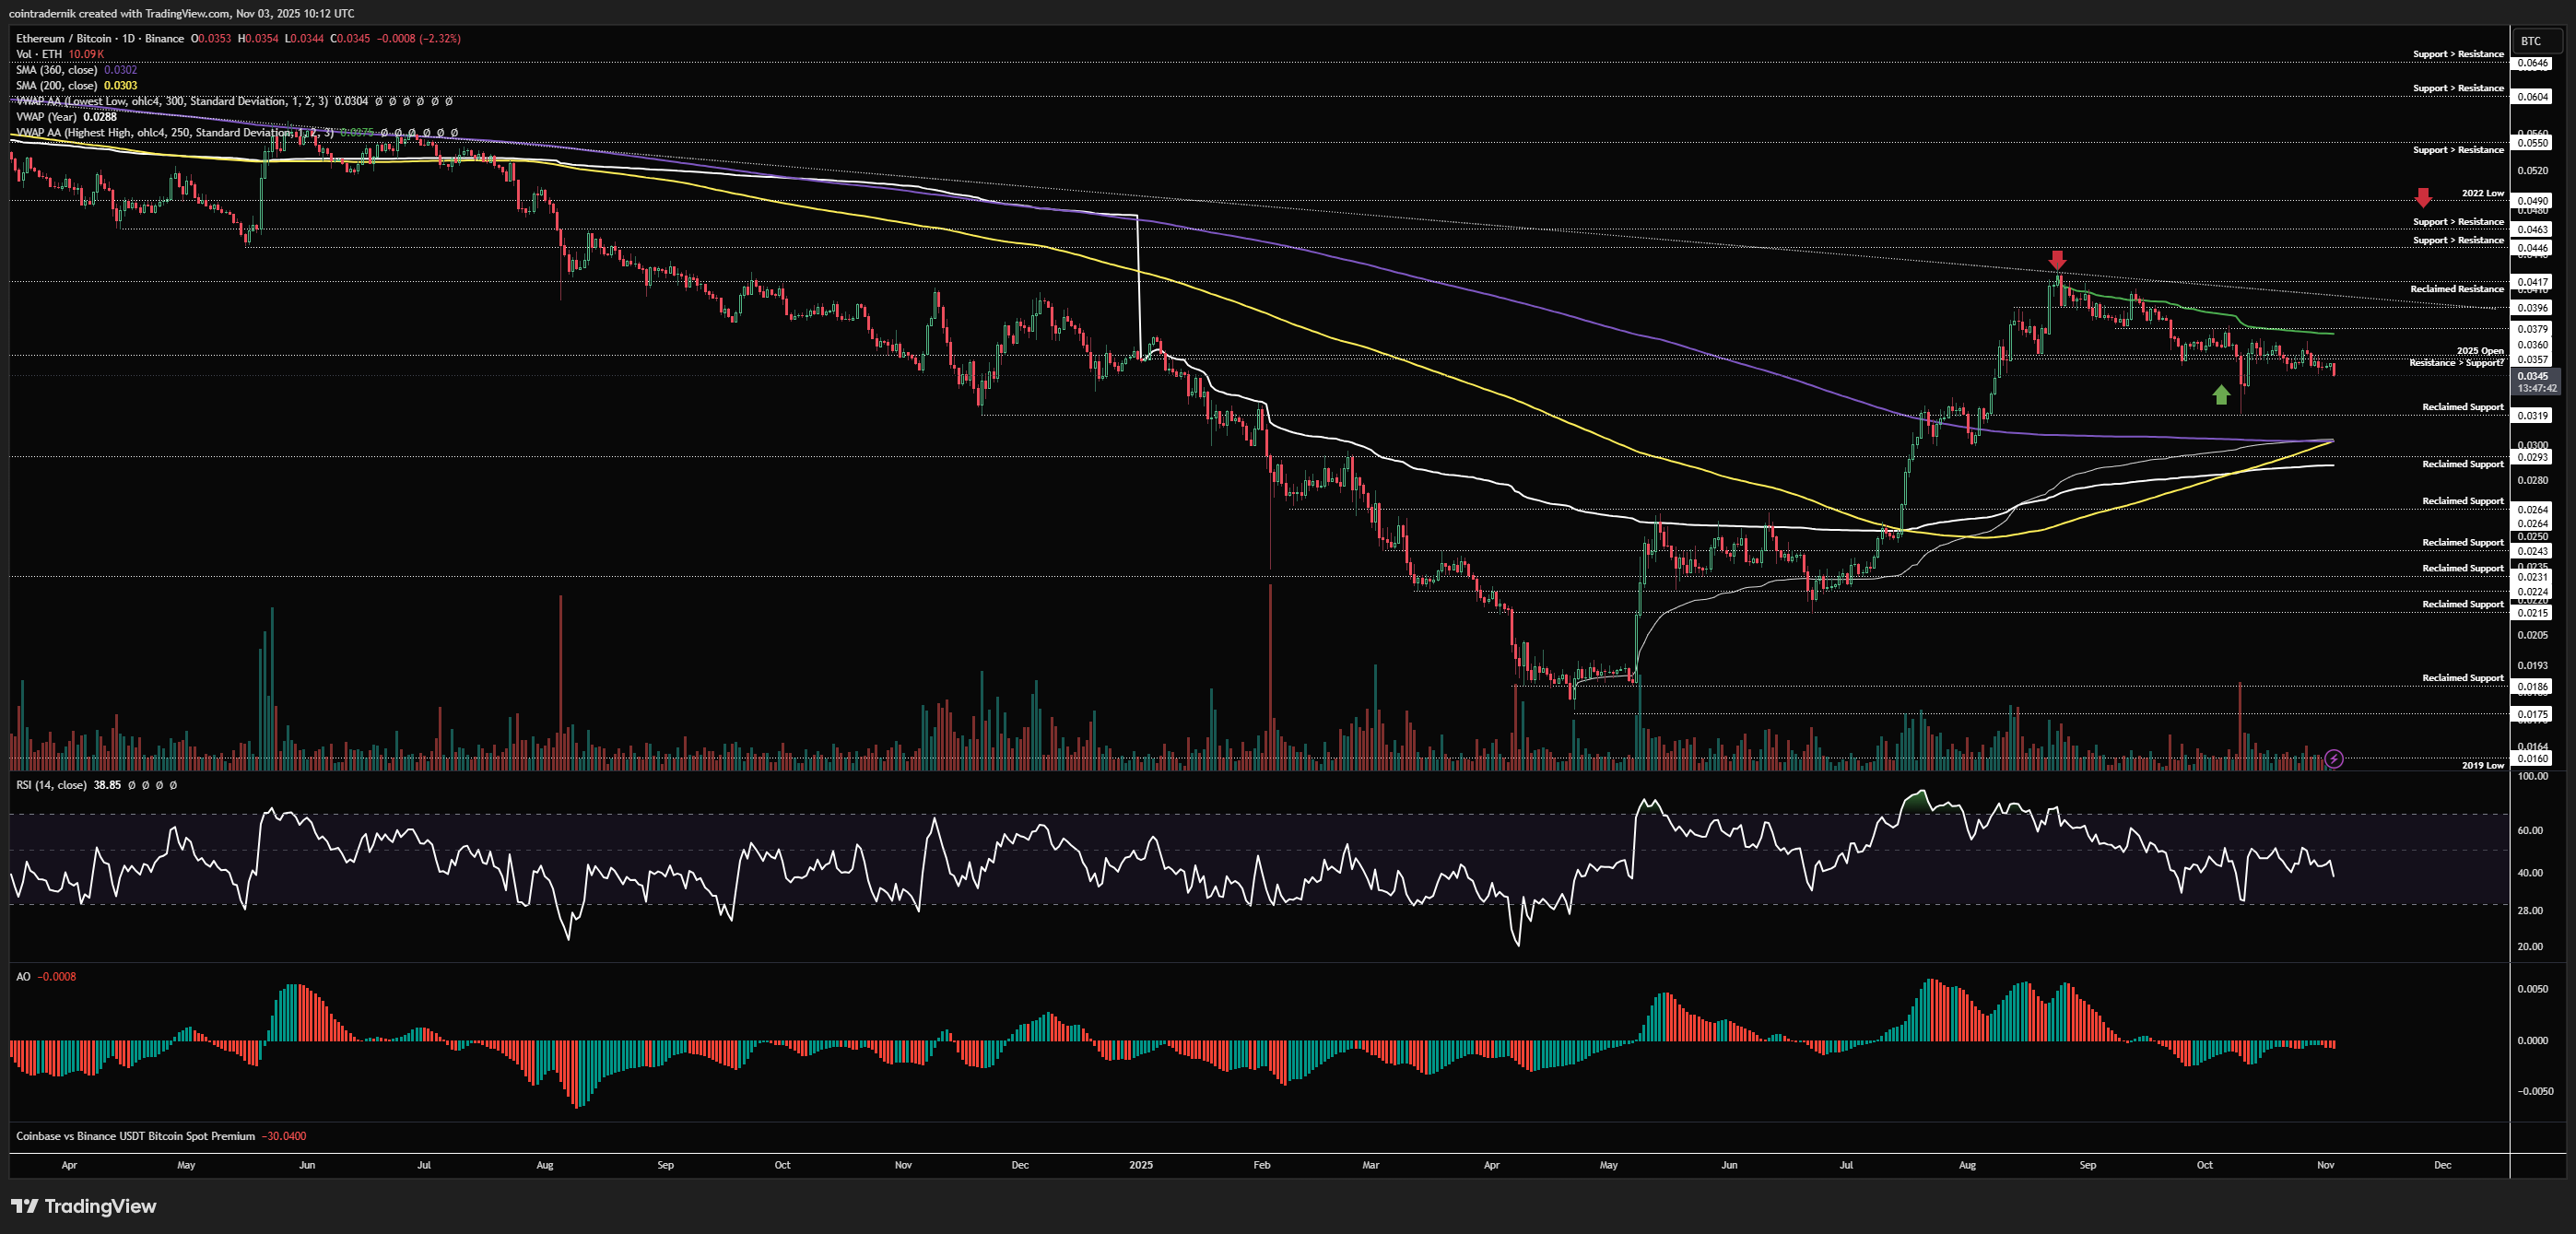
Looking at the daily, we can see that this really is just still sideways chop with zero momentum, as price retraces some of the bounce off that major low. Whilst we remain below 0.0379 (prior support turned resistance and the anchored VWAP from the high) and above 0.0293, we can continue to expect more sideways chop. I do expect we form a higher-low above 0.0319 and I am watching for a subsequent reclaim of 0.0379 as support to be more confident in this period of chop being over. Nothing else to add here.
Receive the latest updates directly to your inbox

Price: $99.49
Weekly:
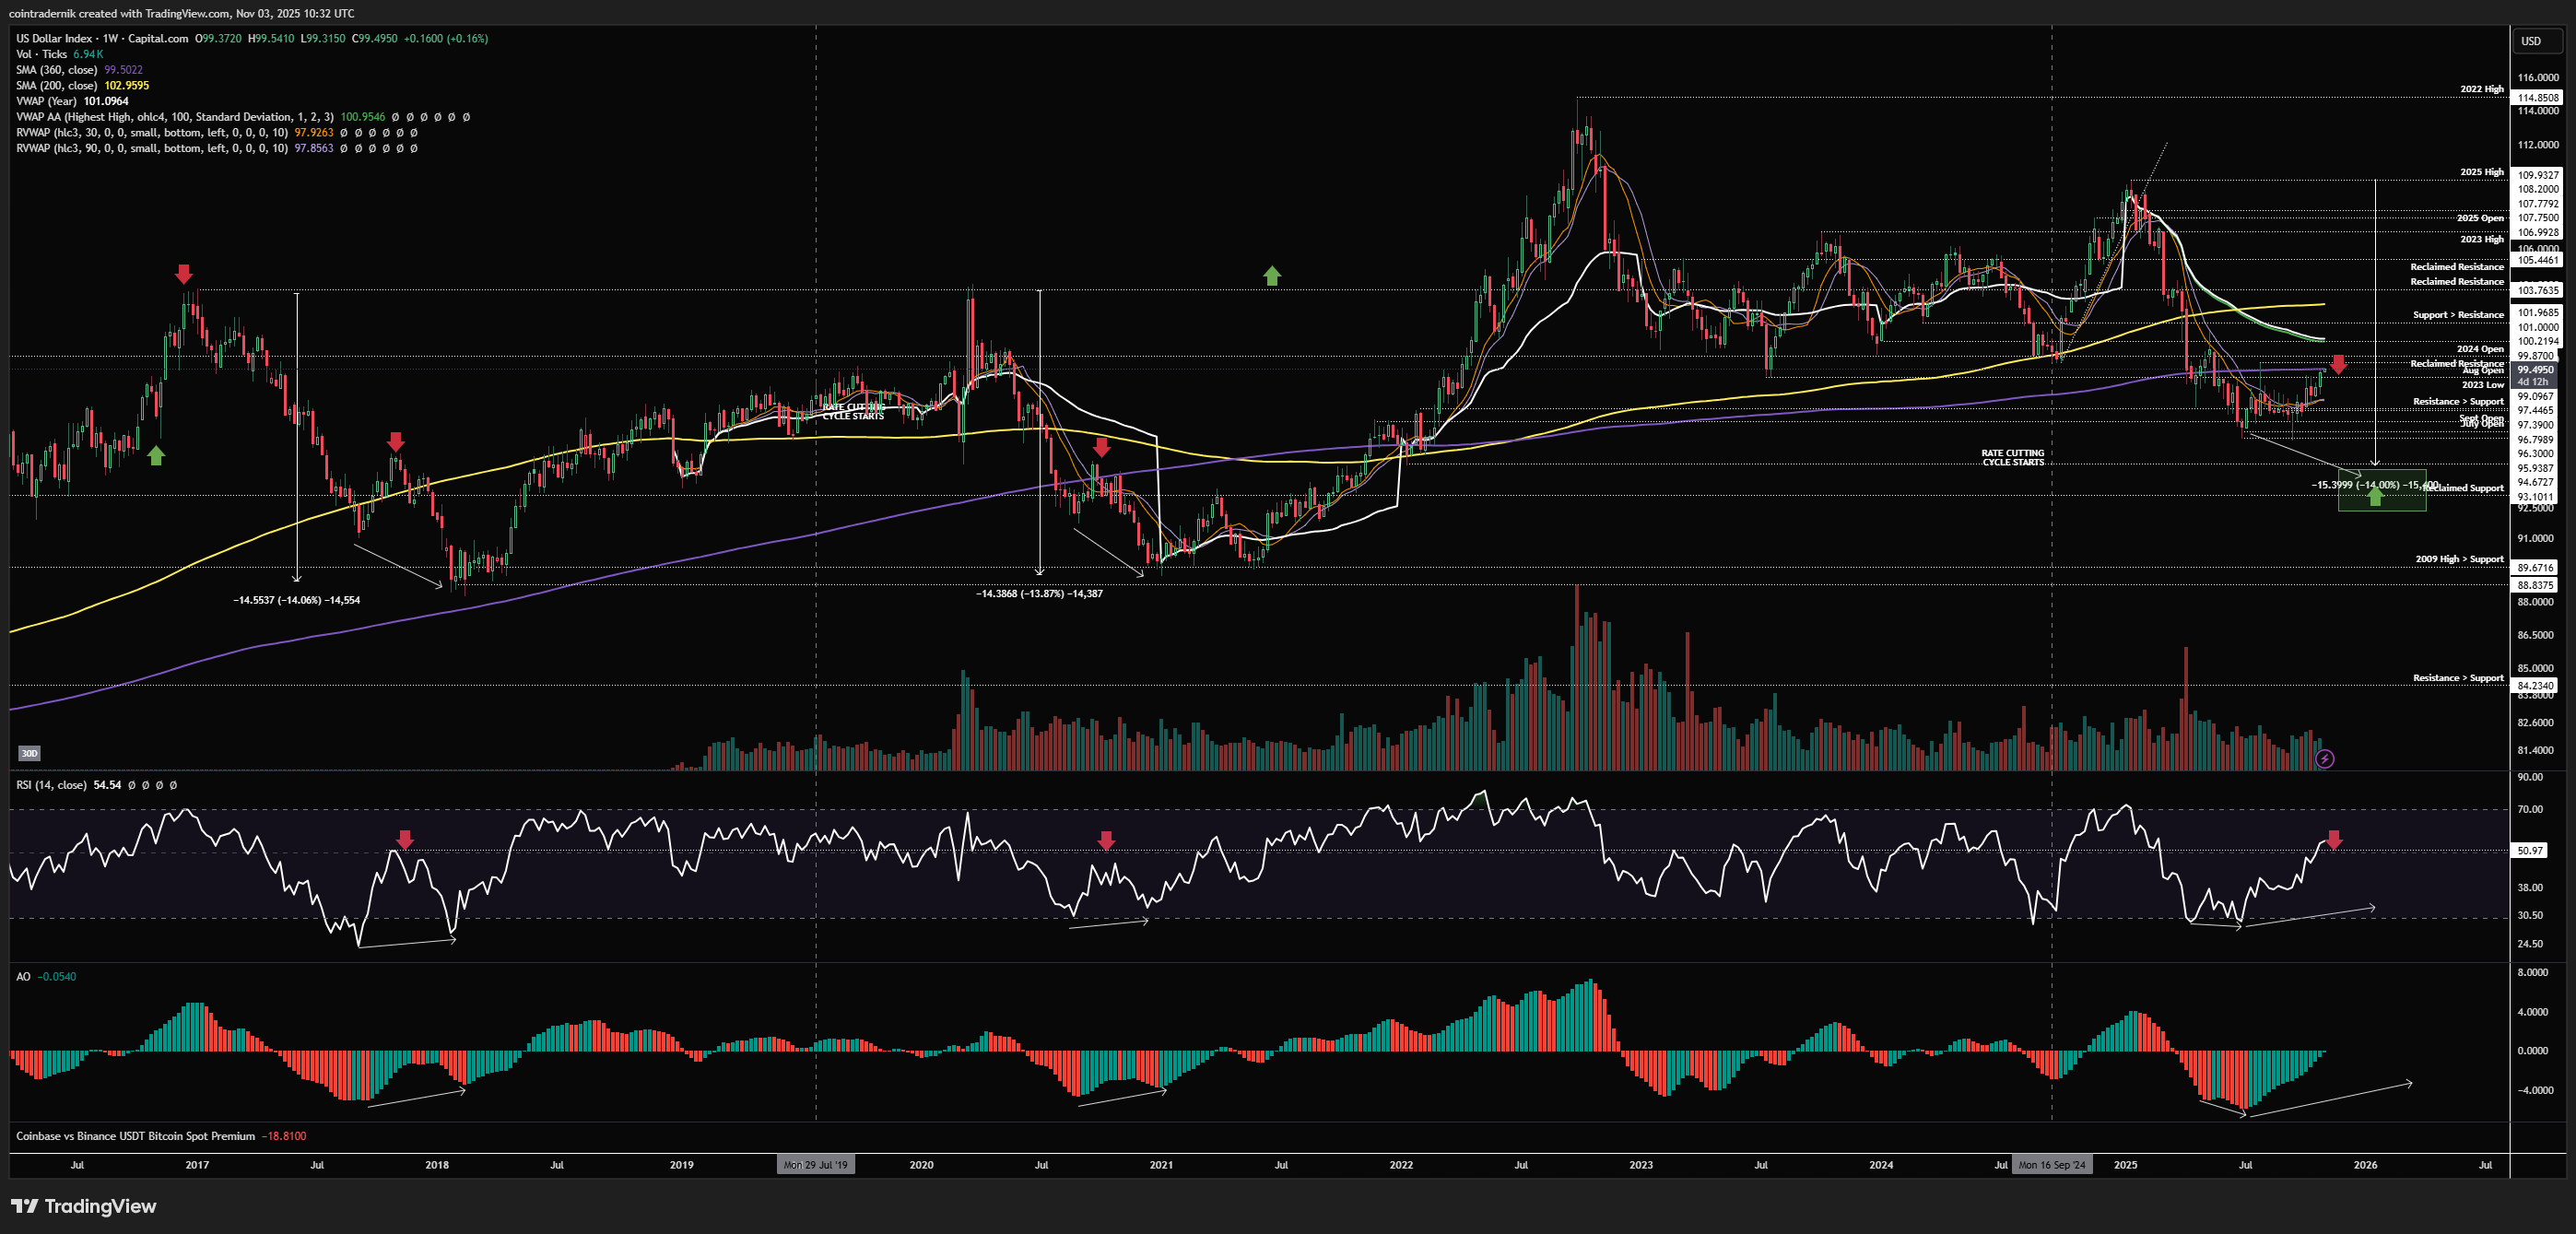
Beginning with the weekly, we can see that last week saw the Dollar Index bounce off local support and continue higher, pushing into 99.37 at the close. Early price-action this week has seen it continue up through last week's high into the 360wMA at 99.5, just below the 99.87 swing-high and major support turned resistance above. My overall view on the Dollar remains unchanged and I am expecting early November to mark out that swing-high for DXY, where unlike the post-Sept FOMC period instead of a heavy bid we see Dollar strength faded below the major pivot at 101. Only if we flip that area into support would I shift my expectations for continued weakness in the Dollar. Right now, we are playing out almost identically to prior Dollar cycles, where we saw peaks on short squeezes in late Q3 / early Q4 that led to final legs lower into cyclical bottoms, where higher timeframes showed trend exhaustion. My current expectation is that DXY bottoms in the 93-94 area in Q1.
Daily:
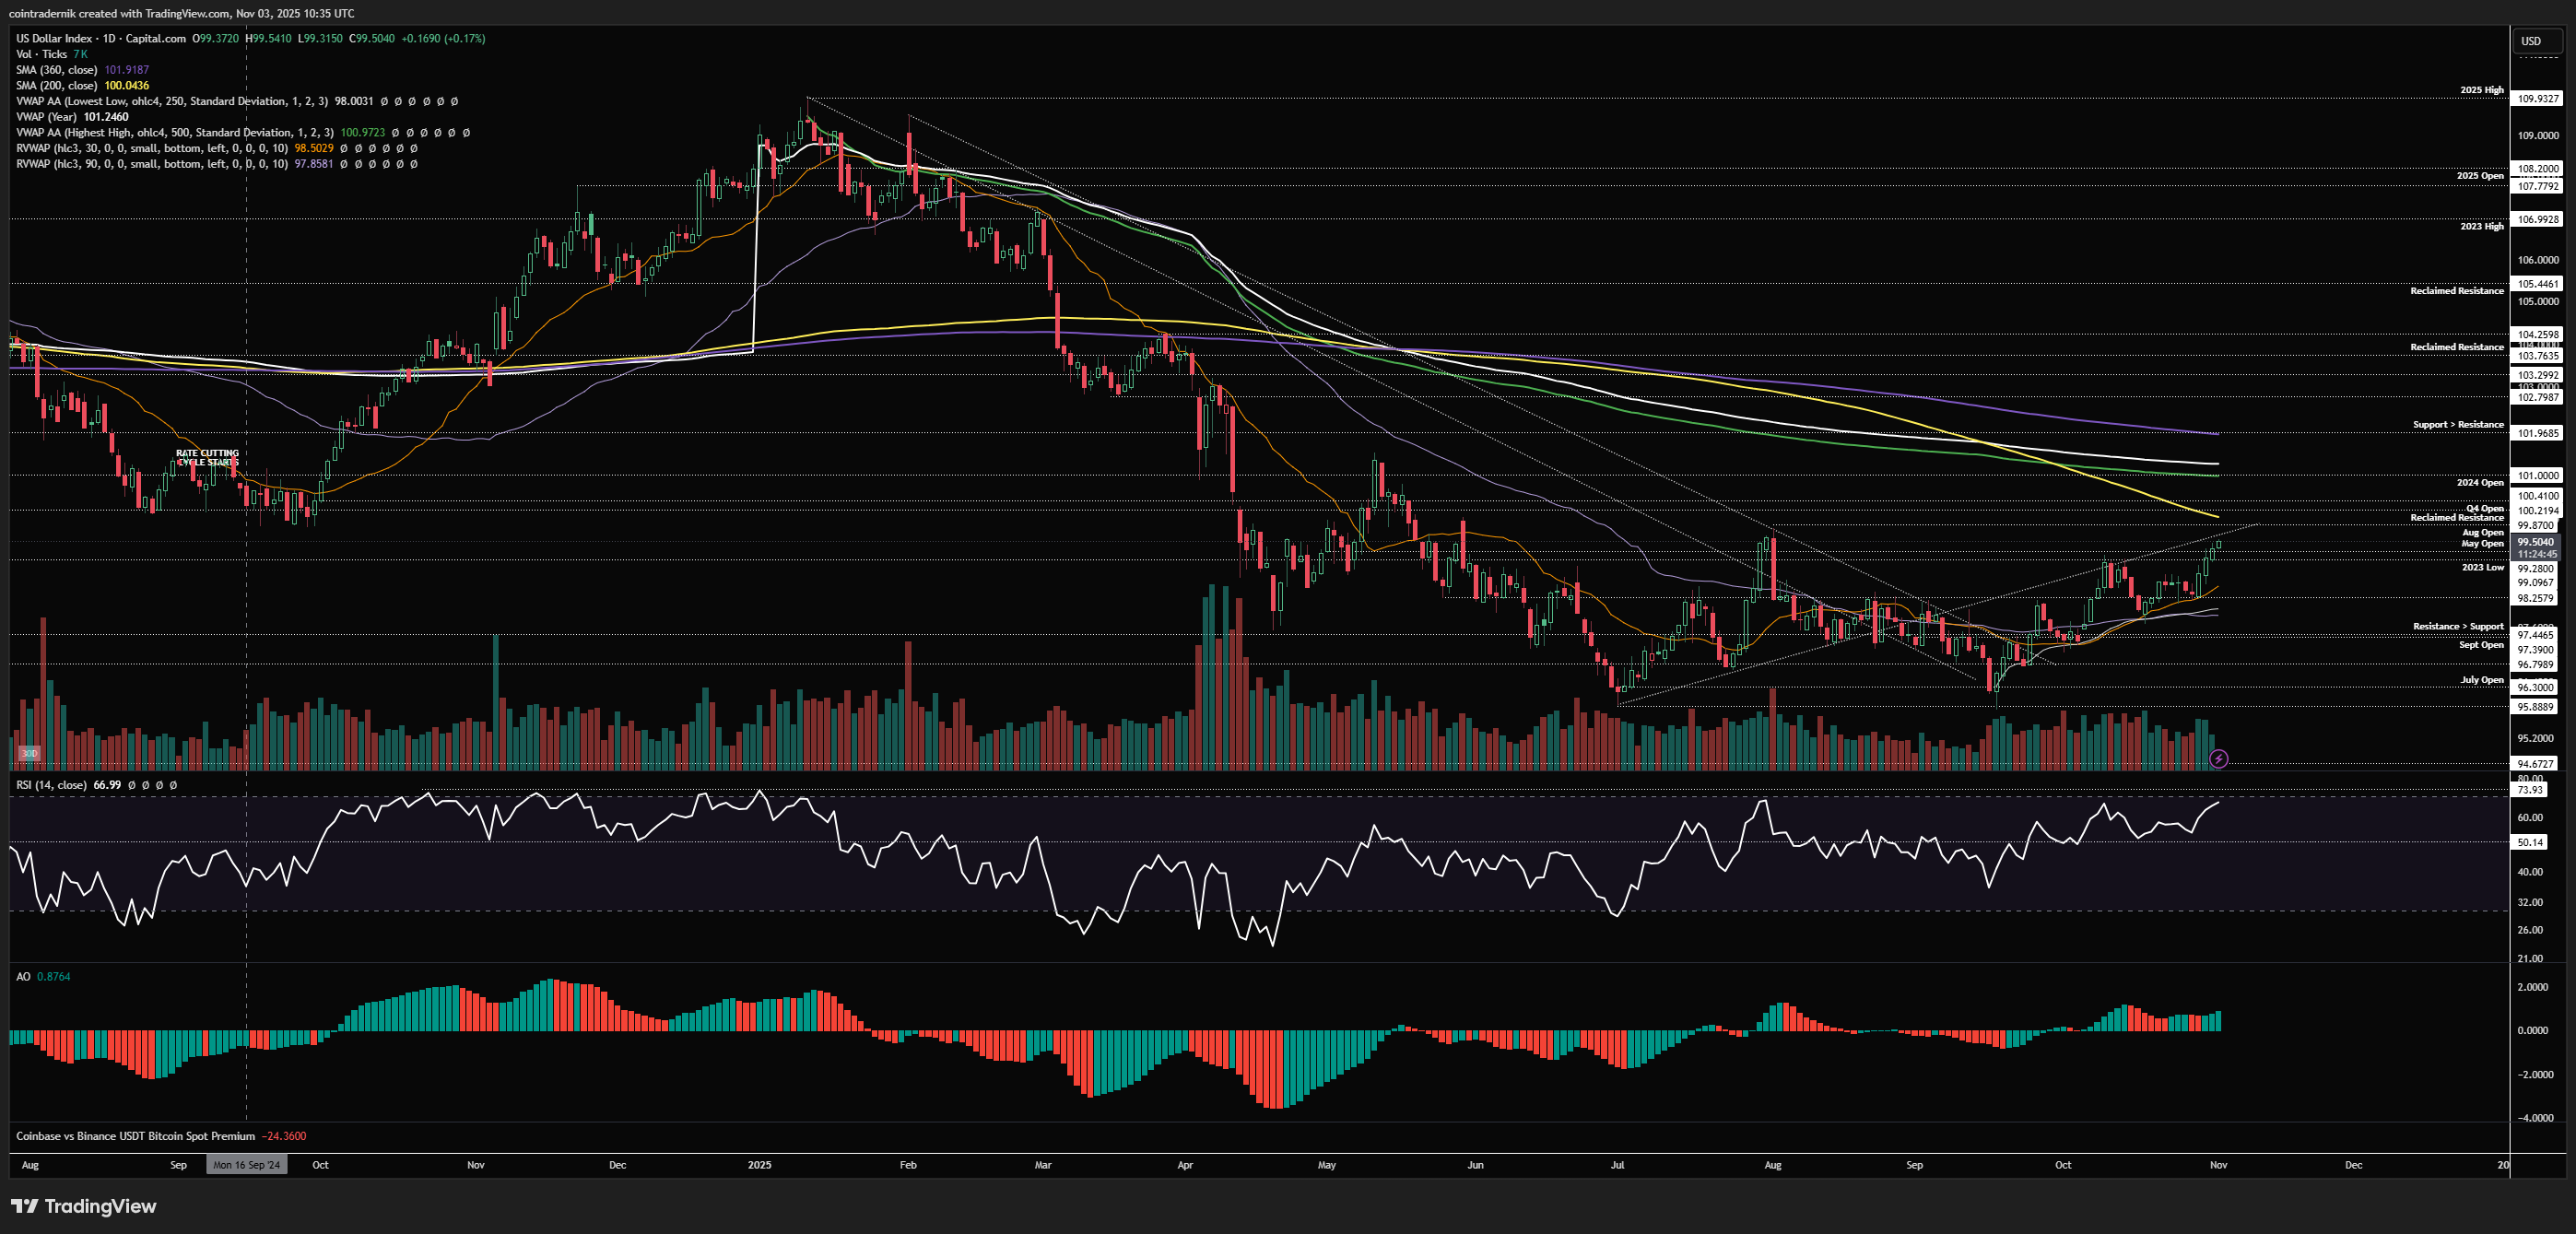
Looking at the daily, we can see that price is pushing against trendline support turned resistance from below, but momentum is strong and daily structure is bullish. What I am expecting to see here if I am right is a swing-high formation this week, whether that be here below the 200dMA or a further squeeze up into 101 where I do expect upside to be capped. In order for this scenario to be high probability, we want to see a momentum breakdown below 50 on daily RSI as price breaks below that local support at 98.25 - if we get that, I think the squeeze is done and we trade back into range lows and below from there. Again, unless we can convincingly flip 101 into support, I will continue to expect Dollar strength to be faded at the highs of this multi-month range.
Price: $5.13
Weekly:

Beginning with Copper on the weekly, we traded higher last week above the 2024 highs at $5.17 but rejected at $5.30, though price continues to generally grind higher with each week since moving off the lows. If we take out last week's low into the anchored VWAP from the highs and prior resistance at $4.92, I think that would make a good entry for longs towards the yearly highs; if we don't get lower before higher, if we can flip $5.40 into support, buying the first pullback into that level after we have had time and space away from it likely proves fruitful for that run of the highs. In either case, I remain bullish on Copper into Q1.
Daily:
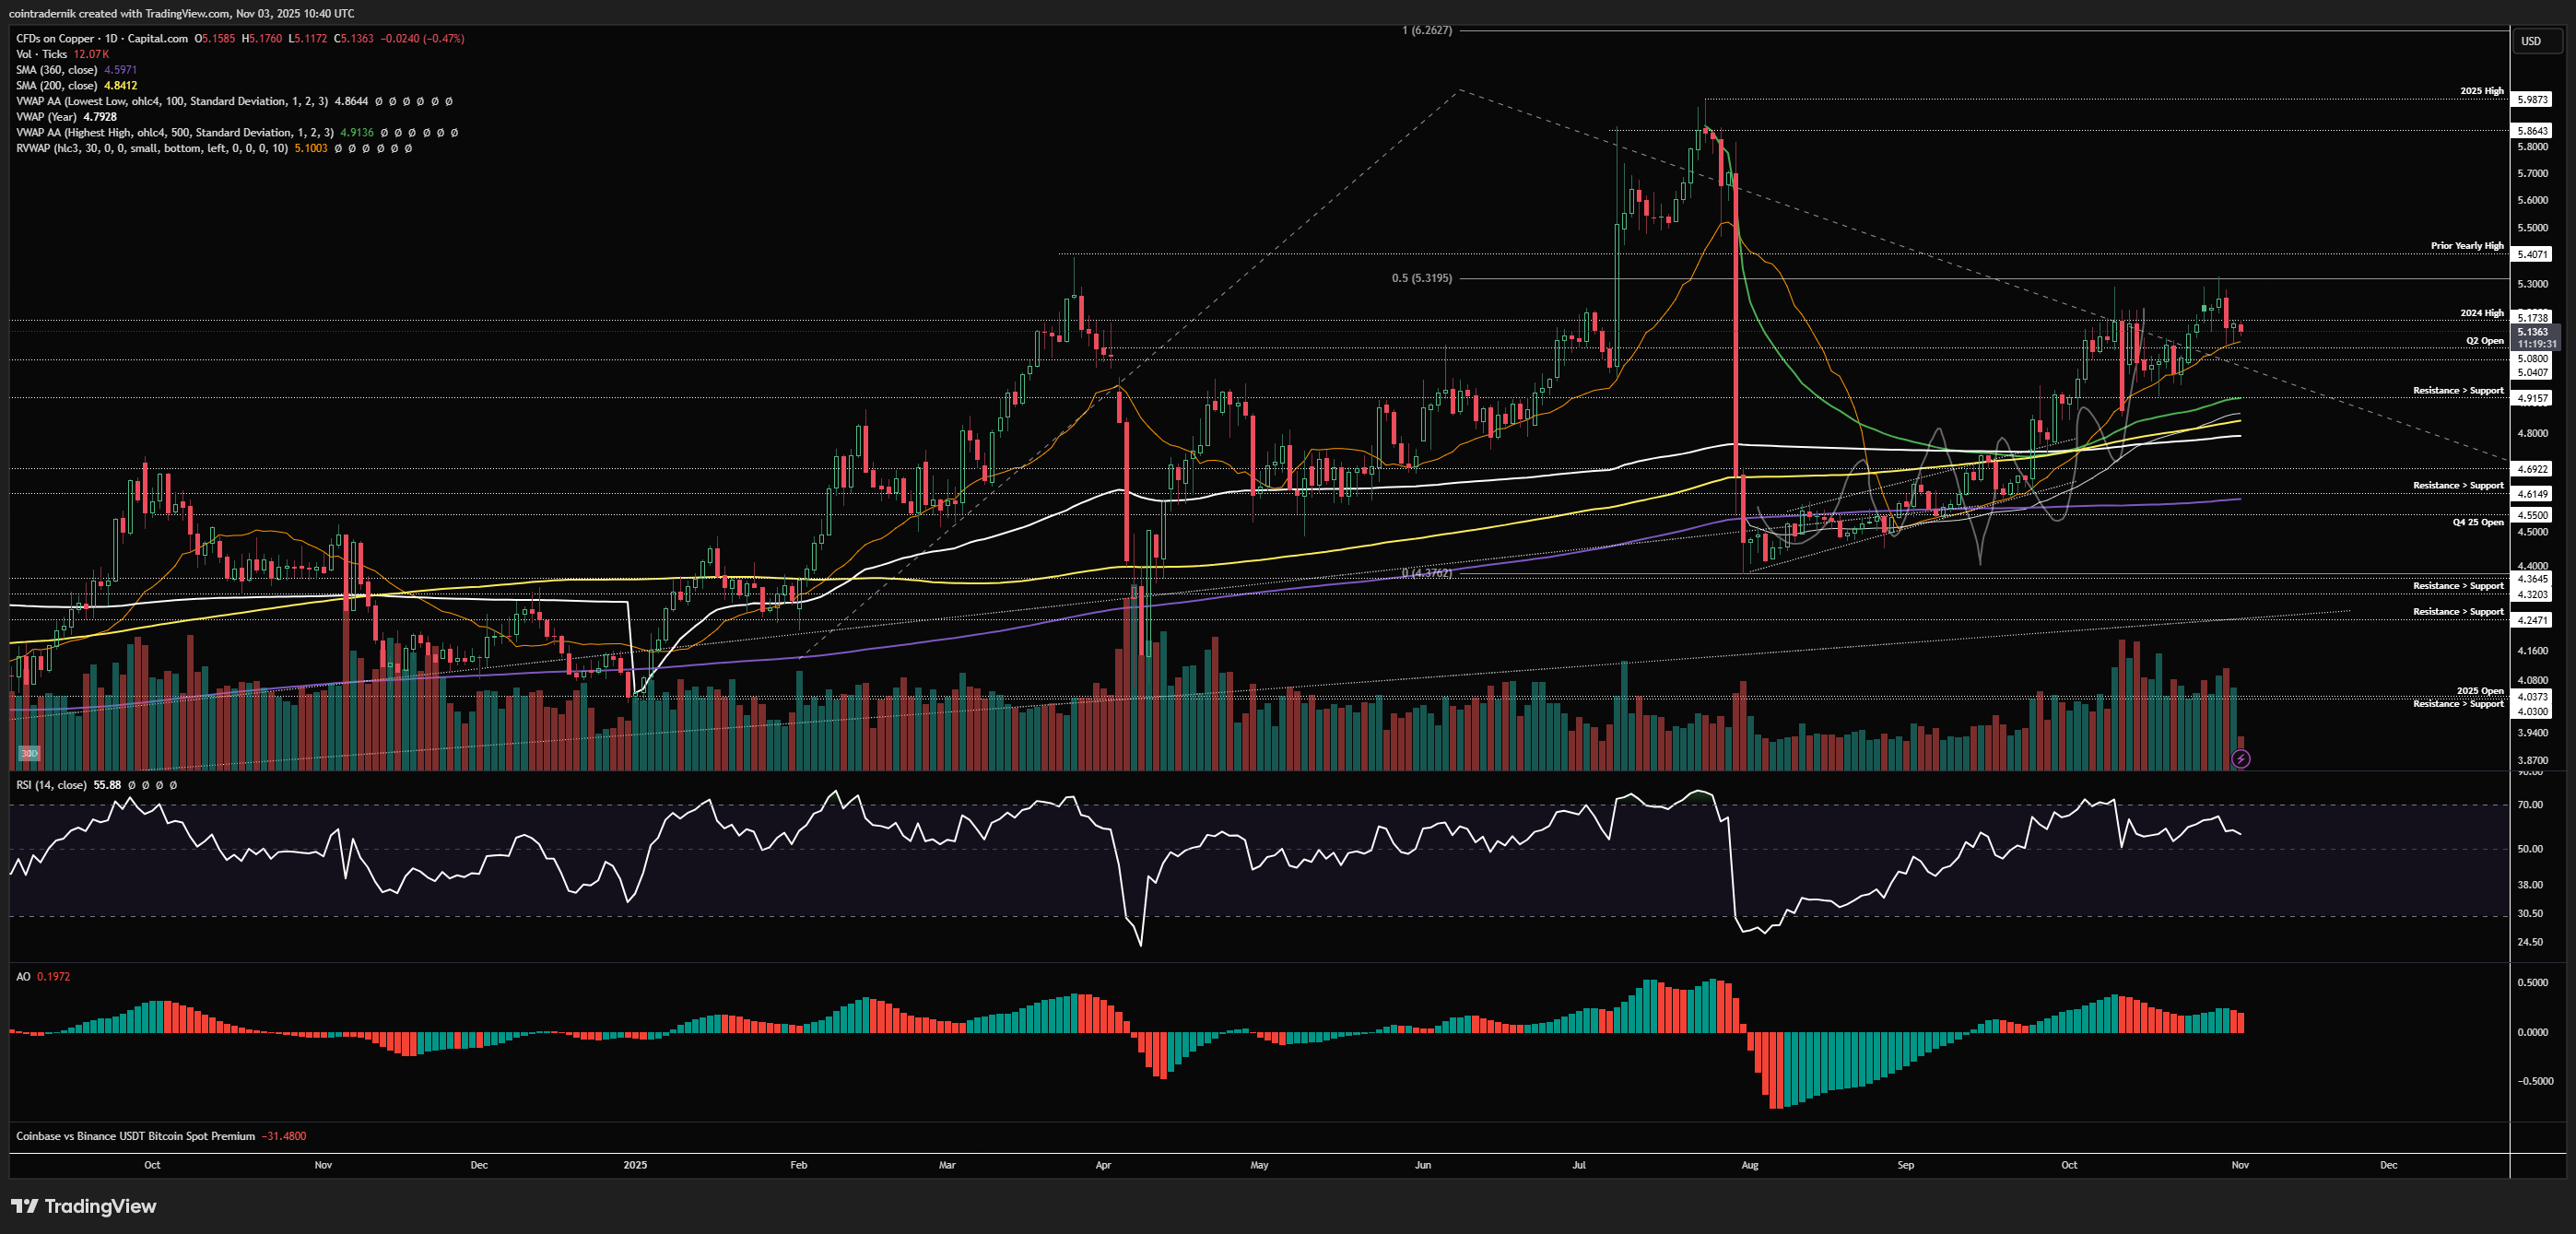
Dropping into the daily, we can see that price is forming some momentum divergence up here into the highs, which could give us that dip towards $4.93 if we can close the daily below support at $5.08 whilst momentum breaks below 50. In that scenario, I would be laddering bids from $4.85-$4.95 with a hard stop at $4.55 but with a view to cutting if we accepted back inside $4.70, of course looking for $6+. And if this momentum exhaustion is invalidated by price closing above $5.30 this week as RSI breaks back above 70, then I would look for a more aggressive move higher off that level and then bid a pullback towards that resistance turned support zone, with invalidation moving higher, but let's see how this next week or two shapes up.
Price: $6875
Weekly:
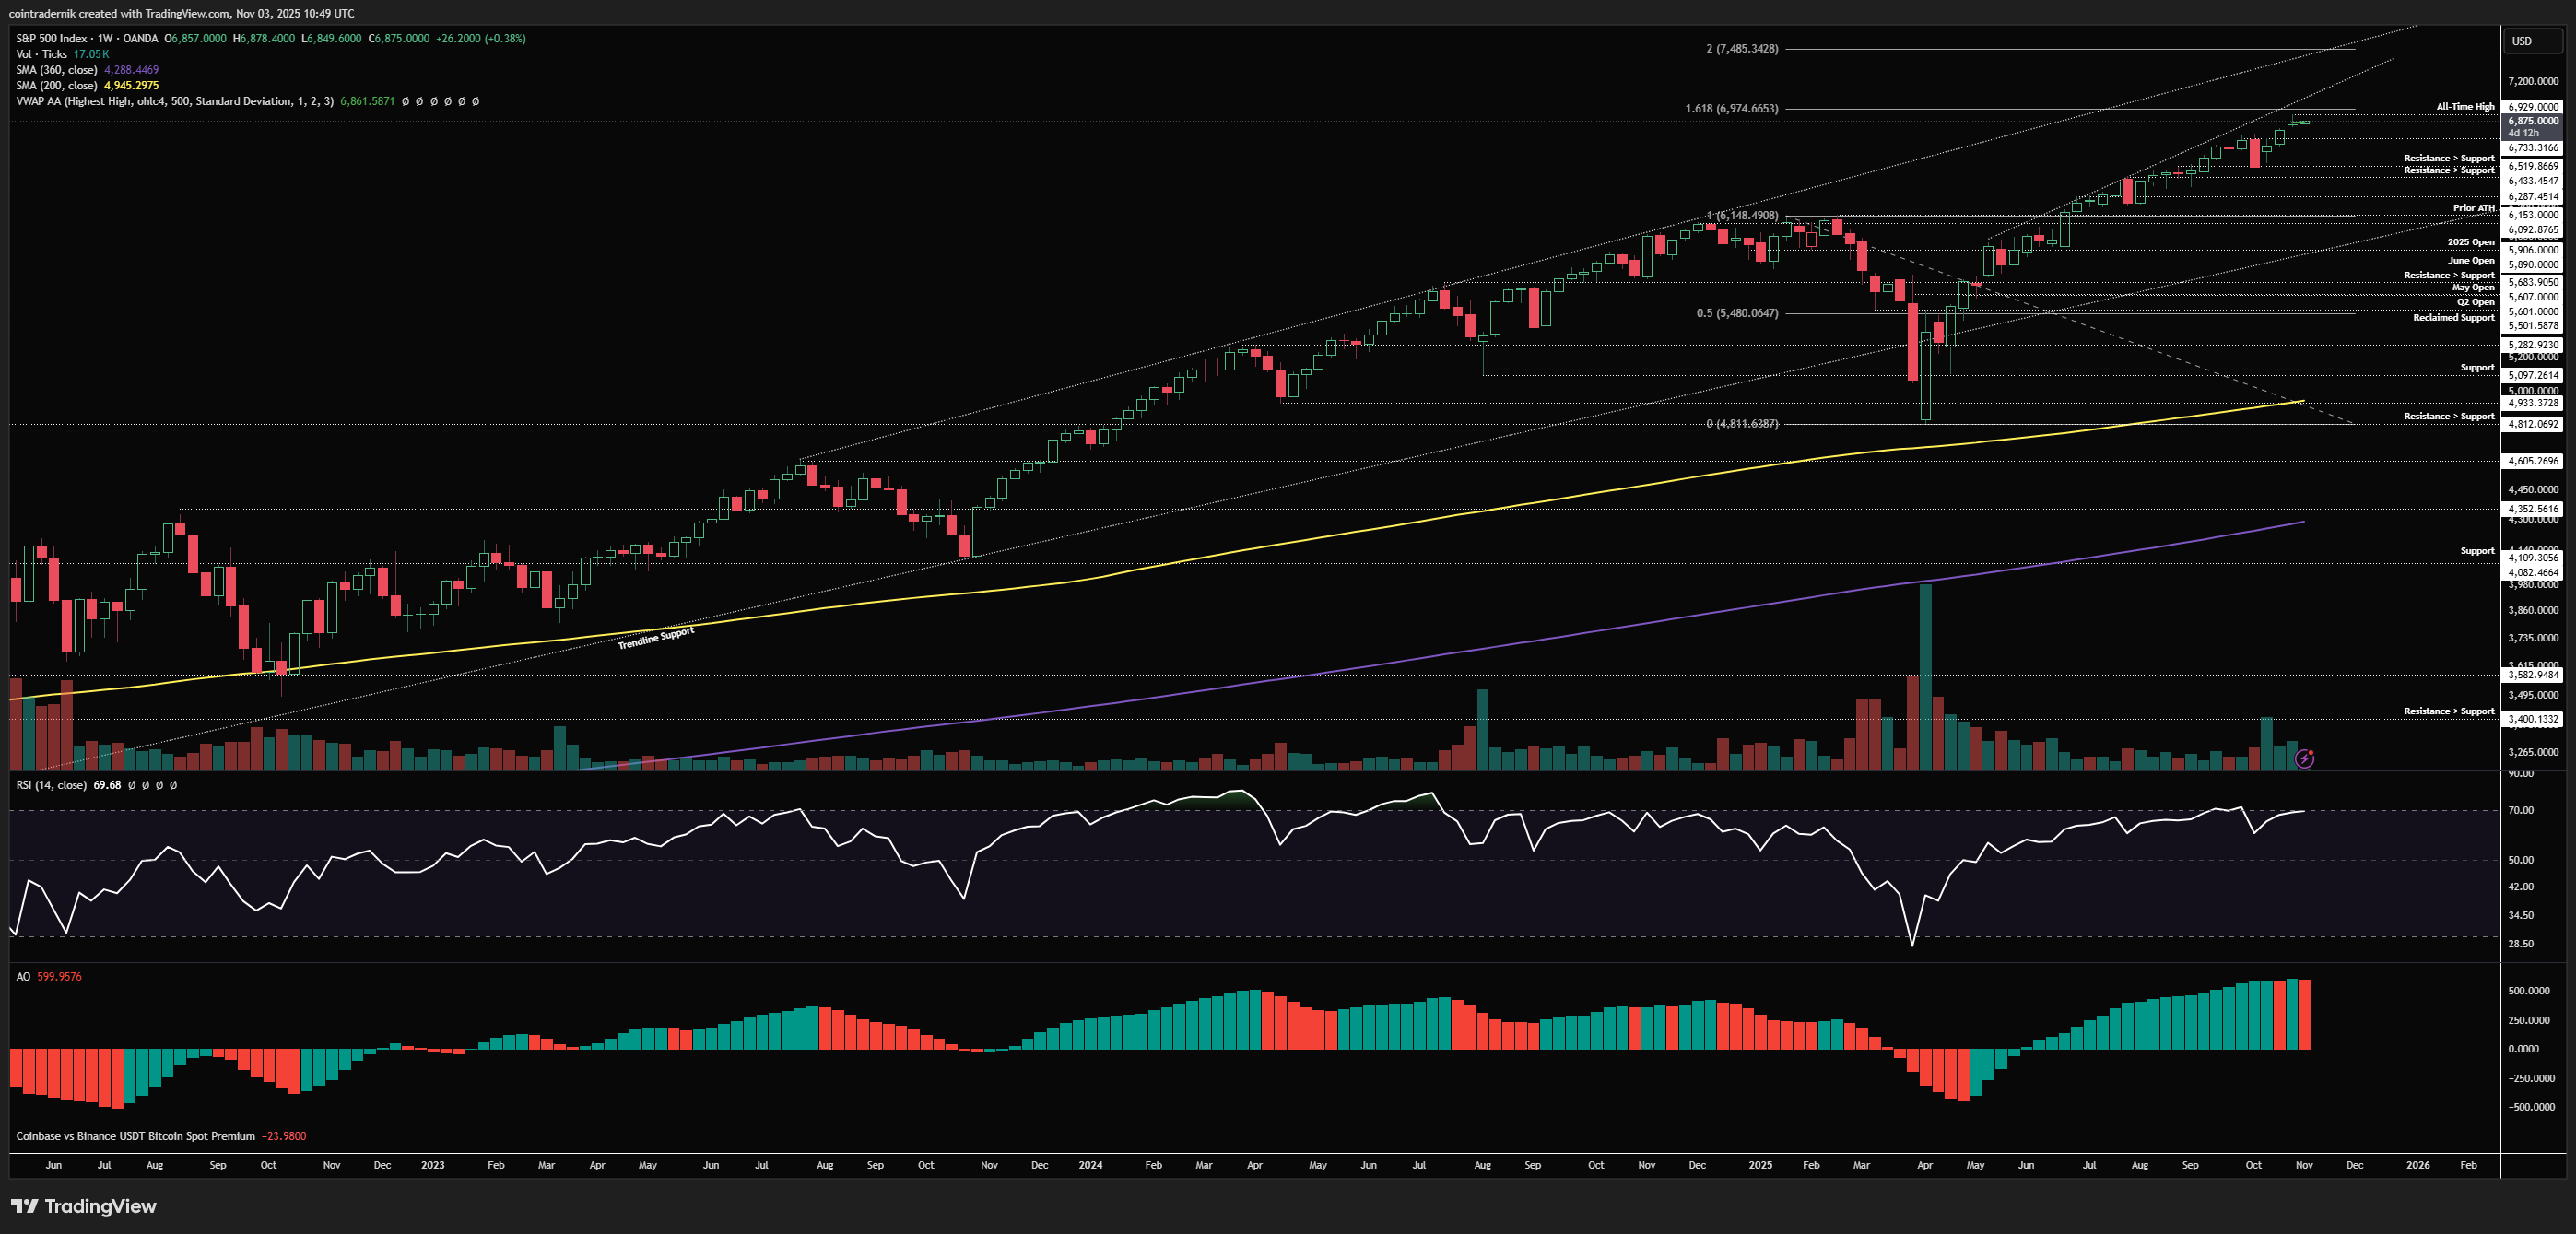
Beginning with the weekly view for SPX, we can see that price pushed into fresh all-time highs last week at $6929 after several gap ups and is now traded a little lower. I would expect to see any dip early this month into $6730-$6750 gobbled up should we get it, though I do think there is a risk of shallower dips than even a few percent into December as we see some chasing. I do continue to expect any move above $7000 to finally lead to sentiment and positioning turning more classically bullish and stretched, especially if that occurs early in Nov, leading to a melt-up dynamic into early-mid December before profit-taking. There remains nothing on the higher timeframes that looks bearish so it goes without saying that dips are opportunities to long, at least for the next few weeks.
Daily:
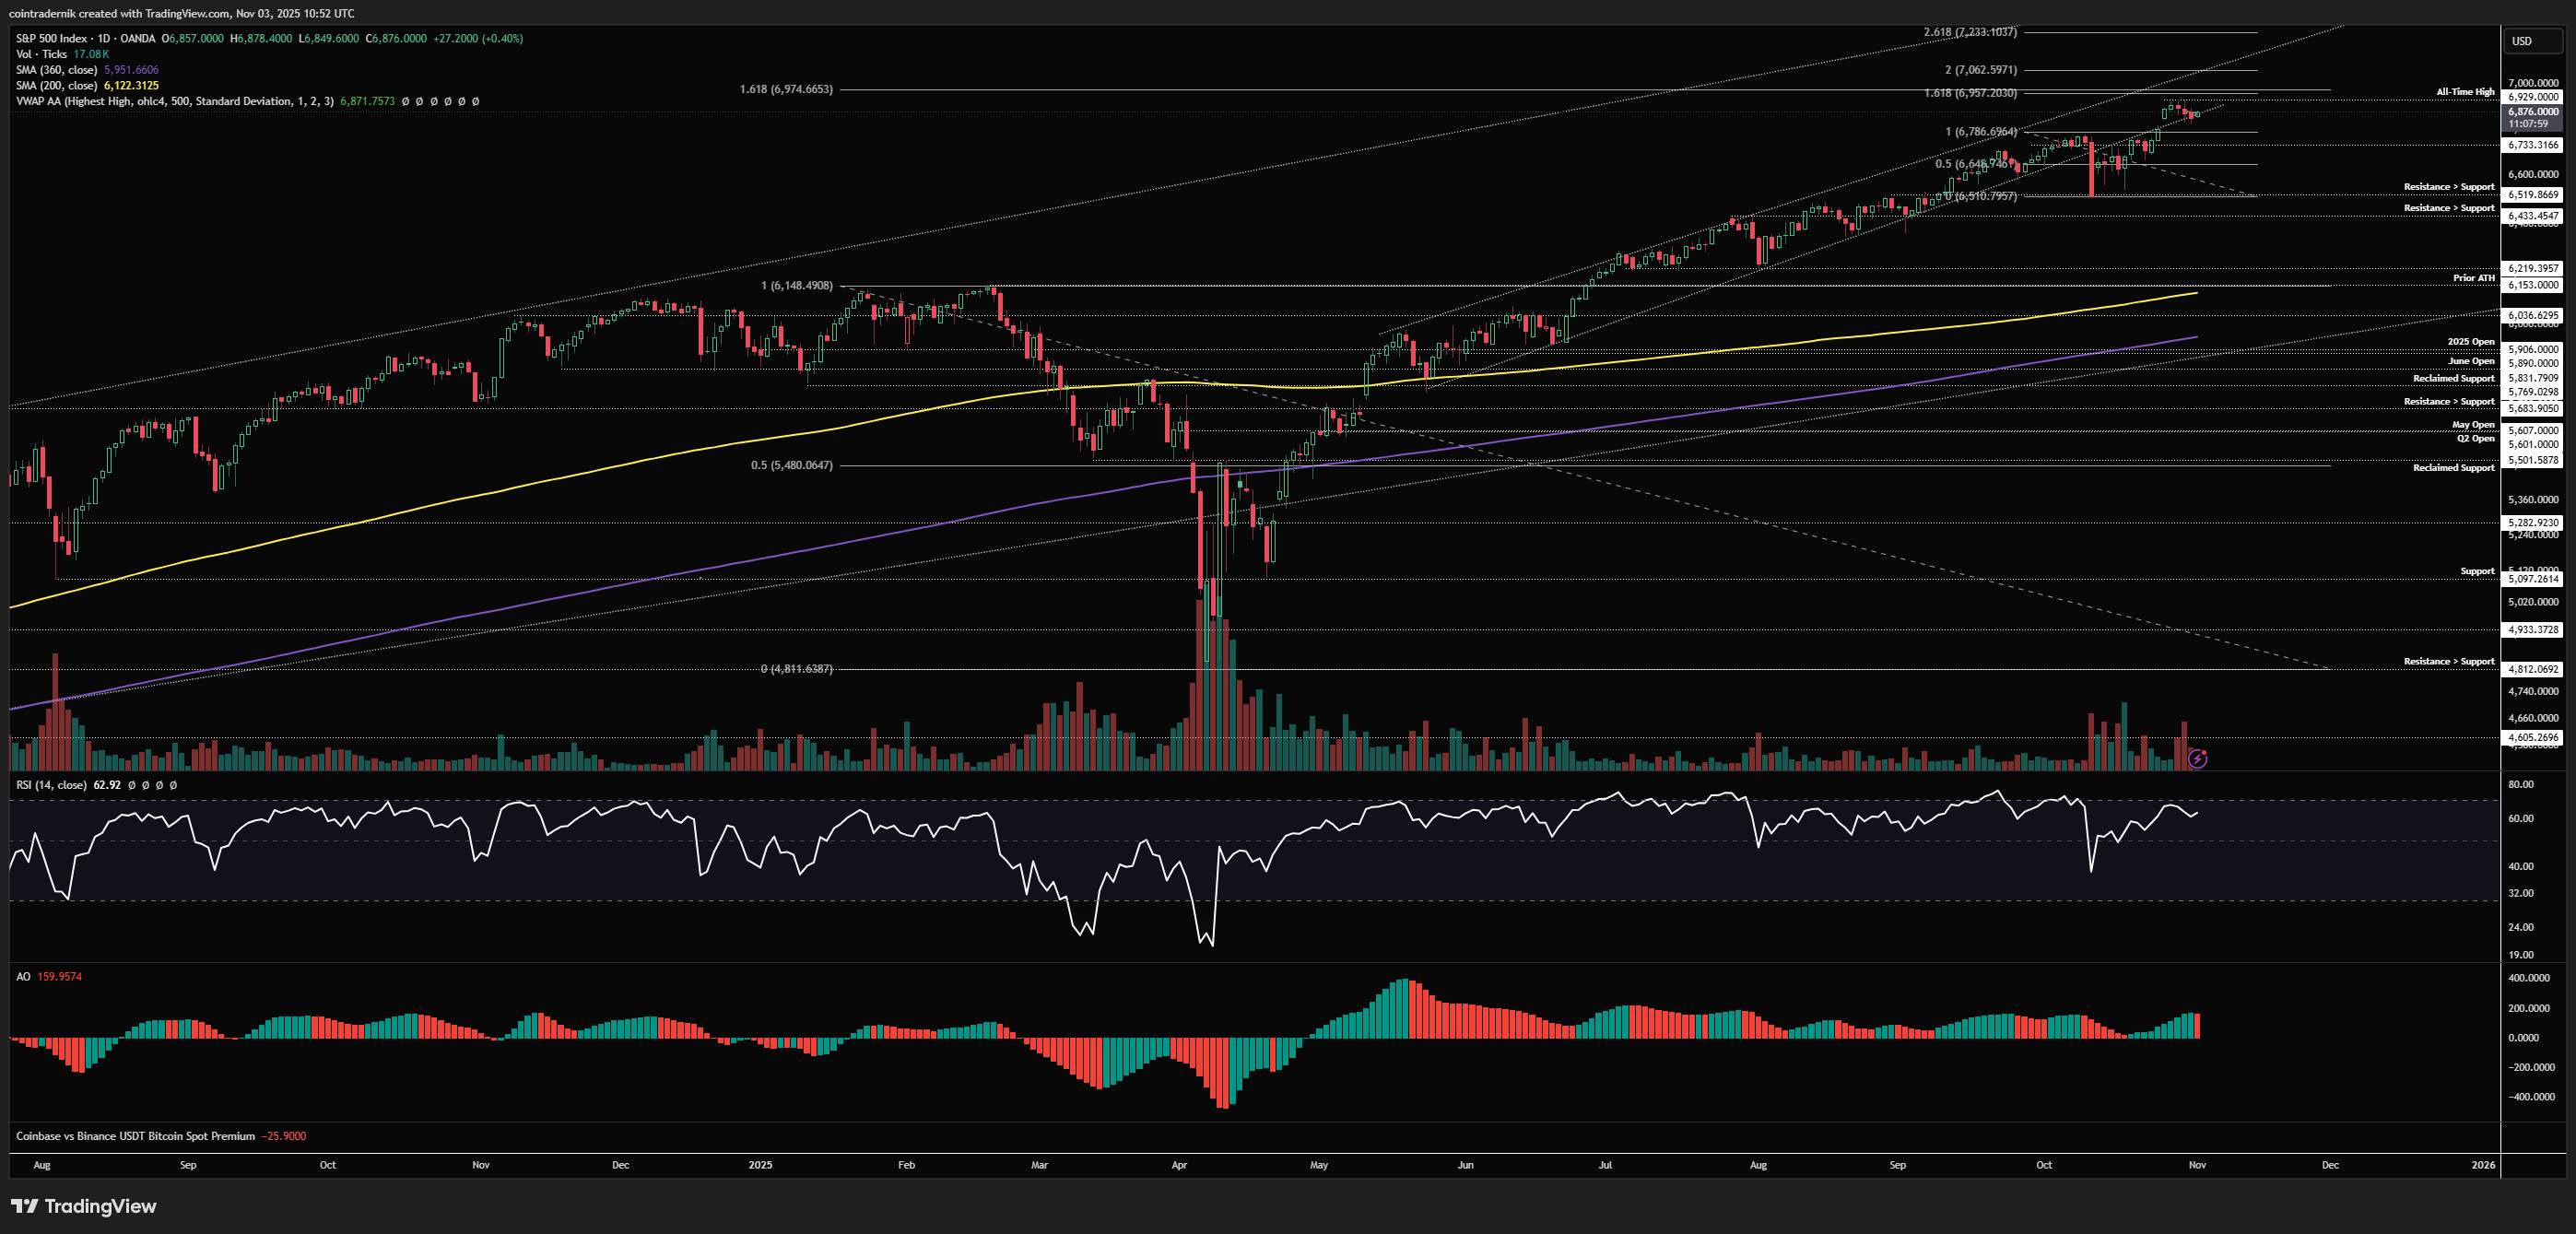
Finally, looking at the daily, we can see again how momentum remains bullish with no trend exhaustion in sight, and though we have pulled back a touch we remain above the breakaway gap. If we are going to melt up, there is a good chance this gap doesn't get fully filled into $6813 until December, though we have partially filled it into $6820 already. If we do fill the gap fully, it will likely happen this week and I would expect a bit more downside below that into that zone between $6730-$6750 if so, where I do expect a lot of eager buyers to step in. To the upside, acceptance above $6930 leads to $6974, which was my year-end target from months ago and now seems too low - but beyond that is obviously $7xxx, where I am expecting equities to actually feel like the wall of worry has been climbed for the first time since the April lows formed. Above $7000 I would be looking at $7062 as the 200% extension of the most recent VIX/VIX3M spike lows, with the overextension/euphoria/melt-up levels beyond that at $7233 and $7485, though I think the latter is extremely unlikely this calendar year.
I hope you've found some value in the read this week!
And if you've not already signed up for Ostium, please do so and test out some of the recent updates, including:
Sign up here (you don't have to use my ref link, of course): https://ostium.app/trade?from=CL&to=USD&ref=CTNIK

.avif)