

Market Outlook #52
September 22, 2025
-
12
min read


This blog references an opinion and is for entertainment and informational purposes only. It is not intended to be investment advice. Seek a duly licensed professional for investment advice.
In this 52nd Market Outlook here at Ostium Research, we'll be taking a look at the week ahead in markets, focusing specifically on price-action, positioning and event risk for Bitcoin, Ethereum, Gold, Copper and Crude Oil.
Firstly, let's take a look at the calendar for the relatively light week ahead:
MONDAY: BANK OF ENGLAND GOVERNOR BAILEY SPEECH
TUESDAY: US S&P GLOBAL MANUFACTURING PMI (SEP): (CONSENSUS N/A VS PREVIOUS 53)
TUESDAY: US S&P GLOBAL SERVICES PMI (SEP): (CONSENSUS N/A VS PREVIOUS 54.5)
THURSDAY: SNB INTEREST RATE DECISION: (CONSENSUS 0% VS PREVIOUS 0%)
THURSDAY: US DURABLE GOODS ORDERS (AUG): (CONSENSUS -0.4% VS PREVIOUS -2.8%)
THURSDAY: US INITIAL JOBLESS CLAIMS: (CONSENSUS 240K VS PREVIOUS 231K)
THURSDAY: VARIOUS FED SPEECHES
FRIDAY: US CORE PERSONAL CONSUMPTION EXPENDITURES (MOM) (AUG): (CONSENSUS 0.2% VS PREVIOUS 0.3%)
Now, let's dig into asset-specific price-action for the week ahead, looking firstly at Bitcoin:
Price: $113,006
Weekly:

If we begin by looking at BTC/USD on the weekly timeframe, we can see that price consolidated last week right around the August open, wicking above that level into key resistance highlighted last week at $117.5k, before closing the week marginally below the open. Early price-action this morning has seen a mass liquidation event off that level, with price pushing as low as $111,761, marginally below key reclaimed support. I have been mentioning for a few weeks that there is a window of weakness here into early October and I do think that crypto is front-running a lot of anticipated quarterly-end weakness, with over $1.6bn in longs liquidated so far today. Given the volume of liquidations so early in this window, I do also think that crypto bottoms a little earlier than I previously expected, but I want to see how this week goes before being more confident in that. Next week is much more heavy on the data front and I do think we continue to surprise to the upside, so that has the potential for being the pivot week into a strong October (and a strong Q4). I highlighted two scenarios that I was considering last week, where one was rejection around $118k leading to a bear trap below the $107k low before v-reversal higher; and the second was acceptance above $120k into Q3 close, leading to a higher-low above $107k, with this being a less probable scenario. One thing to note about this early weekly price-action is that the weekly high at $115.3k did form immediately after the weekly open, and if you've been reading these Outlooks for a while you will know how likely it is that this level is at least revisited some time later in the week. So, if we know that, I would expect the next leg lower or second liquidation event this week to be a high probability low, whatever price that occurs at, whether it is a higher-low above $107k or a move below that level. From there, we should anticipate $115.3k to be retested again later in the week, and the reaction on that retest will obviously be telling for whether we have more downside to come or that was the bear trap before the move to new highs. Acceptance below $107k on a weekly close would open up more downside into $99k during this window of weakness - and acceptance below that level would invalidate my general view that we move much higher from early October.
Daily:
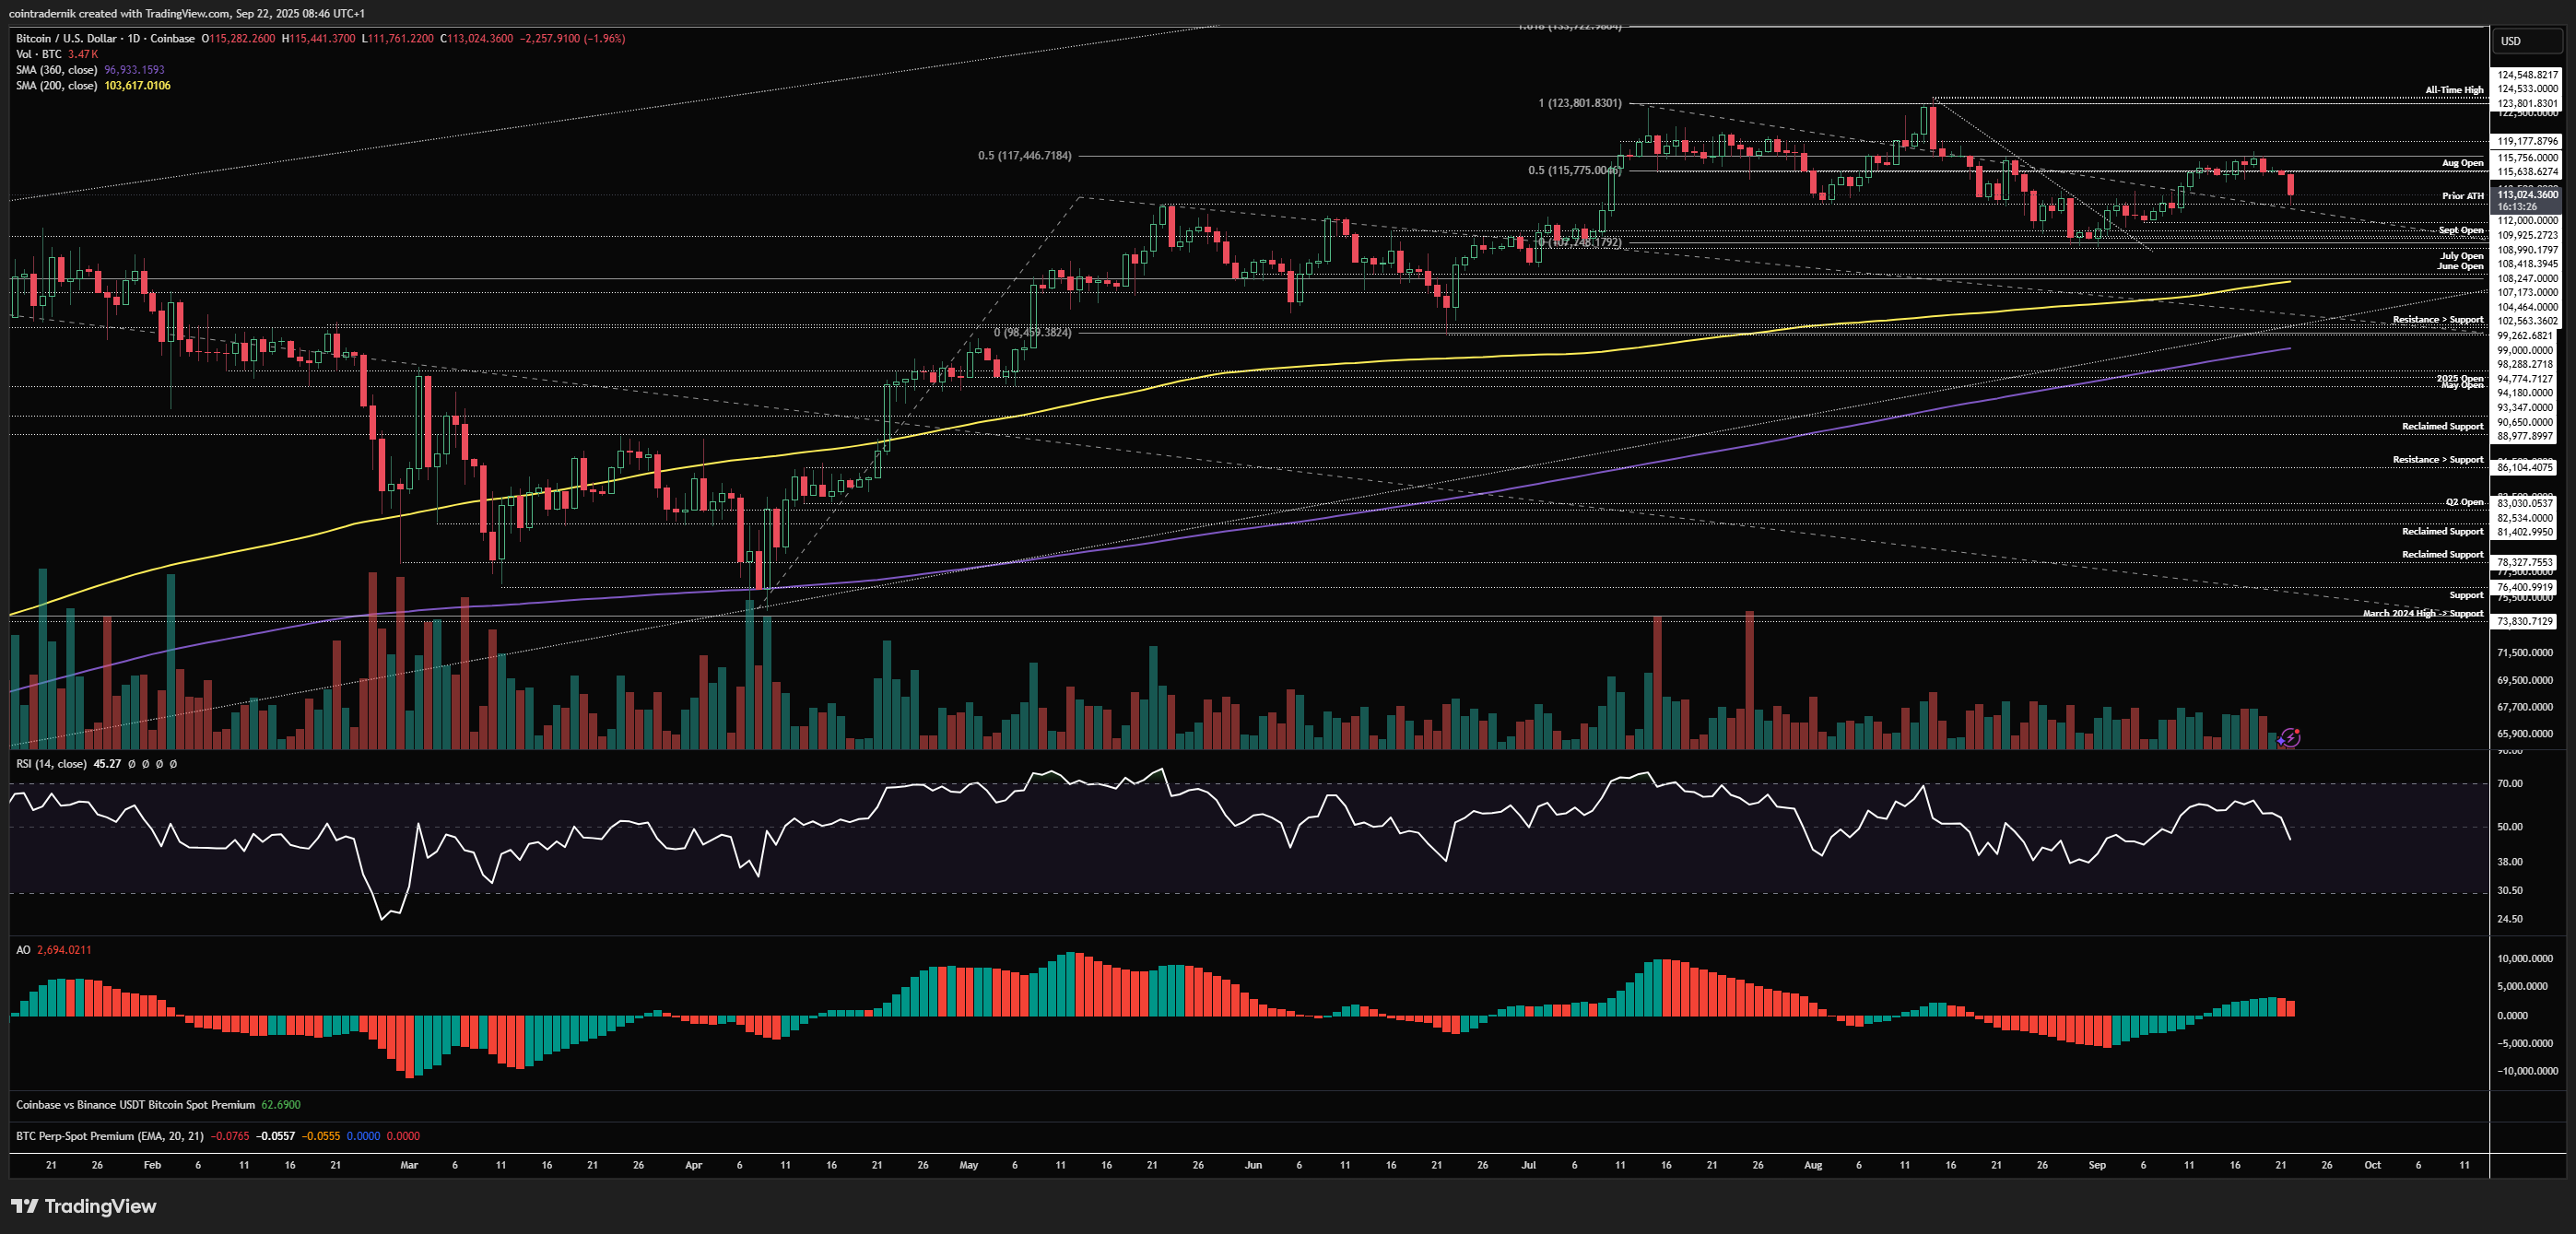
Looking now at the daily, we can see clearly how we sold off from the open, with that August open at $115.7k a key level to flip into support to resume bullishness. We have pushed into the prior all-time high at $112k here and whilst I do not personally think the low is in already, if we did bounce hard off this level and flip $115.7k into support it would be difficult to remain short-term bearish, as that would look like a strong higher-low formation with an accompanying high volume of long liquidations. More likely, in my view, is some more chop between $112k-$115k before a second push lower below today's low, where the reaction will tell us whether we get a much deeper move down towards that $107k low or whether we are marking out a bottom. Not much else to add on this timeframe for the time being.
Now, given all of the above context, looking for setups this week will be a little more difficult given the amount of variables here. Nonetheless, a high probability long back into the weekly high (given how soon after the weekly open it formed) would be a sweep of today's low early this week and then a reclaim of $112k as support, where you could add longs and add more aggressively as price pushes off that level, with invalidation below that day's low. I would cover this at the weekly high, given we could reject there - but the higher timeframe view if we do push back above $115.3k into the weekend is very favourable for the lows being in, where any early October dip is likely to form another higher-low:
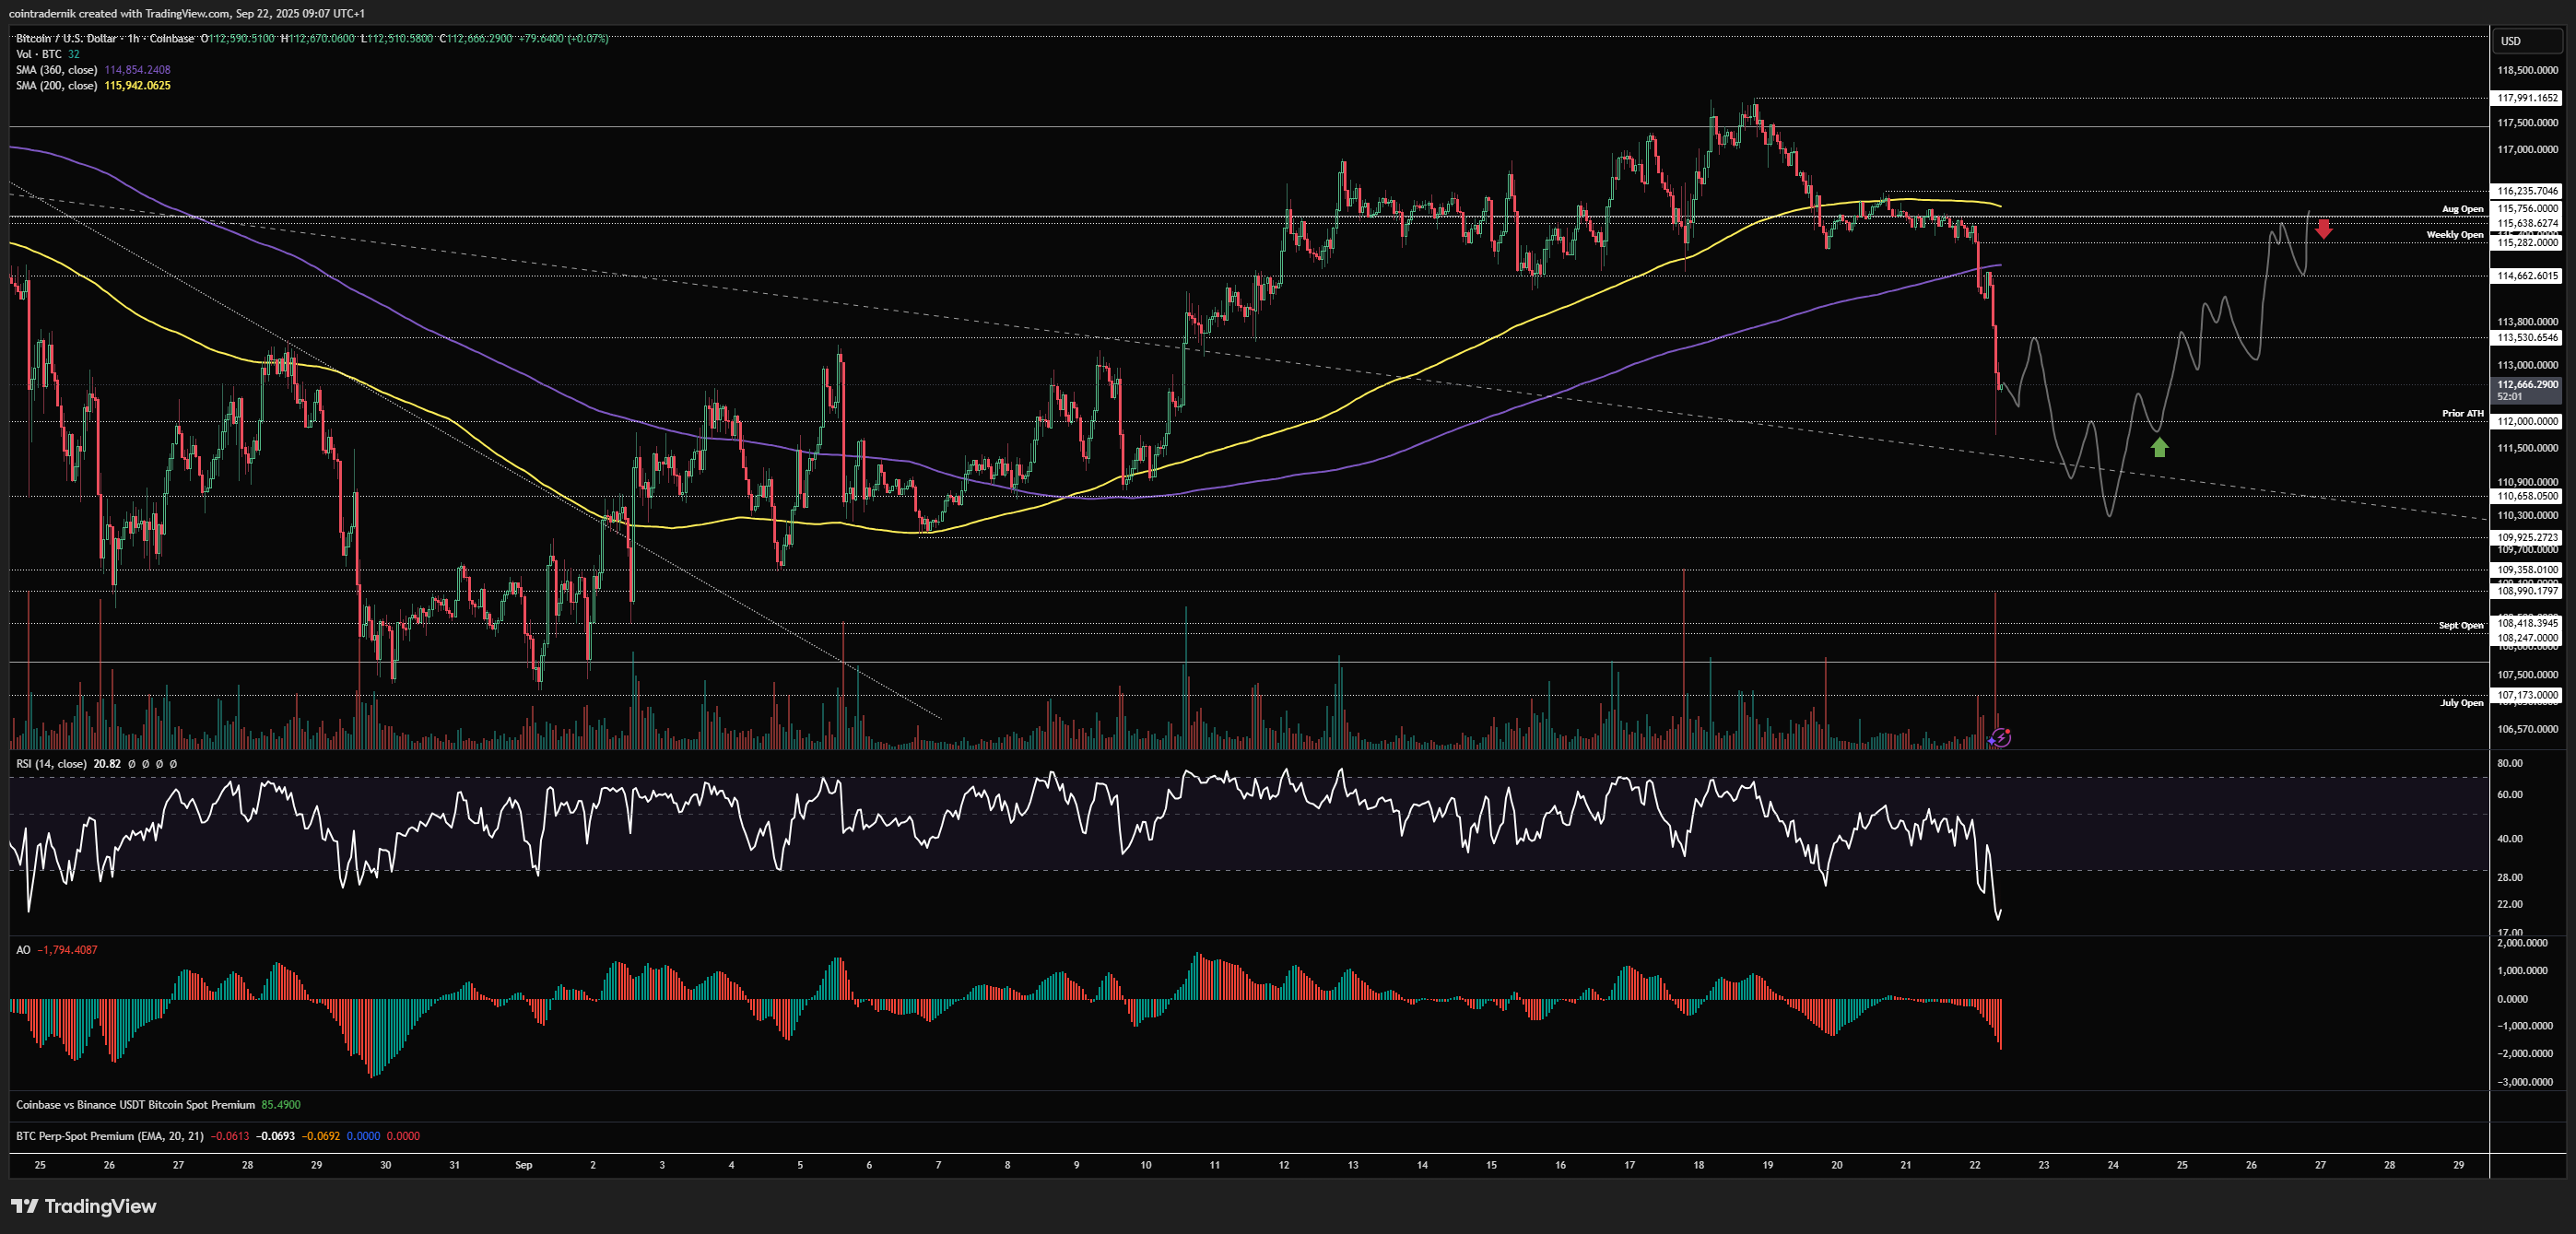
There is also a really nice short setup here that would kind of fuck everyone if we get it, which is a sharp v-reversal off this low without sweeping it, back above the weekly high early this week to take out the weekend high at $116.3k, before forming momentum exhaustion above the weekly open and rejecting and breaking back below $115.3k, where you would look to short it aggressively back into $112k and lower:

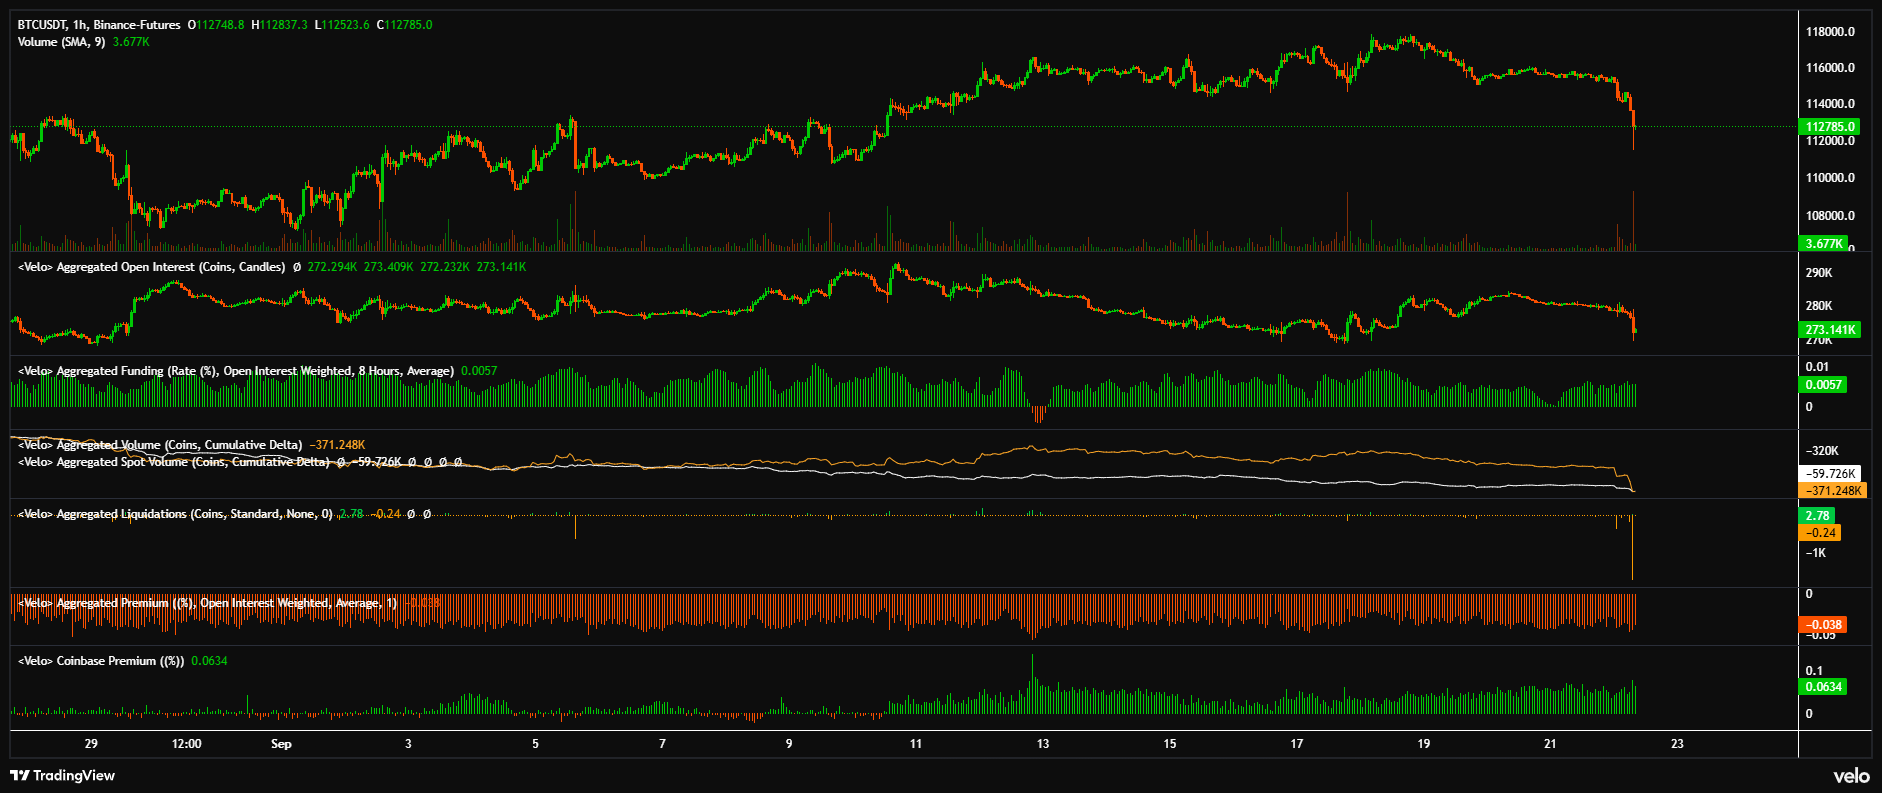
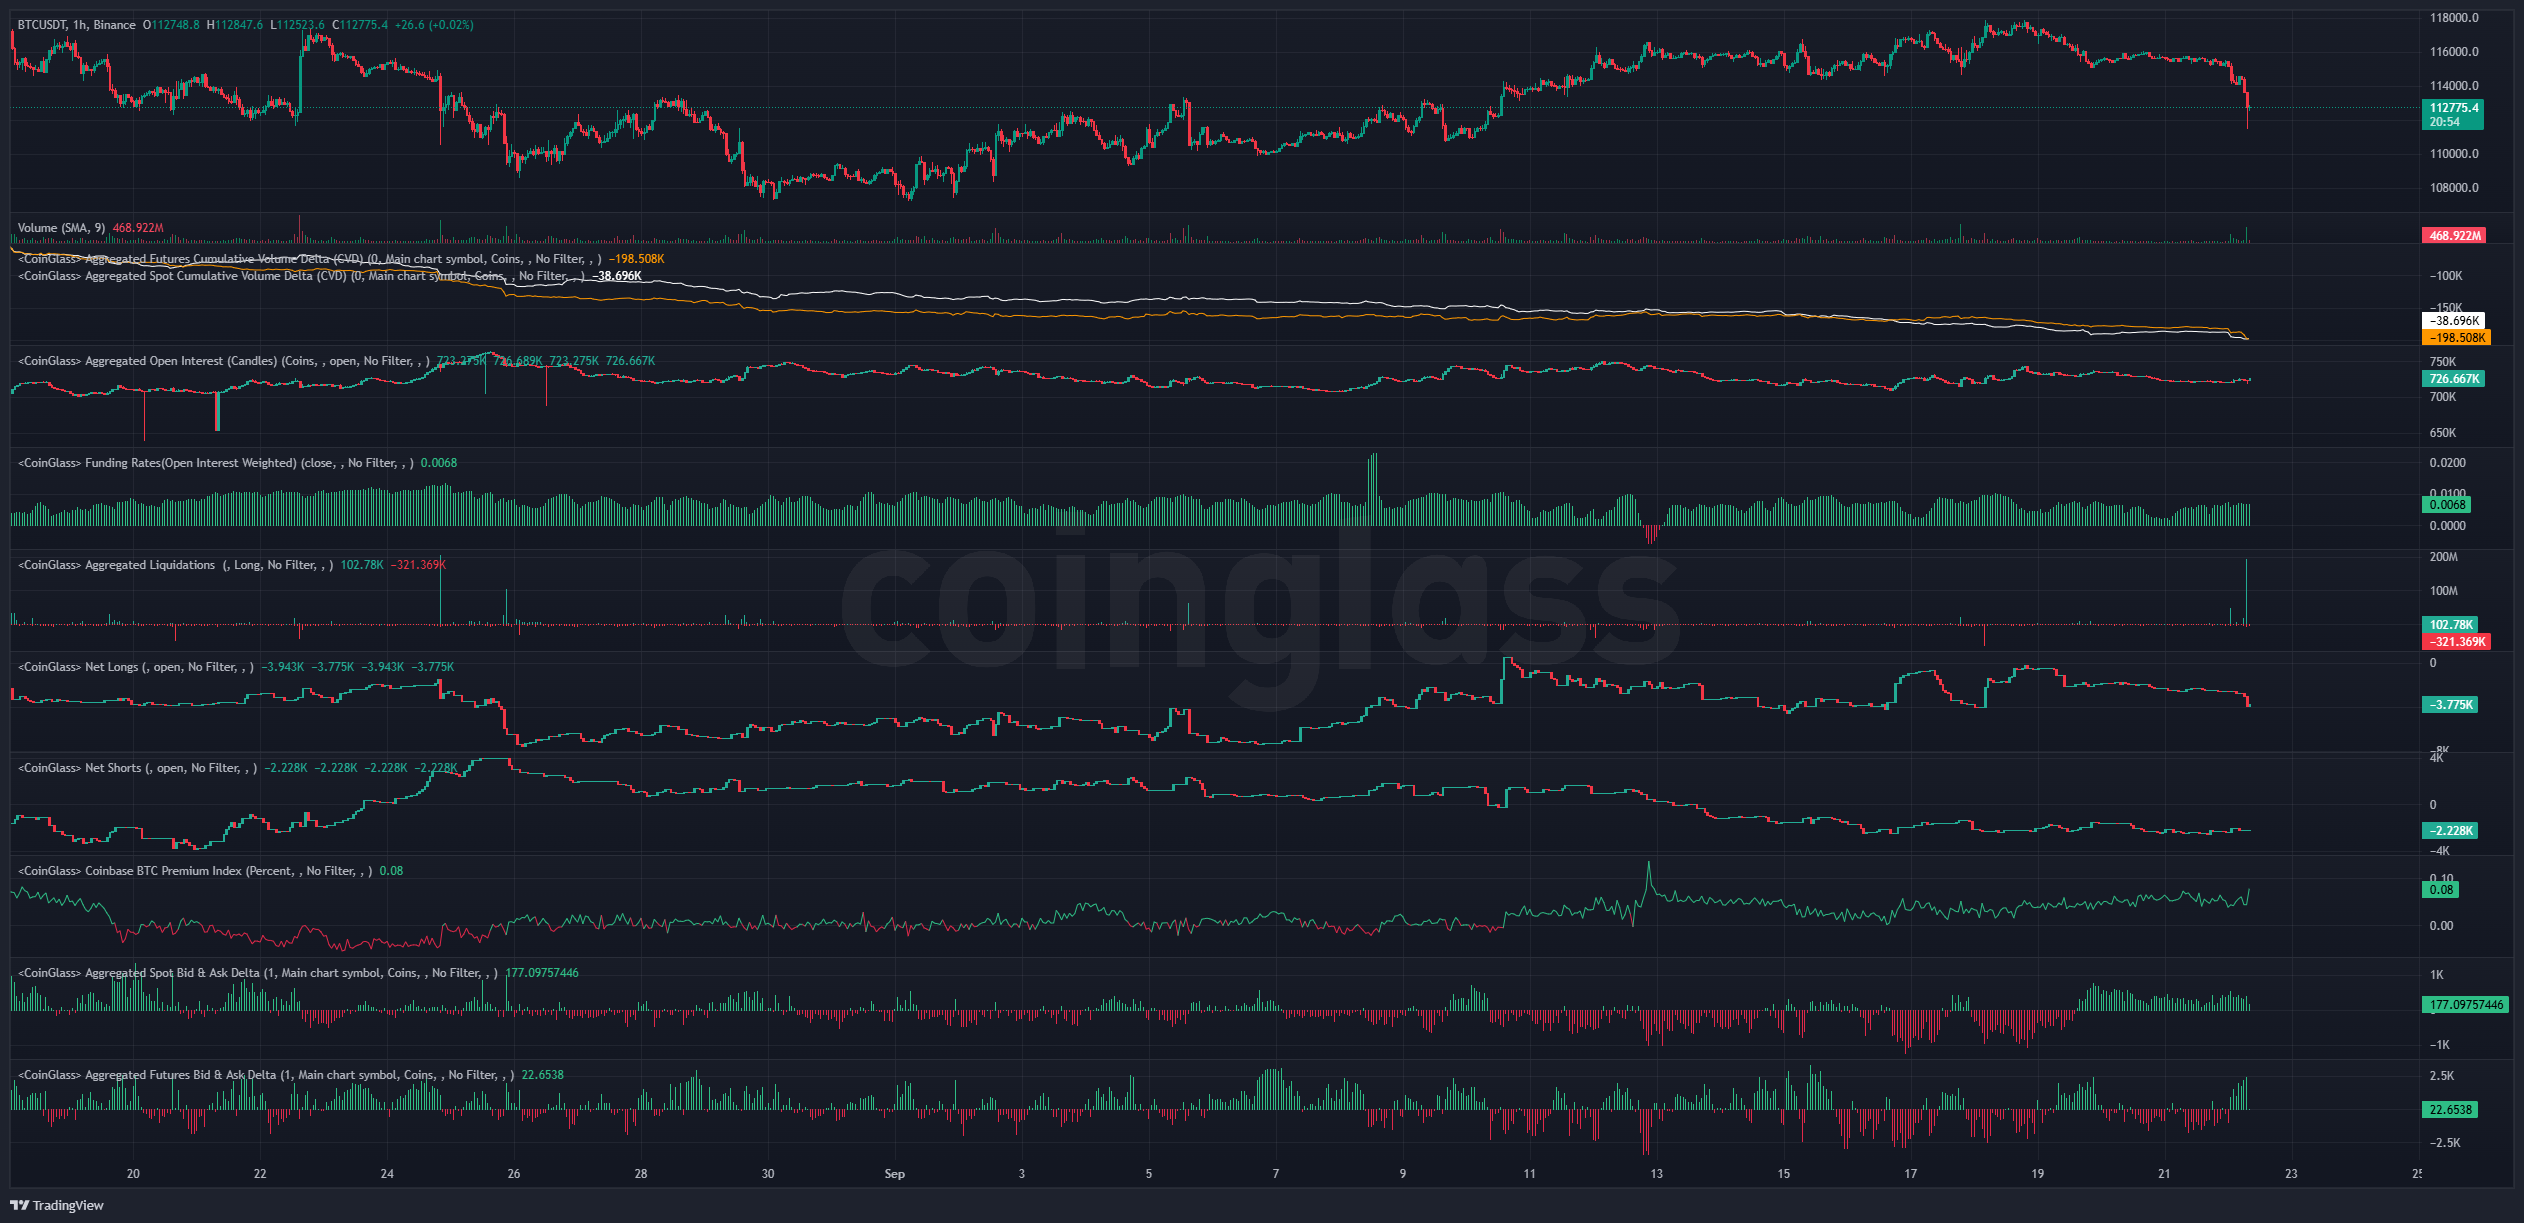
And here's a snapshot of positioning across Velo and CoinGlass:
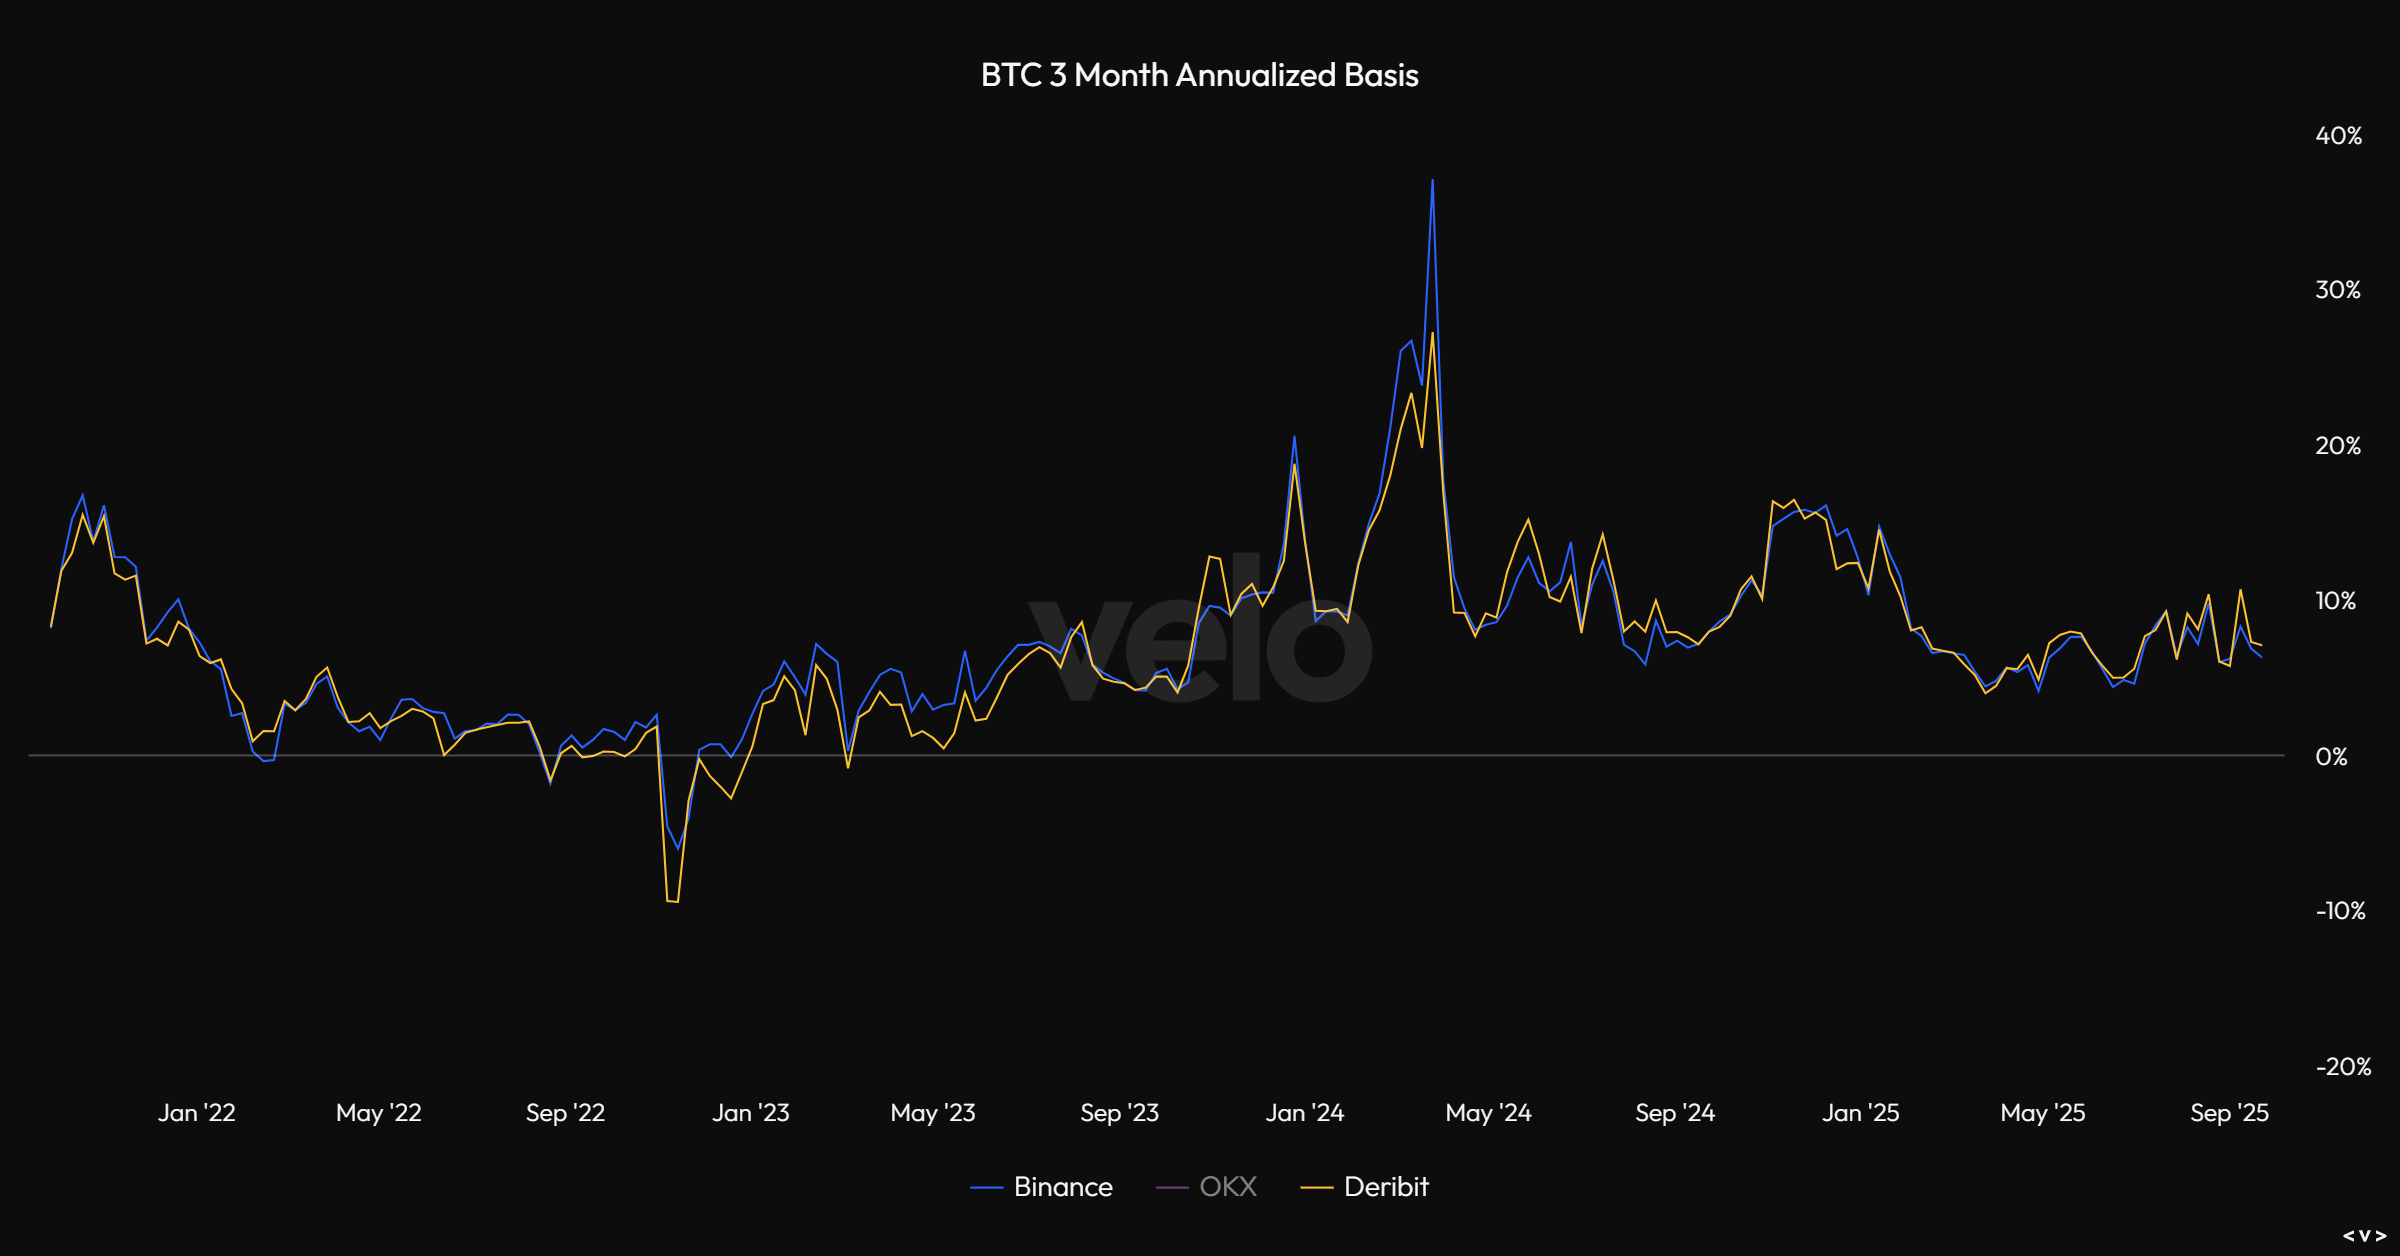
And here's 3-month annualized basis:
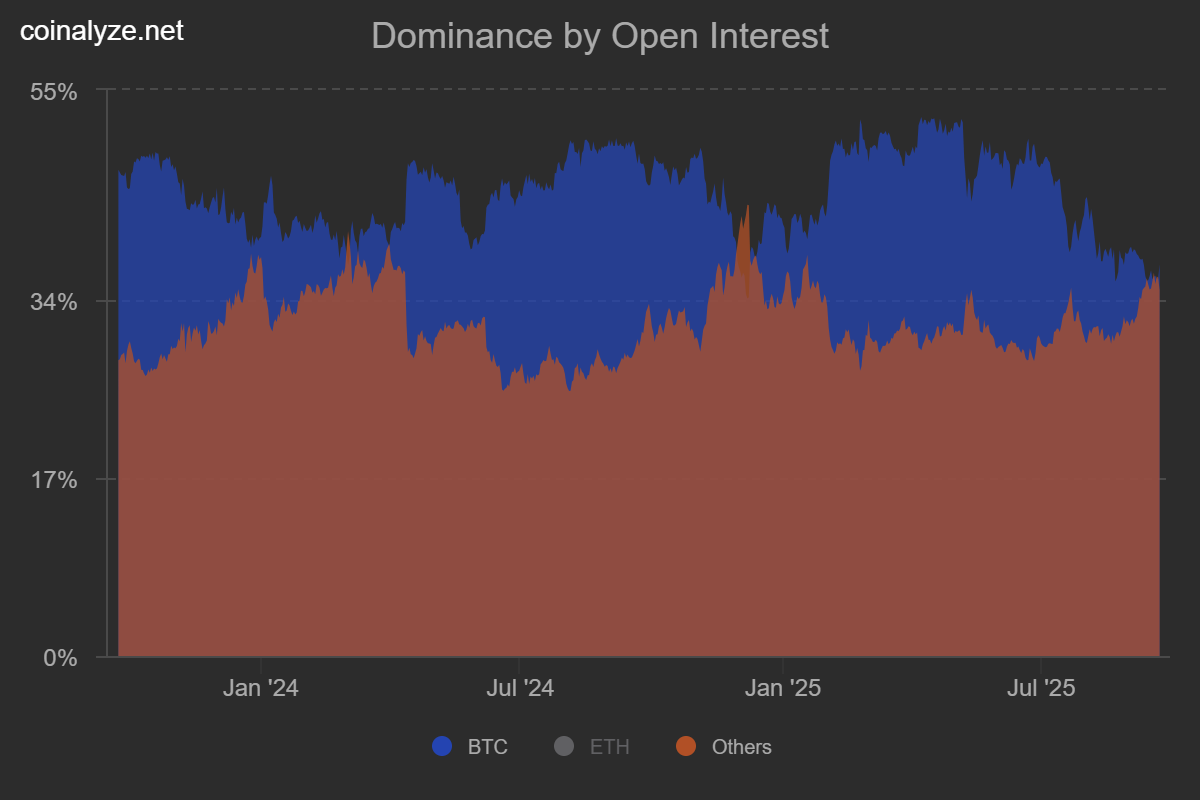
And Bitcoin OI vs Altcoin OI:
And finally some of the expected 1-week and 1-month liquidation levels:
-2025-09-22_08_36_44.png)
-2025-09-22_08_37_27.png)
Price: $4202
ETH/USD
Weekly:
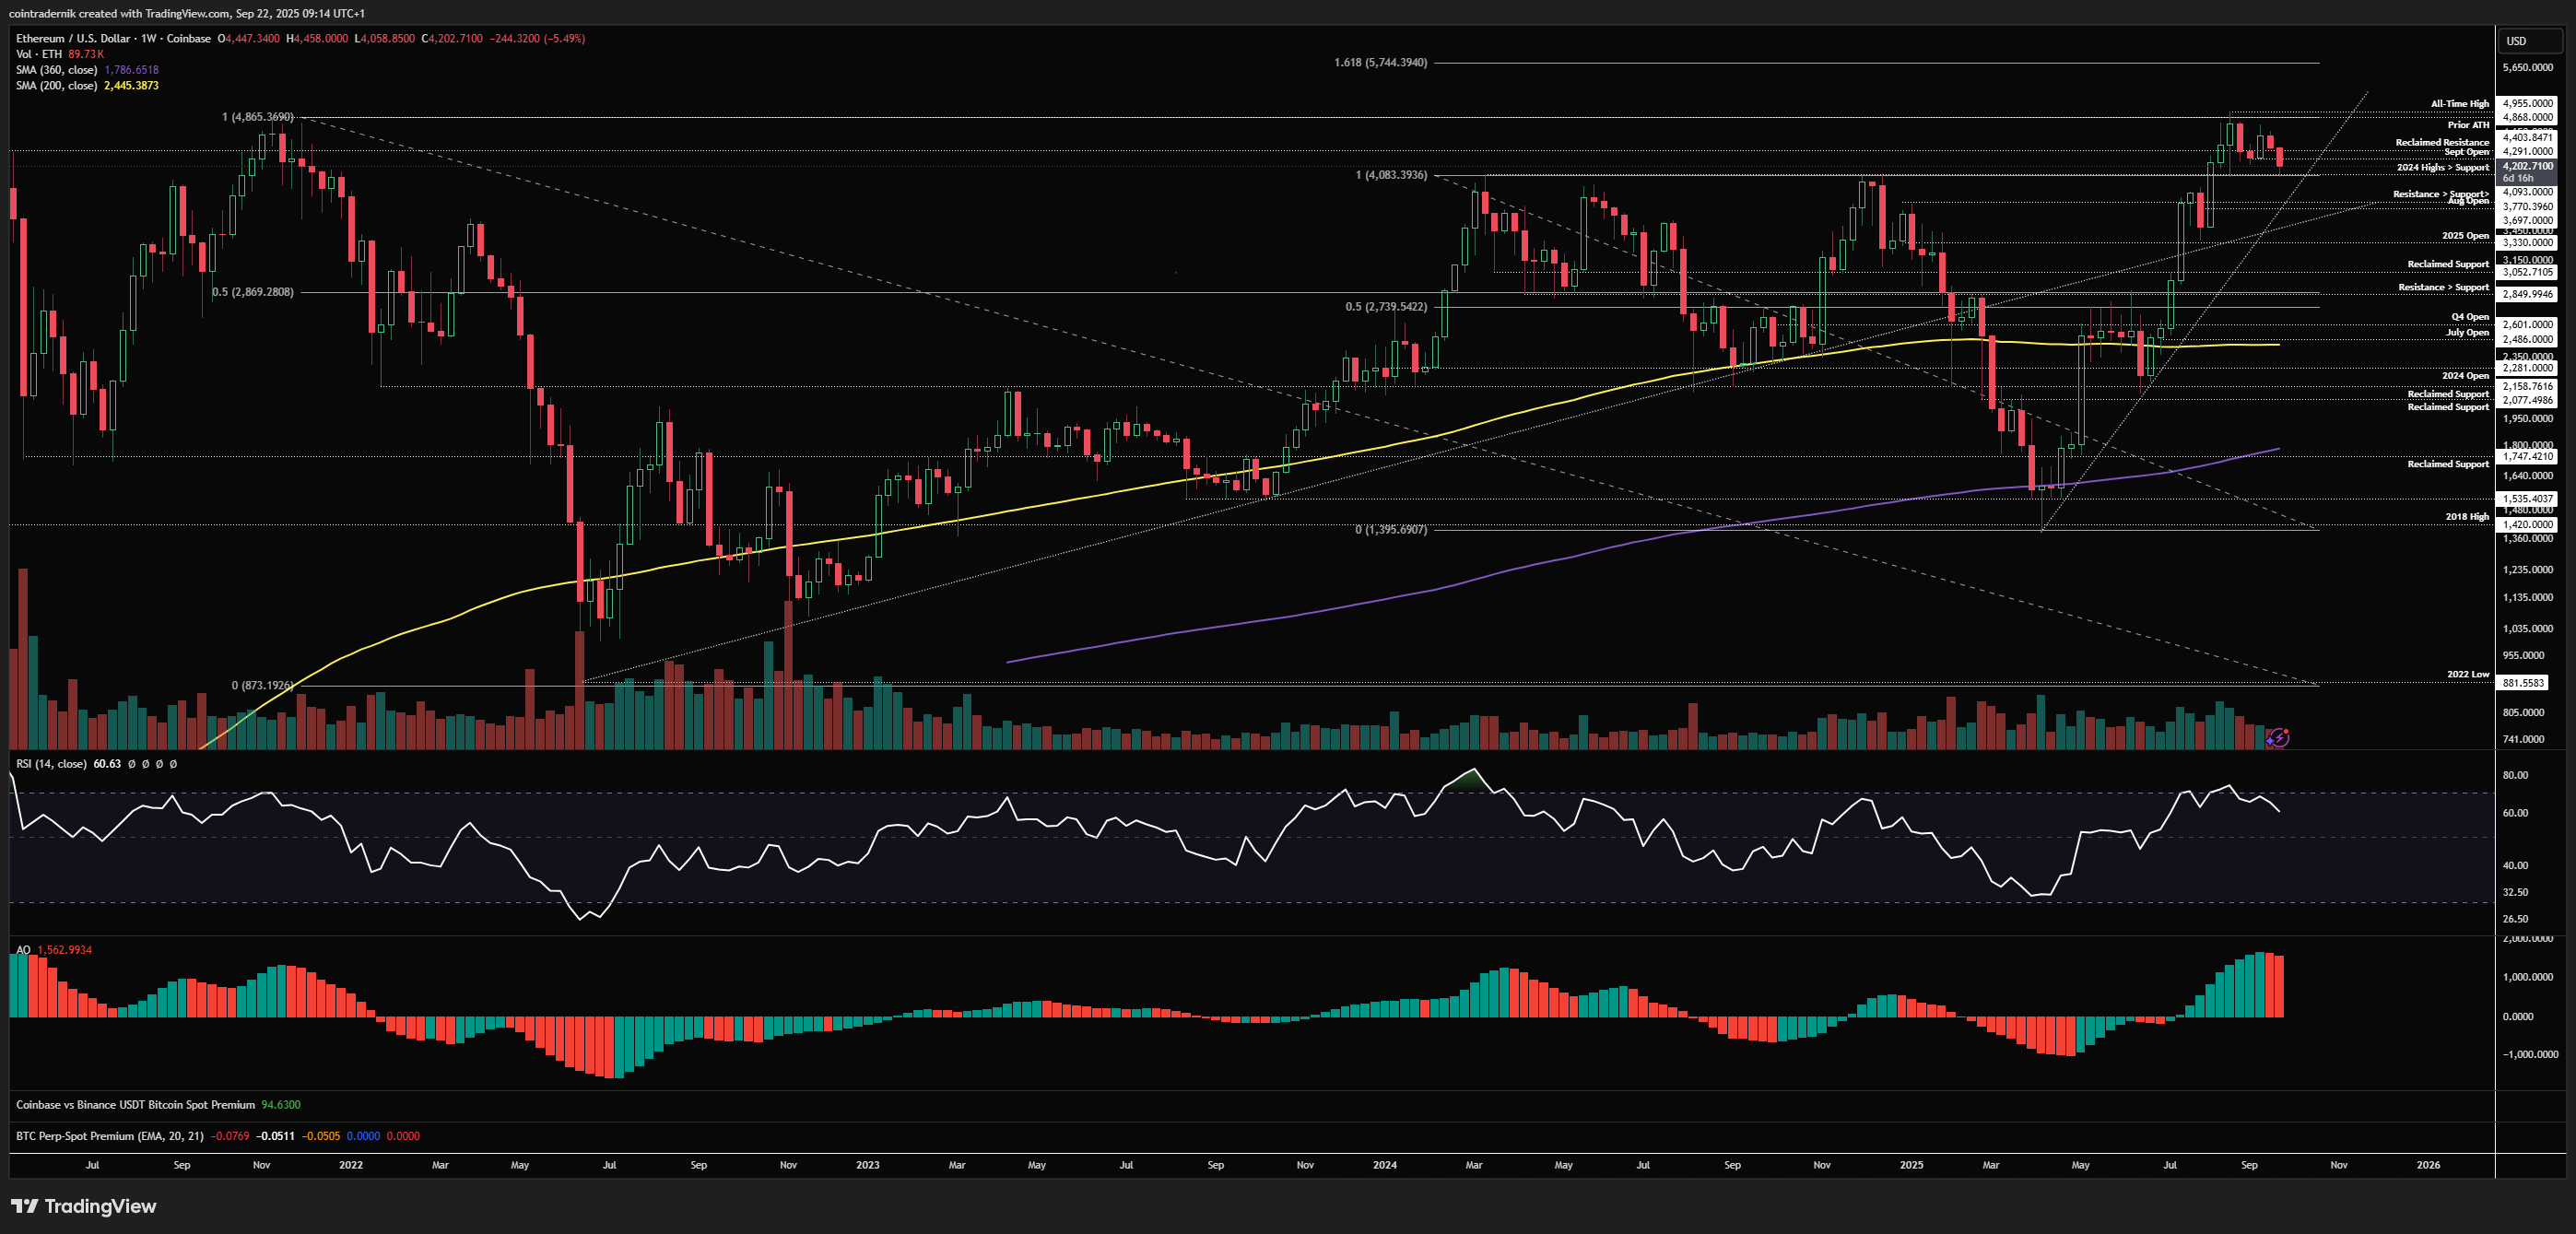
If we begin with the weekly view for ETH/USD, we can see that price rejected last week at a lower high below the all-time highs and closed the week at $4447, marginally above local support. Early price-action this week has seen price push back below this level and through the September open at $4291 into major support at $4090, where it bounced. Until we see a weekly close back below $4090, we should anticipate this level to hold as support; if we do close below, I think we at the very least trade back into $3770 to retest that support, but potentially wick much lower back into the yearly open for a much larger liquidation event during this window of weakness (which would obviously be an aggressive long opportunity if we are so lucky). For now, if we wick below $4090 again this week but close back above it, there is a good chance that that was ETH's bear trap before another attempt at the highs. Nothing about this higher timeframe structure or momentum is currently giga-bearish.
Daily:
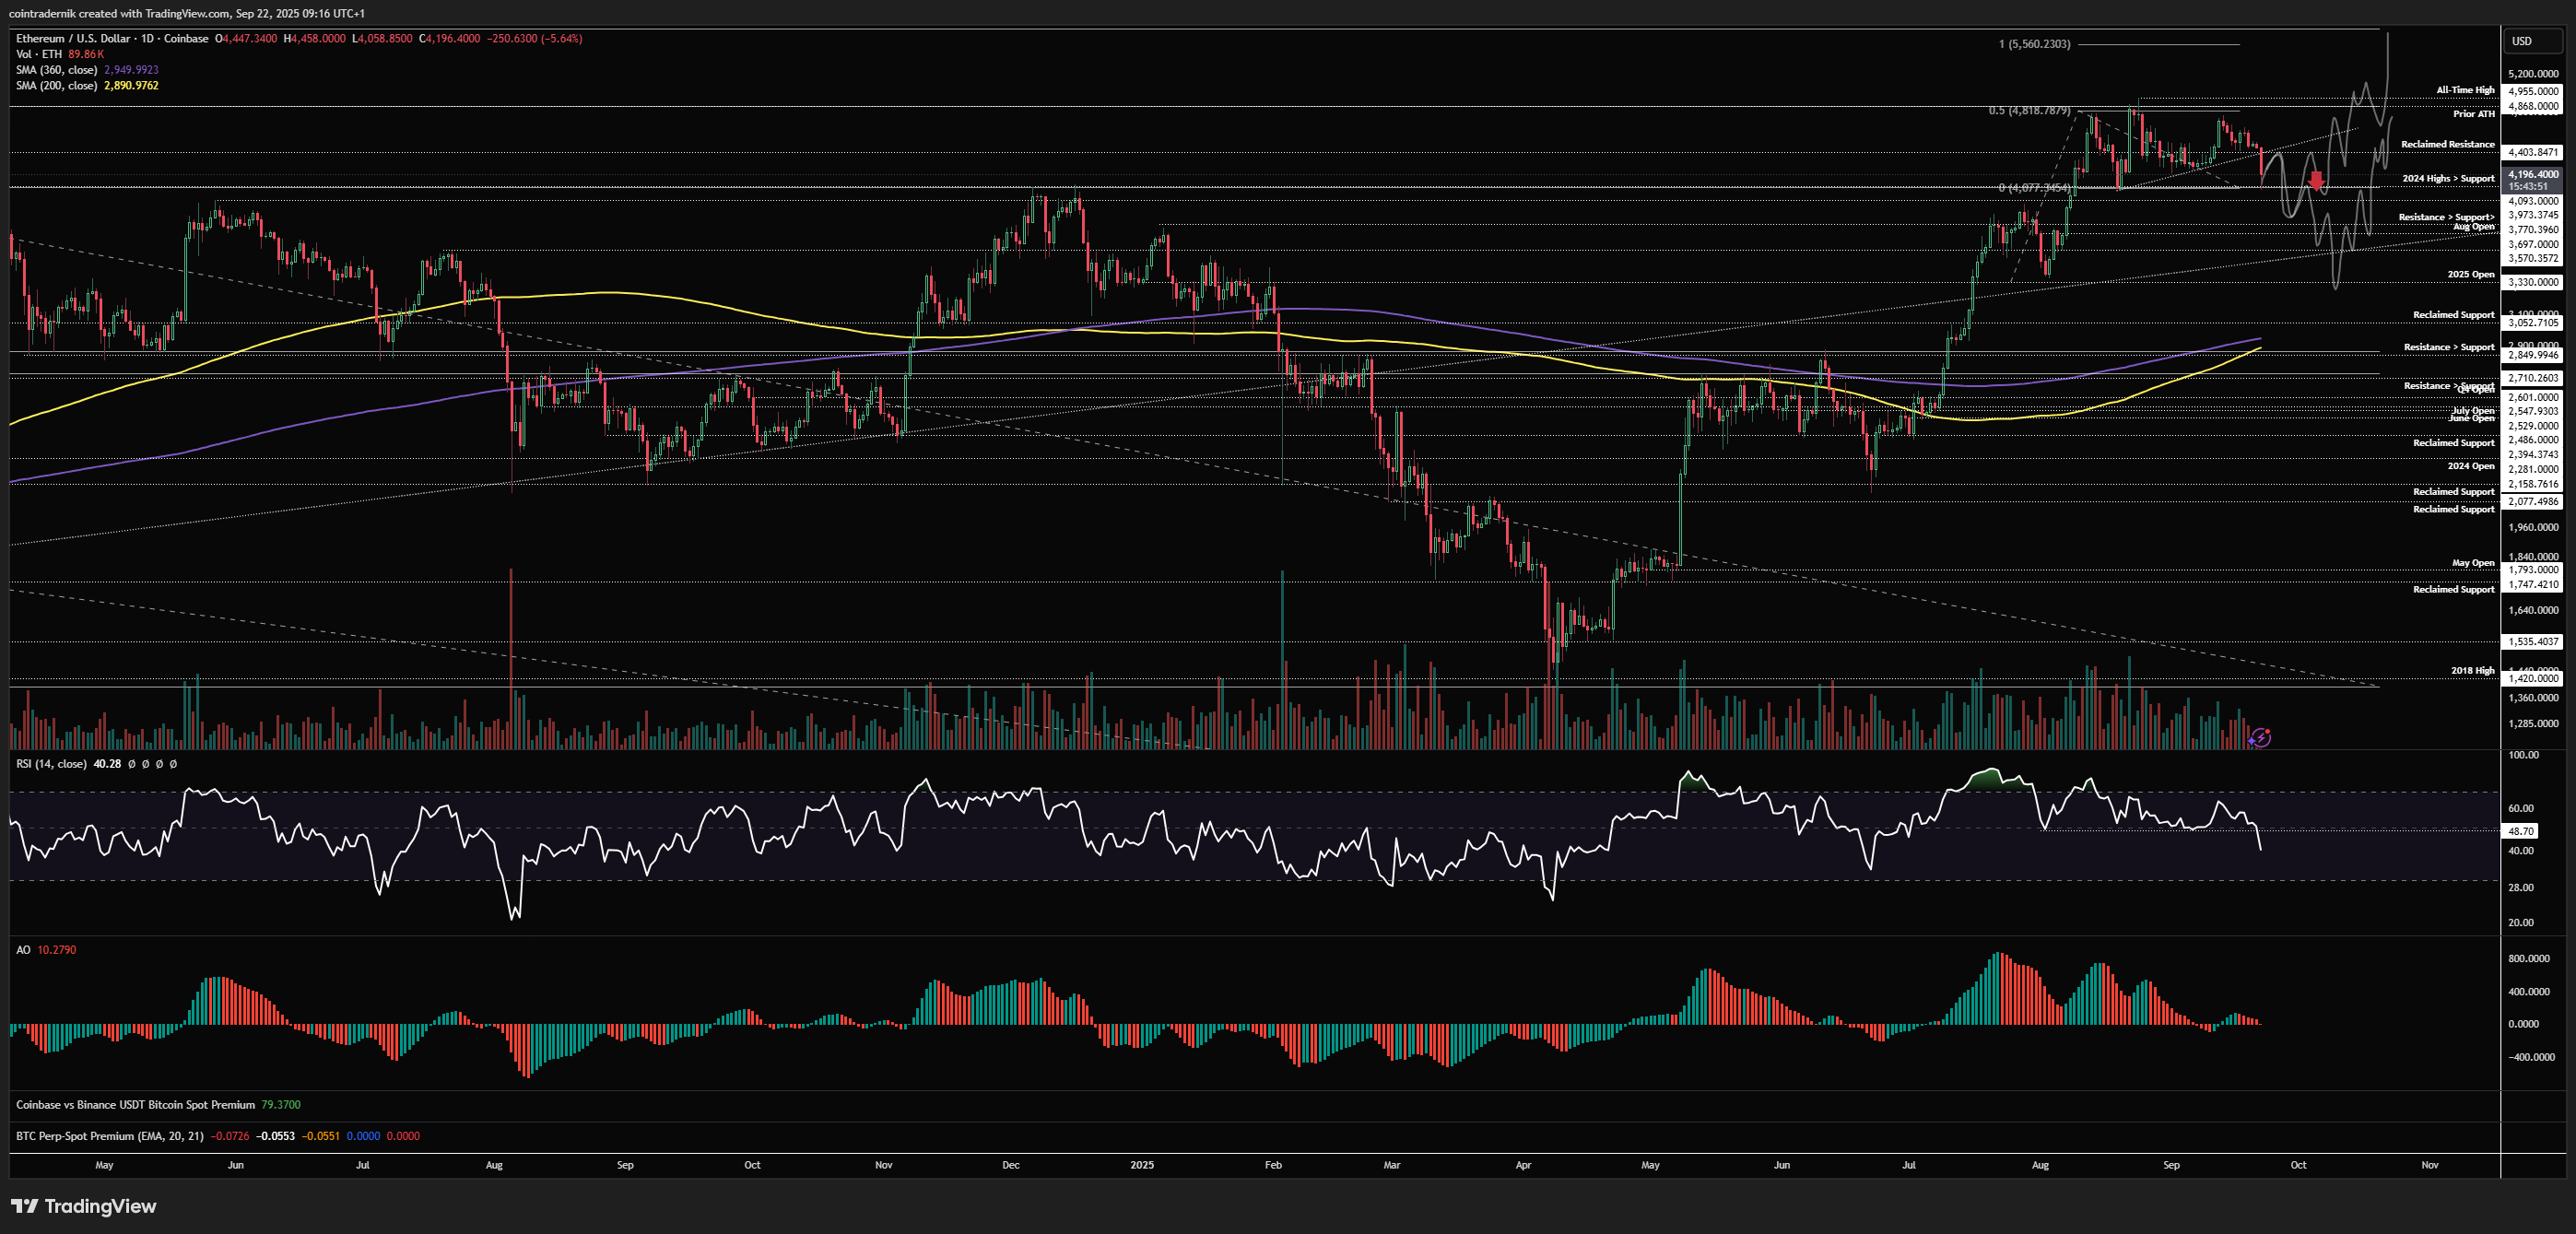
I have marked out these two potential trajecteroies from here, with $4090 being the clear line in the sand between the more brutal trap and the more bullish trap. If we wick below today's low into $3970 and then find demand, pushing back above $4090 from there as reclaimed support, that's a long back into the highs and beyond; conversely, if we accept below $4090 and retest it from below as resistance, we likely push lower from there into $3770, which will be the first opportunity for a higher-low formation, and if that fails I think it is going for the nuke of the yearly open low before v-reversal into November. The momentum breakdown on daily RSI is notable here, where demand stepping in this week with a reclaim of 50 on daily RSI would look bottom-y.
ETH/BTC
Weekly:
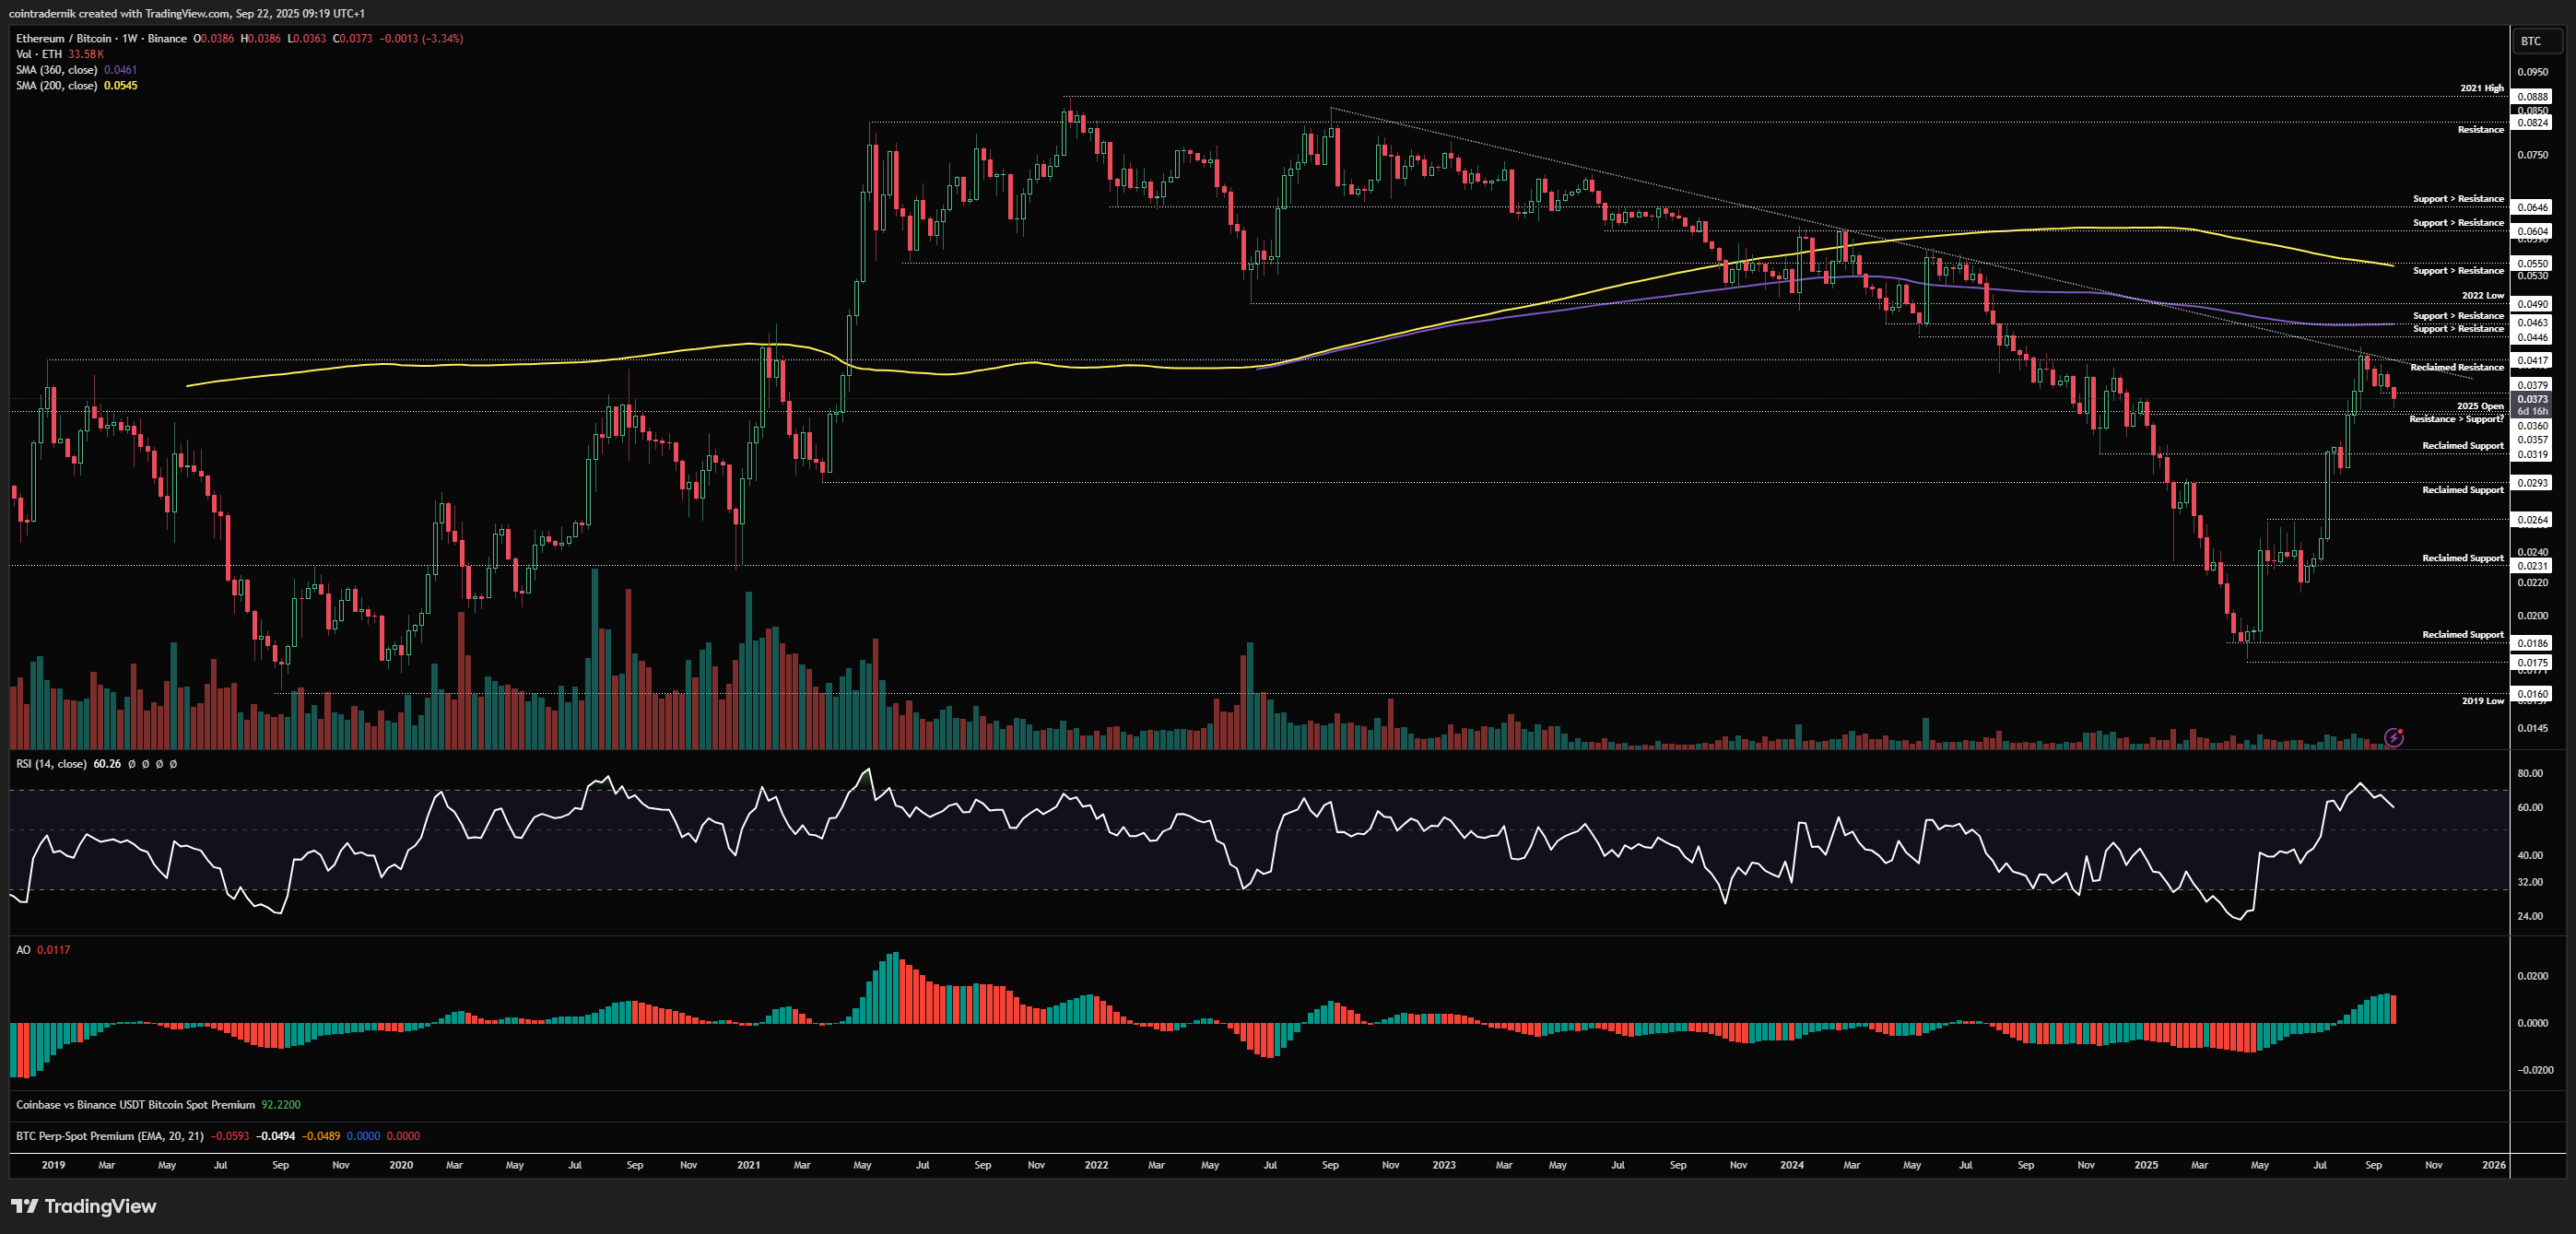
Not a huge amount has changed when looking at the weekly timeframe for ETH/BTC, as we have continuation of the retracement off of key resistance back into the yearly open as of this week, which is currently acting as support. I mentioned last week that if we broke 0.0379 we would likely take out that yearly open and form a higher-low above 0.032, which I think is the path we are now taking. I would look for a wick below 0.036 but above 0.032 in the next couple of weeks followed by a reclaim of the yearly open in early October as that higher-low formation before the next leg higher through trendline resistance and beyond. Zero reason to be more than short-term bearish here, in my view.
Daily:
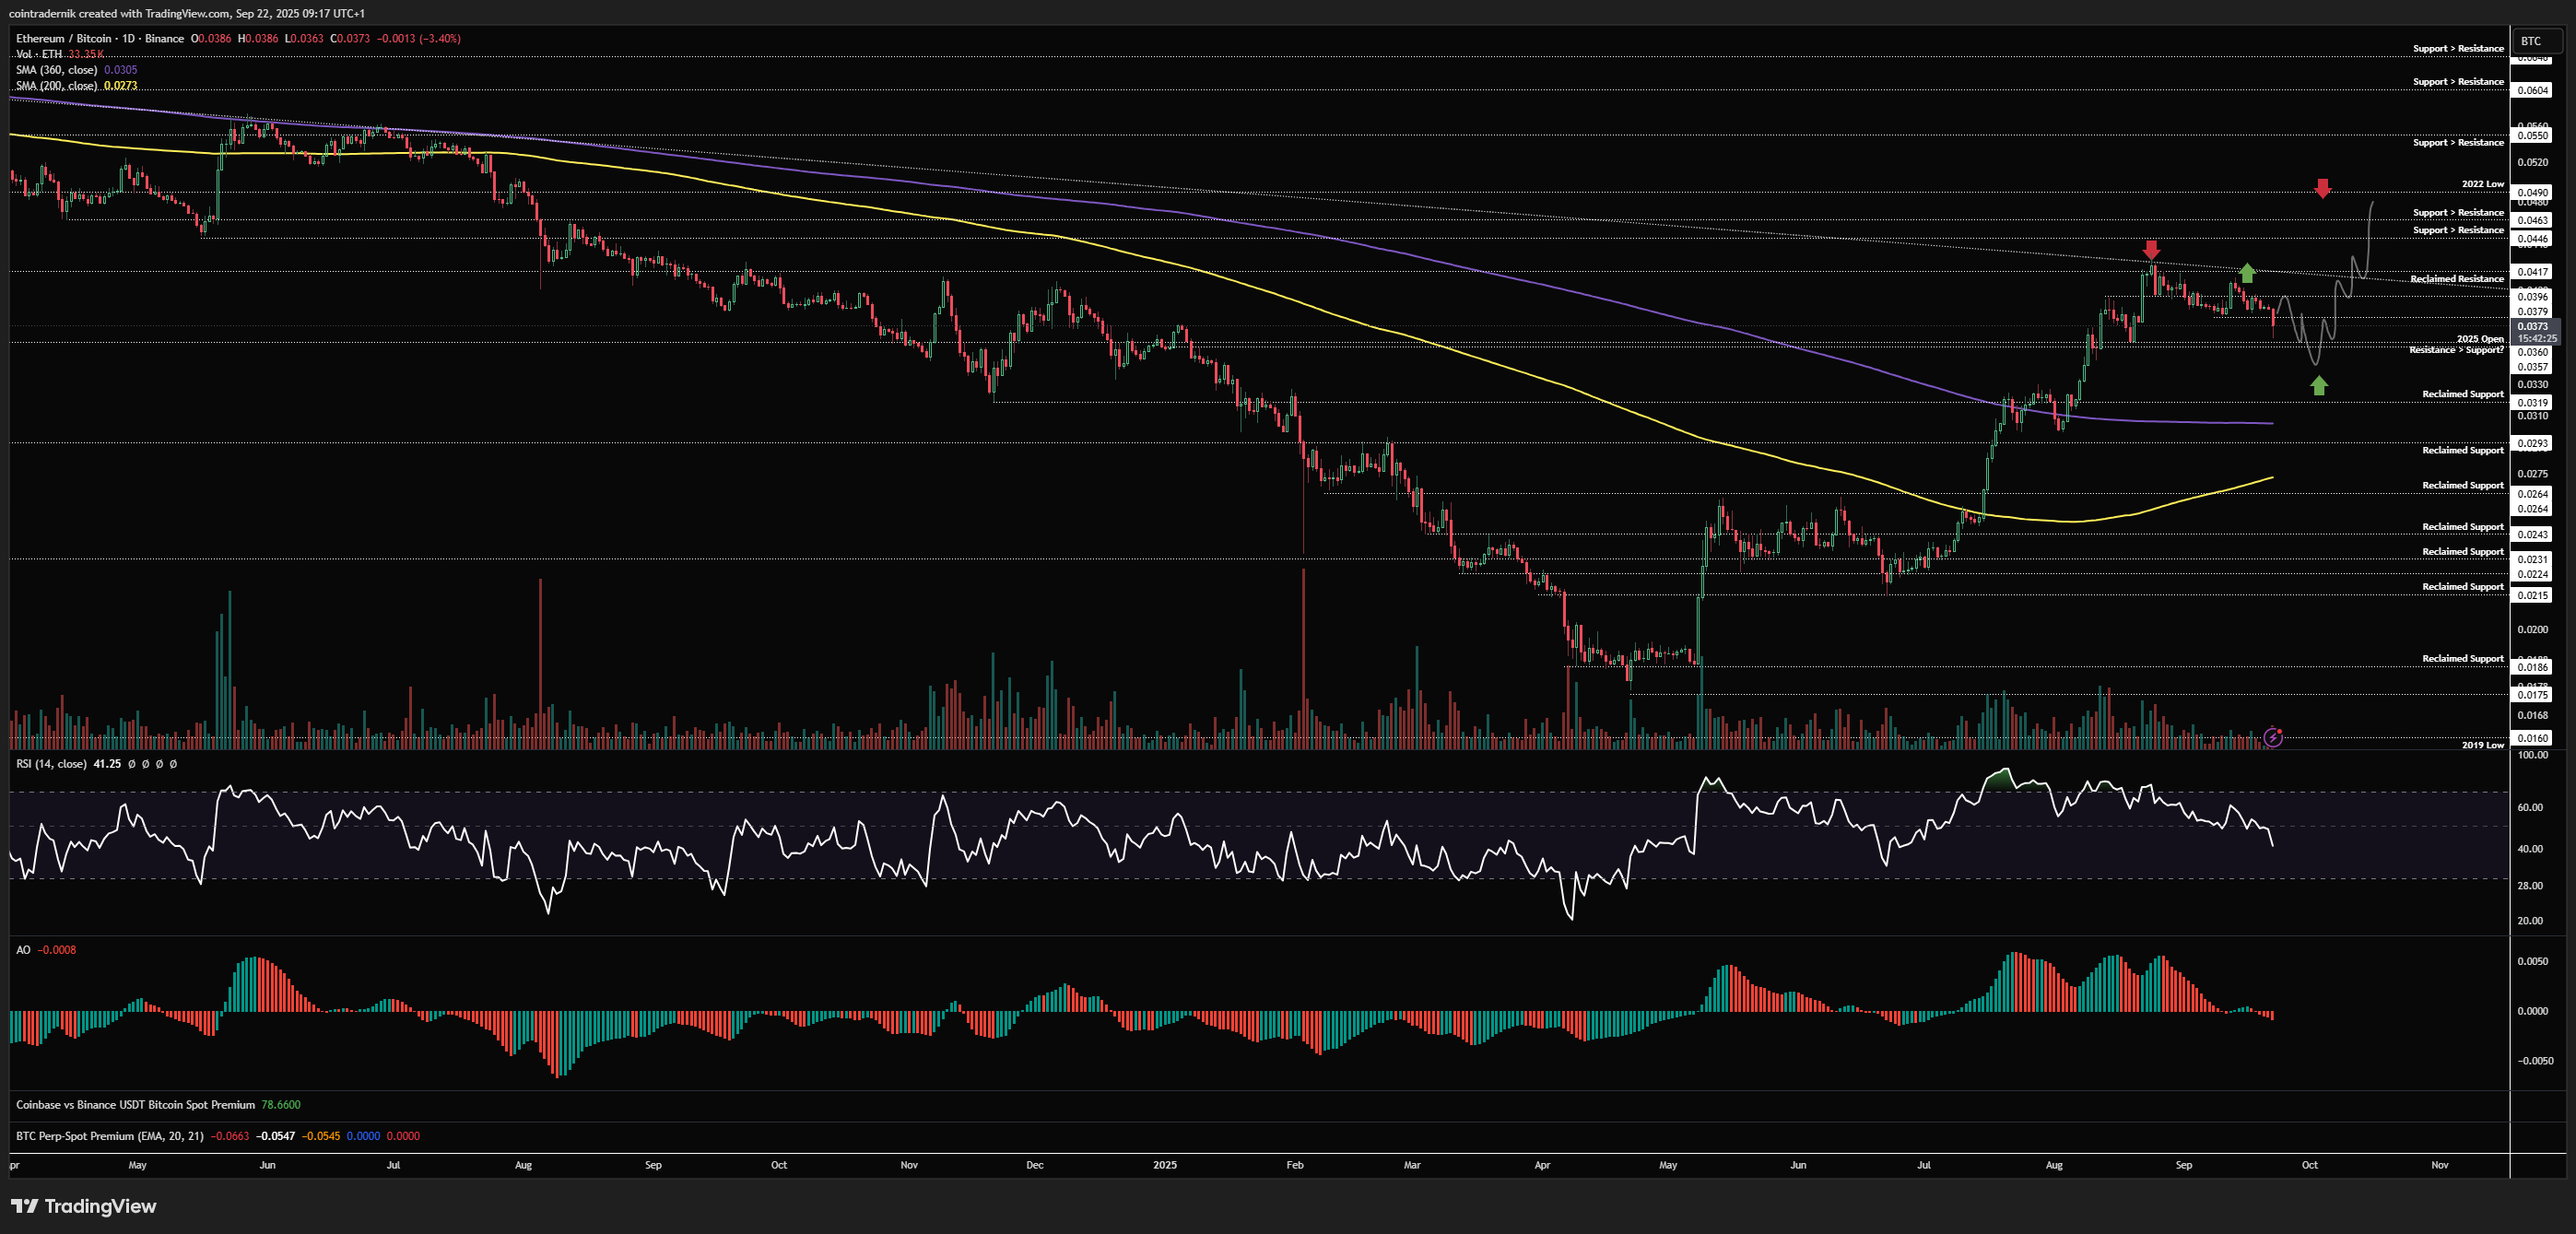
We can see on the daily that had we broken beyond 0.0417 on that push a couple of weeks ago, that would have opened up the swifter continuation of the rally into 0.049; instead, momentum was waning and then we rejected and broke lower, with price today breaking local support and retesting that yearly open. I think there's a good chance we bounce here but form a lower-high and then wick below 0.036 and mark out a low below that level somewhere in the first week of October before continuing higher through Q4. Signs that the low is already in would simply be a break and close above 0.0417 from here, where it is then very unlikely you get that move below the yearly open in early October, but rather a higher-low. Again, this could go as low as 0.032 and still look bullish on higher timeframes.
Receive the latest updates directly to your inbox

Price: $3718
Weekly:
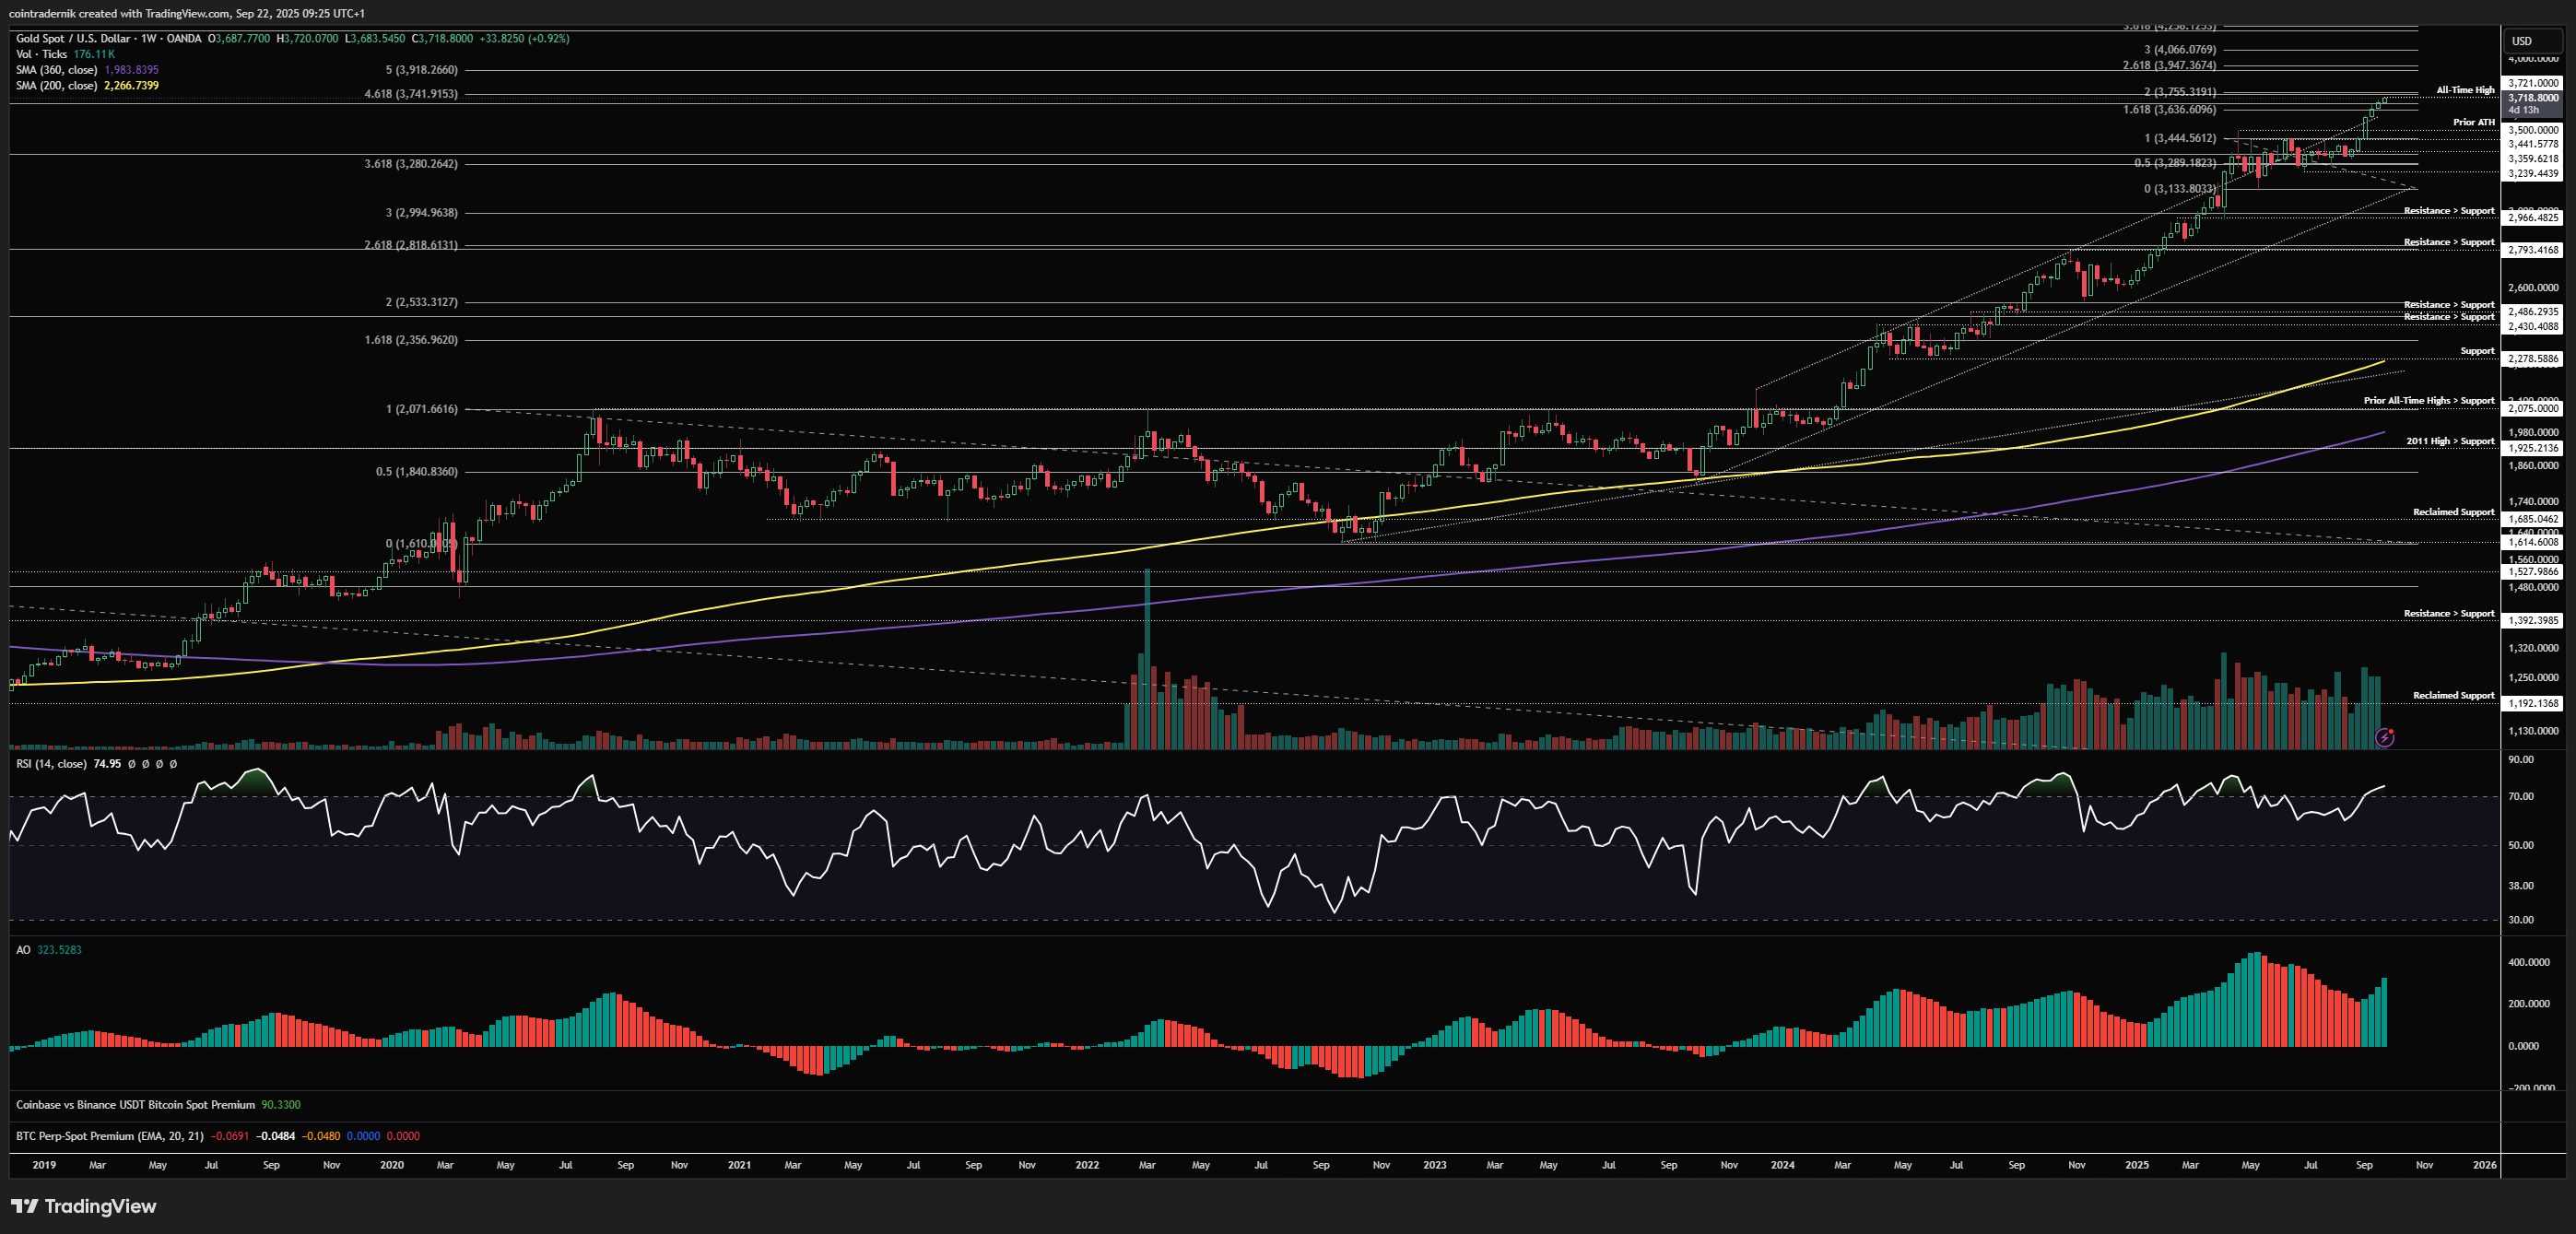
Beginning with the weekly for Gold, we can see that price continues to push higher, last week closing at the highs of $3687 and this week pushing beyond that into $3720 early this morning, with no fib resistance until about $3740-$3750. That said, I do think there is a chance we are coming towards a local top now on Gold given the confluence of fibs overhead, but I don't expect a significant pullback here but rather some consolidation around that area. If we accept above $3750 into the quarterly close, this is likely to overextend and continue the rally towards $3920, which is the next confluence of fibs overhead. Not much else to add here and no signs of higher timeframe exhaustion as of yet.
Daily:

We can see on the daily that price basically perfectly played out the grind higher from a couple of weeks ago that I had marked out, with the expectation that we tag this $3740-$3750 range. We are right below it now and I do think we push up into that cluster some time this week, where if we see some daily bearish divergence and then a lower timeframe breakdown the probability of a local top becomes quite high. Regardless, dips are for buying and if we sweep $3636 towards $3500 in October I think that's an opportunity to get long for the next leg higher towards the big $4000 area.
Price: $4.66
Weekly:
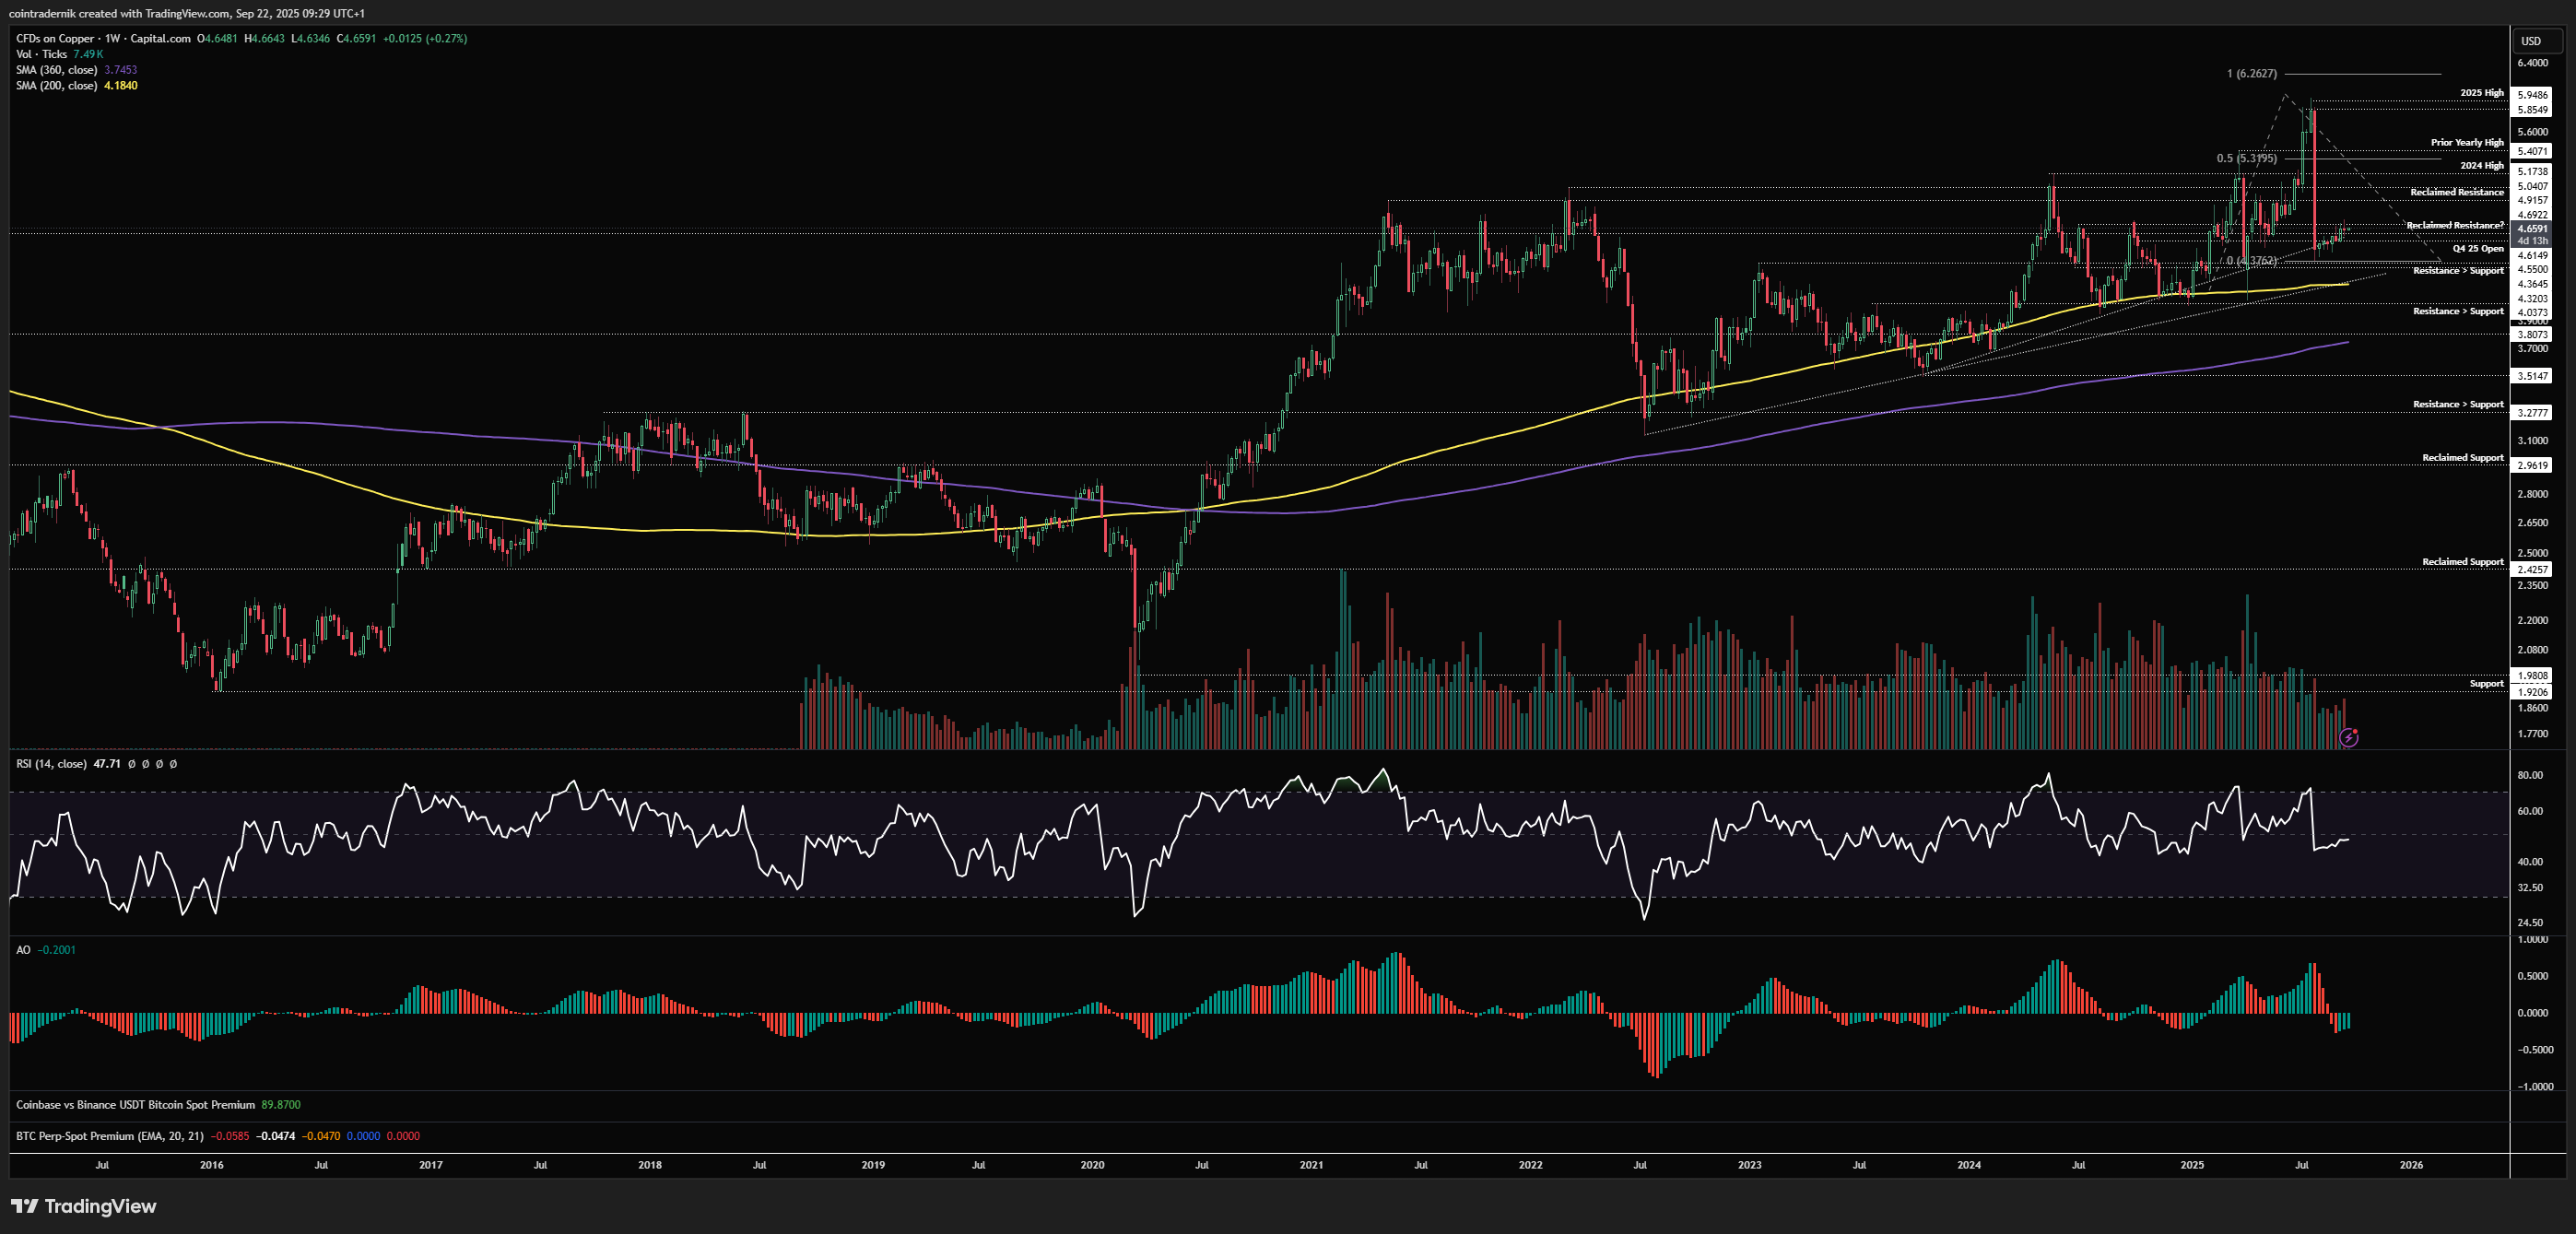
Beginning with the weekly view for Copper, we can see that price has just been consolidating but grinding higher within the broader uptrend after the second tariff liquidation event, with price making higher lows above the Q4 2024 open and above the 200wMA and trendline support, but failing to really build any momentum as of yet. What has not changed is that we remain in that long-term uptrend despite all of the volatility and whilst price is above $4.18 (the 200wMA and lower trendline) I fully expect another leg higher to follow for Copper, particularly given my expectation of inflation and growth moving higher through Q4. We are now sat right at reclaim resistance around $4.69 and if we can close the weekly above this level, it opens up a move higher towards $4.90, which has been major resistance. Acceptance back above $4.90 = resumption of the trend higher in my view, with $6.26 as the next fib target beyond the 2025 highs. I have not yet looked for a long entry as I will explain on the daily timeframe...
Daily:

Looking at the daily, we can see price has been in this channel trending higher but with no real momentum in either direction, basically sandwiched below the 200dMA but building higher-low. I want to see a sharp rally out of this channel indicating re-accumulation is over before really jumping in here, as we could just grind marginally higher but basically sidewards for a while yet if not. If we get that sharp push through the 200dMA into $4.90, I would look to bid a pull-back off that level back towards the 200dMA with invalidation at $4.36, looking for 2025 highs to be taken out. Alternatively, if we wick below this channel and take out a lot of local lows into $4.36, I would bid that with invalidation at $4.18. Until then, I am sidelined.
Price: $62.66
Weekly:
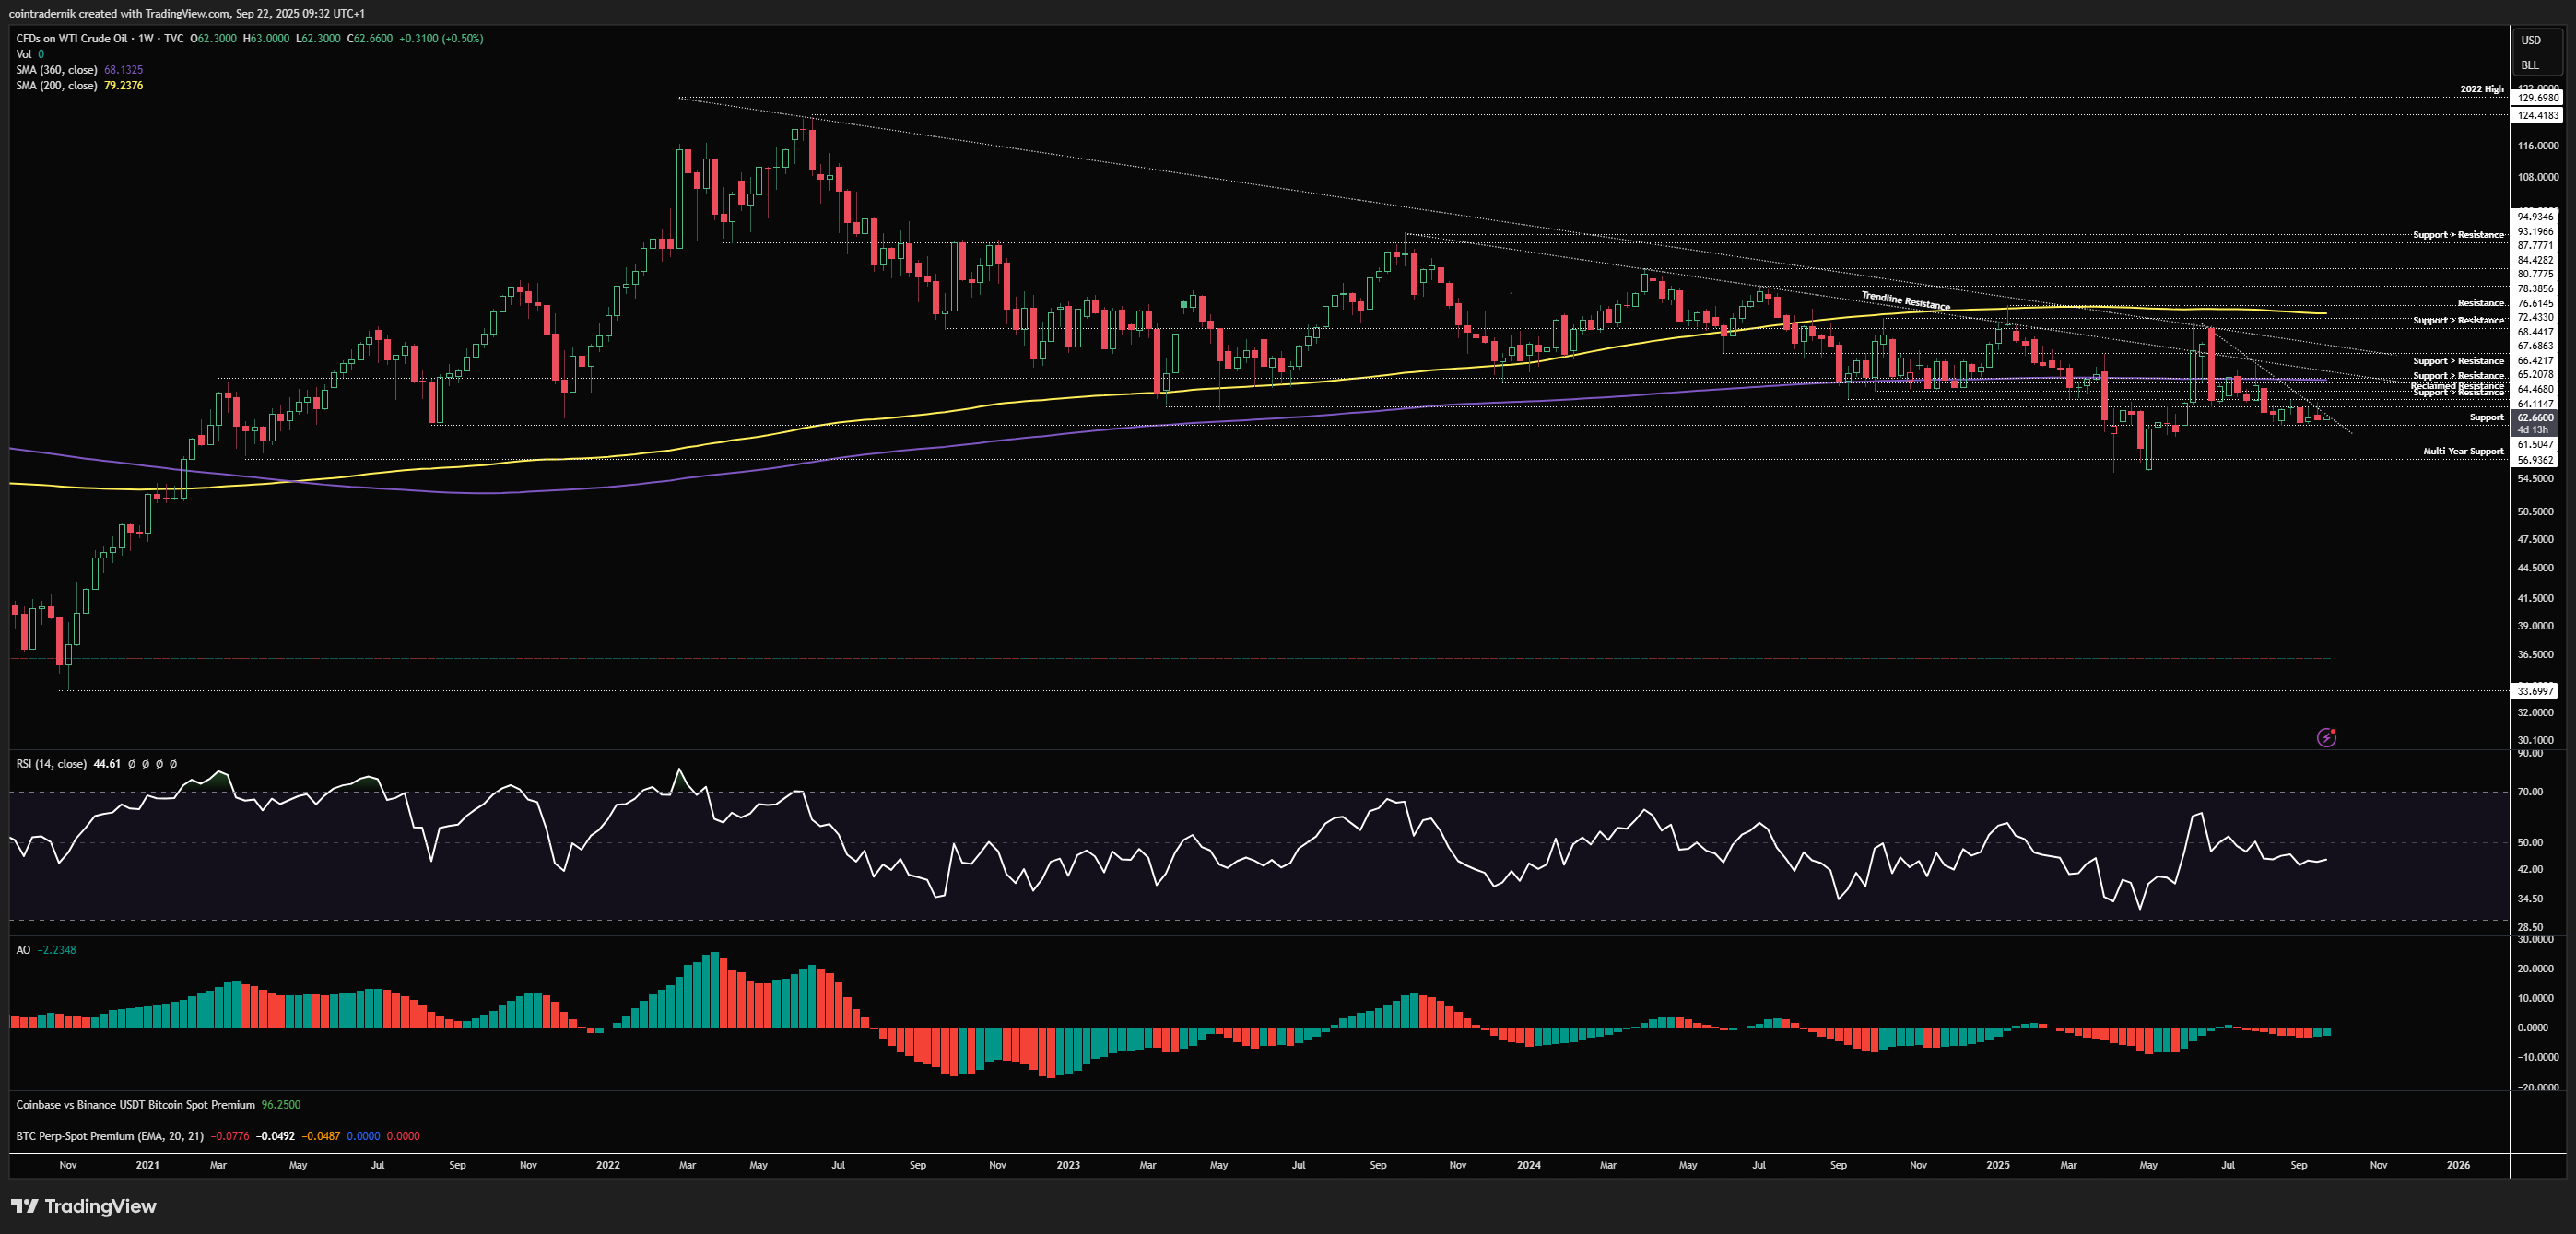
Beginning with the weekly for Crude Oil, we can see that price wicked above the trendline last week right into overhead resistance and rejected, closing back below trendline resistance but marginally above multi-week support at $61.50. If we now see this support give way, we should trade lower towards multi-year support at $57, where I would expect demand to step in. If, instead, we now push higher off this level and close back above last week's high, that's a pretty nasty bear trap and I would expect to see price travel towards the lower trendline and 360wMA and $68.
Daily:
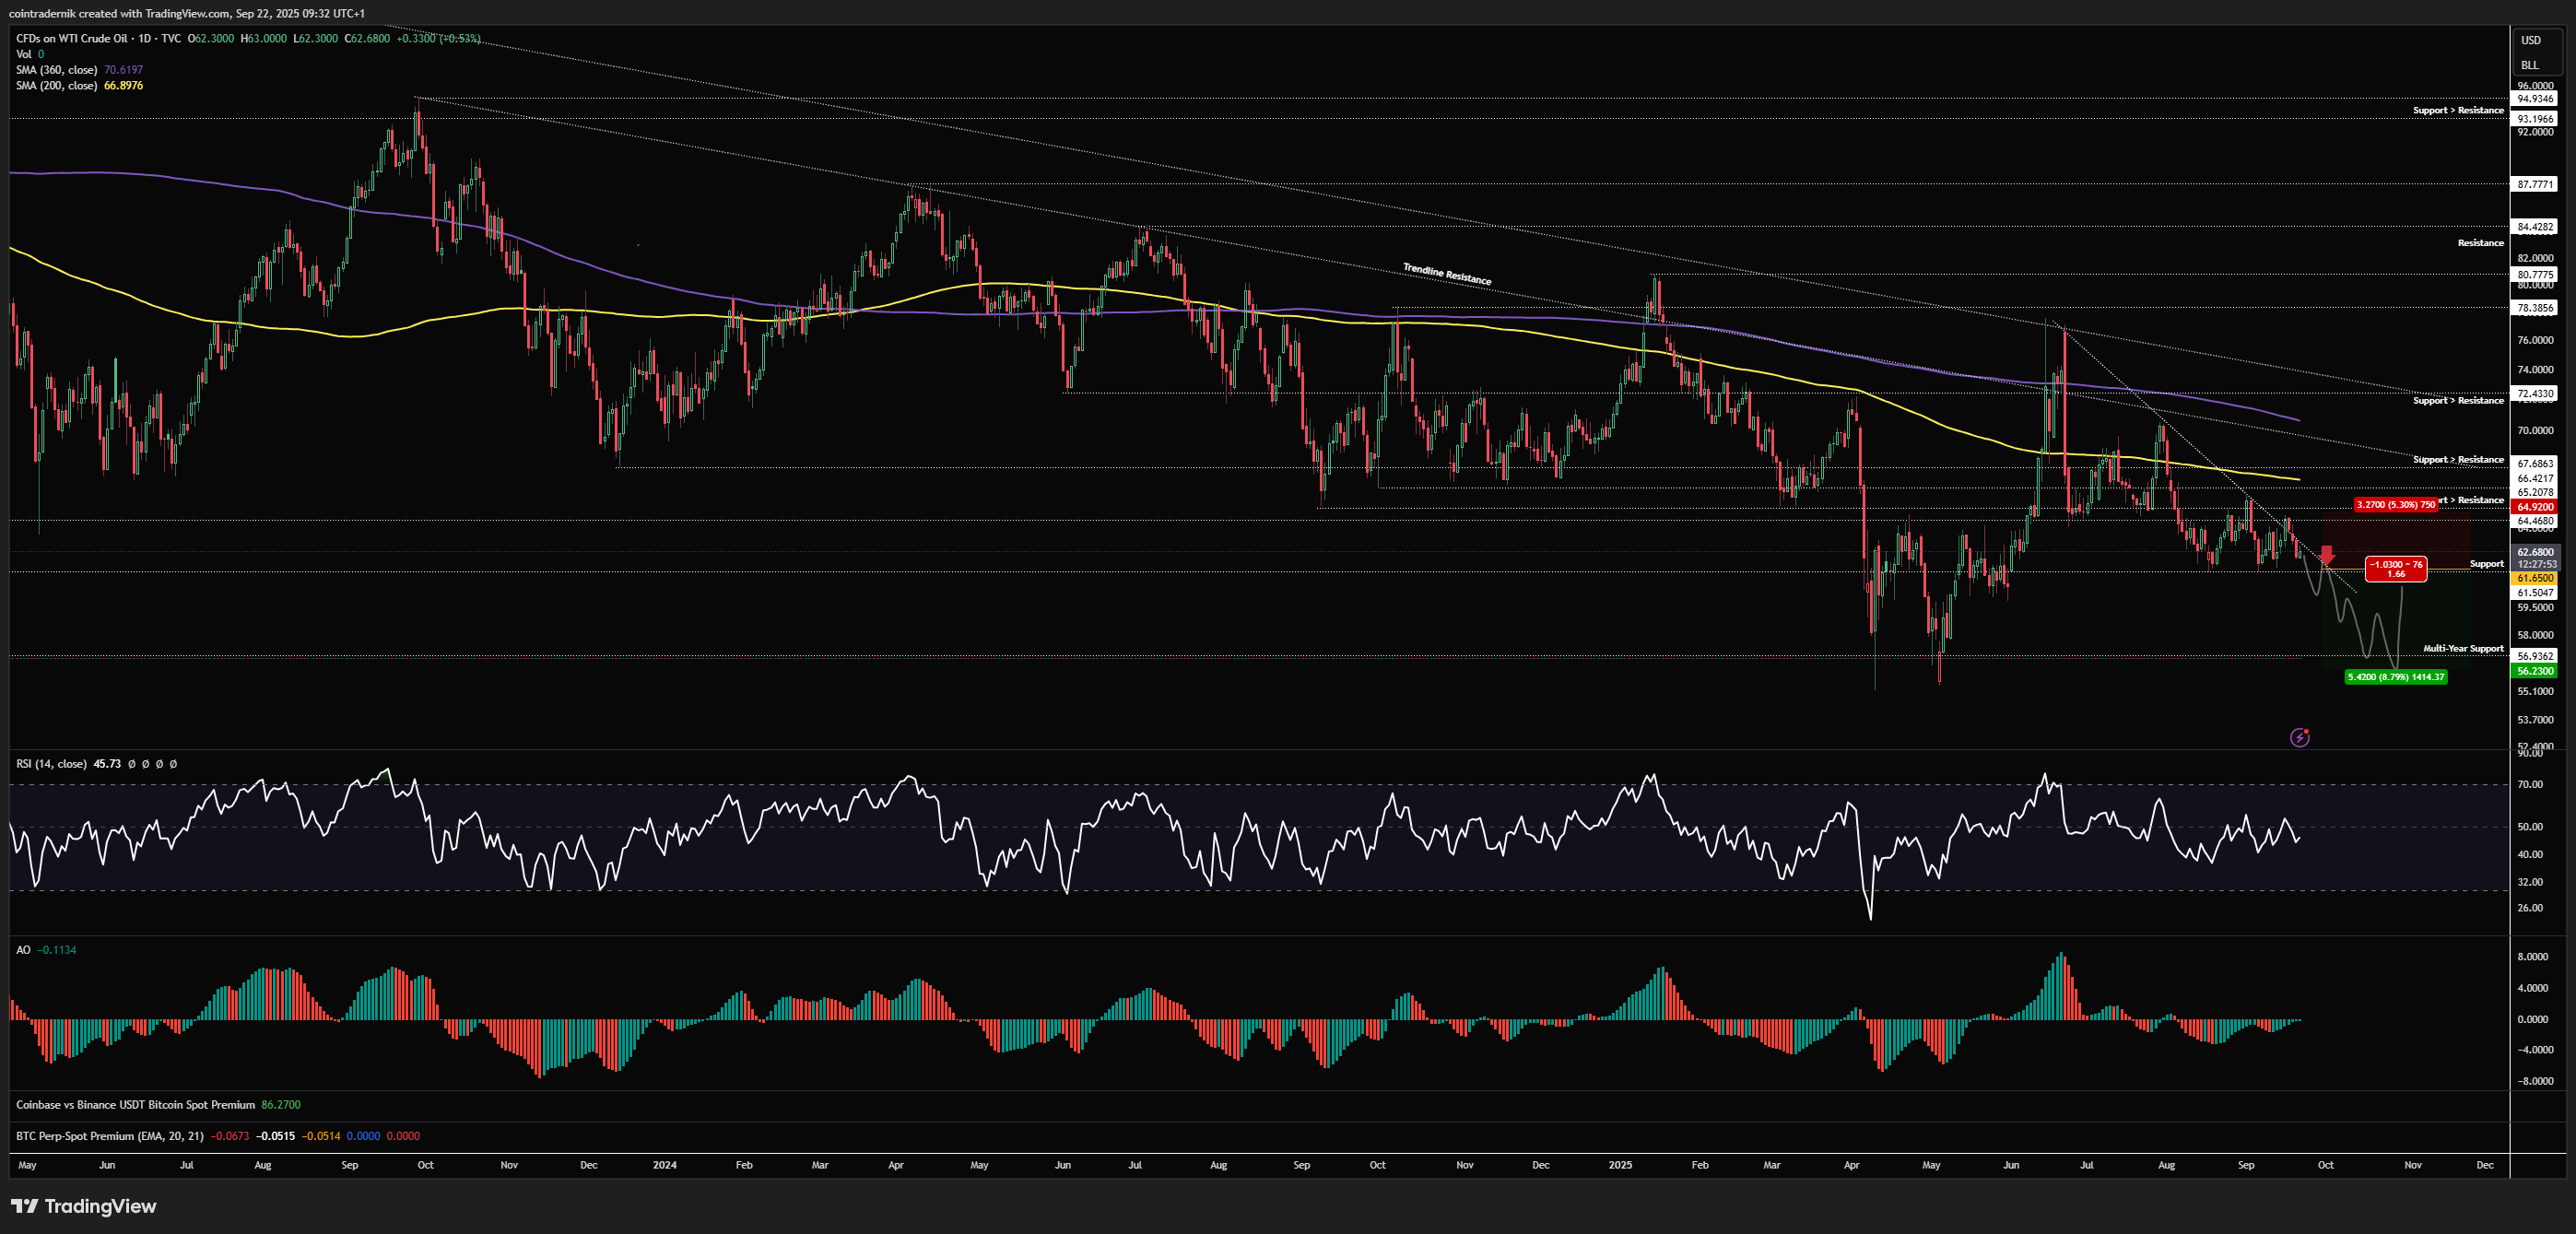
Looking at the daily, we can see this all a lot more clearly, with a fakeout above the trendline ofllowed by rejection, where if we now flip $61.50 into resistance we could look for shorts towards $57 with very clean invalidation above last week's high; conversely, we now also have a long setup if we break higher from here and close above $64.60, where I would long that breakout as a confirmed bear trap with invalidation at $61.50 and targetting $68. Pretty clean structure here, which is always nice. Short-term trajectory of Oil is also key for financial conditions; lose $61.50 and push towards $57 and things get a little looser across the board...
I hope you've found some value in the read this week!
And if you've not already signed up for Ostium, please do so and test out some of the recent updates, including:
Sign up here (you don't have to use my ref link, of course): https://ostium.app/trade?from=CL&to=USD&ref=CTNIK

.avif)