

Market Outlook #49
September 1, 2025
-
12
min read


This blog references an opinion and is for entertainment and informational purposes only. It is not intended to be investment advice. Seek a duly licensed professional for investment advice.
In this 49th Market Outlook here at Ostium Research, we'll be taking a look at the week ahead in markets, focusing specifically on price-action, positioning and event risk for Bitcoin, Ethereum, DXY and altcoins via OTHERS.
Firstly, let's take a look at the calendar for the busy week ahead:
MONDAY: ECB PRESIDENT LAGARDE SPEECH
TUESDAY: US ISM MANUFACTURING PMI (AUG): (CONSENSUS 48.6 VS PREVIOUS 48)
WEDNESDAY: US JOLTS JOB OPENINGS (JUL): (CONSENSUS 7.5M VS PREVIOUS 7.437M)
WEDNESDAY: FED'S BEIGE BOOK
THURSDAY: US INITIAL JOBLESS CLAIMS: (CONSENSUS 232K VS PREVIOUS 229K)
THURSDAY: US ADP EMPLOYMENT CHANGE (AUG): (CONSENSUS 72K VS PREVIOUS 104K)
THURSDAY: US ISM SERVICES PMI (AUG): (CONSENSUS 50.5 VS PREVIOUS 50.1)
FRIDAY: US NONFARM PAYROLLS (AUG): (CONSENSUS 78K VS PREVIOUS 73K)
Now, let's dig into asset-specific price-action for the week ahead, looking firstly at Bitcoin:
Price: $108,017
Monthly:
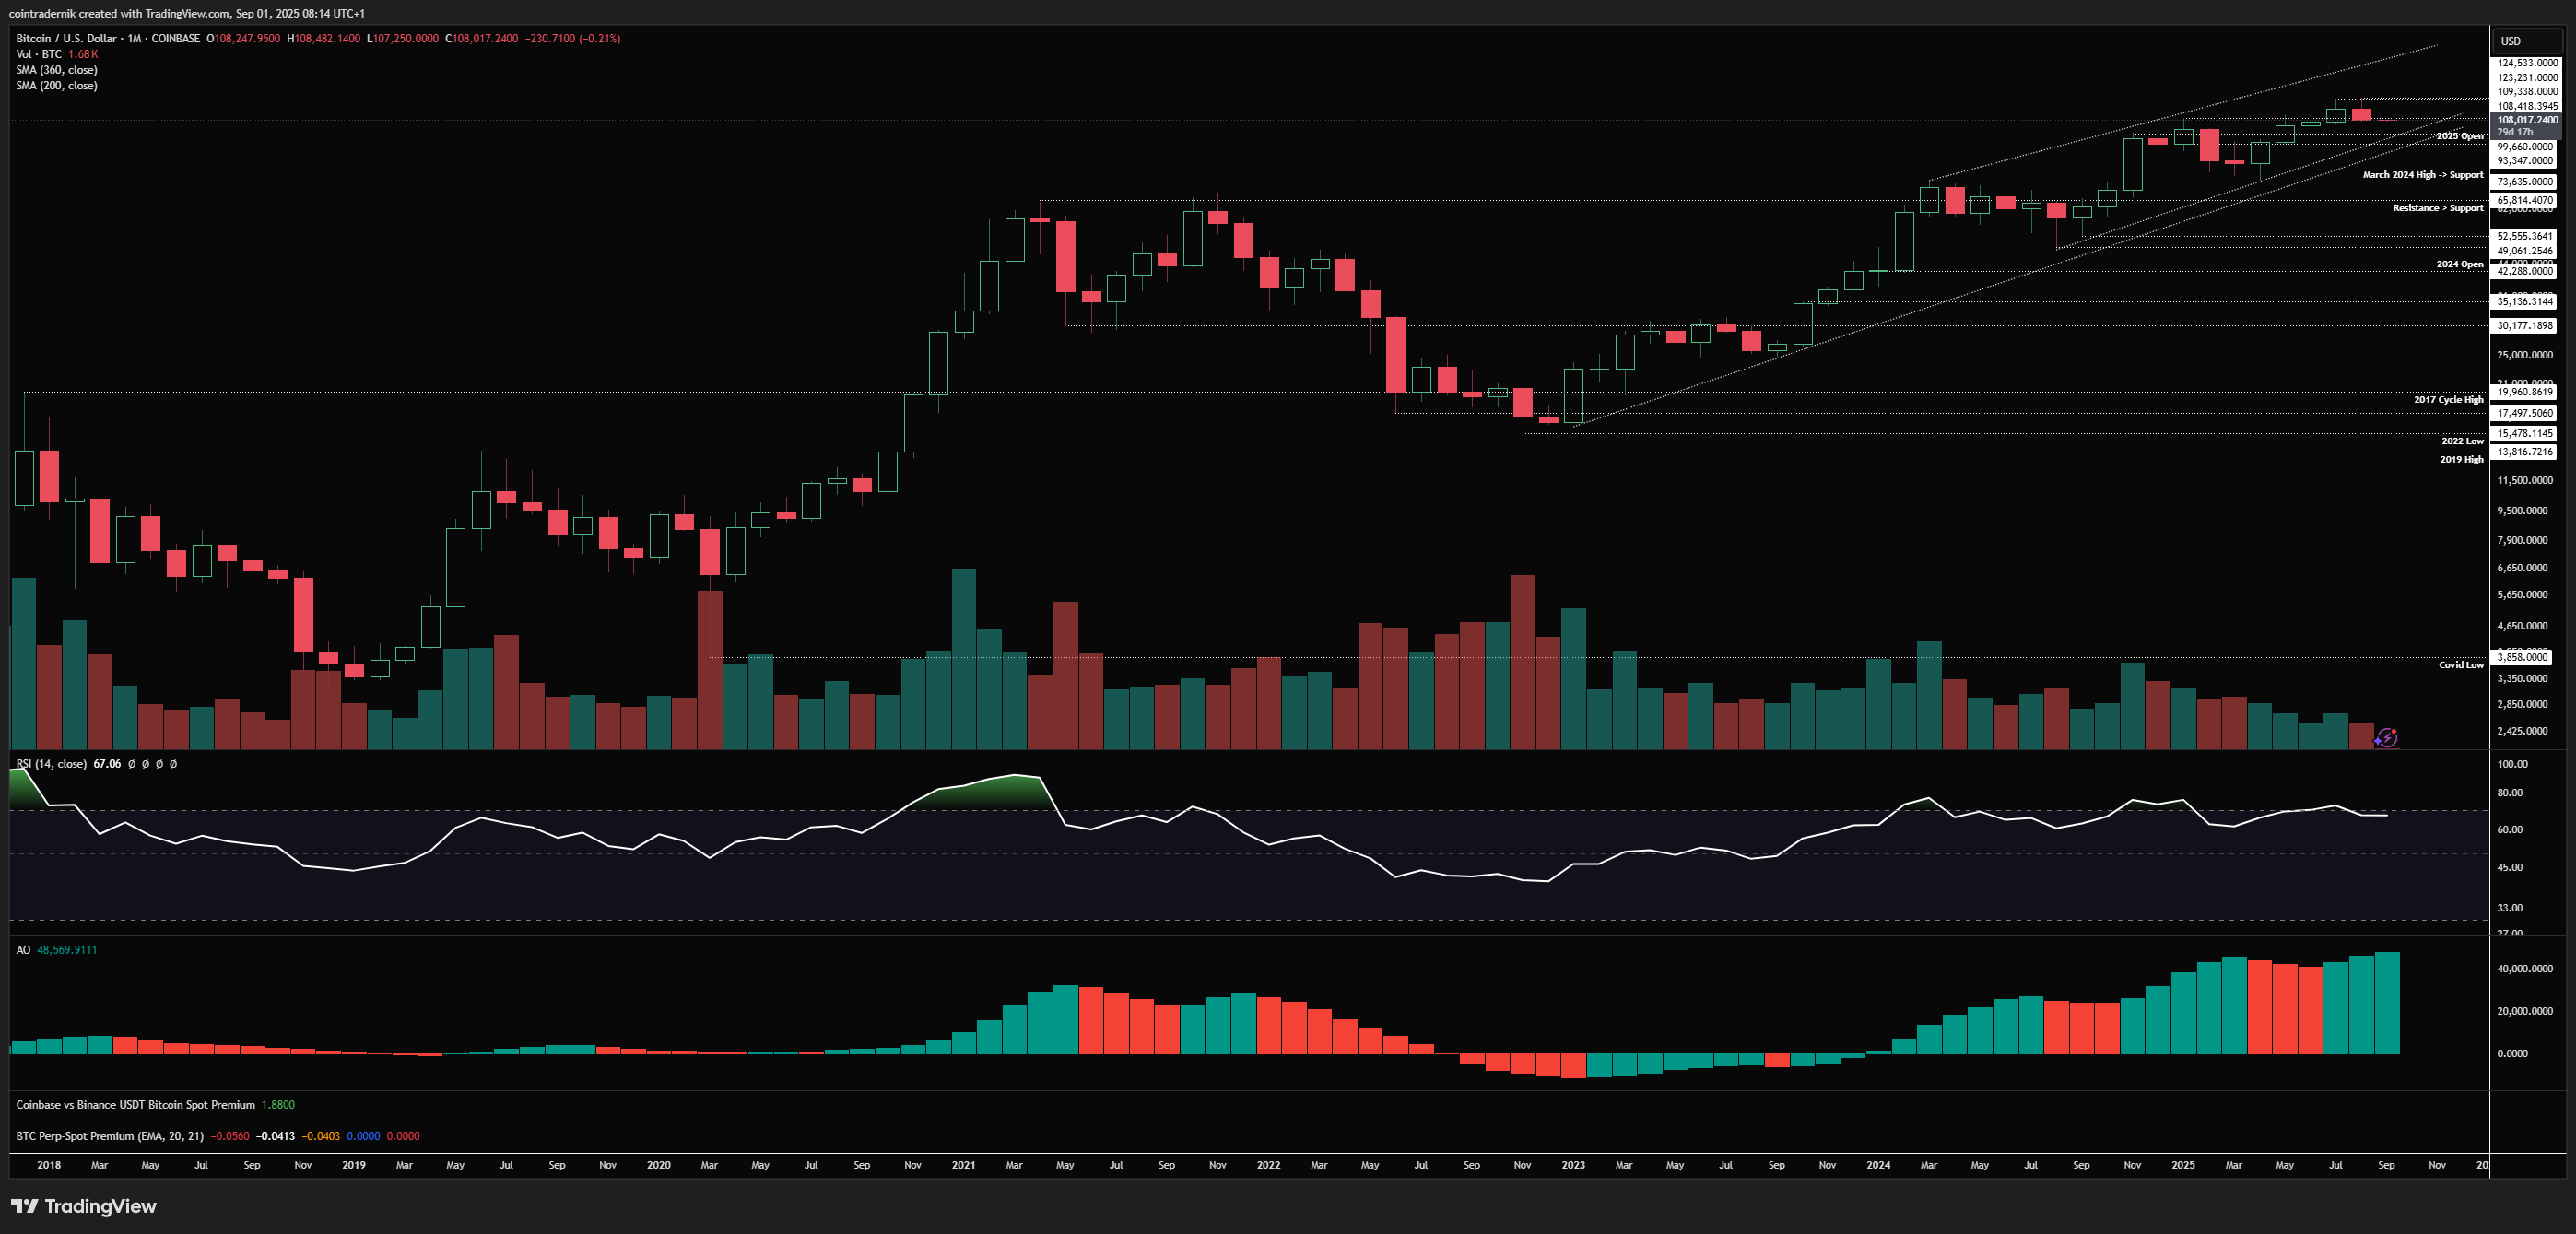
Beginning with the monthly view for BTC, we can see that August closed firmly red, wicking through all-time highs into $124.5k before selling off into the August close at $108.2k, right around prior resistance turned support and marginally above the July lows. We remain firmly above long-term trendline support and monthly structure is still very much bullish here, but as many have noted there is some momentum divergence forming on RSI. For me, I prefer to see confluence between RSI and AO to be confident in betting against the trend, and AO has continued to point towards building momentum throughout the uptrend. When we couple this with the macro backdrop, I do not think this is even remotely similar to the 2021 top formation. If September now closes below the 2025 open at $93.3k and therefore below local trendline support, we have a much stronger picture for the bears; until then I do not see much here that supports the view that a durable multi-month top is in. For the bulls, you want to see price find support in September above the yearly open, but likely much higher around the July lows at $105k, and to then close green, ideally above the August open at $115k. If we see that, I think that sets us up for expansion beyond the highs in October.
Weekly:
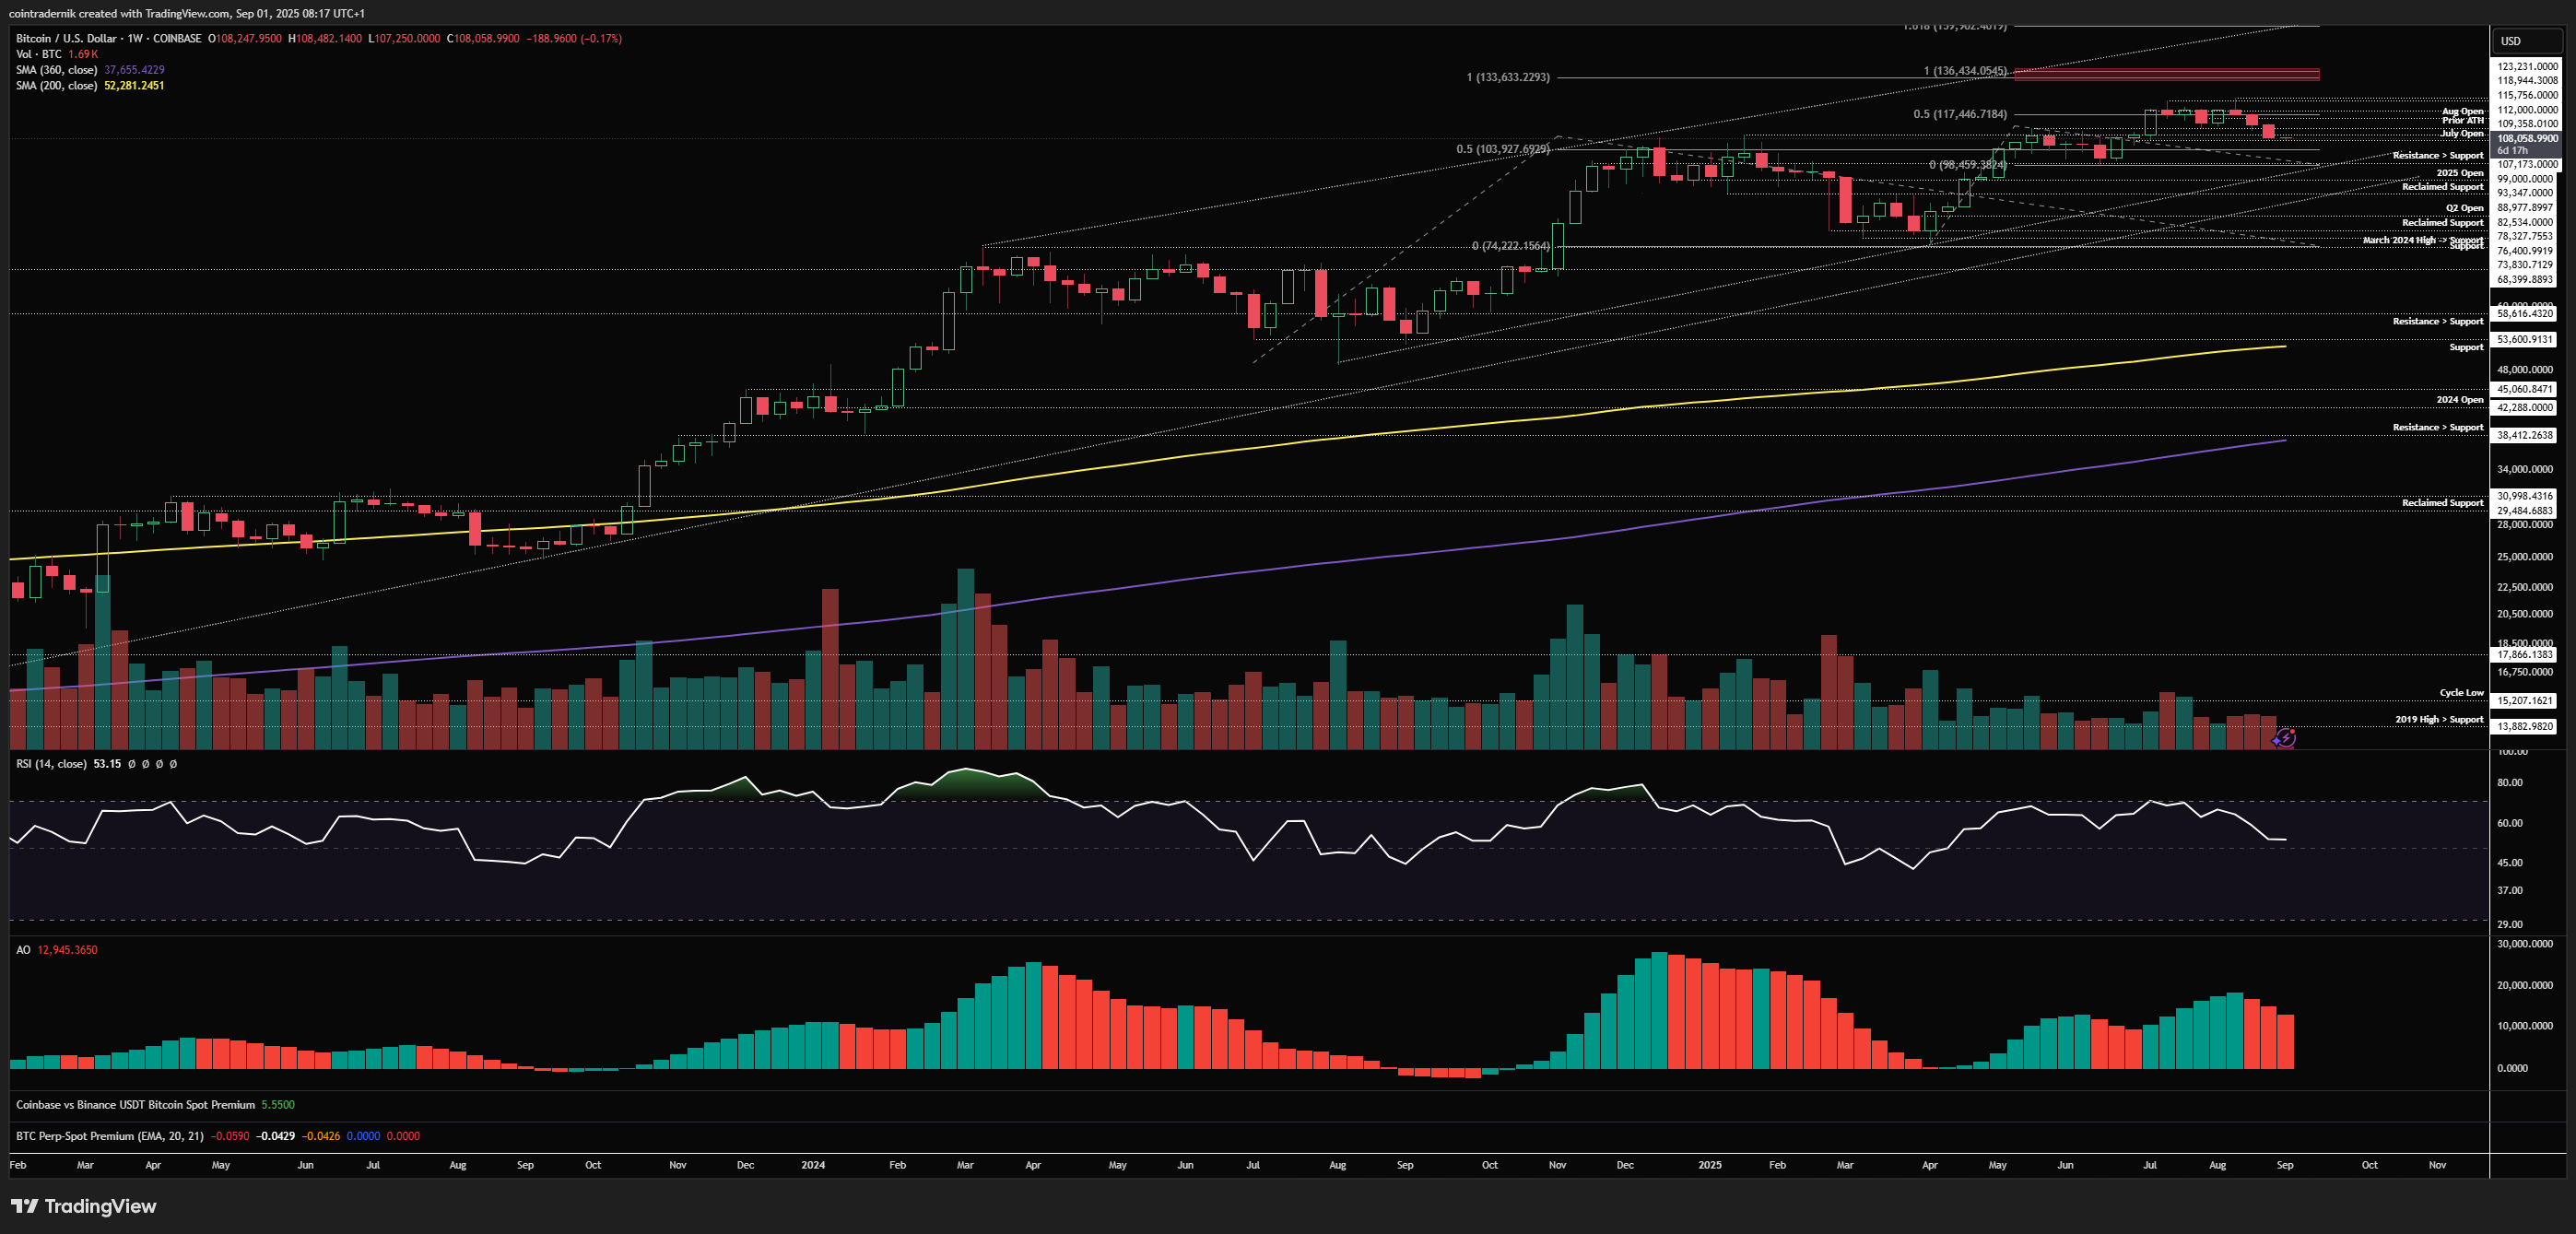
Looking at the weekly, we can see that weekly momentum showed no exhaustion on the move higher but has now reset towards 50 on weekly RSI, with both momentum and market structure here supportive of trend continuation, not the beginning of a longer-term downtrend. Closing below $98k on this timeframe would turn weekly structure bearish, so this is something to keep an eye on, particularly given the confluence of support around that area. My expectation here is simply that we form a higher-low within this uptrend above that June low in early September and make our way higher again into month-end. This area right around the July open is what I had in mind for a higher-low several weeks ago, but admittedly post-Jackson Hole did no longer expect to be tagged. Now that we are in this area, we should see lower timeframe exhaustion of this move and a more sustained spot bid step in, which will validate the higher-low scenario. If we do mark out that swing-low here into next week, I think a weekly close back above $112k leads to a retest of the August open and potentially $117.5k into FOMC with a retest of the highs before month-end. To reiterate, above $98k weekly structure is still bullish and therefore we should anticipate the formation of a higher-low.
Daily:
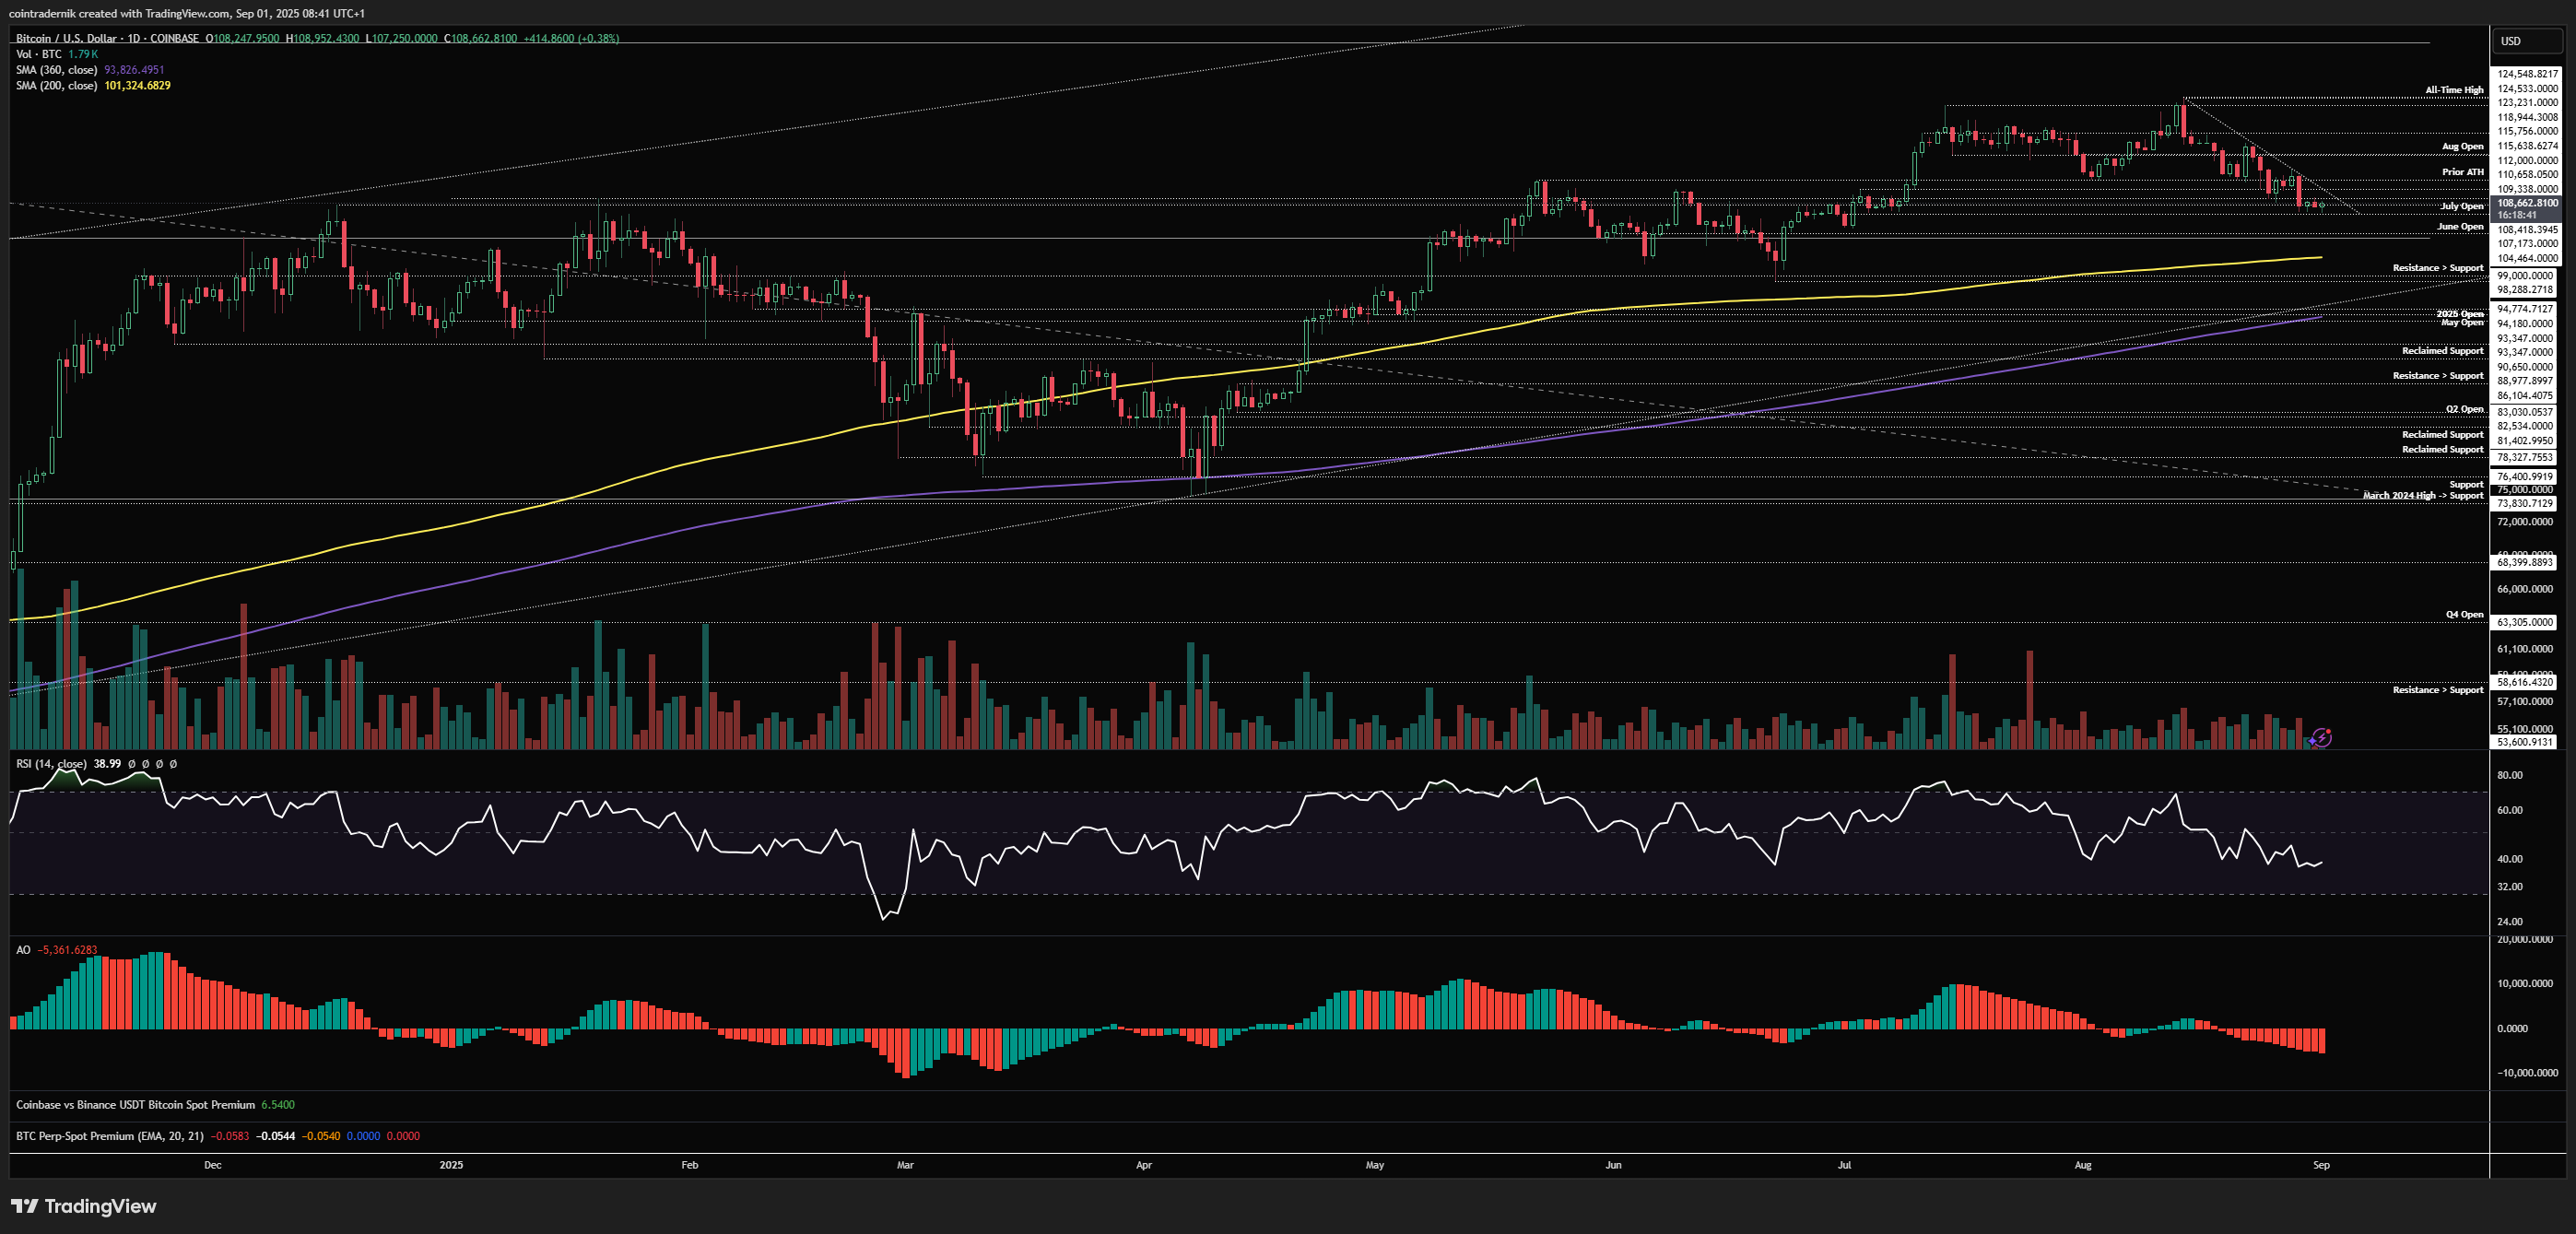
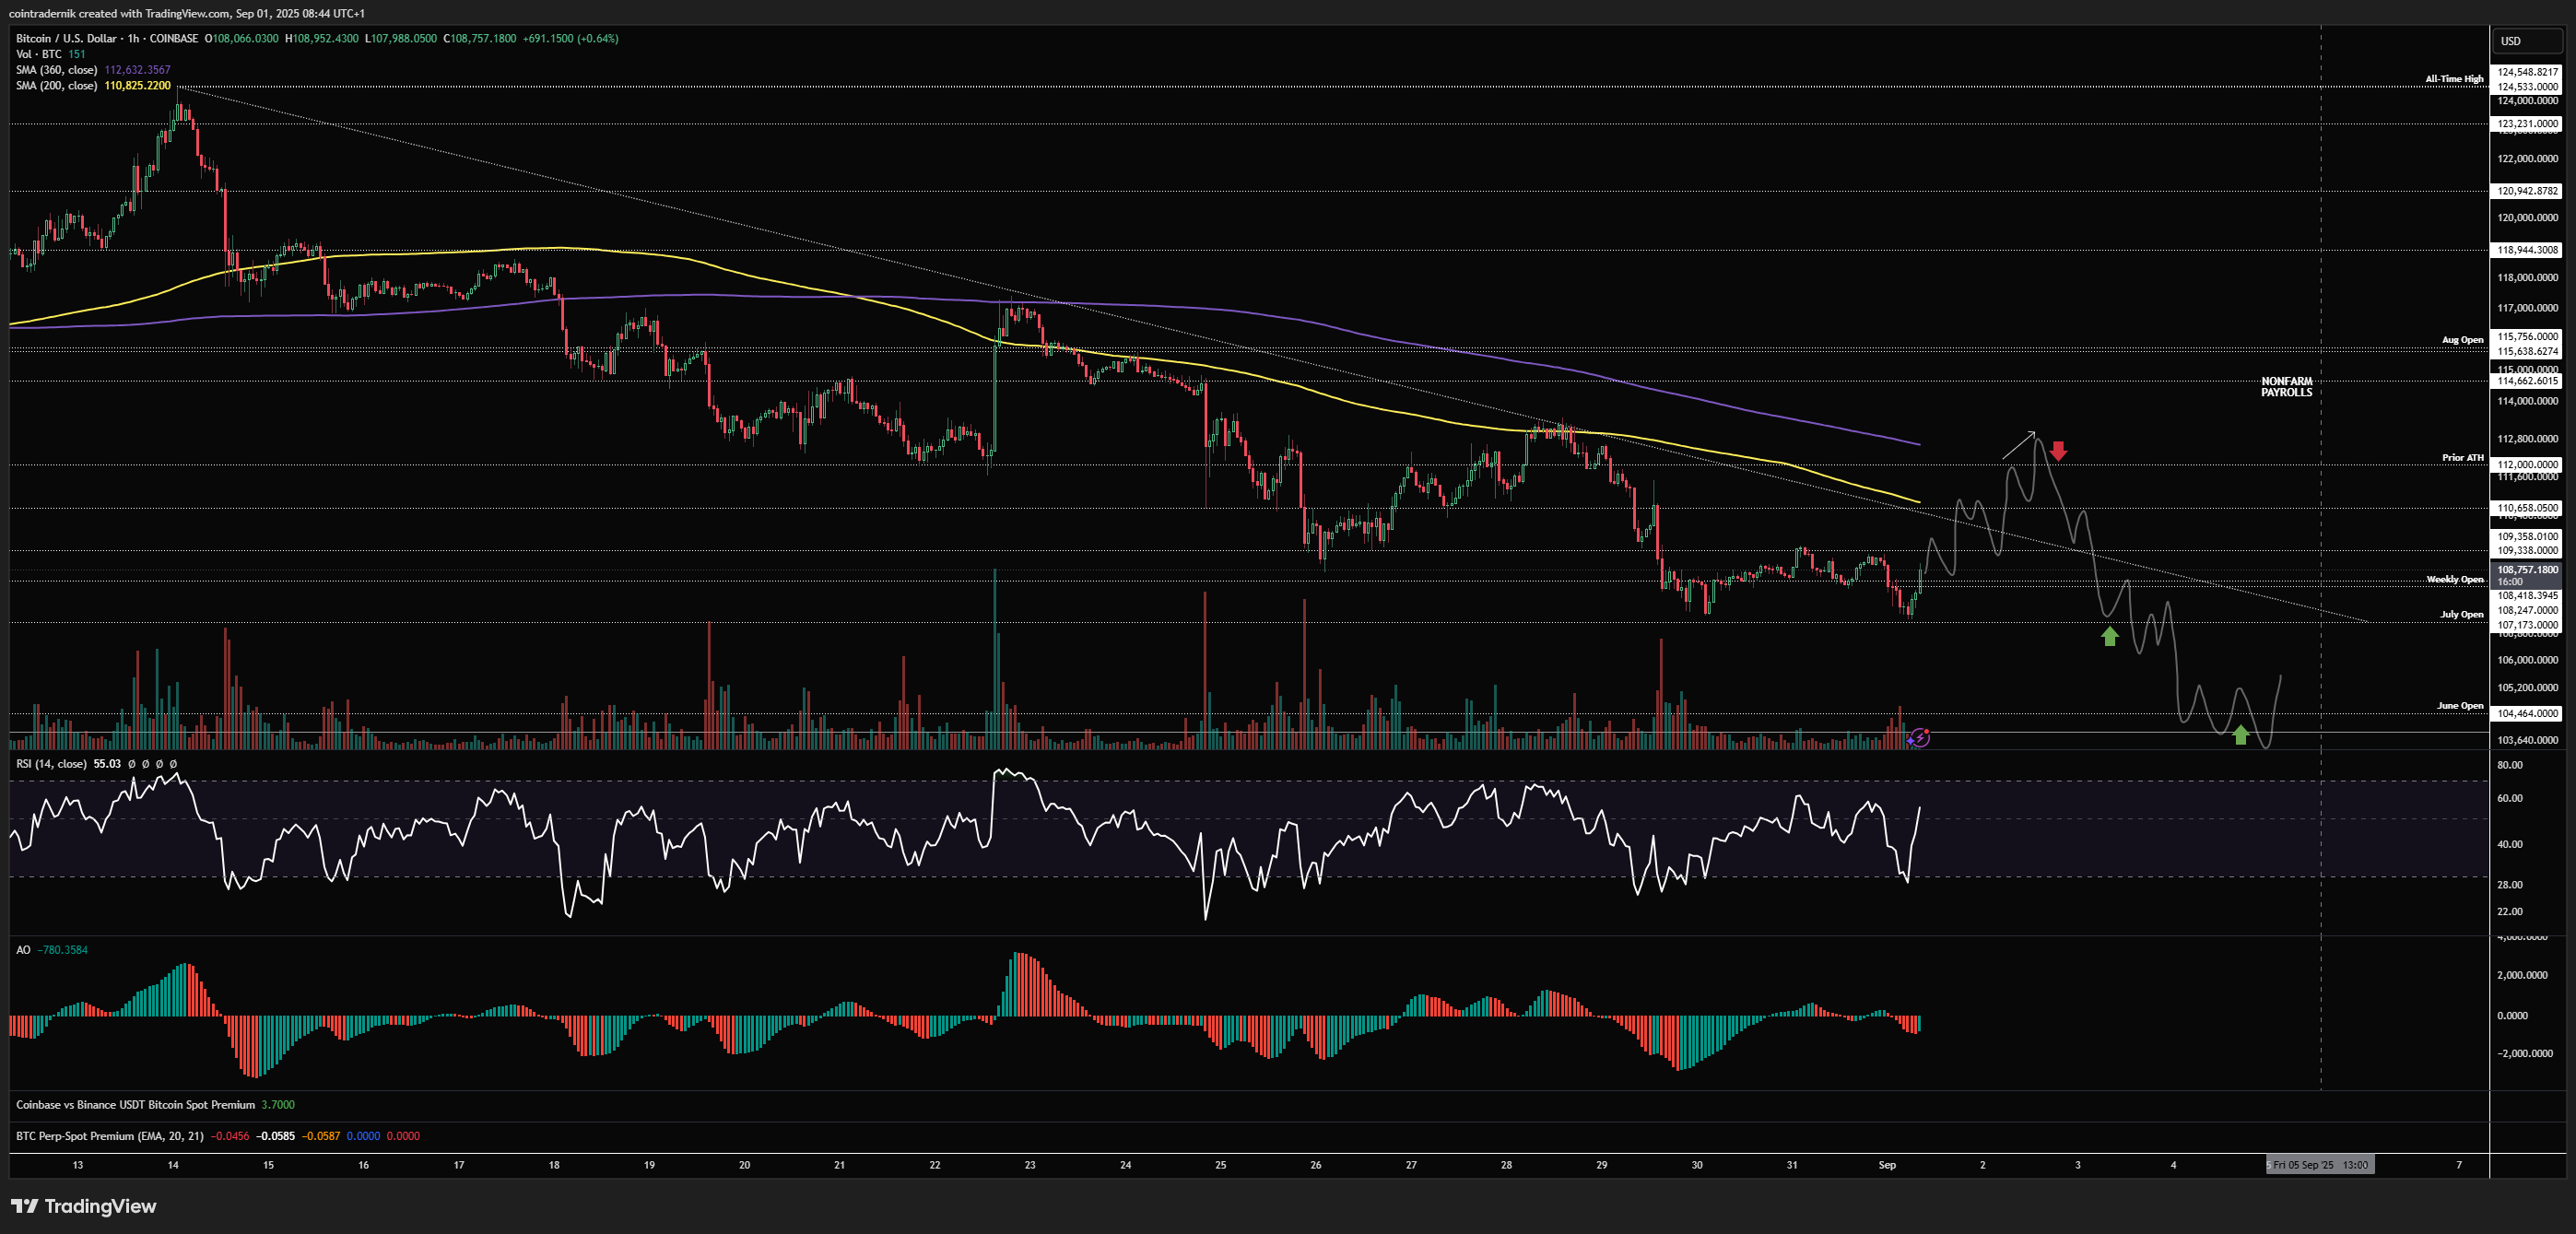
Looking at the daily, we can see that there has been an orderly fashion to the retracement, with prior support being flipped into resistance as price moves lower. The key level here is obviously the $112k prior all-time high, which acted as support in early August and then got flipped into reclaimed resistance on last week's leg lower into that July open. We are currently capped by trendline resistance, so a breakout and close above the trendline and back above $112k would look like the bottom is in, following which we would expect another higher-low to form above the July open. If we wick above the trendline into $112k and reject, we likely move lower into the June open at $104.5k, with the 200dMA below that at $101.3k being key demand. Daily structure is bearish here (hence why that close above $112k would be key) and there is no trend exhaustion on this timeframe yet.
Now, thinking about setups for the week, we have so much data out this week culminating in NFPs, and for longs you want to see that trendline resistance respected and price take out today's low, potentially as a large liquidation event / wick into that June open, with some bullish divergence forming into that support. You could then look to bid in that area for a move back into the weekly open and then into the $112k retest, where if it occurs pre-NFP that would make a lot of sense to derisk into:
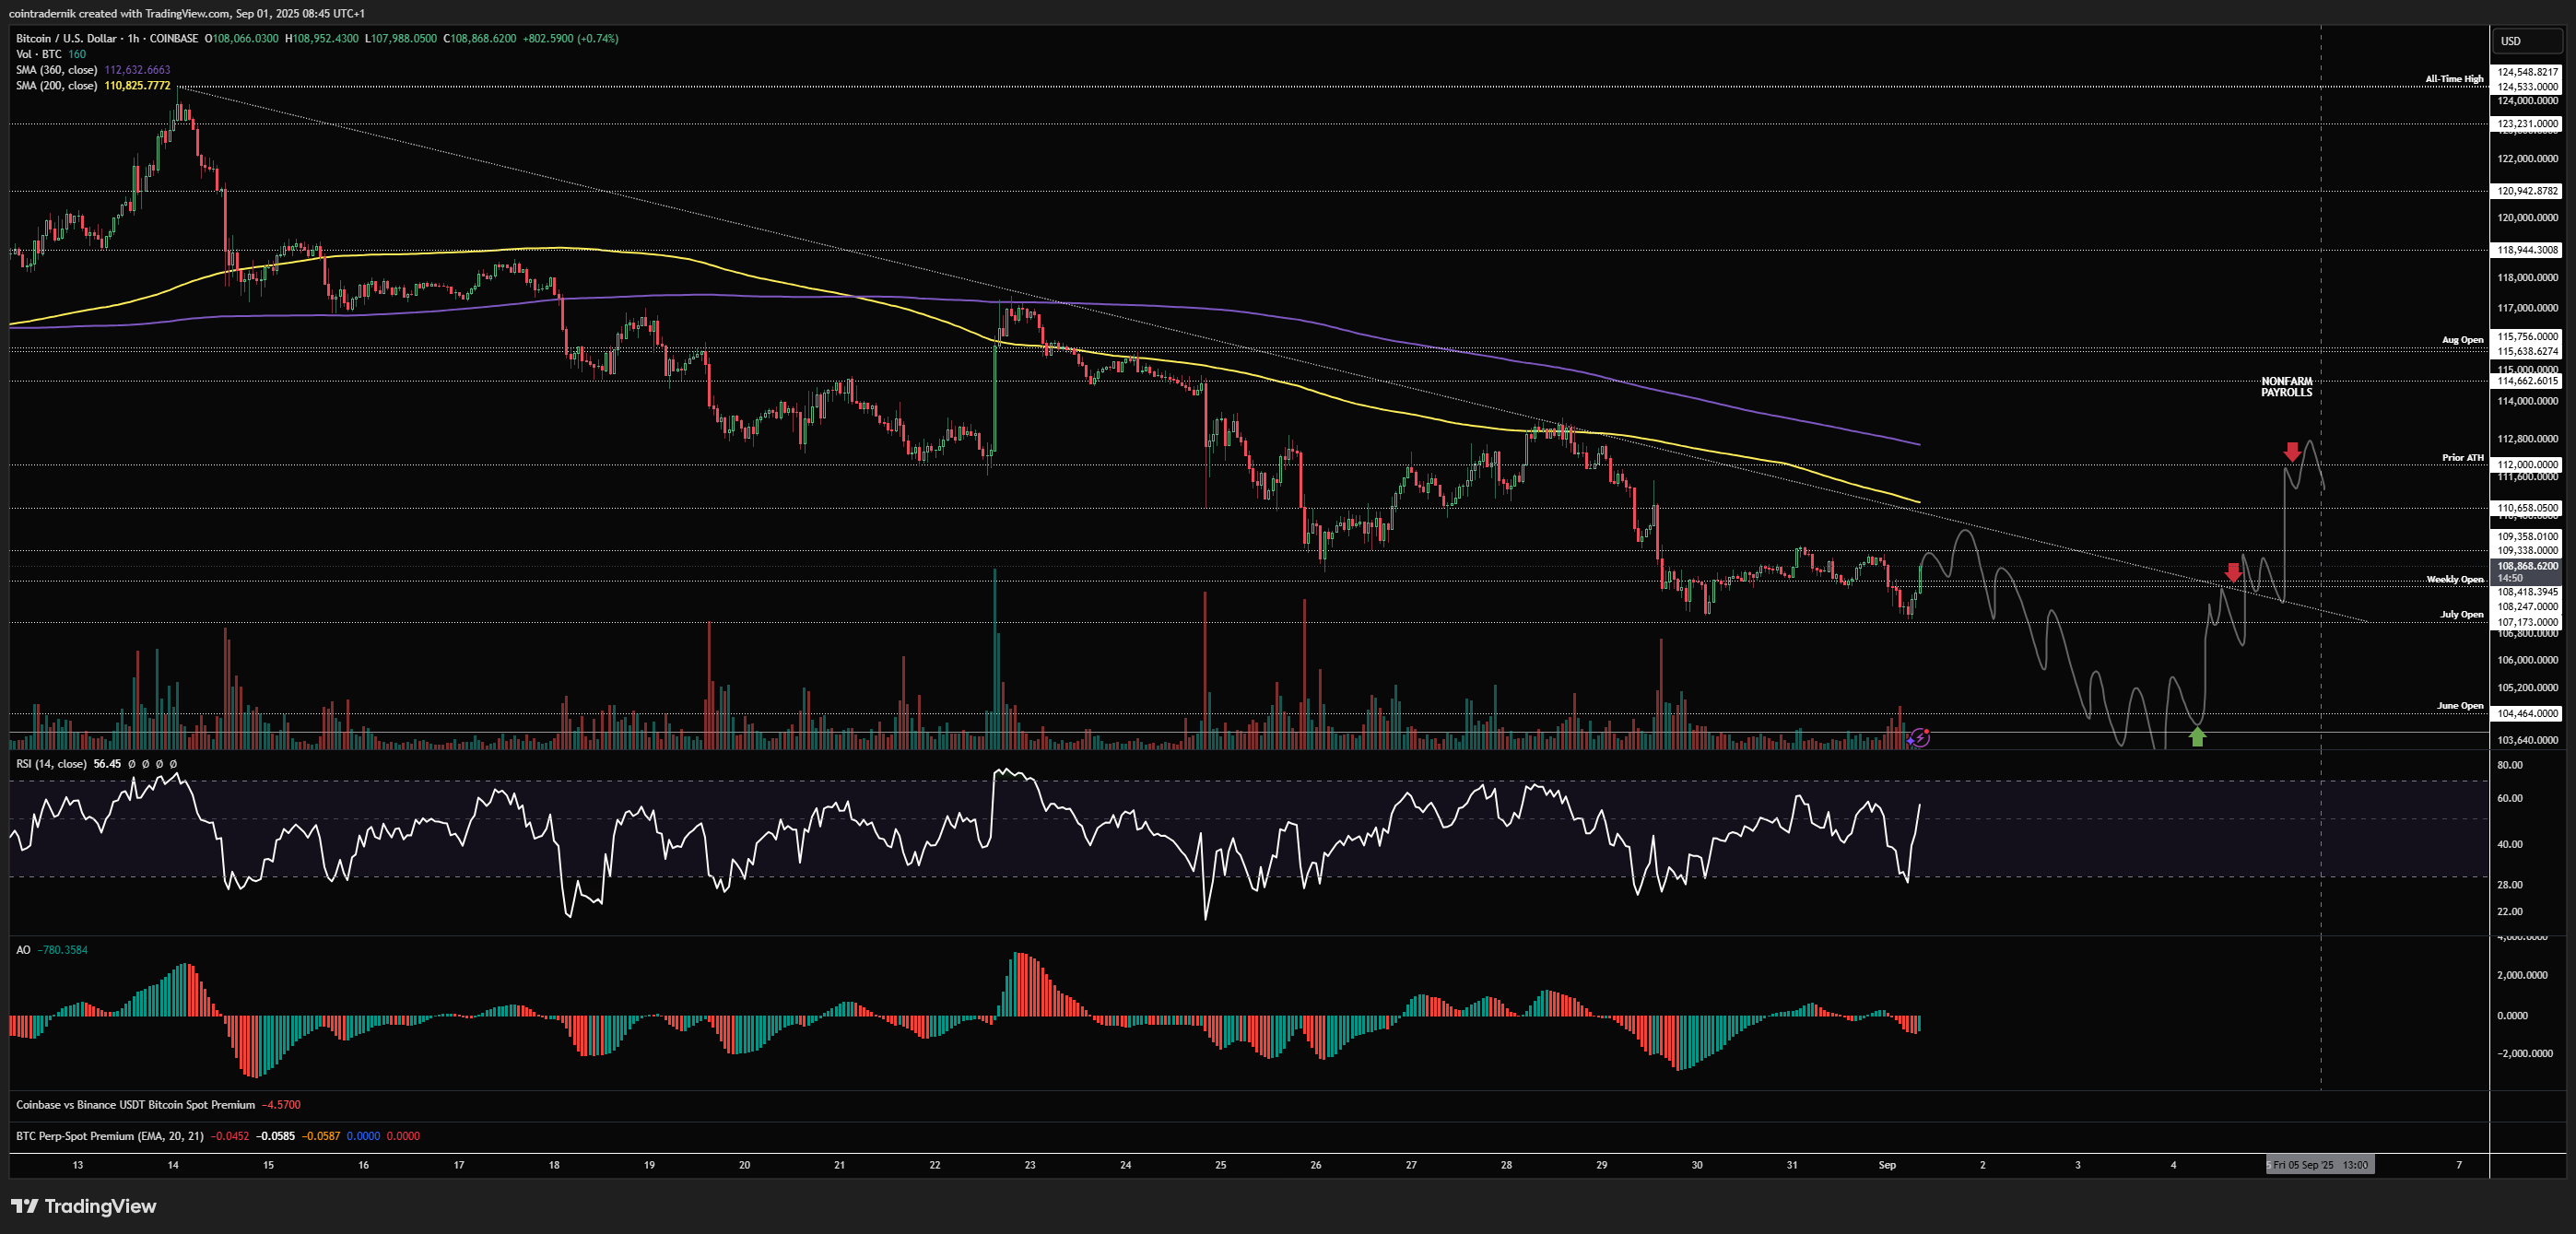
On the short side, you want to see a sharp rally early this week into $112k, with trend exhaustion into that level having not taken out today's low around $107k, where we would fade that pop right back into weekly lows with a second TP at the June open, again looking to derisk that trade if it occurs pre-NFP:
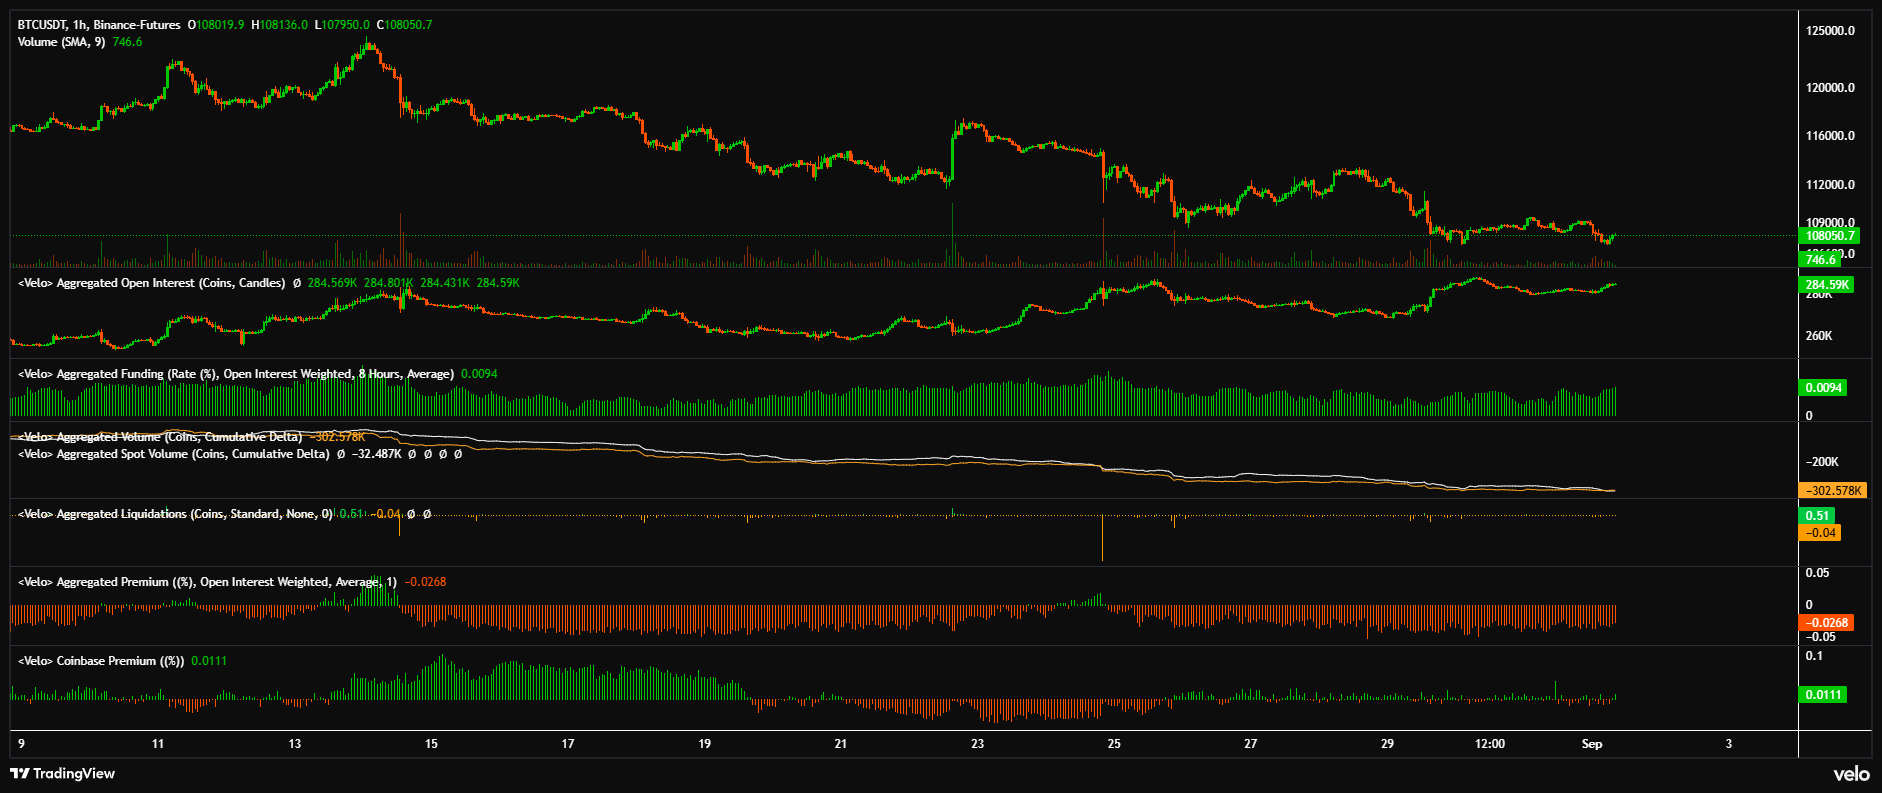
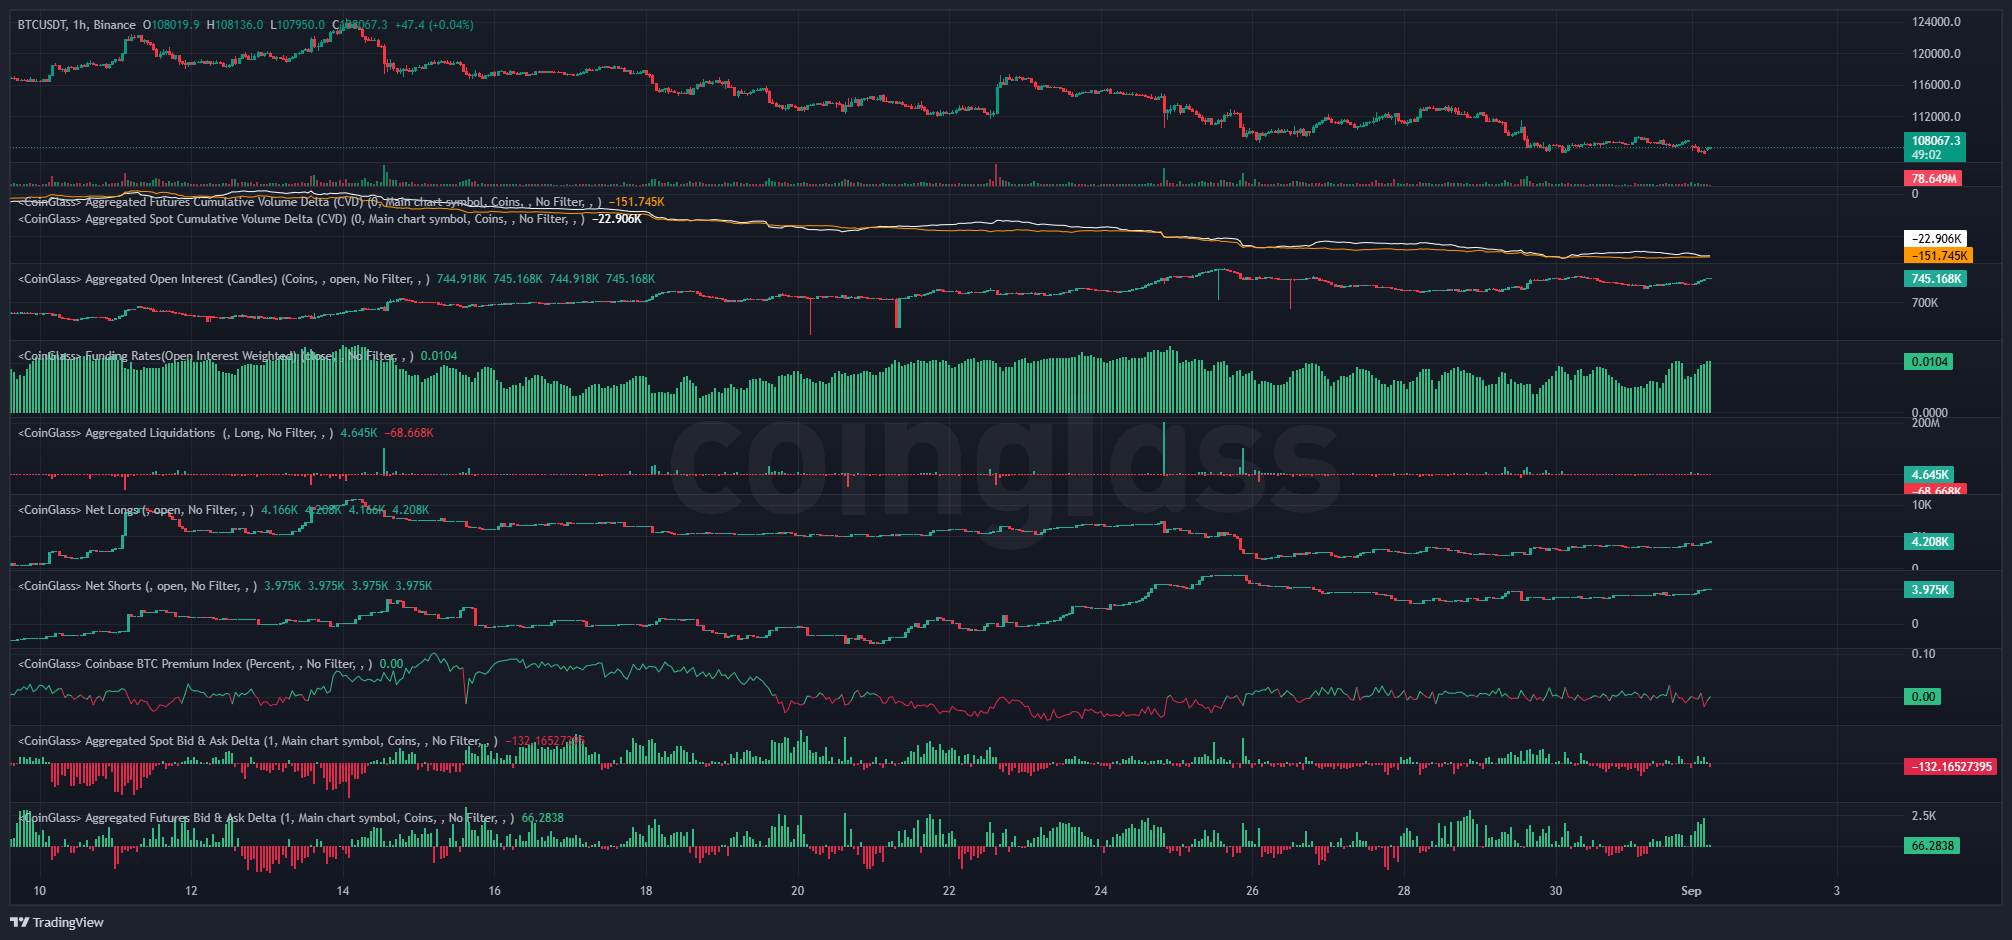
And here's a snapshot of positioning across Velo and CoinGlass:
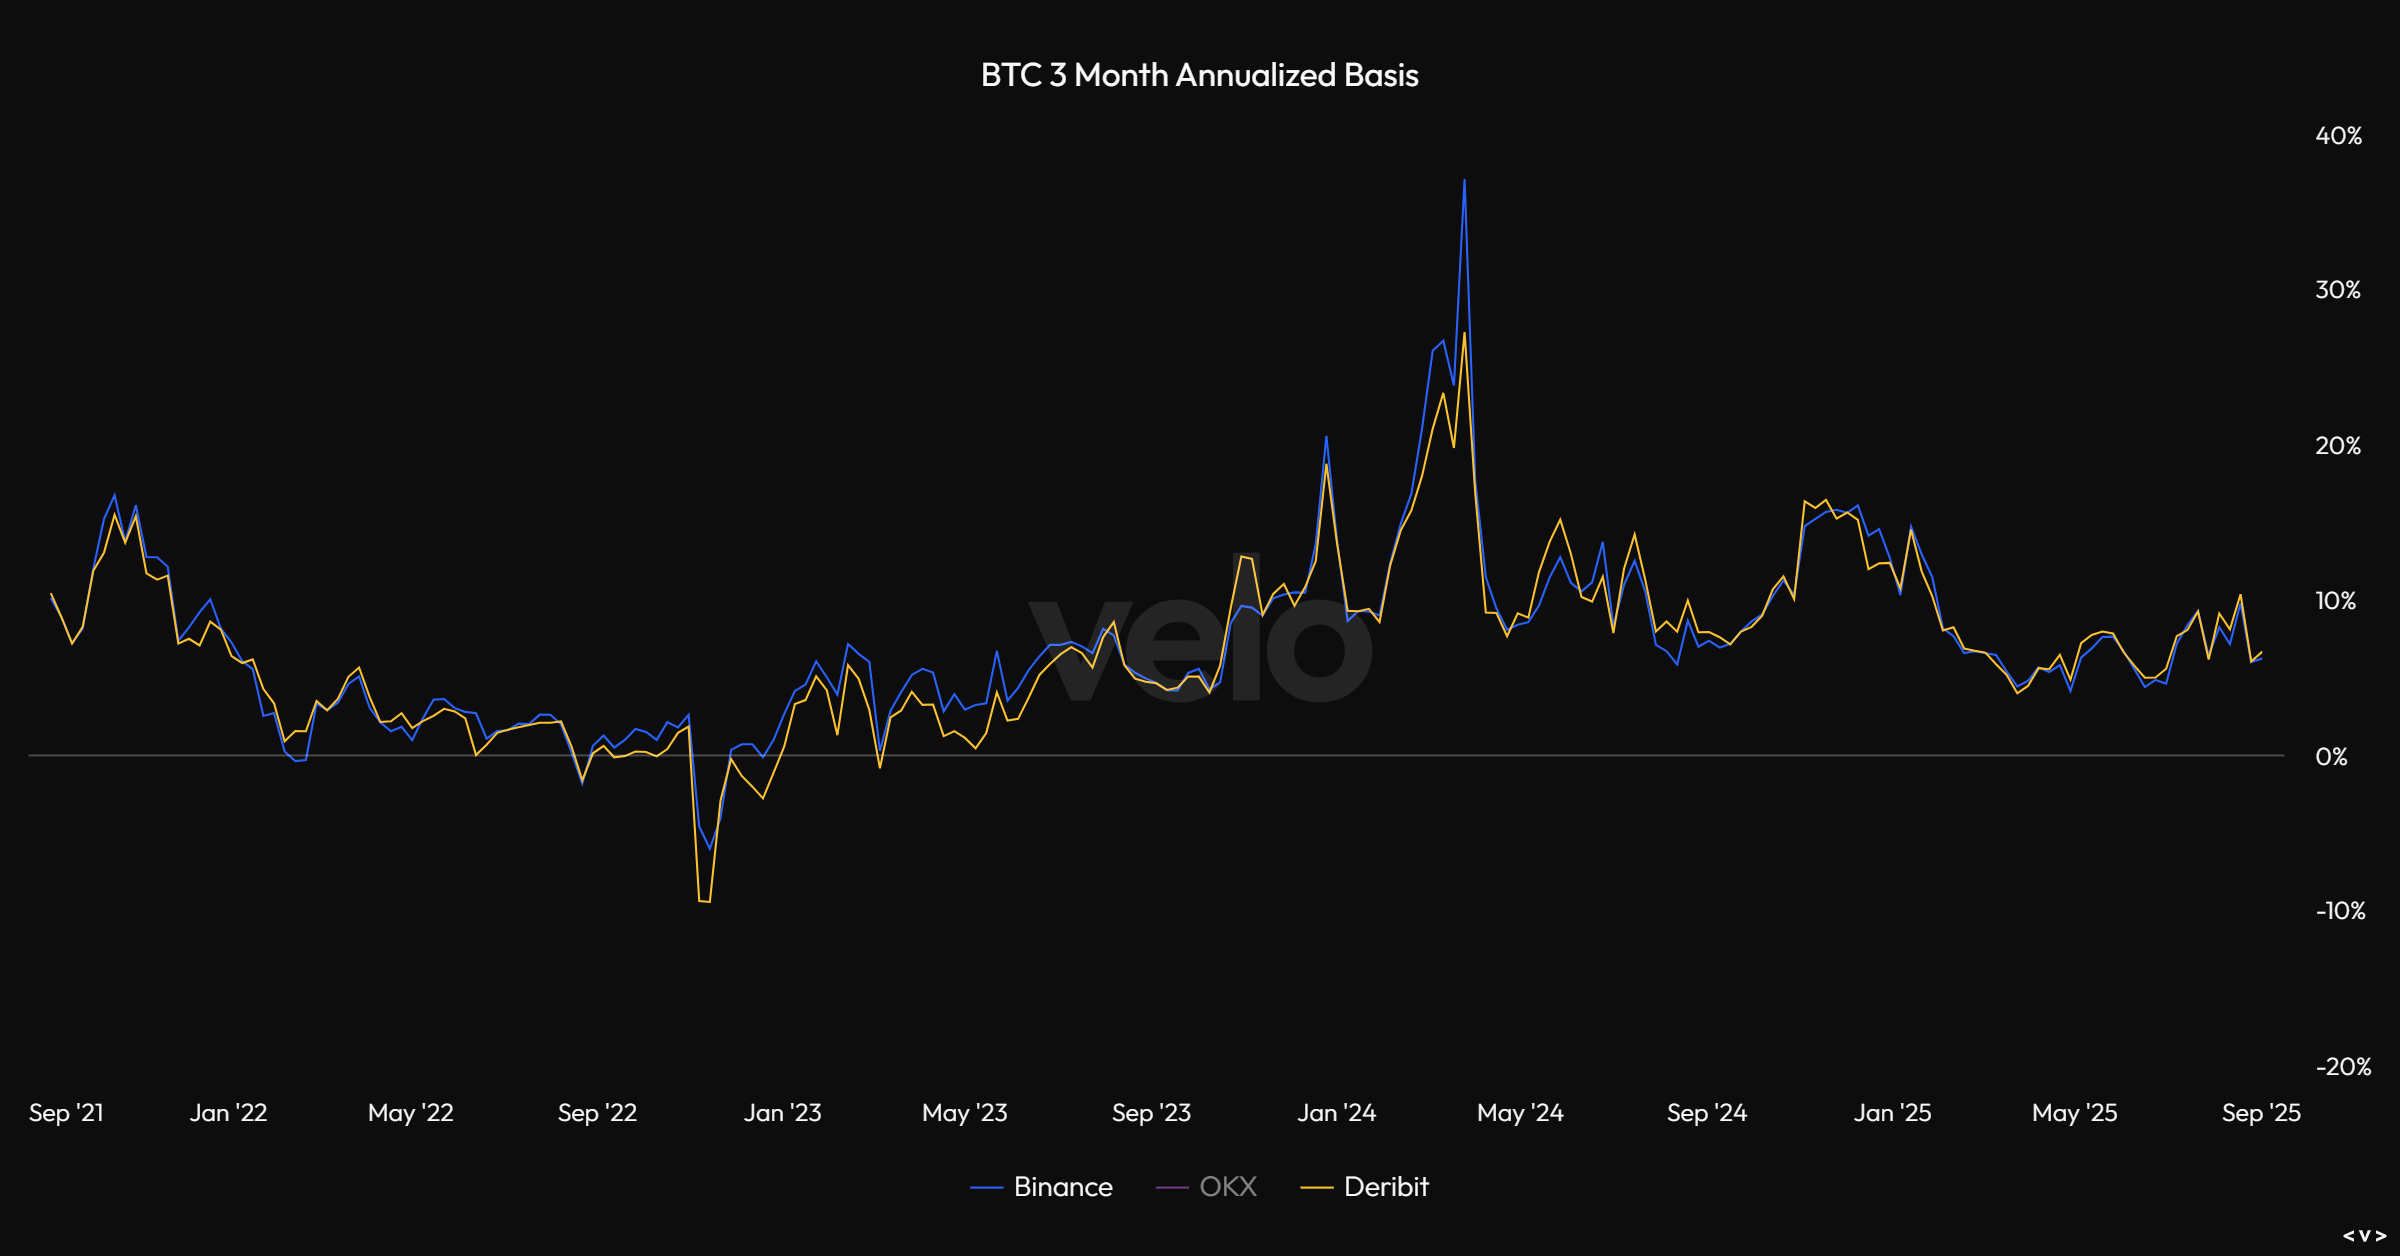
And here's 3-month annualized basis:
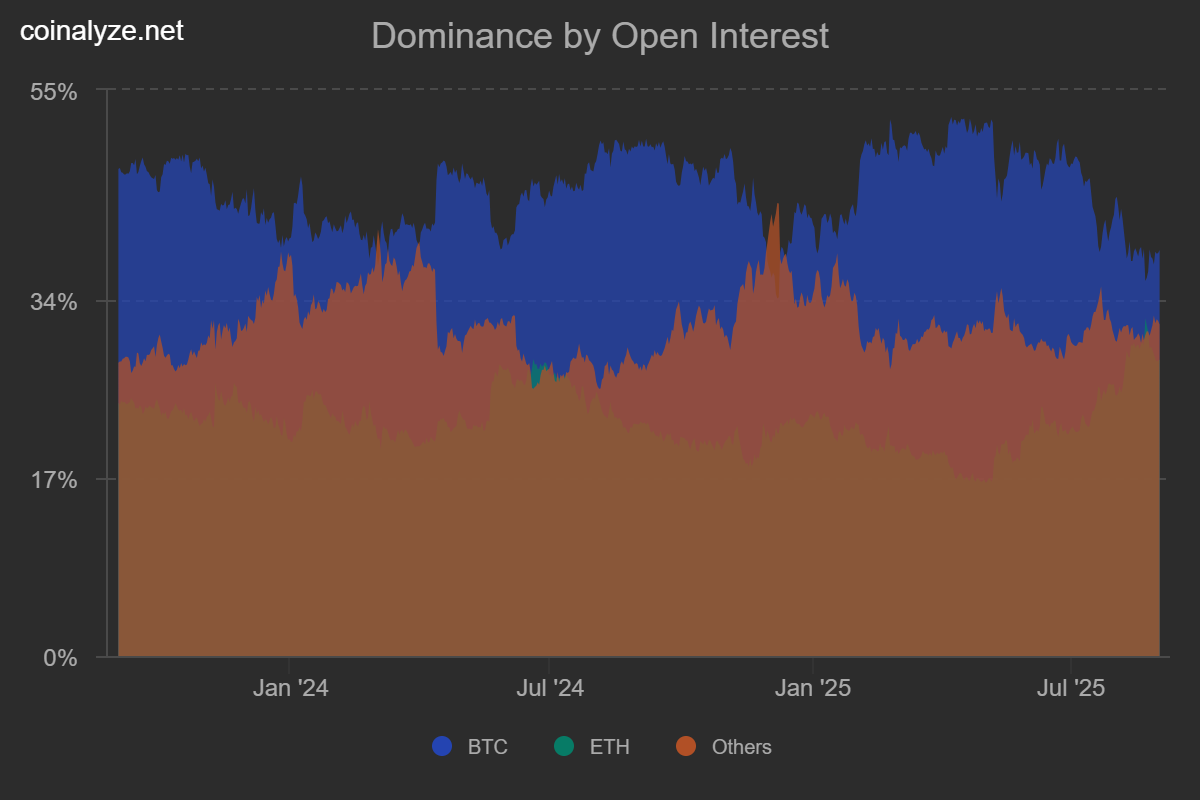
And Bitcoin OI vs Altcoin OI:
And finally some of the expected 1-week and 1-month liquidation levels:
-2025-09-01_08_07_06.png)
-2025-09-01_08_07_51.png)
Price: $4431
ETH/USD
Monthly:
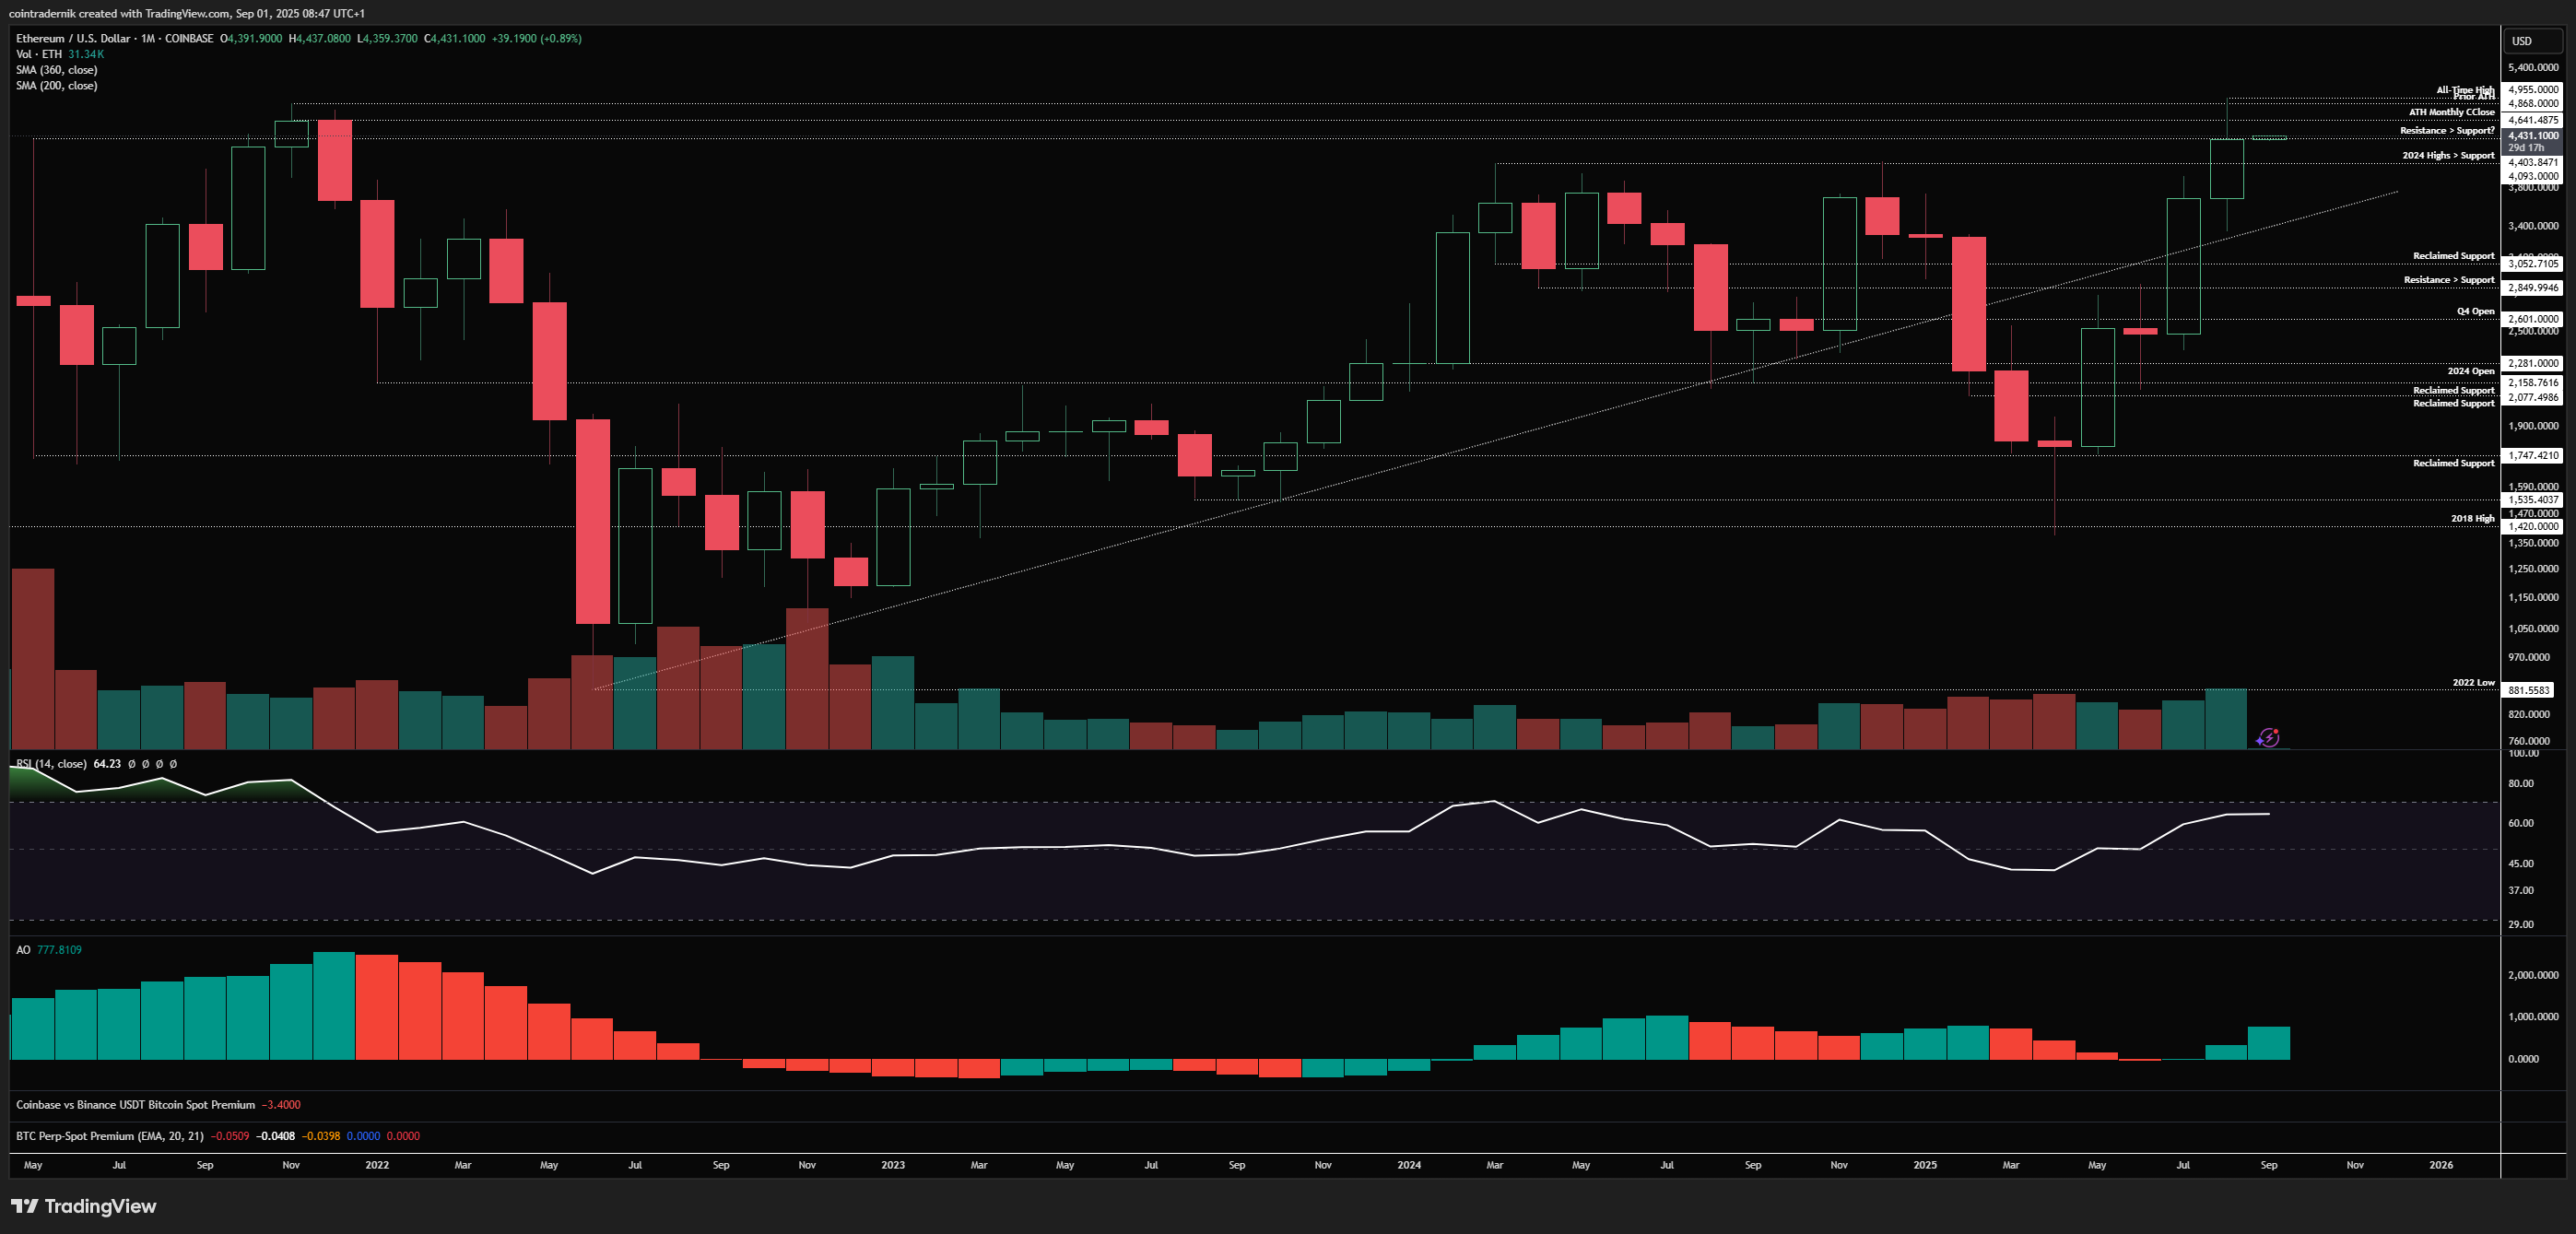
Beginning with the monthly for ETH/USD, we can see that August closed very strong indeed, forming a brand new all-time high at $4955 after rallying off the long-term trendline support reclaim, and closing out the month at the second highest close ever of $4391, firmly above the resistance cluster at $4090. This occurred on growing volume and momentum and I think it is very likely we see price discovery from here into year-end, where as long as $4090 continues to act as support in September, it is probable that we push through the highs into October. Closing September below $4090 opens up more consolidation but monthly structure and momentum are very much bullish here.
Weekly:
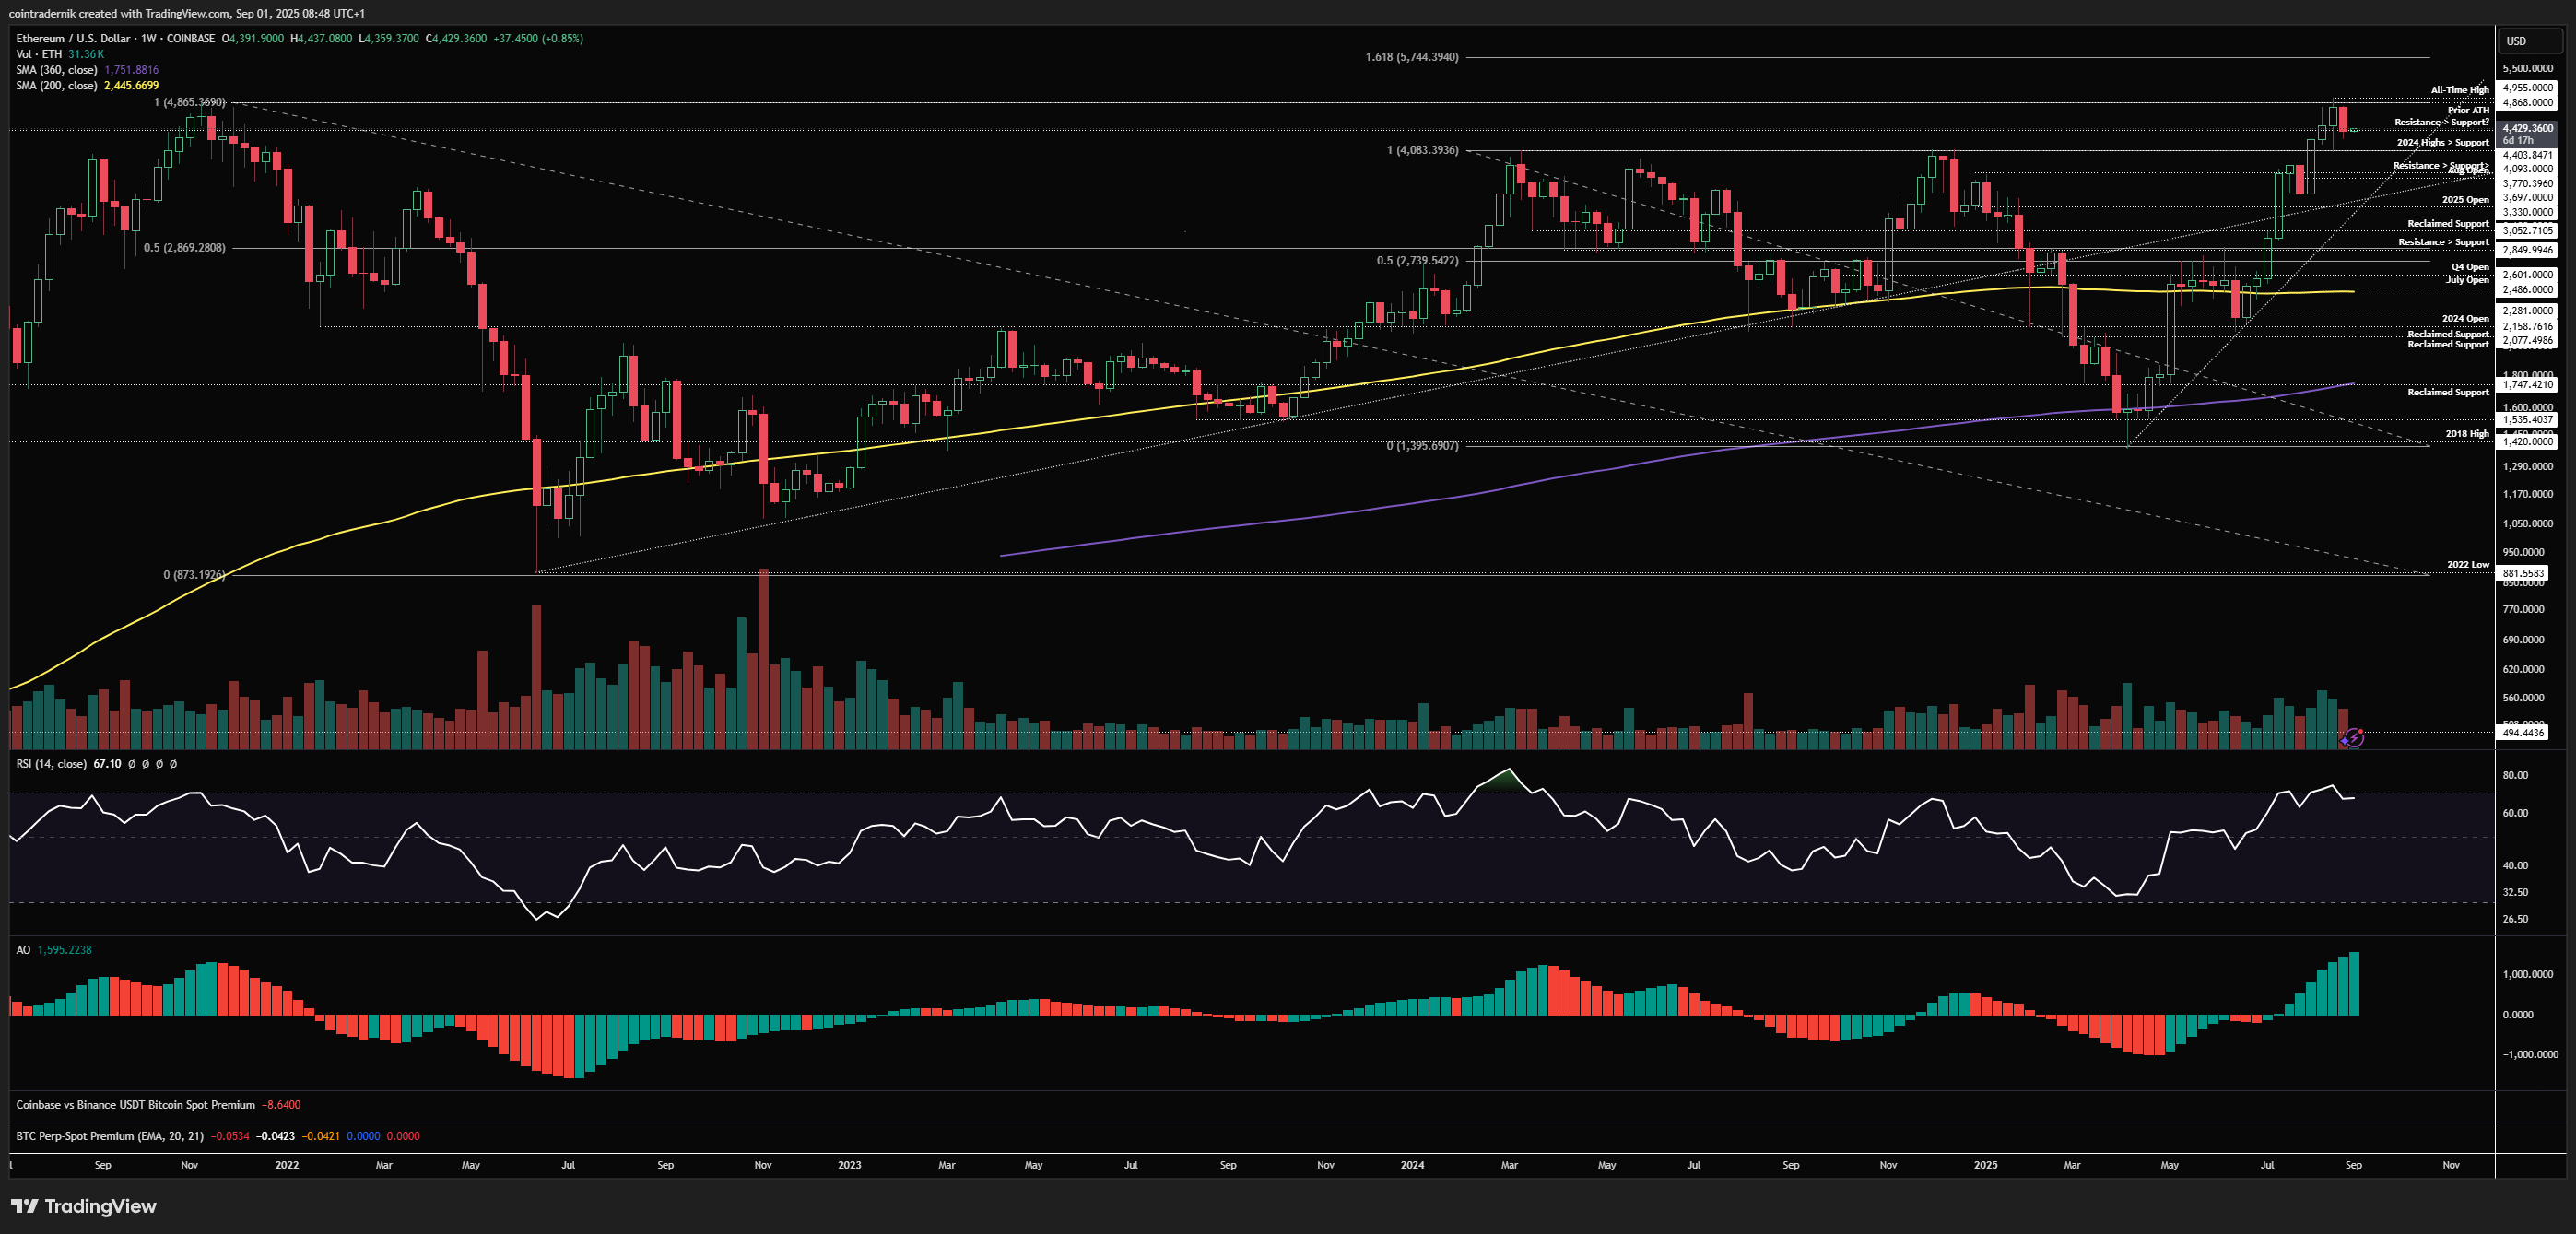
Looking at the weekly, we can see that weekly structure and momentum also remain bullish with no trend exhaustion into the highs, with $4090 acting as support and price then forming an inside week subsequently. If we take out last week's low and close back above it this week, I think we take out all-time highs next week; and the reverse is also true, where wicking above $4900 this week and closing back below it opens up another test of $4090, in my view. We remain above trendline support from the April lows and above that longer-term trend reclaim, so there really is no reason to be mega bearish here - and the wall of worry we continue to see in the face of this is supportive of this view. A weekly close below $4090 = deeper pullback before another attempt at the highs.
Daily:
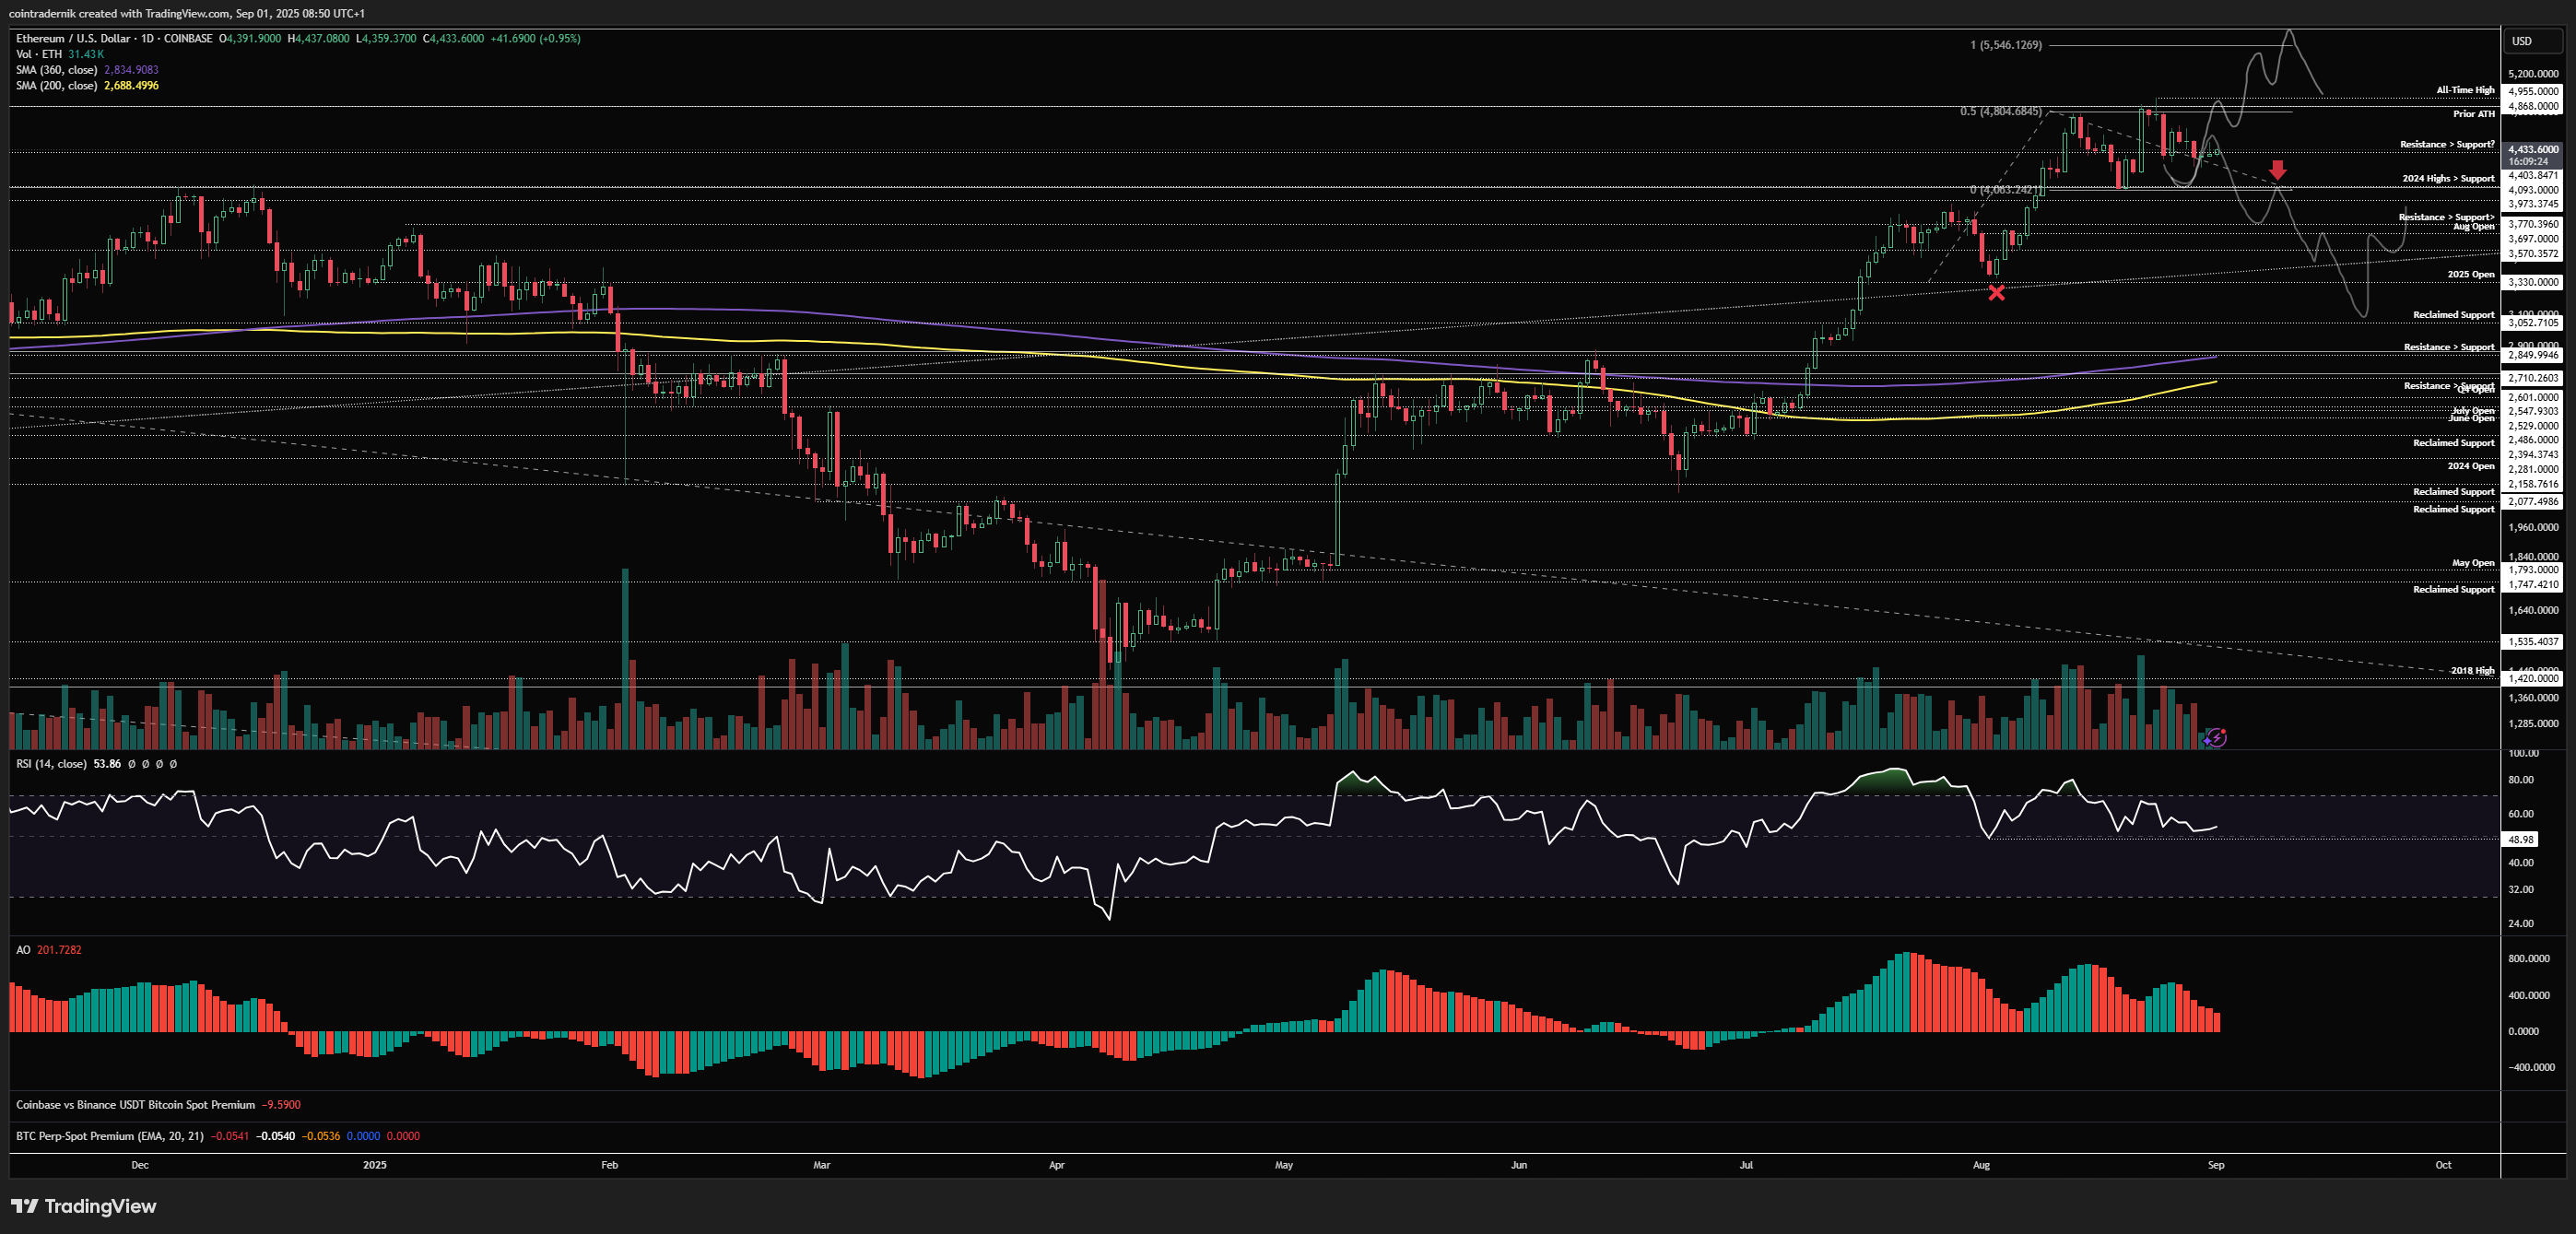
Turning now to the daily, we can see these two trajectories, where acceptance below 2024 highs at $4090 would open up that deeper correction, likely taking out the 2025 open at $3330 before a v-reversal type of move back towards the highs, but as long as we are finding support above that level I think it is much more likely we rip higher from here into another all-time high test over the next couple of weeks, where flipping $4900 into support leads to $5550 being tagged as the 100% extension of the current trend. Daily RSI breaking below 49 on price acceptance below $4090 would be the confirmation you need for the more short-term bearish scenario to play out.
ETH/BTC
Monthly:
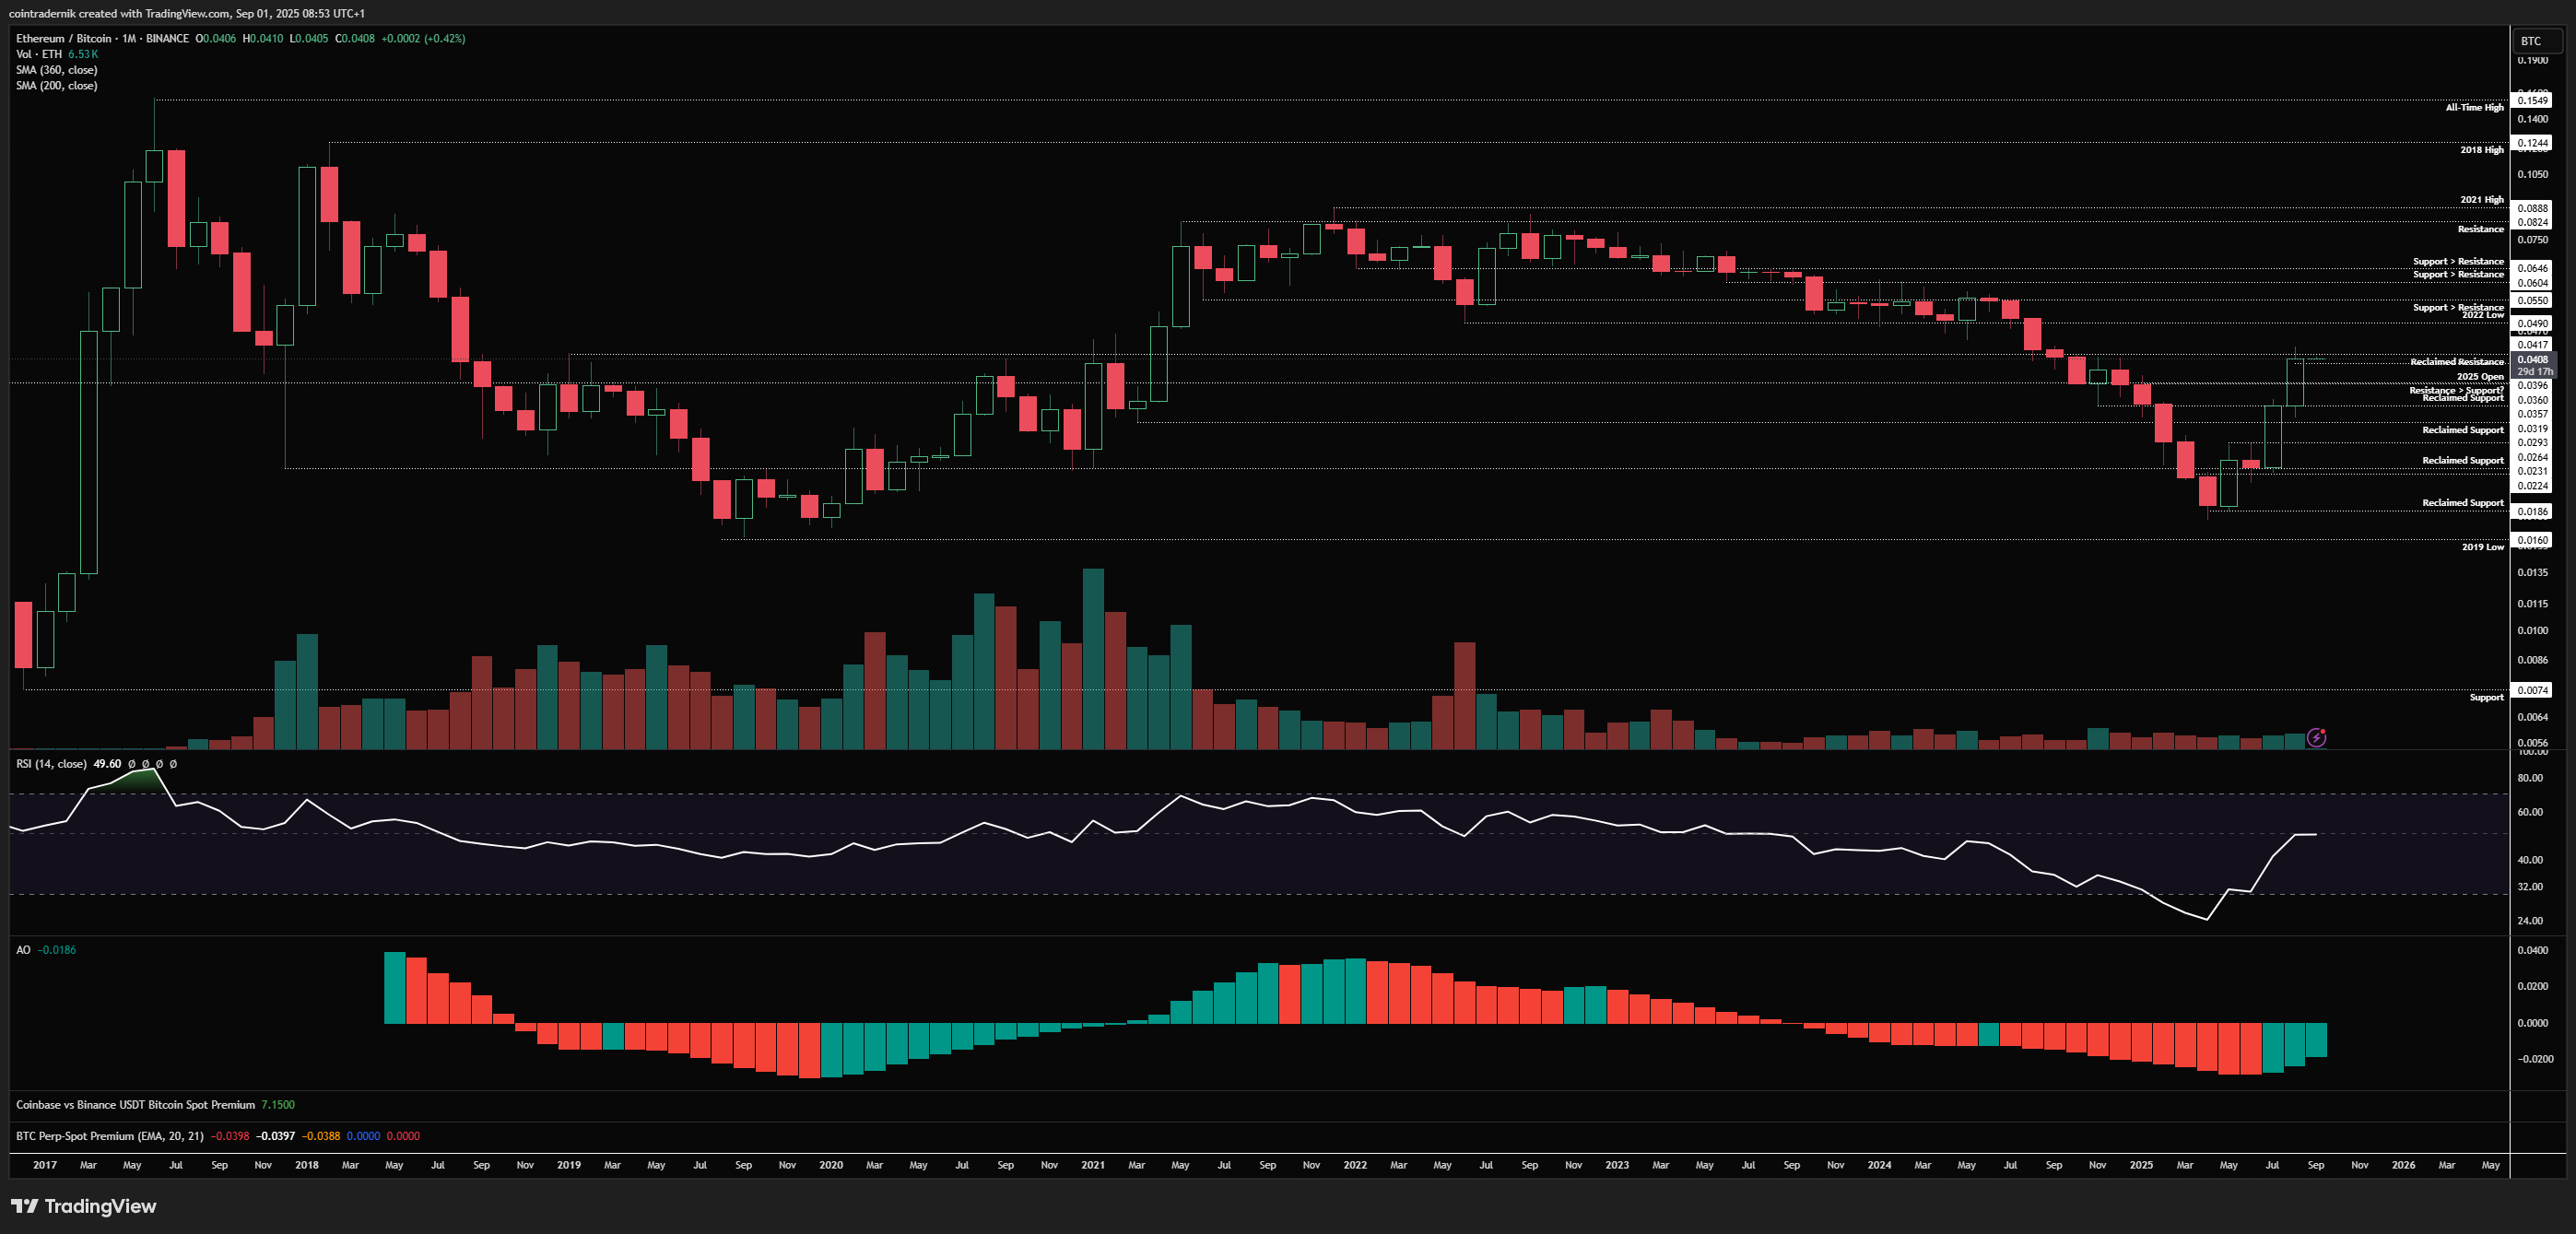
Looking at the monthly for ETH/BTC, we can see that the pair closed out at 0.0406, marginally below reclaimed resistance at 0.0417 which was the key level I had marked out months ago. We are firmly above the 2025 open at 0.036 and there is nothing particularly bearish here about ETH/BTC on this timeframe. If we close above 0.0417, it is likely we tag 0.049, followed by 0.055. Nothing more to add for now...
Weekly:
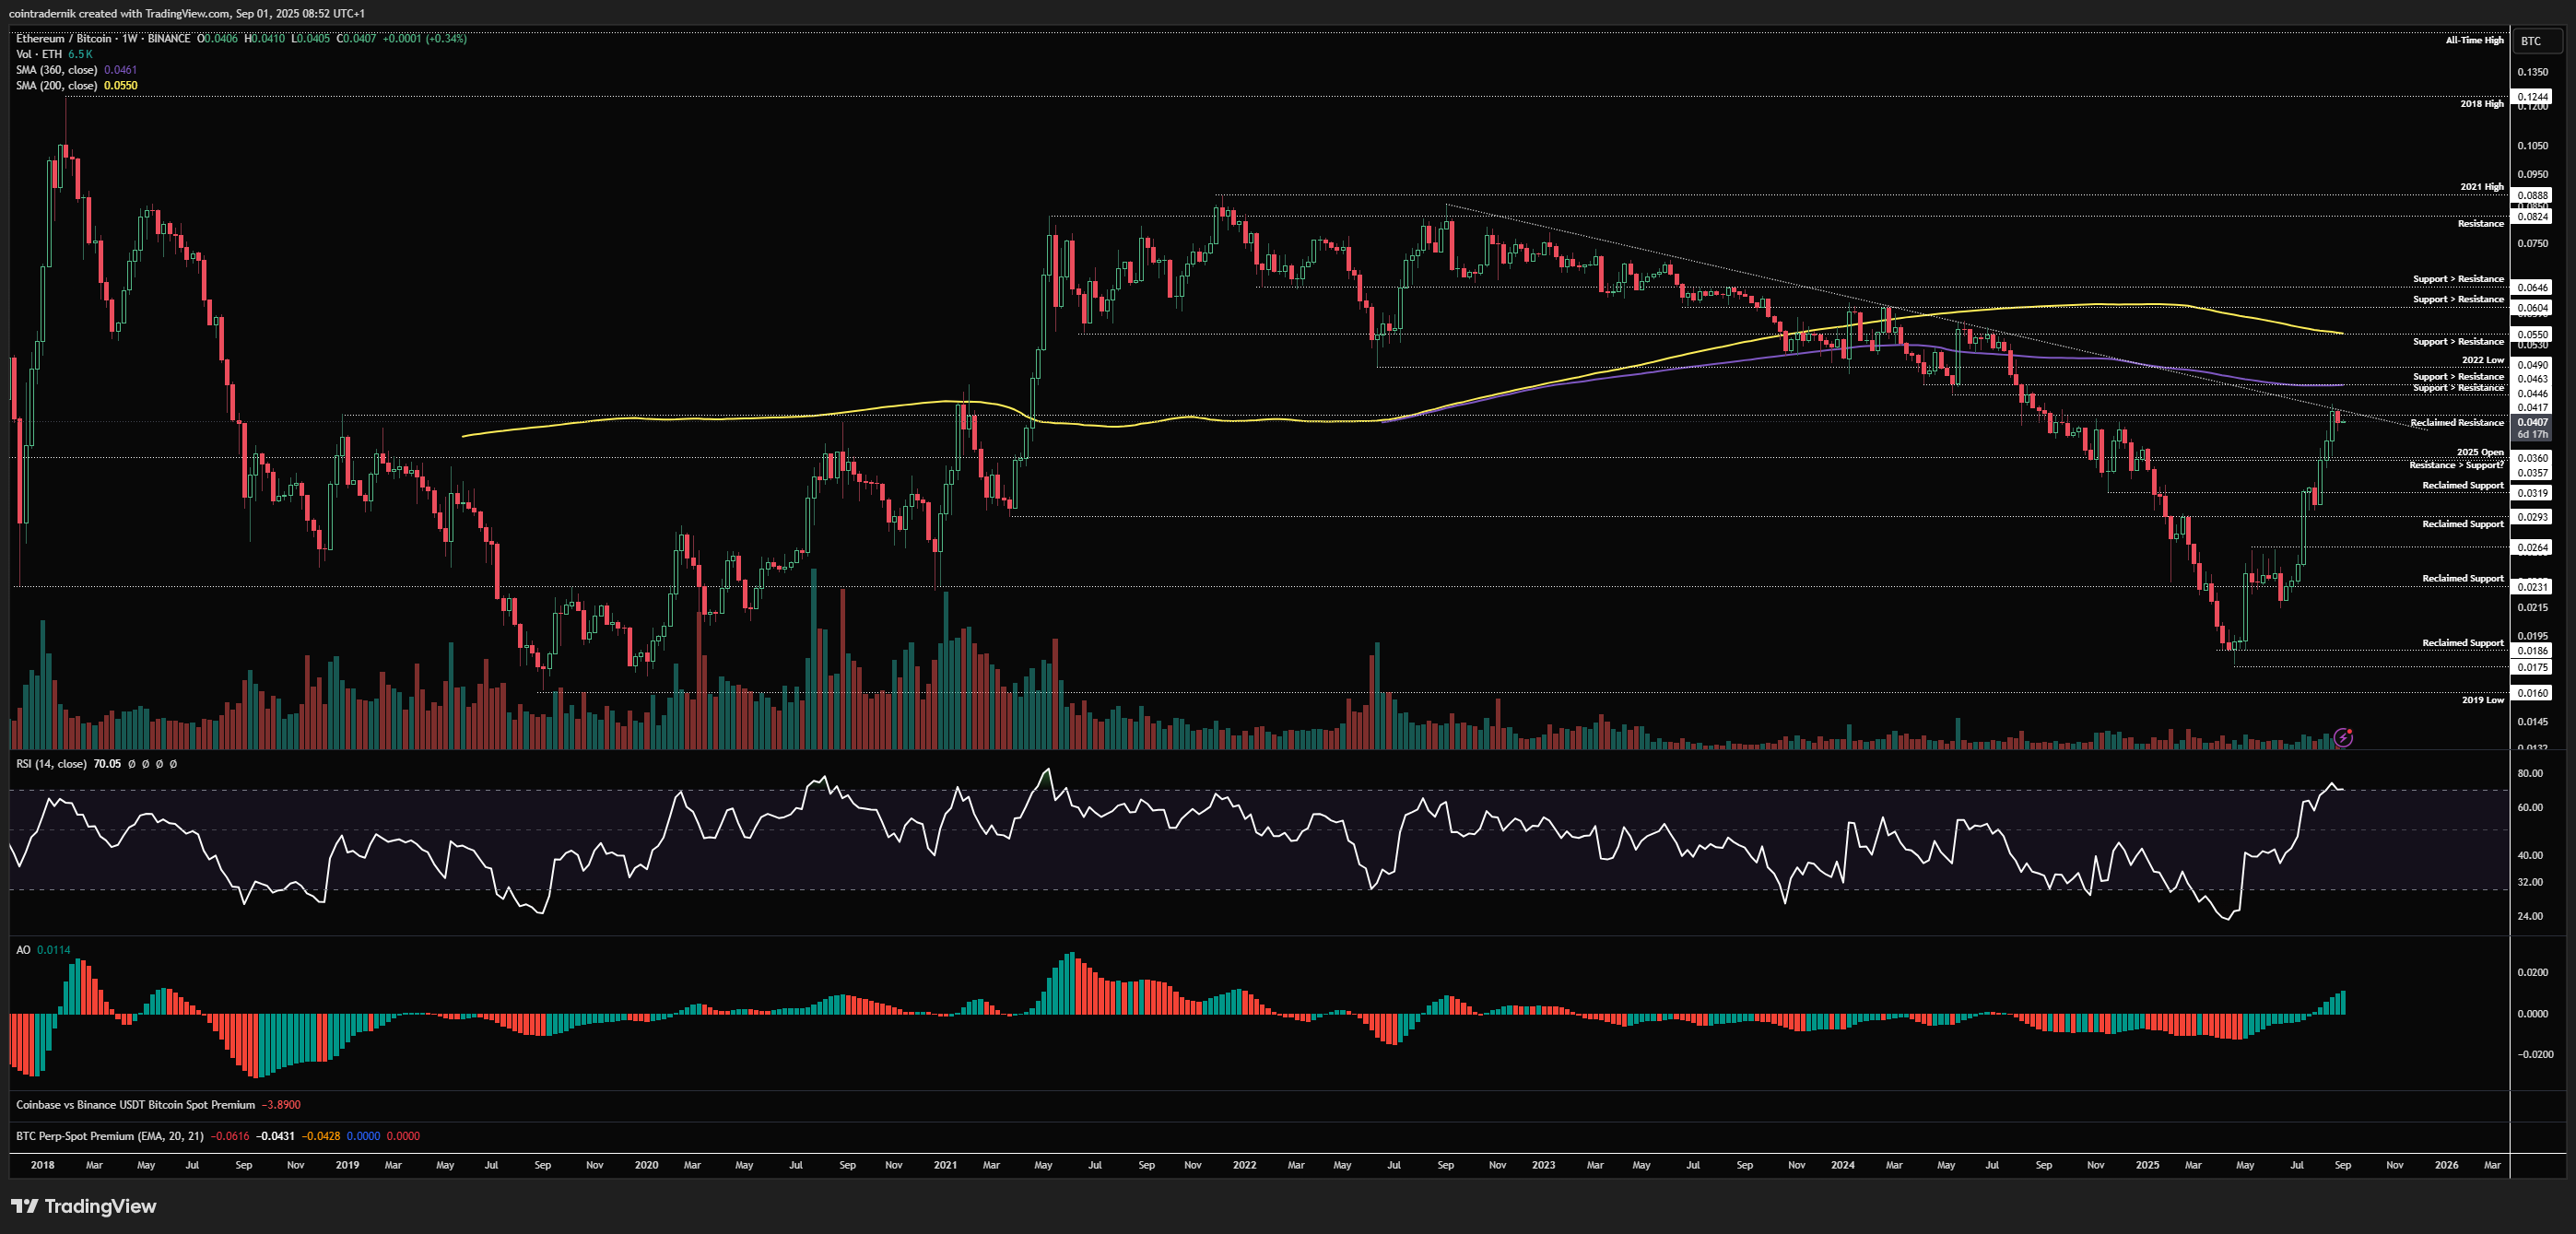
Looking at the weekly, we can see that price rejected right at that long-term trendline resistance and is now consolidating below it, where acceptance above this confluence of resistance would be very much bullish and open up another leg higher into that range between the 360wMA and 200wMA int0 0.055, where I do think we will find a lot of resistance. Weekly structure and momentum is still bullish here and weekly has only just pushed through 70, with this move off the April lows very much reminiscent of the 2019-2020 bottoming formation into the summer 2020 highs, just at an accelerated pace. If we do extend higher here into the 200wMA through September, I think October likely sees a pullback for ETHBTC and consolidation; if instead we pull back here on the pair below the trendline, I think we could wick below that 2025 open and then bounce higher from there to attempt the breakout again later this month. There is zero reason yet on either the monthly or weekly timeframes to be talking about multi-month tops on ETH/BTC.
Daily:
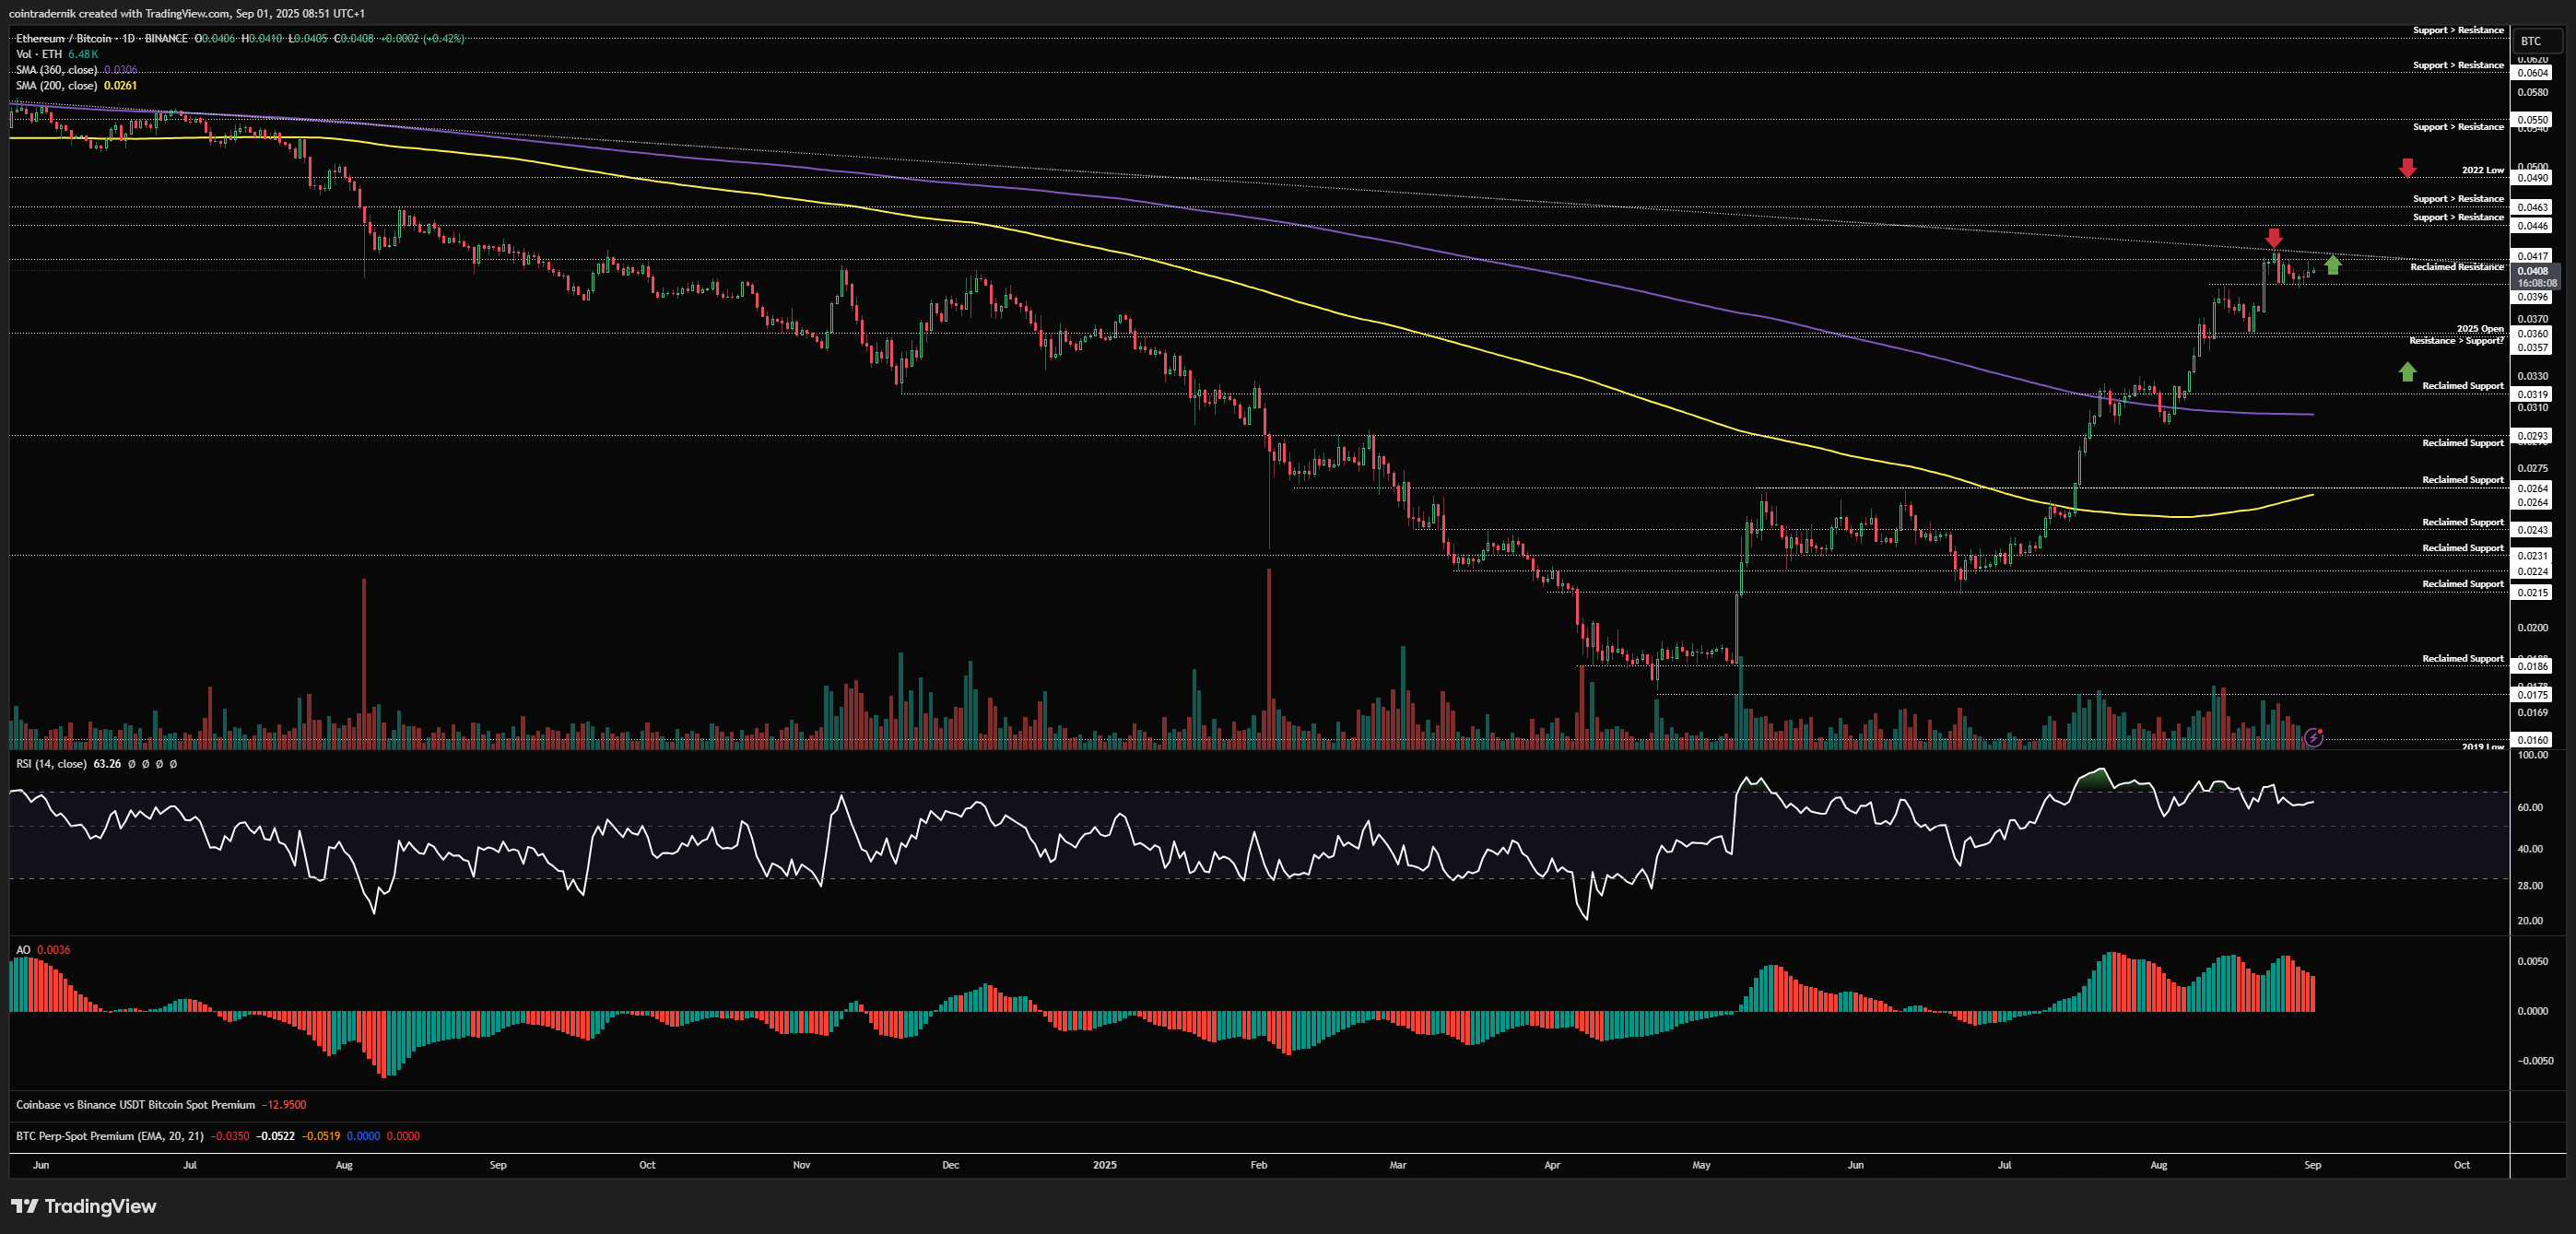
Now, looking at the daily, we can see that price continues to flip resistance into support and is currently coiled beneath these key resistance, with 0.0396 holding for now. If this level gives way as support and flips into resistance, validating some of this trend exhaustion we're seeing, I think we take out that 2025 open and squeeze towards the 360dMA later this month, marking out a low somewhere between 0.0319 and 0.036 before continuation through 0.0417. If instead this is already ready to squeeze higher, we should flip 0.0417 into support going into next week and then invalidate the divergences on daily RSI, leading to a sharp leg higher into 0.049 as the first target, which was the 2022 lows and where we could start looking again for signs of exhaustion across timeframes. My current expectation is that this squeezes higher sooner rather than later and ETH/BTC gets its pull-back and consolidation period in October, but the next week or so of price-action should reveal more.
Receive the latest updates directly to your inbox

Price: 97.2
Monthly:
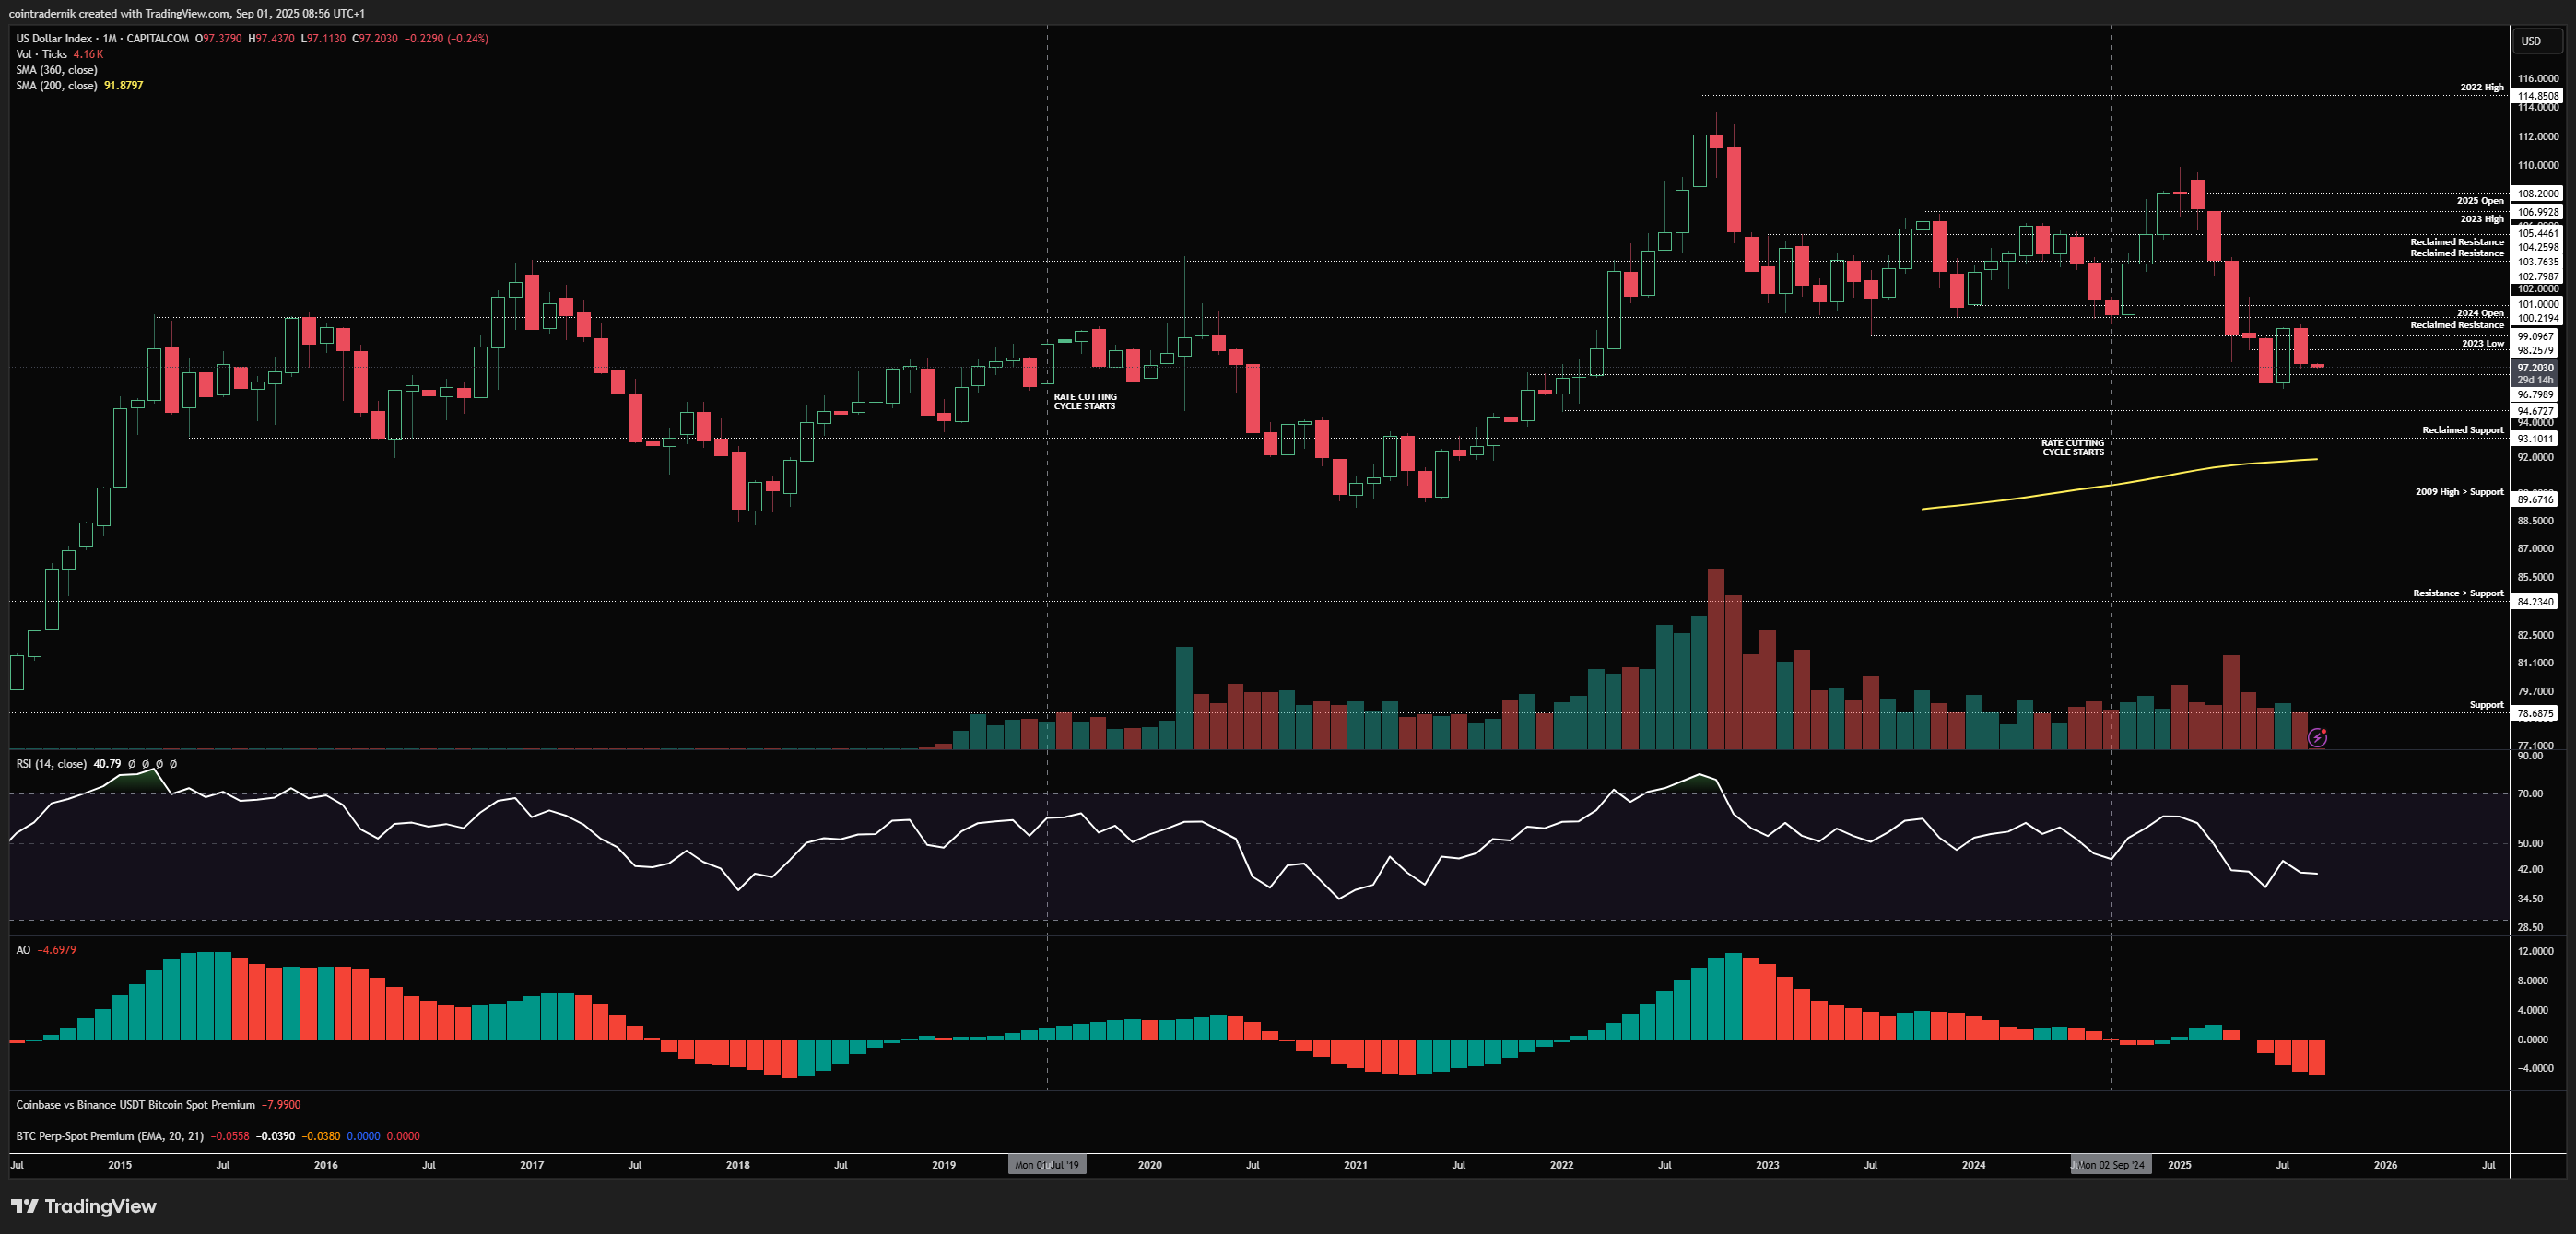
Looking firstly at the monthly for the Dollar Index, we can see that this cycle continues to very closely resembles both prior Dollar bear trends within the longer-term uptrend, where most recently DXY retested prior range support as resistance and rejected to close August back at 97.4, marginally above support at 96.8. We saw similar patterns following a range breakdown in mid-2017 and late 2020 before the next (and final) leg lower began for the Dollar, where we then saw consolidation into the 90 handle for several months before a sustained reversal. Here, I am expecting DXY to break below 96 and push towards at least 94.6, but more likely 93, above the 200mMA, where I expect a bottoming formation to begin to appear. Invalidation of this view would be range support reclaim at 100, where a monthly close above that level likely confirms the Dollar bottom is already in.
Weekly:
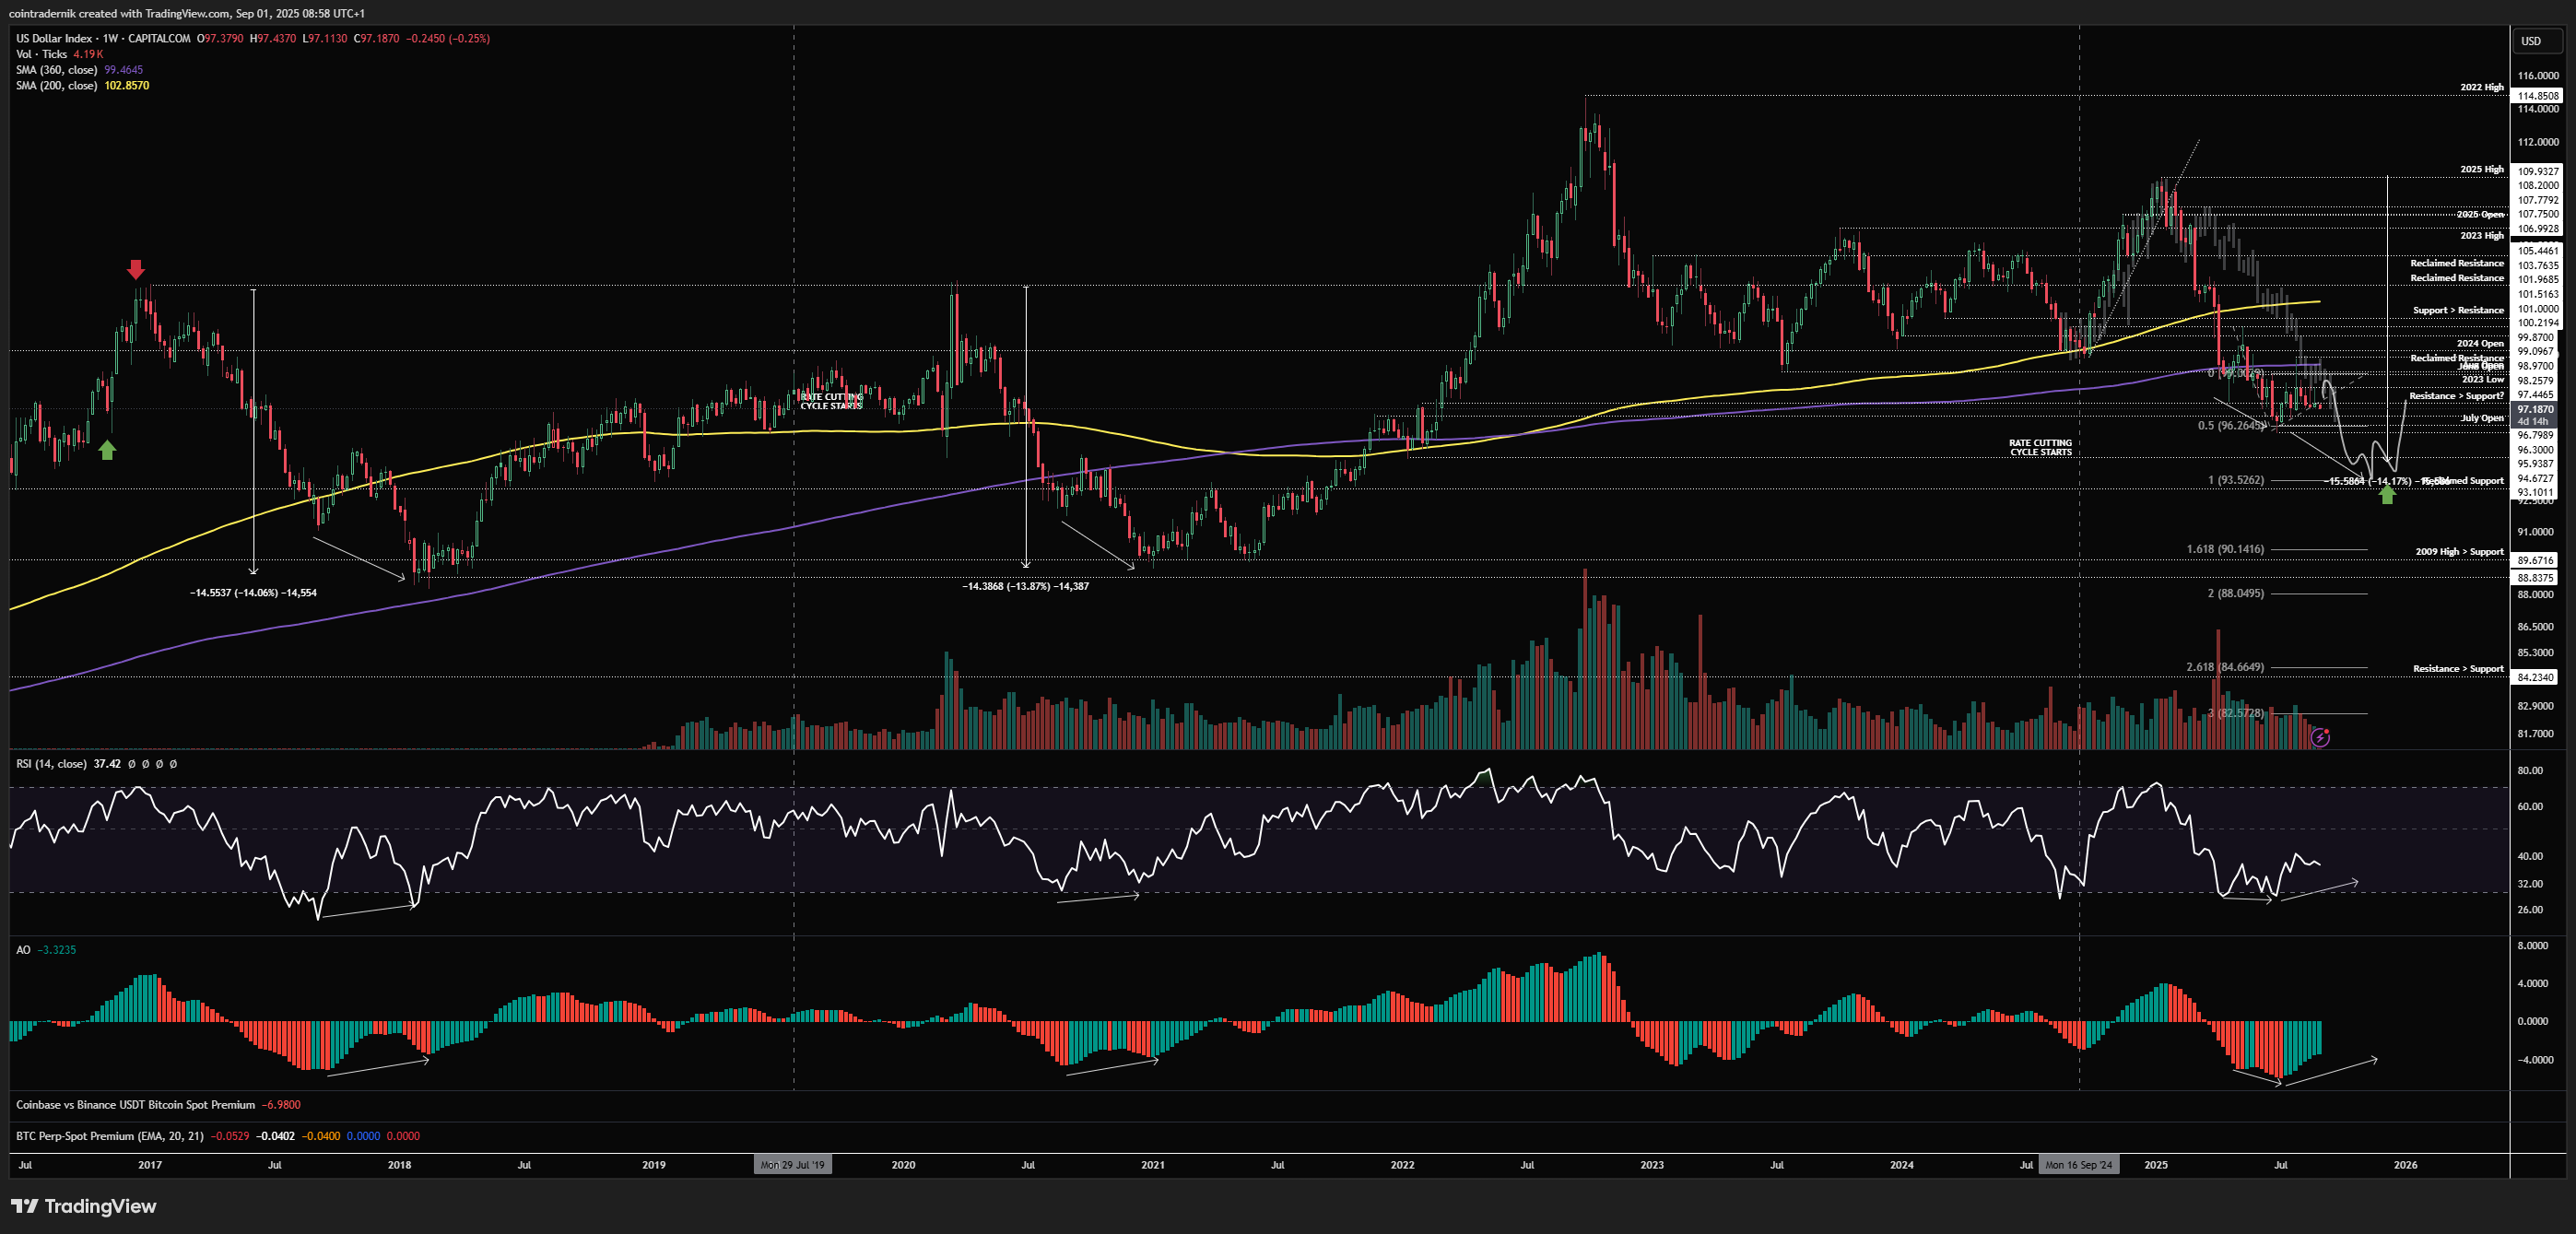
Looking at the weekly, I have left in my rough drawings from last week, where I expect the next leg lower in the Dollar to be the won where momentum exhaustion appears, with that 93 handle also being an equivalent 14% drawdown from the 2025 high as the prior two cyclical retracements. The symmetry in these Dollar cycles is difficult to ignore and should we get a weekly close below 96.8, I think that next leg lower has begun. There are many unanswered questions yet around policy responses post-Powell and Fed independence and the fiscal path etc. that will all shape the 2-year trajectory for DXY, but at least into early next year I expect the Dollar to remain weak. The base case for now also continues to be that the secular bull trend for DXY is intact and we should form a higher-low above 90 but likely closer to 93 and then trend higher from there back towards that 2022 high over the next couple of years, but as I said much remains unclear around that at present.
Daily:
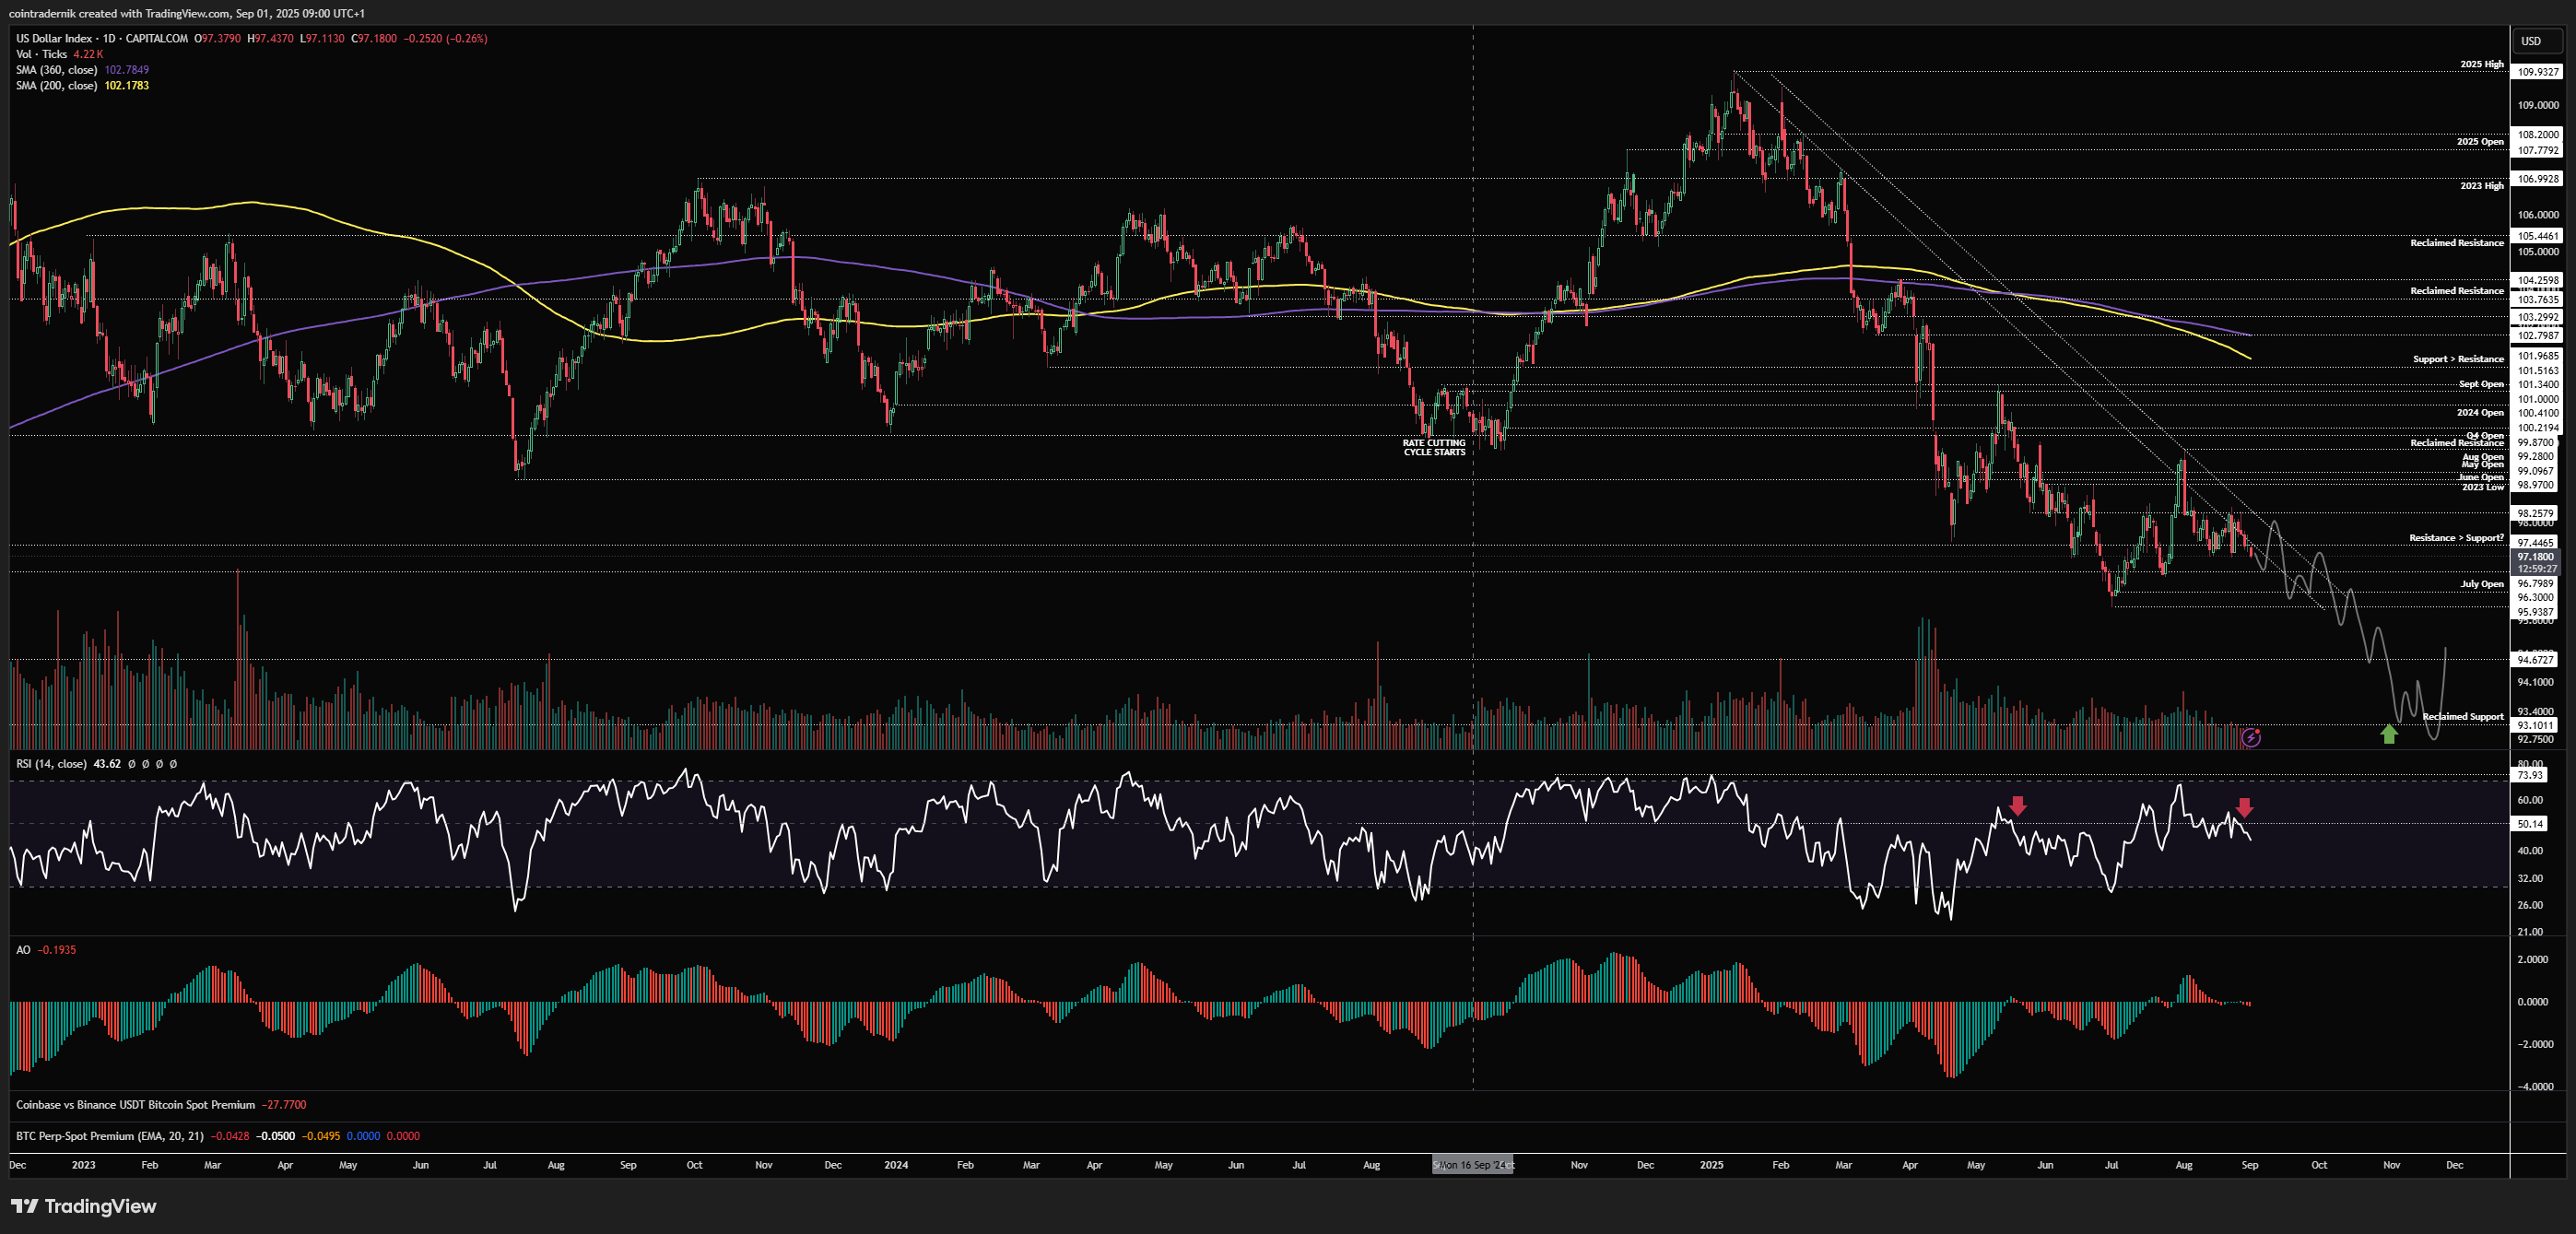
Looking now at the daily, we can see we are struggling below trendline resistance and prior support at 09.3, and unless we accept above that level and both trendlines I think it is very likely that the dollar short squeeze is done, with the momentum breakdown on daily RSI confirming this. If we wick higher this week into that upper trendline, I think that's a fade and we move lower, likely breaking below 96 going into September FOMC and beginning that final leg down. If we get a very hot jobs print and somehow Sept FOMC rate cut expectations move below 50% (though I do think it is now nailed on irrespective of data), we may get one more squeeze higher towards 99 before continuation lower, with invalidation of this broader view on acceptance back inside the multi-year range support at 100.
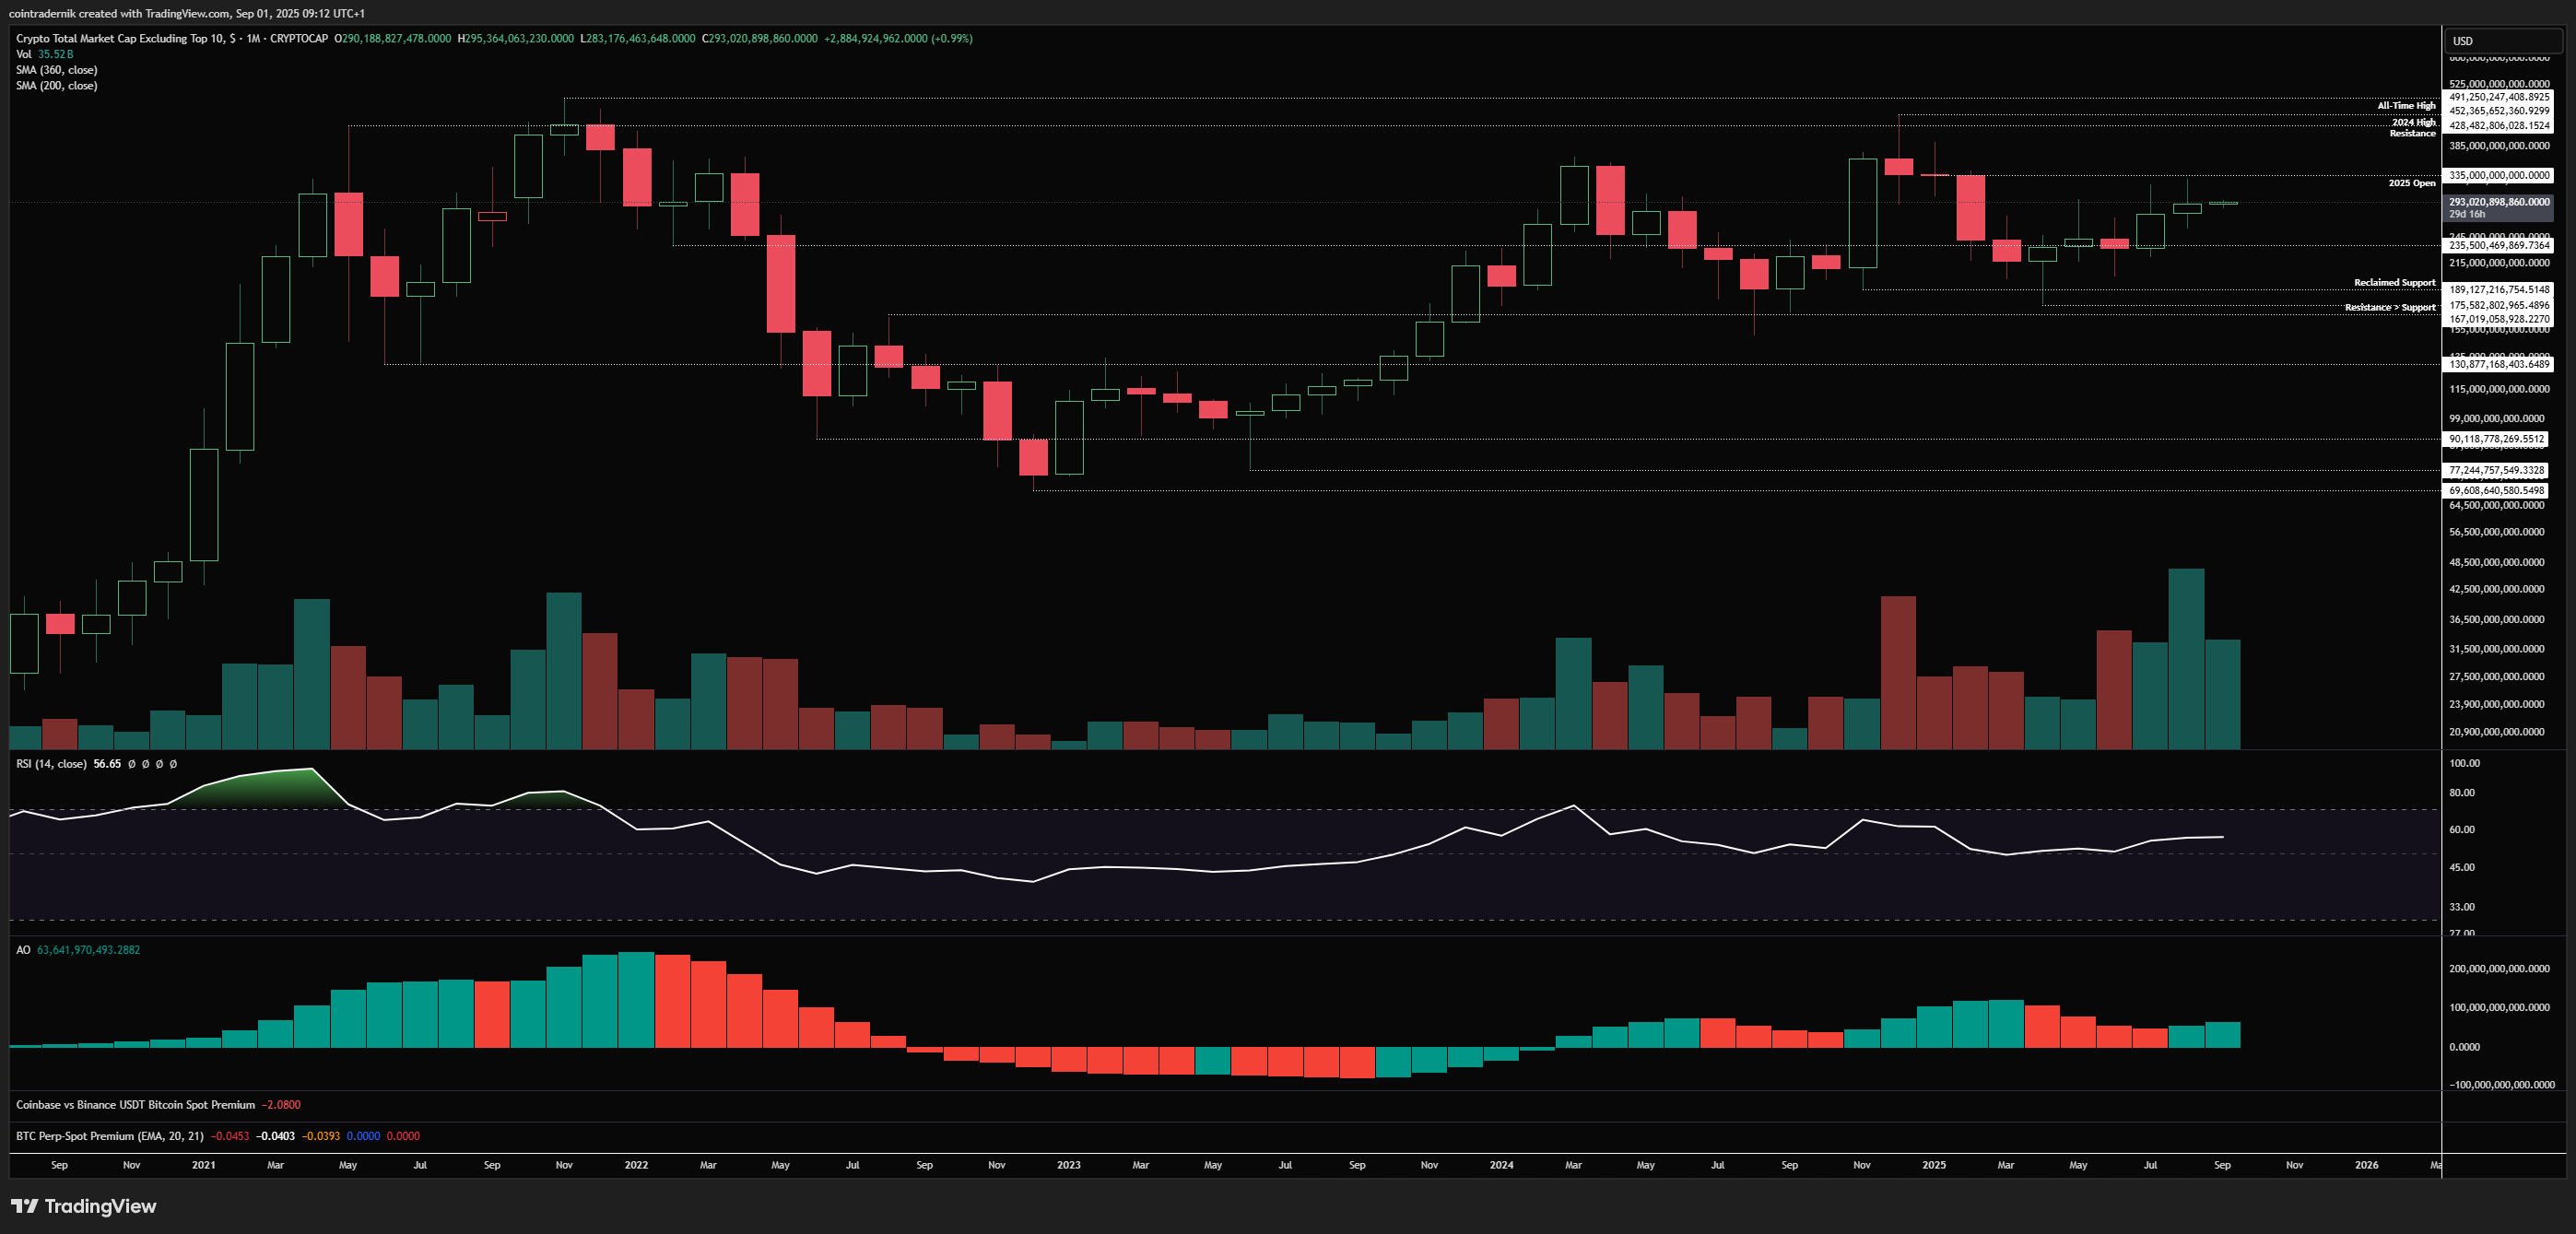
Price: $293bn
OTHERS/USD
Monthly:
Beginning with the monthly timeframe for OTHERS, we can see that alts had a choppy August after a strong July, closing marginally higher than the open after rejecting at the 2025 open at $335bn. We remain in a multi-year uptrend and, as long as OTHERS does not now close below $235bn, I think this looks absolutely fine for continuation higher through the 2025 open towards the multi-year resistance at all-time highs around $490bn. Momentum looks supportive of continuation and as mentioned the monthly structure is bullish, so we should just expect the trend to persist whilst this is the case. Monthly structure would not actually turn bearish unless we turned $167bn into resistance...
Weekly:
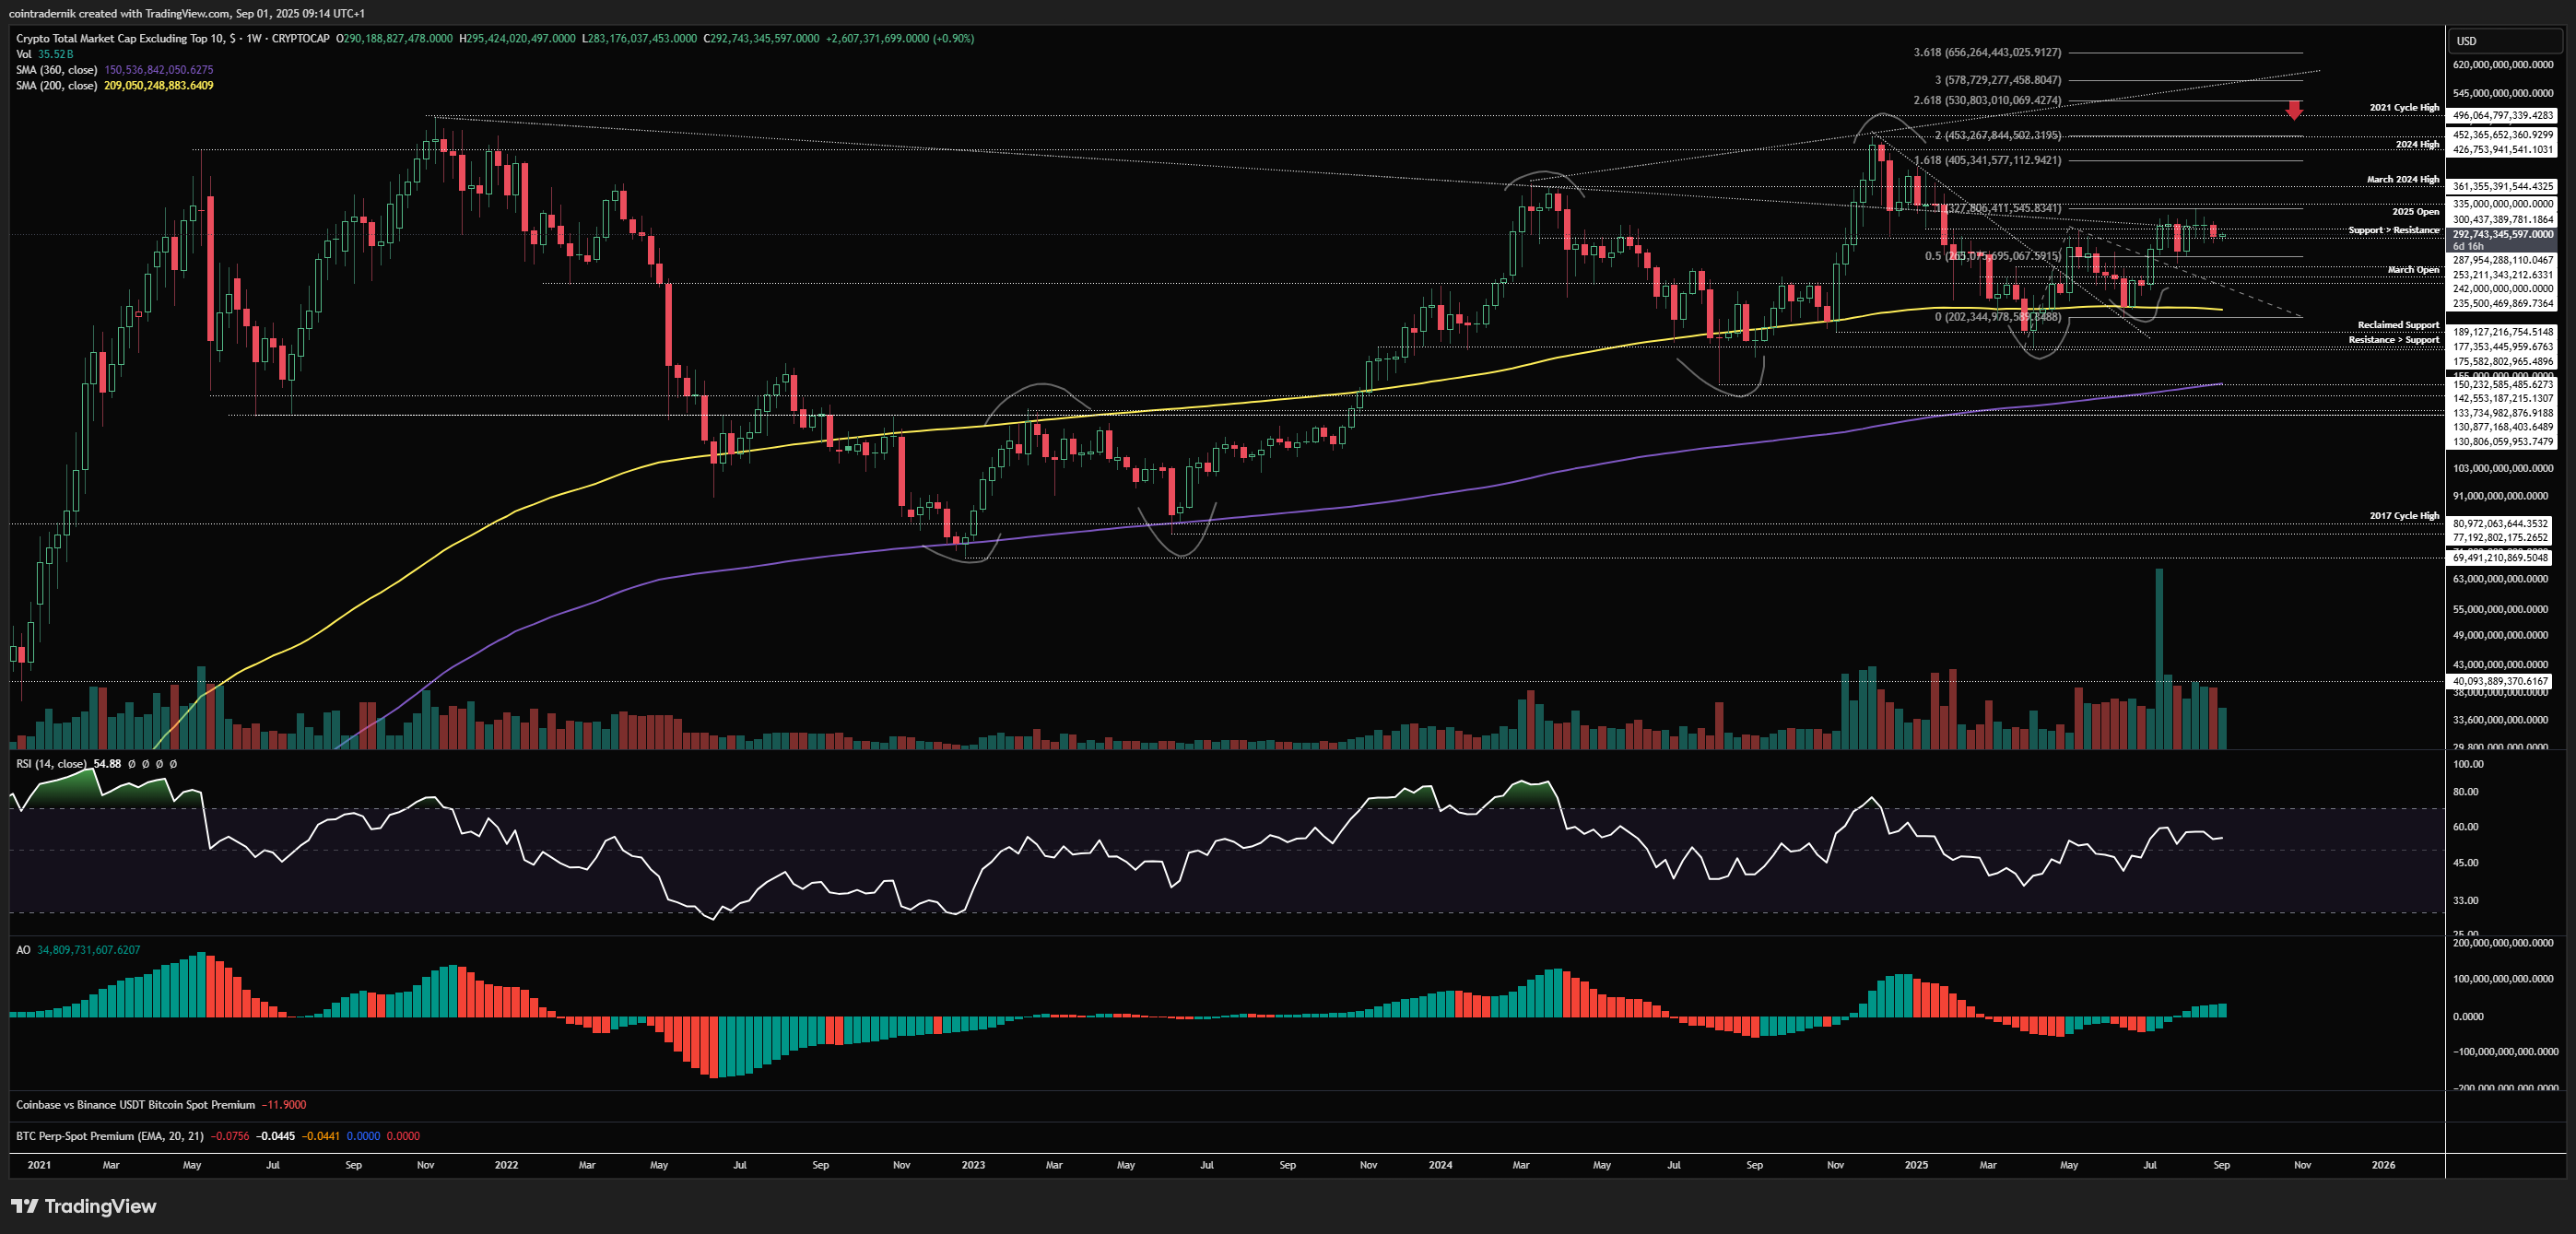
Now, turning to the weekly, we can see that alts have been consolidating above $250bn as support but below that yearly open, with bullish weekly structure. In some sense it is very reminiscent of that 2023 bottoming pattern, where we had the higher-low formation in June 2023 followed by a choppy sideways period before a decisive move higher and an uptrend, where this period since July 2025 is akin to late Q3 2023; only this time the 200wMA is support not resistance. A weekly momentum breakout above recent highs coupled with acceptance above the 2025 open will likely begin that trend higher into the 2021 cycle highs, in my view. Acceptance below $250bn would be more bearish on alts short-term, where we would then need to see another higher-low form above $190bn to keep this weekly structure intact.
Daily:
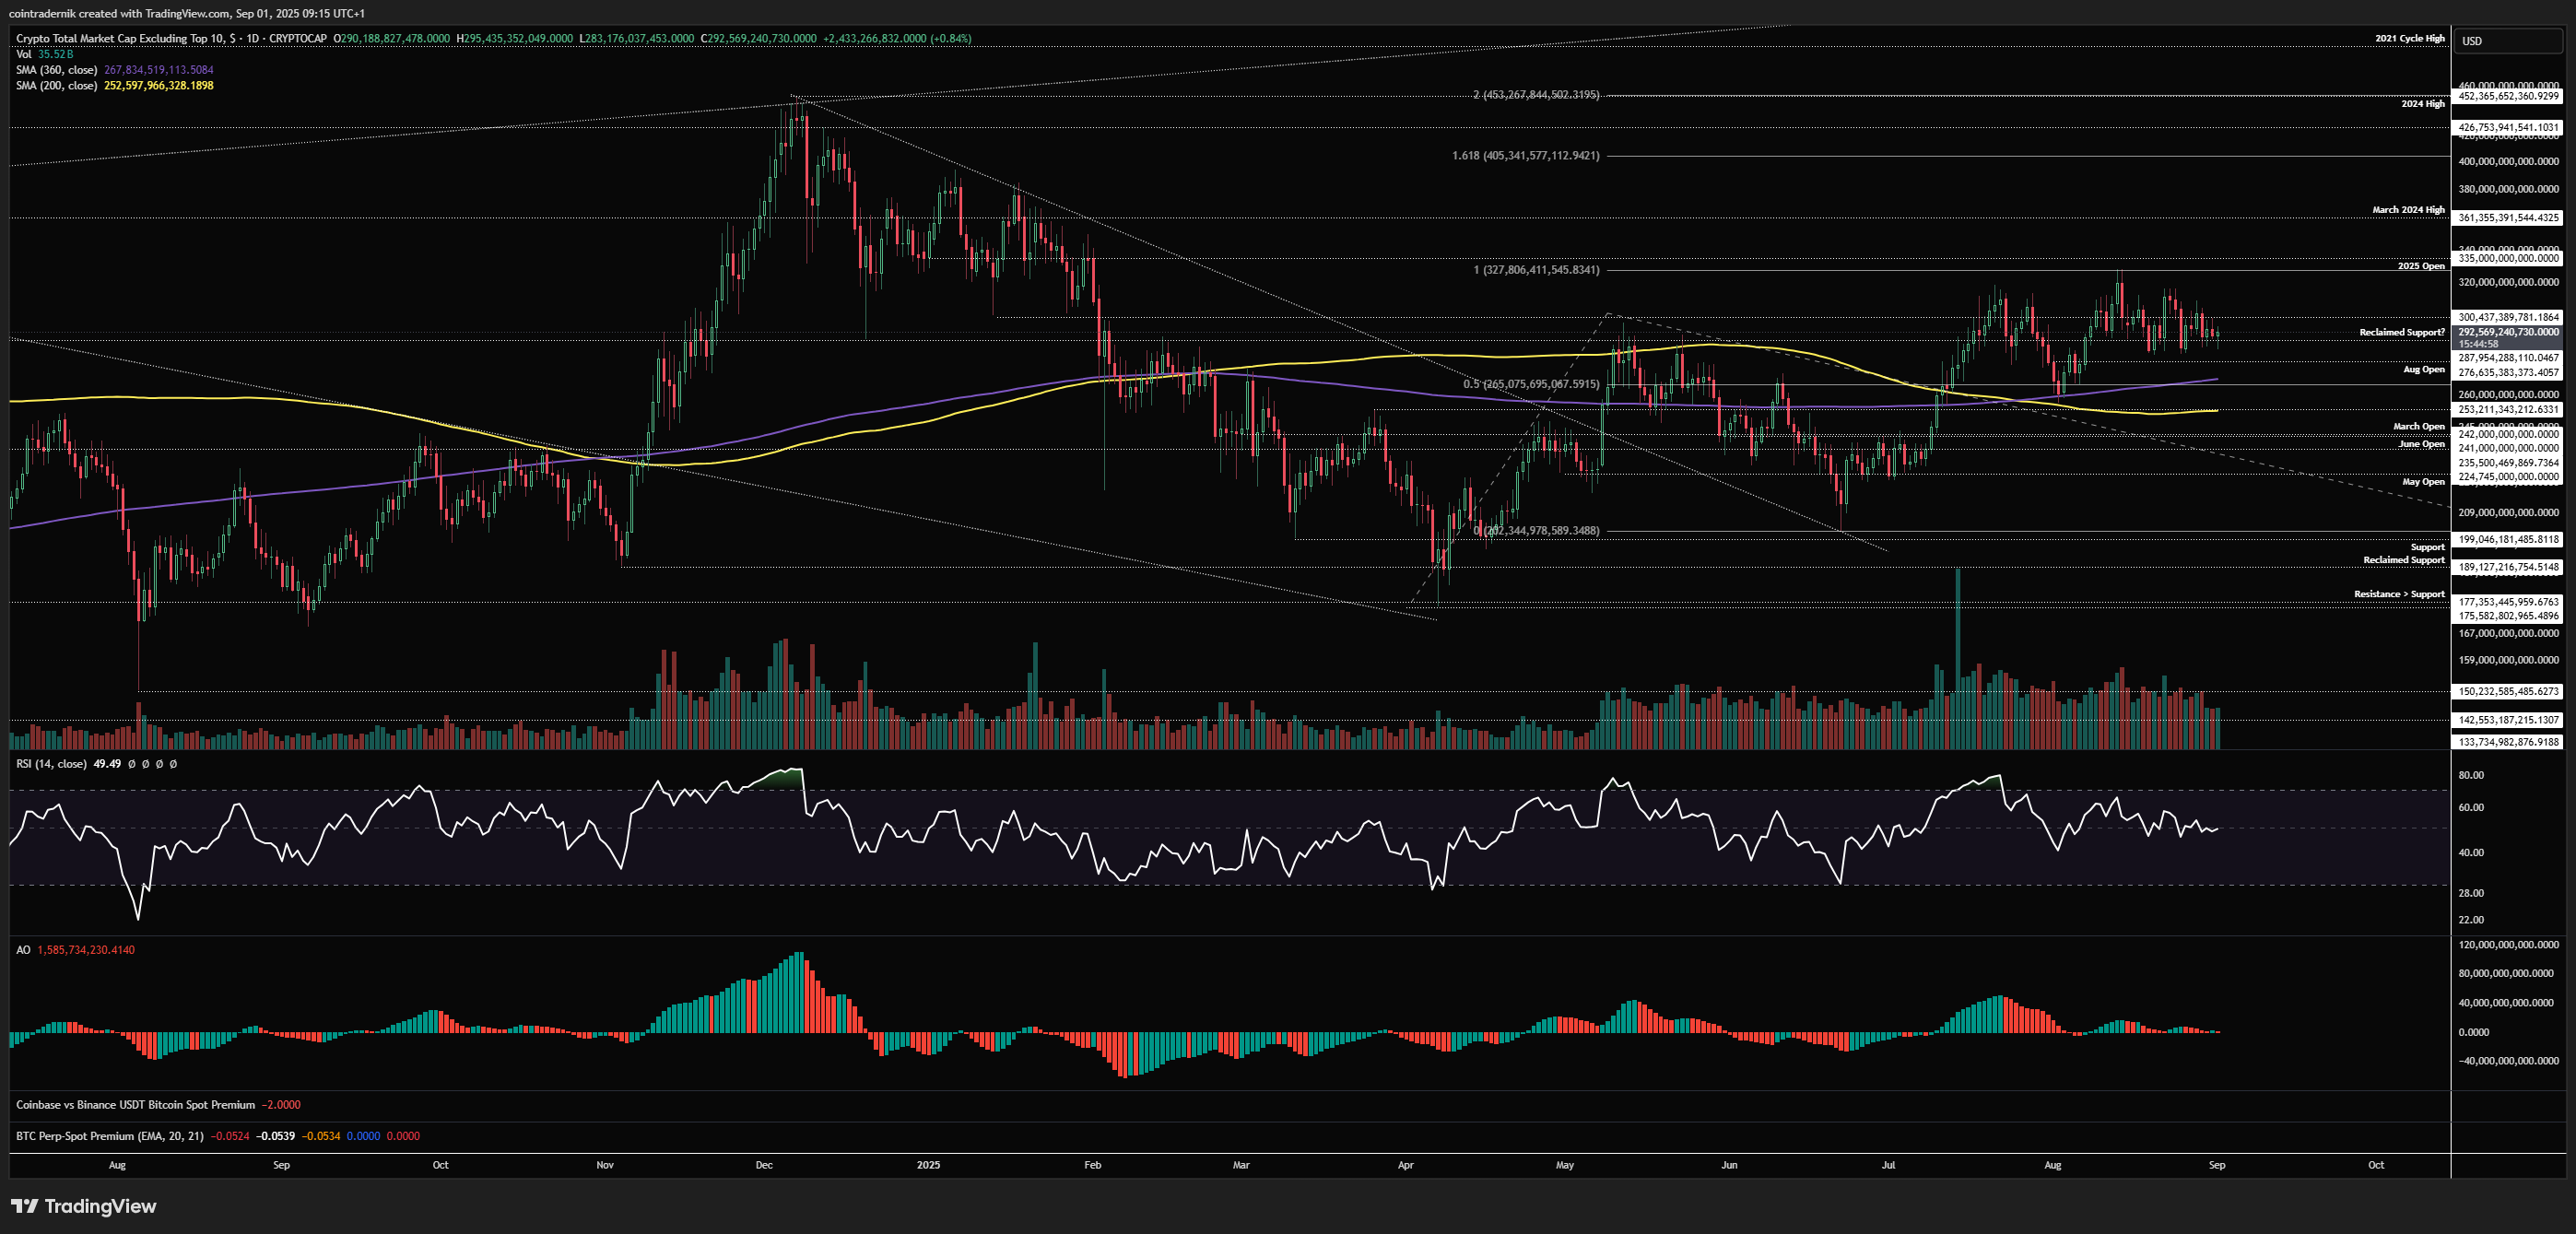
Turning to the daily, we can see just how choppy August was, with zero momentum to either side and price basically just grinding sideways for most of the month. What is very interesting and something I flagged on X was that OTHERS held the August low above $253bn whilst BTC made fresh lows - a divergence that is super rare on this timeframe and was seen previously in September 2021, January 2021 and July 2017. I think it is super important now that alts hold that August low on any weakness in September, where a wick below would be fine but acceptance below would invalidate this divergence and its forward implications. If we can do that, I think alts have a period of strong outperformance ahead where as soon as the 2025 open gets flipped into support we just rip higher towards that 2024 high within a few weeks at $450bn, then likely extending beyond that into the 2021 cycle high at $490bn. That would be where I expect the next local top to form before what I do expect to be a period of price discovery through that $500bn area.
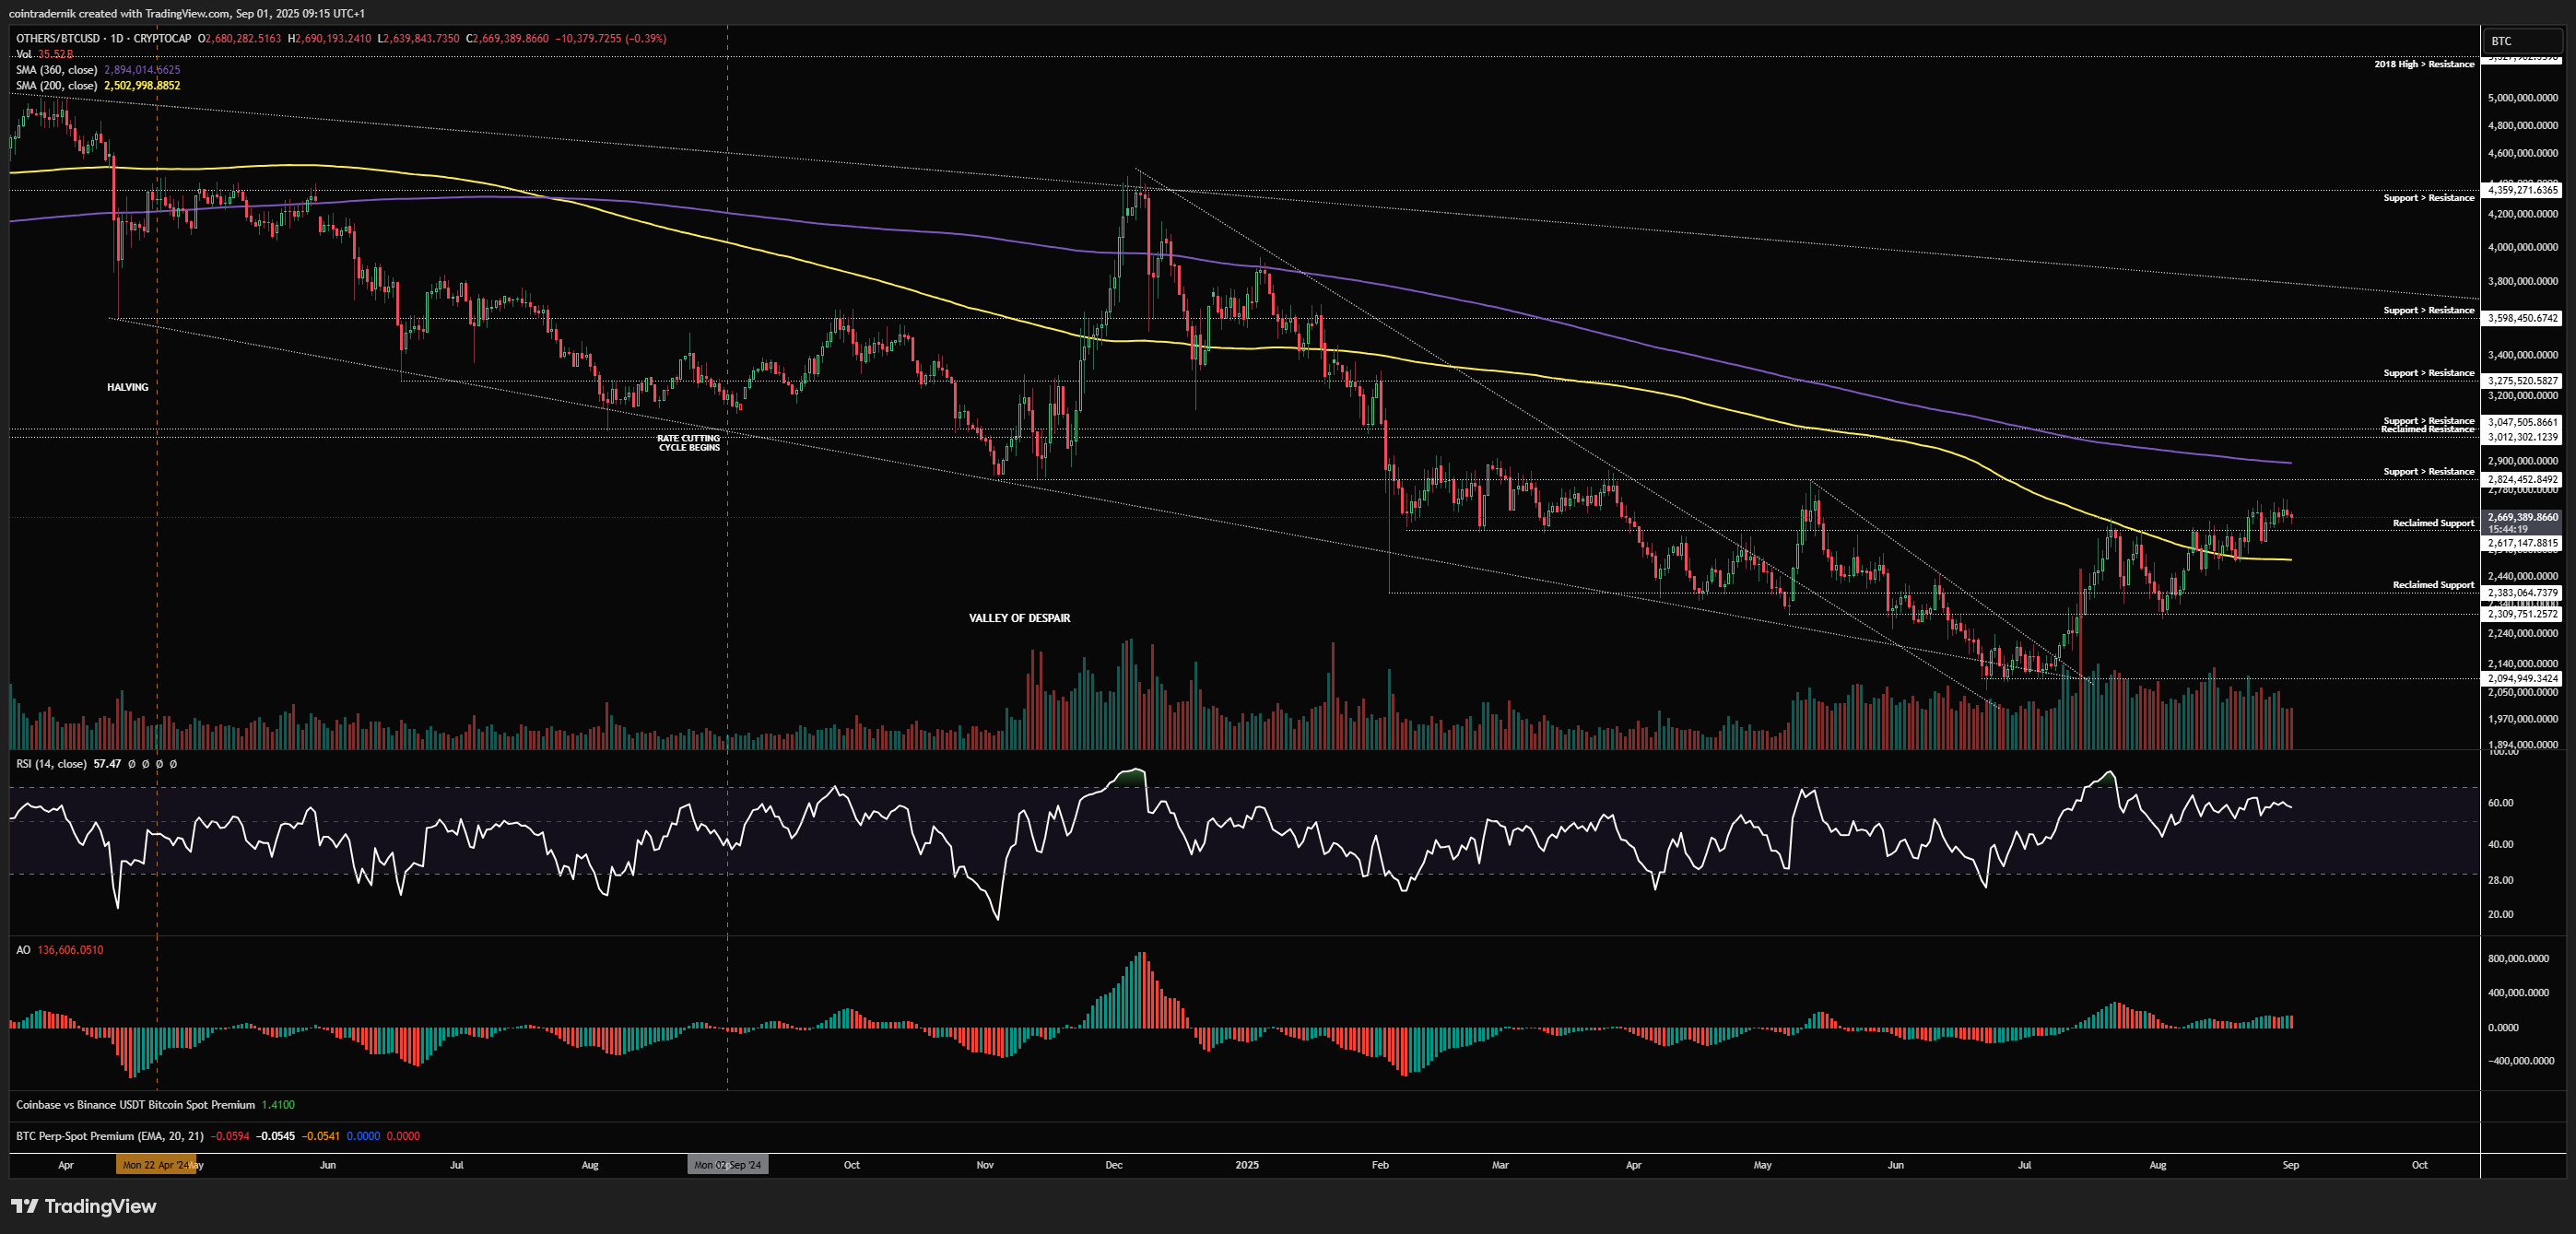
OTHERS/BTC
Monthly:
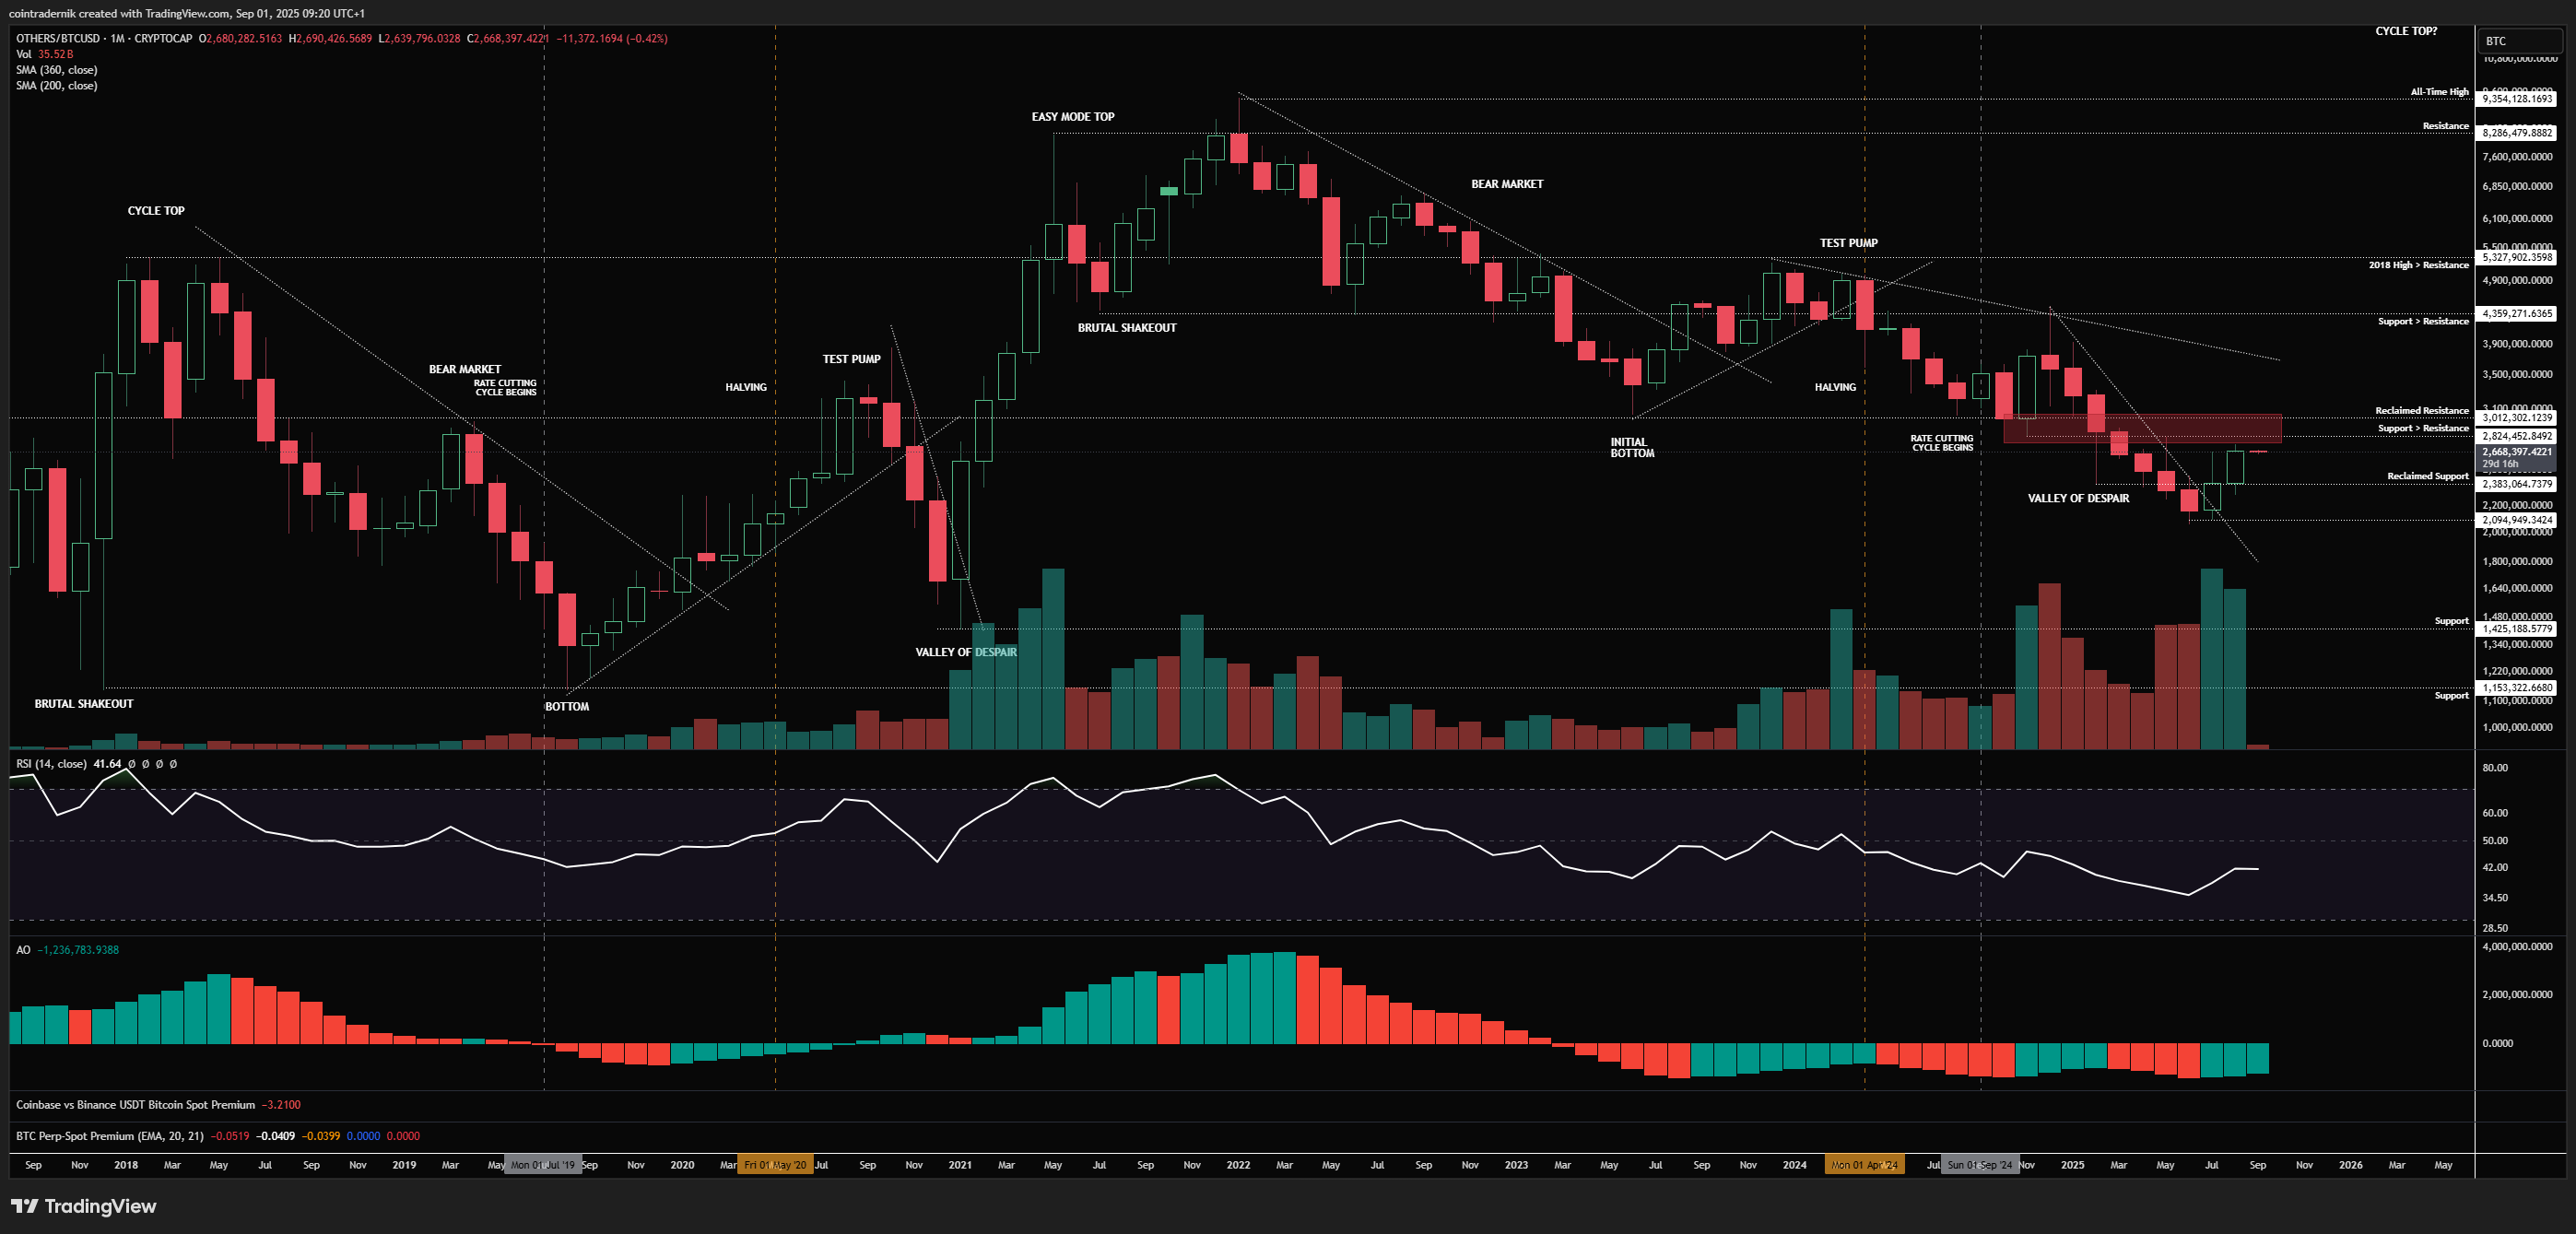
If we begin with the monthly for OTHERS/BTC, August was a strong month for altcoin outperformance, rallying off reclaimed support into the monthly close at 2.68mn BTC, sat below that major pivot at 3mn BTC. We broke out of a near-yearlong downtrend on high volume and I would like to see a breakout and reclaim of the pivot to validate my view that we are on the cusp of a more traditional 'altszn' dynamic where breadth of outperformance expands. A monthly close through 3mnn would be very similar to that Q1 2021 period and December 2017, so this is something to pay super close attention to. The first target if we do see that level reclaimed would be 4.4mn BTC, which is major support turned resistance. If we reject below 3mn BTC and then break lower and lose 2.4mn BTC support, this continues to be a long-term downtrend. Keep an eye on that historical pivot.
Weekly:
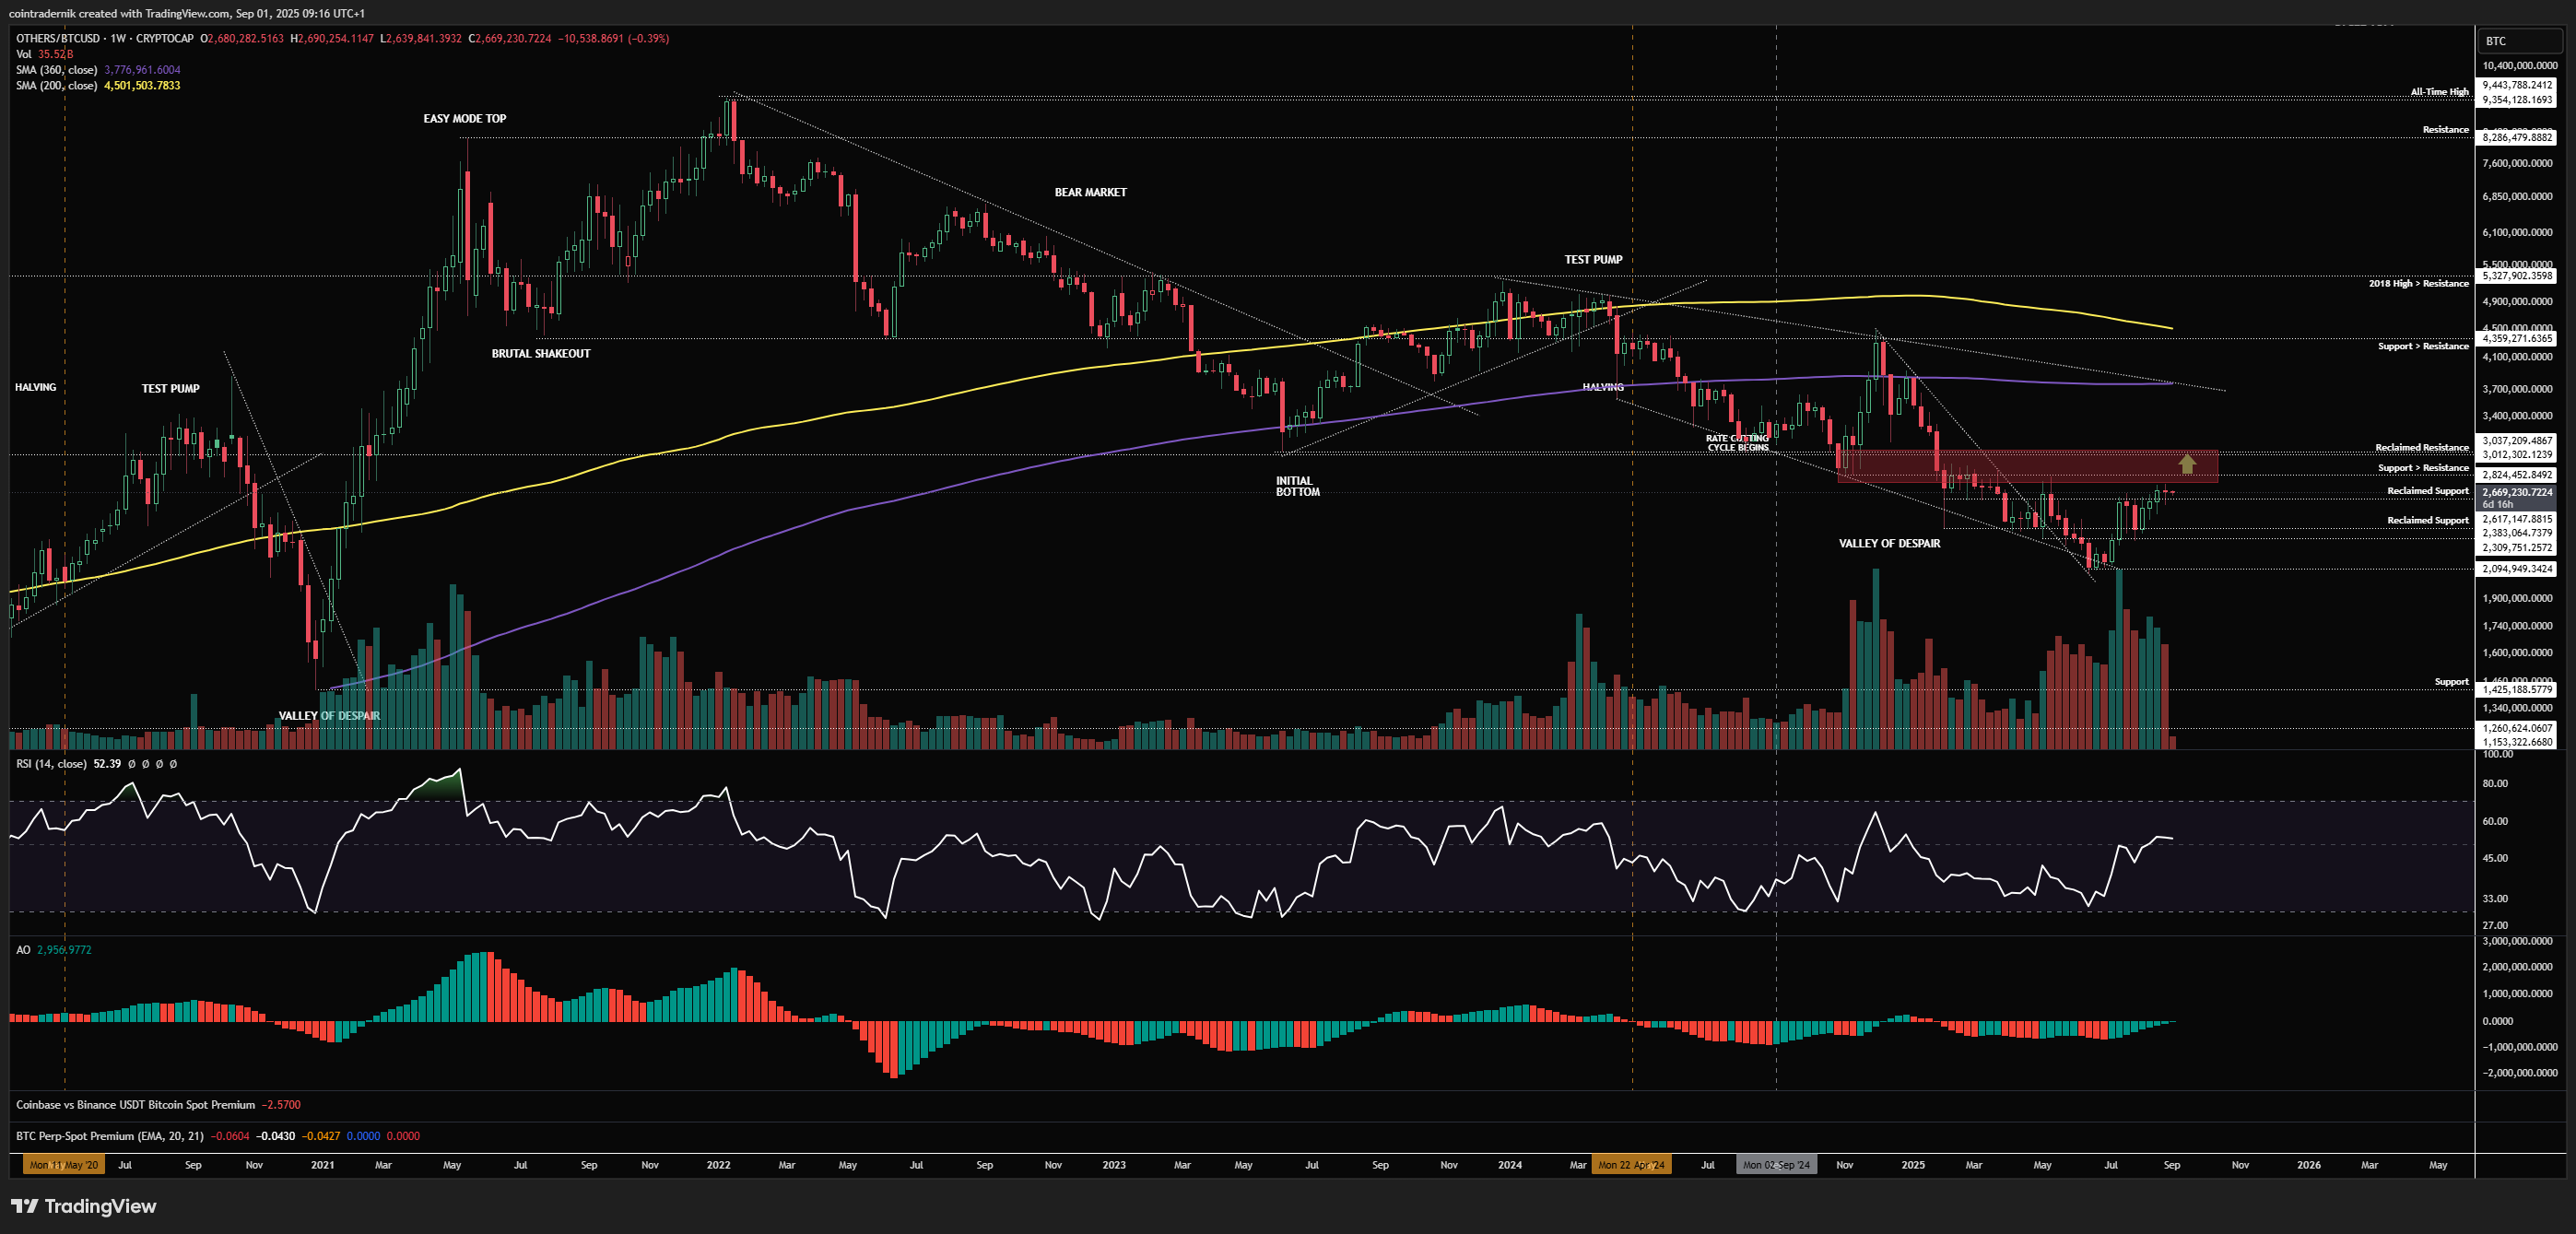
Looking at the weekly, we can see that weekly structure is still bearish because we haven't yet made a higher-high above the swing-high at 2.83mn BTC that preceded the move into the lows at 2.1mn BTC, so a weekly close above this resistance would be promising indeed. Momentum, on the other hand, does appear to have bottomed out and is pointing towards continued strength for alts vs BTC. We should see 2.6mn BTC act as local support here and OTHERS/BTC reclaim the key levels overhead in September if I am correct in my view, with invalidation of this view on a weekly close below 2.3mn BTC...
Daily:
Finally, looking at the daily, we can see that alts continued to grind higher vs BTC despite the sentiment throughout August, reclaiming the 200dMA as support as well as that 2.62mn BTC level that was capping the market. We should now see the 200dMA hold in September and OTHERS/BTC retest the major confluence of resistance between 2.83mn and 3mn BTC, with the 360dMA in between those levels. Overcoming this range is, in my view, what will dictate the mid-term trajectory for alts; flip 3mmn BTC into support and I think we get multiple weeks of sharp outperformance with breadth improving; wick into that area, reject and break down and it's looking much worse. Let's see how these next couple of weeks shape up...
I hope you've found some value in the read this week!
And if you've not already signed up for Ostium, please do so and test out some of the recent updates, including:
Sign up here (you don't have to use my ref link, of course): https://ostium.app/trade?from=CL&to=USD&ref=CTNIK

.avif)